 Alice Paver
 David Wright
 Natalie Braber
 Nikolas Pautz
- 1Phonetics Laboratory, University of Cambridge, Cambridge, United Kingdom
- 2School of Arts and Humanities, Nottingham Trent University, Nottingham, United Kingdom
- 3Department of Psychology, Nottingham Trent University, Nottingham, United Kingdom
This paper reports the findings from a multidisciplinary and cross-institutional Economic and Social Research Council (ESRC) funded project called ‘Improving Voice Identification Procedures’ (IVIP). People harbour stereotypes about particular accents, and those judgements may be brought with them into the legal domain. Considering the potential consequences of accent judgements by witnesses and jurors, this study examines the relationship between ratings for characteristics and the likelihood of acting in certain criminal and non-criminal ways. 180 participants completed an accent judgement task, rating 10 regionally-accented British voices on a range of traits and behaviours using a wider variety of accents, behaviours and criminal offences than previous research. Results indicate that evaluations of perceived characteristics based on accent translate into evaluations of likely behaviours. Non-standard UK regional accents are generally perceived more negatively than a standard one, but not universally; non-English accents elicited more positive trait and behaviour ratings than English accents. Furthermore, although accents evaluated as low-status were generally more likely to behave criminally according to listeners, this varied according to the type of crime. The discussion explores the forensic implications of the relationships between perceived status and criminality, as well as discussing the significance of perceptions of perpetrators of sexual offences when compared to other offence types. We emphasise the need for nuanced understanding of how accents are evaluated when it comes to different crime types.
1 Introduction
1.1 Background
It is well documented that accent signals aspects of a speaker’s social identity, containing clues to their geographical, social and ethnic background (Hanani et al., 2013; Heblich et al., 2015). Language attitudes studies have established that listeners use linguistic cues from a speaker’s accent to attribute stereotypical traits to speakers based on their accent, implying that there is a relationship between speech forms and social meanings which are structured into people’s everyday understanding – a relationship referred to by Coupland and Bishop (2007), p. 74 as ‘sociolinguistic indexicalities’. Dovidio and Gaertner (1993) write that this indexicalisation means that individuals are seen as group members, and are attributed characteristics based on such membership(s) (see Eckert, 2019 on the social indexicality of linguistic variables).
Listener attitudes toward certain accents, and hence speakers of those accents, are observed in studies where participants are asked to evaluate speakers with a degree of favour or disfavour (see Llamas and Watt, 2014). Such studies have traditionally compared participants’ evaluation of accents in relation to perceived levels of ‘status’ or ‘prestige’ and ‘solidarity’ or ‘social attractiveness’, responding to both conceptual stimuli (e.g., accent labels) and vocal stimuli (i.e., voice recordings) (Giles, 1970; Bishop et al., 2005; Coupland and Bishop, 2007; Watson and Clark, 2015; Sharma et al., 2022). Research into judgements of accents in the United Kingdom – the context for the current study – has typically found that ‘standard’ varieties, such as Received Pronunciation (RP) or Standard Southern British English (SSBE), tend to be associated with higher socio-economic groups, and speakers who use these varieties are generally attributed a higher status than speakers with regionally marked accents. Correspondingly, although some ‘non-standard’ varieties have negative associations with status attributes, they tend to be perceived more favourably in terms of solidarity and social attractiveness (see Dragojevic, 2018; Dragojevic et al., 2021). Sharma et al.’s (2022) recent study of attitudes toward British accents reveals the stability and consistency of listener evaluations over 50 years of such studies, and the authors interpret such long-standing accent judgements as representing ‘a fixed hierarchy of accent prestige’ which reflects ‘half a century of social recognition of each accent’s place in British society, rather than as identical personal tastes’ (Sharma et al., 2022, p. 160). All speakers have accents (Derwing and Munro, 2008) and there is nothing linguistically inherent to particular varieties that make them ‘better’ or ‘more correct’ than others (Gluszek and Dovidio, 2010). Rather, accent judgements are symptomatic, and indicative of social attitudes held toward the geographical area or social group indexicalized by the variety spoken (see Lambert et al., 1960; Cole, 2021).
People carry with them their implicit stereotyped judgements about speakers, which manifests in individuals being discriminated against on the basis of their accent in various walks of life (Levon et al., 2021; McKenzie and McNeill, 2022). Of particular interest in this study are situations in which accent judgements are made in forensic and legal contexts. Rickford and King (2016), for example, provide a detailed account of how the crucial testimony of Rachel Jeantel, a major prosecution witnesses in the George Zimmerman trial and an African American Vernacular English (AAVE) speaker, ‘was disregarded because of […] social biases against AAVE speakers’ (Rickford and King, 2016, p. 980). There is an extensive literature which focuses on the intersection between race and language, for example Lippi-Green (1997) and Rosa and Flores (2017); the present study does not engage with this particular aspect, but we acknowledge that, as well as featuring more overtly in discrimination in legal contexts, race may often play a role in linguistic discrimination, as this particular case demonstrates. Mock jury research has demonstrated that participants perceive the evidence given by speakers with regionally accented speech less favourably in terms of credibility, accuracy and deceptiveness than that read by speakers of more ‘standard’ varieties (Frumkin, 2007; Frumkin and Stone, 2020; Frumkin and Thompson, 2020). Similar is the case for defendants in mock jury research; defendants with regionally and/or stereotypically accented speech are perceived more negatively by participants than defendants who give the exact same testimony but with a more prestigious accent (Cantone et al., 2019; Kurinec and Weaver, 2019; Romero-Rivas et al., 2022).
Research supports the idea that ‘some accents sound guiltier than others’ (Dixon et al., 2002, p. 166) and that, in a forensic context, prejudice toward non-standard accented speakers and stereotyped trait judgements influences listeners’ opinions on how likely speakers are to behave in certain ways and commit certain criminal offence. It is important to stress that accents themselves are not indexed with particular attributes or qualities, but it is the group membership that the accents index, with reference to the stereotypes listeners hold about those groups, that people respond to. Dixon and Mahoney (2004) found that a suspect with a Birmingham accent was rated as more ‘typically criminal’ and more likely to be reaccused of a crime than a suspect with an RP accent. The theoretical mechanisms underlying these ratings, the authors explain, are unclear, but could indicate that accent may be ‘acting simply as a marker of wider structural or ethnic identities and thus as a cue for applying stereotypes’ (Dixon and Mahoney, 2004, p. 71). This position is shared by Wood (2019), p. 190 who argues that language is a ‘vehicle’ used to discriminate against people based on other aspects of their identities. It has also been found that speakers with certain accents are judged as more likely to commit certain types of crimes, with speakers of more prestigious accents being more likely to commit ‘white-collar’ crimes such as embezzlement, while lower-status speakers being more likely to commit ‘blue-collar’ crimes such as violence against a person or property (Seggie, 1983). Meanwhile, non-standard accents have been found to be perceived as sounding more threatening than their standard counterparts (Tompkinson, 2023, p. 42). Tompkinson (2015) compared listener judgements of RP, London Cockney and Northern Irish accents in terms of how ‘threatening’ they were thought to be across a range of contexts and conditions. Whereas the London accent was evaluated as more threatening in ‘indirect’ threats (e.g., are you sure you want to do that?), the Northern Irish accent was considered more threatening in ‘direct’ threats, namely the threat of physical harm, and RP was perceived as more threatening in a bomb threat. These results show that judgements related to criminality or guilt are not monolithic but are subject to influence from other contextual features. Dixon et al. (2002) asked participants to rate speakers with a Birmingham accent and RP for Superiority, Attractiveness and Dynamism using the Speech Evaluation Instrument (Zahn and Hopper, 1985) and for guilt in relation to one of two crimes (armed robbery and check fraud). Their results found that the Birmingham-accented speaker was rated more negatively than RP speaker and more guilty, particularly of the blue-collar offence of armed robbery. Moreover, they reported that general ratings of speakers in terms of Superiority and Attractiveness predicted ratings of guilt. Similar results were produced more recently by Axer (2019), whose listeners rated a Welsh-accented speaker as more guilty of committing date rape than Birmingham, ‘Northern English’ and Scottish-accented speakers. The study also observed a relationship between stereotyped traits and perceived criminality in the context of suspect interrogation; non-standard accented speakers in the study were rated more socially attractive but less competent than their standard-accented counterparts, and more likely to be guilty. How likely it is that someone may have committed a crime, in particular crimes stratified by class, is clearly mediated by stereotypes projected onto that person on the basis of their accent. It remains to be seen how far these findings can be generalised to a greater variety of accents and crimes; this inspired the motivation for the present study, the aims of which are now discussed.
1.2 Research aims and hypotheses
This study forms part of a larger project ‘Improving Voice Identification Procedures’ (IVIP), a multidisciplinary and cross-institutional Economic and Social Research Council (ESRC) funded project aiming to improve the understanding of earwitness decision making in voice identification. In particular, the strand of the project from which this study originated explores the impact of voice stereotypes on lay-listener behaviour in the forensic voice identification context. It aimed to investigate how listener prejudices may influence how they make decisions about voices heard in the context of a voice identification parade, to validate the necessity of conducting pre-tests to screen for bias against foil or suspect voices.
Based on this evidence from existing research, the current study tests three hypotheses:
Hypothesis 1: The regionally accented speakers in our experiments will be rated higher in terms of solidarity traits but lower in status traits than the ‘standard’ accent (in this case Southern Standard British English).
Hypothesis 2: The regionally accented speakers in our experiments will be judged as more likely to behave in morally bad ways, including committing criminal offence.
Hypothesis 3: There will be a correlation between trait ratings and behaviour judgements, such that more negative trait judgements will be associated with greater criminality.
It aims to test these hypotheses in a novel manner by extending some previously observed trends regarding regional accents, stereotyped traits, and likelihood of enacting criminal behaviours, and testing them with a wide range of accents and behaviour types.
2 Materials and methods
2.1 Stimuli
Ten speakers of geographically diverse British English accents were chosen as the stimuli for the experiment: Belfast,1 Birmingham1, Bradford,2 Bristol1, Cardiff1, Glasgow,3 Liverpool1, London,4 Newcastle5 and Standard Southern British English (SSBE).6 Recordings used for the stimuli were sourced, with appropriate permissions, from existing corpora of spontaneous speech recordings, namely interviews or conversations with participants (see footnotes for details on specific corpora). Each speaker was male with the London speaker the oldest at 45, and the other speakers were sourced from corpora where speaker ages ranged between 18 and 25 (individual ages were not available for all speakers). All were White, except for the Bradford speaker for whom racial/ethnic identity was not collected. Voices were evaluated by phoneticians also working on the broader IVIP project, to determine that they were suitable candidates to represent their regional accent. Due to a limit on available high-quality voice recordings for appropriate accents in a spontaneous speech style, as well as concerns about minimizing the duration of the experiment, only one speaker per accent was used. The limitations of the stimuli are addressed in the section 4.4 of this paper.
One of the key study aims was to make our results valid in the particular context of collecting earwitness evidence in the form of voice identification parades. We therefore created voice samples in a manner similar to the ways voice parade samples are constructed (Smith et al., 2020, p. 5). For each voice, a 30 second sample was created by collaging sections from a longer recording of spontaneous speech, interspersed with 1 second of silence between each section. The order of sections was also scrambled to avoid a continuous narrative. An example of collated segments includes: ‘but I couldn’t do that because … other people may know bits and bobs you don’t … so, going to somewhere’. Samples were created in this way to mimic as closely as possible the experience of a potential lay-listener in the legal system, e.g., as a juror or earwitness, who would hear natural spontaneous speech rather than a set read text. As a result, stimuli were non-identical in content; to compensate for potential differences in perception arising due to the content of speech, sections were chosen to be as innocuous in content as possible without any place names, personal names, or other personally identifying information. Participants were also instructed to ignore the content of the utterances and instead focus on the sound of the speaker’s voice.
All the samples were normalised for intensity to 70 dB in Praat (Boersma and Weenink, 2022) using the built-in ‘Scale intensity’ function. Samples were also normalised for articulation rate (AR in phonetic syllables per second) and fundamental frequency (f0 in Hz, which is perceptually correlated with pitch) to try and ensure that participants’ judgements were based on regional accent and not these other salient properties of speech.
Articulation rate was measured for all samples by removing sections of silence and manually counting the number of syllables in each utterance, then dividing that number by the length of the sample with silence removed. Syllable counts were determined by the actual number of syllables uttered, rather than the ‘canonical’ or phonological number of syllables in each word. Any samples that fell significantly outside the average range between 4.4 and 5.9 syllables per second, according to Goldman-Eisler (1968), were then altered in Audacity recording and editing software (Audacity Team, 2021); this was the case only for the Bristol sample (as shown in Table 1). This process was facilitated by the built in ‘Change Tempo’ toolkit, which alters speed without changing f0, effecting the minimum amount of change to each stimulus that brought the AR to within the normal range.
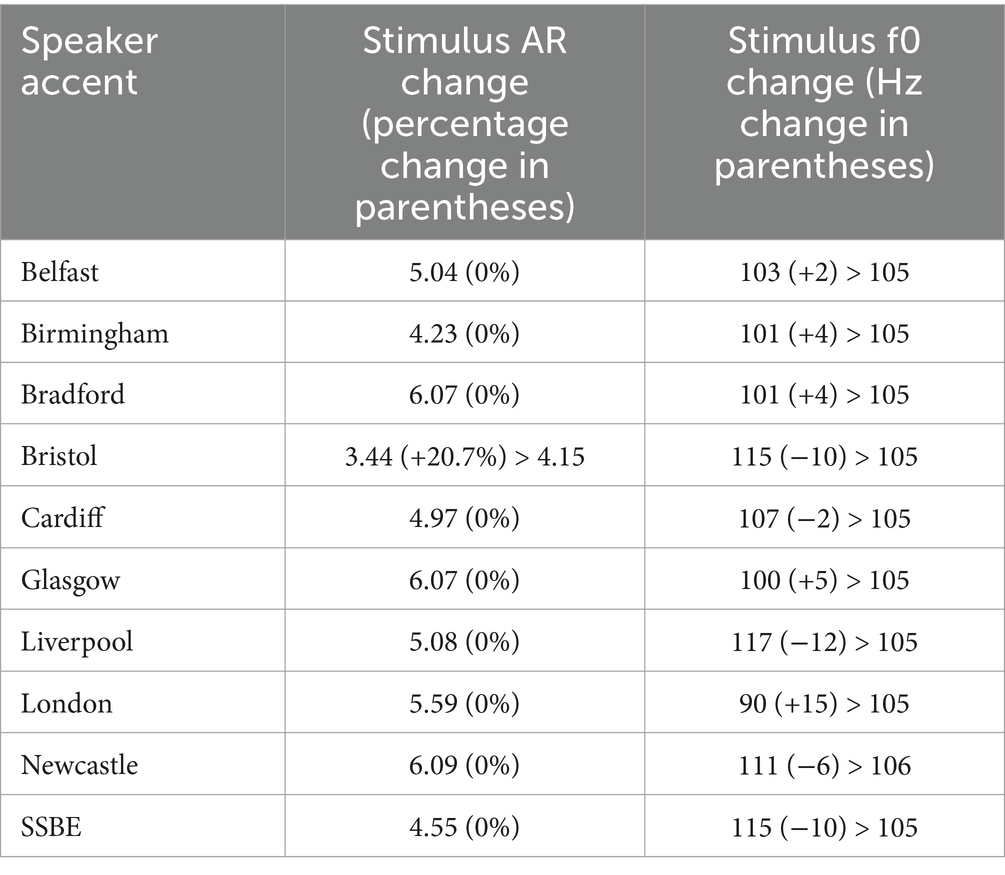
Table 1. Original f0 and AR measurements for speakers used as stimuli in the experiment.
To manipulate the f0 for all samples, we first manually checked and corrected the pitch trace in Praat using the Manipulation tool, with settings of minimum 75 Hz and maximum 200 Hz, except for the London speaker where the minimum was 50 Hz. Pitch measurements were automatically extracted from these corrected files using a Praat script (Harrison, 2007). Using the median value, each sample was then adjusted using the Manipulation tool to shift the frequencies so that the median f0 was 105 Hz (as shown in Table 1), as per the median value for speakers of SSBE (Hudson et al., 2007).
2.2 Participants
Participants were recruited and paid online using Prolific.7 Recruitment was completed in two batches; in 2021, 100 participants were recruited, and then in 2022 a further 80 were recruited (total 180 participants: 86 Men, 92 Women, 1 Non-binary/Gender-fluid, 1 undisclosed). All were first-language English speakers who had spent most of their life in the United Kingdom. They were aged between 18 and 67 (mean age of 37) and self-reported their ethnicity/race; 82% were White, 6% Asian, 5% Black and 4% mixed (2% other, 1% preferred not to say). For the purposes of analysis, participants were categorised into age groups of younger (18–30), middle-aged (31–50) and older (51–70). Although some listeners did fall into this older age range, they self-reported no hearing difficulties, and the statistical models did not indicate a meaningful effect of age on listener ratings. All areas of the United Kingdom that were represented by the geographical dialects included in the study were also represented by participants. Southeast England, London and the West Midlands were best represented, with 21, 13 and 12% participants, respectively, having spent most of their lives there.
2.3 Experimental design
An accent rating task was built and hosted on Gorilla.sc (Anwyl-Irvine et al., 2019) in which participants were asked to listen to each of the 10 voices and to rate how strongly they agreed with 10 statements about the voices using a 7-point Likert scale (1 = ‘Strongly disagree’, 7 = ‘Strongly agree’). They were asked to focus on the sound of the voice and try to ignore the content of the speech. The accents were not labelled or described in any way for the participants. Participants were randomly and evenly assigned to one of two conditions.
Condition 1 (Traits, n = 90) asked participants to rate the voices in relation to 10 social traits (shown in Table 2) chosen based on the existing literature, primarily the Defendant Vocal Characteristics Scale (Cantone et al., 2019) and the Speech Evaluation Instrument (Zahn and Hopper, 1985). Condition 2 (Behaviours) asked the participants to rate the same voices using the same Likert scale in relation to 10 behaviours. The choice of behaviours, shown in Table 2, was motivated by wanting to find ratings for a range of behaviours that could be considered to represent points across the scale of morally ‘good’, ‘bad’ or ‘ambiguous’ behaviours. The five criminal behaviours were chosen to investigate ratings for a greater range of offence types than the binary of white- or blue-collar crime as in previous research, which have been shown to have associations with standard and non-standard accents, respectively (e.g., Seggie, 1983; Dixon et al., 2002). For example, we hypothesized that dangerous driving and sexual assault might have less of an association with perceptions of social class than has previously been seen with crimes such as vandalism. We also included non-criminal moral behaviours as per Nolan and Grabe (1996) to explore the links between listener perceptions of morality, criminality, and social traits.
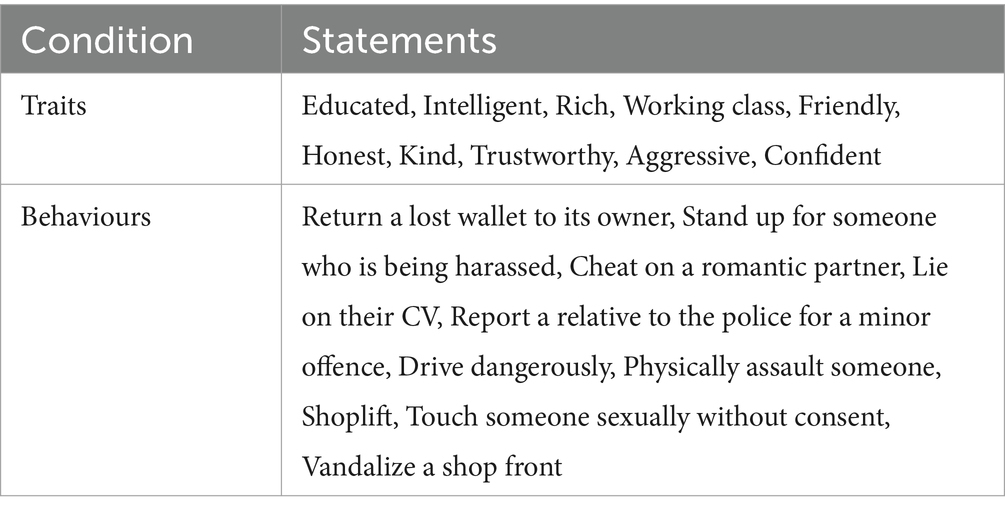
Table 2. Social traits and behaviours on which participants were asked to rate each voice.
Participants had to pass a headphone screening test (Woods et al., 2017) to ensure they could hear the recordings well and were asked to complete the experiment in a quiet room with no distractions. They were allowed to take this test once more if they did not pass it the first time. Participants completed a pre-test demo to familiarize them with the format of the questions. The order of the voices, and the 10 statements on the screen, were both randomized. Each voice was automatically played twice with a 2 second period of silence between plays, and participants were forced to respond to all statements before advancing to the next screen. Listeners were asked to give an immediate reaction and not to overthink their responses.
There were additional data collected but not discussed here which could form a basis for future research. This includes the information we gathered after the main task was finished, where all participants were asked to listen to all voices again and identify where they thought the speaker came from in the United Kingdom. They also rated their familiarity with that accent. It could be interesting to examine any relationship between the ratings and compare this to accuracy as well as familiarity with these accents. In the debrief questionnaire participants were able to make comments on any voices that stood out to them, but nothing of note was returned by our participants in response to this.
2.4 Statistical analysis
2.4.1 Principal component analysis
Firstly, using RStudio (R Core Team, 2021), Likert scale responses were z-score normalised and correlation matrices separately calculated for the behaviour and traits statement sets. A Kaiser-Meyer Olkin test was run on each set of data, using the psych package (Revelle, 2024), and determined that both were suitable for Principal Component Analysis (MSA behaviours = 0.85; traits = 0.82). Eigenvalues were computed from these matrices to determine the principal components of the data, and visualized using the factoMineR package (Hudson et al., 2007). The first two components from both datasets explained a cumulative proportion of variance of 89% each. From the visualisation of the loadings (see Figures 1 and 3), clusters of statements were identified and grouped accordingly to create groups of similar statement types. Each of these groups was then given a name. This avoided applying a priori categories to the statements. Responses were subsequently coded according to statement group.
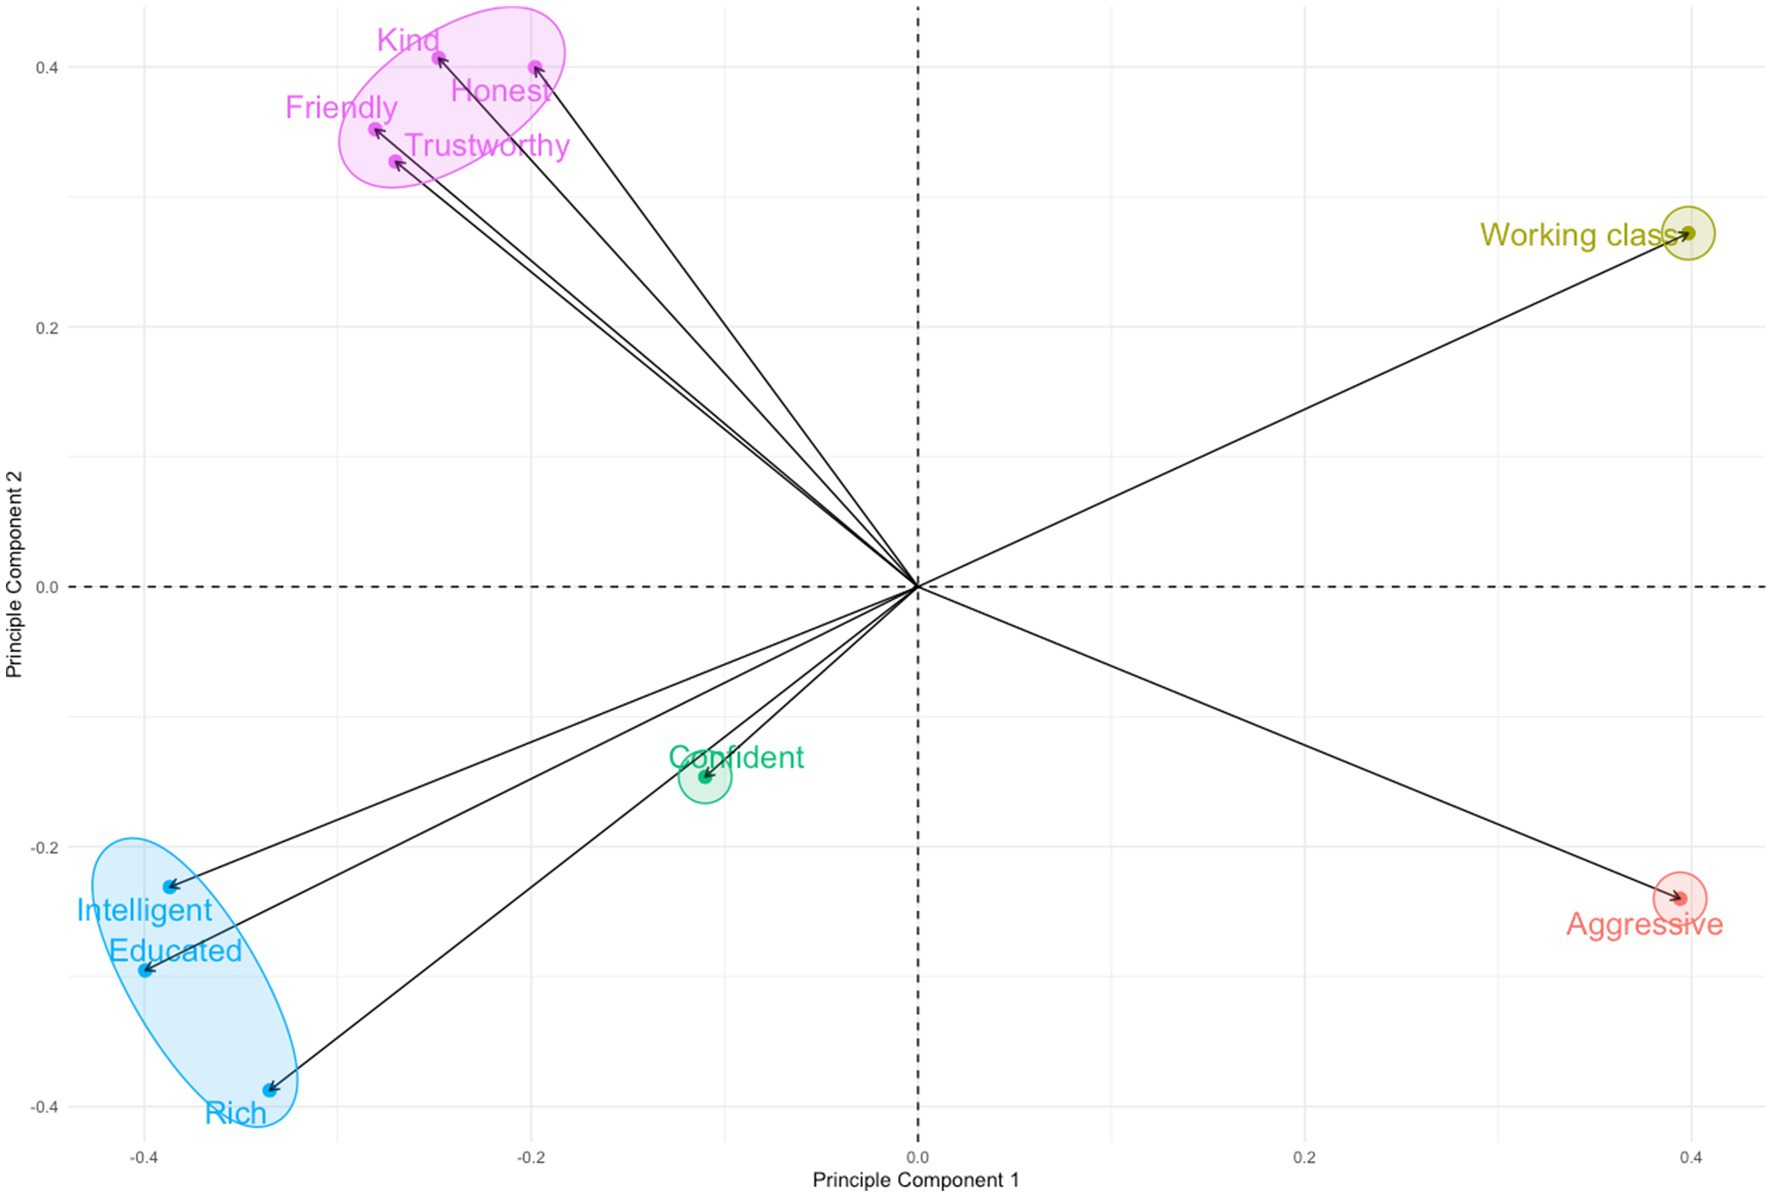
Figure 1. PCA plot of listener judgements of social traits, showing principal components 1 and 2.
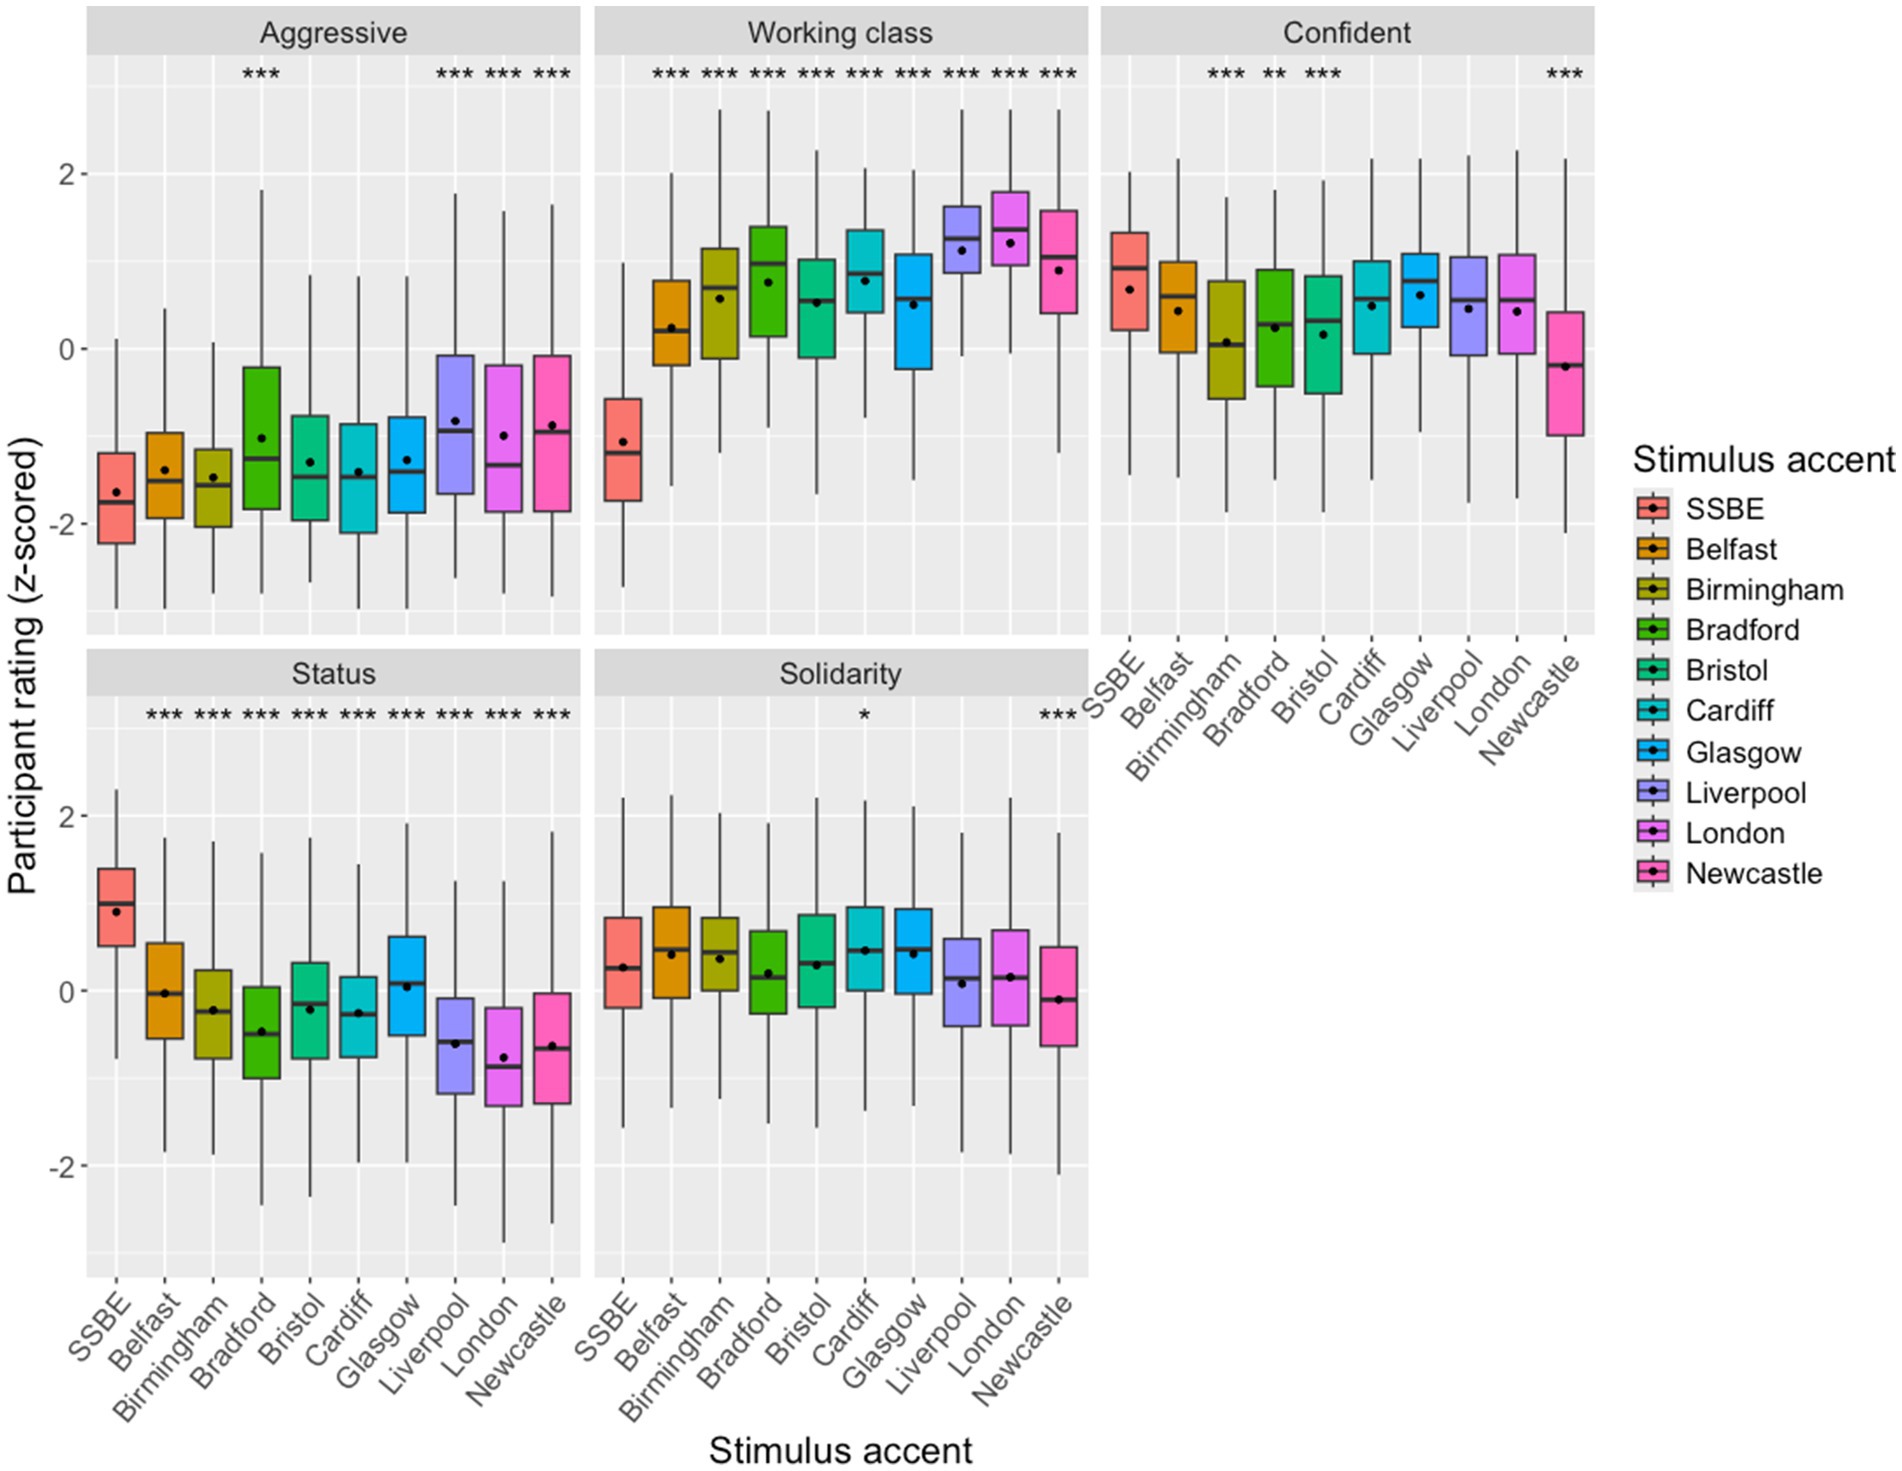
Figure 2. Boxplot of z-scored participant Likert responses for the 10 different voices for each social trait statement group, with mean values identified with a black dot on each box. Boxes are signified for degree of statistical significance in relation to SSBE with asterisks at the top of the plot.
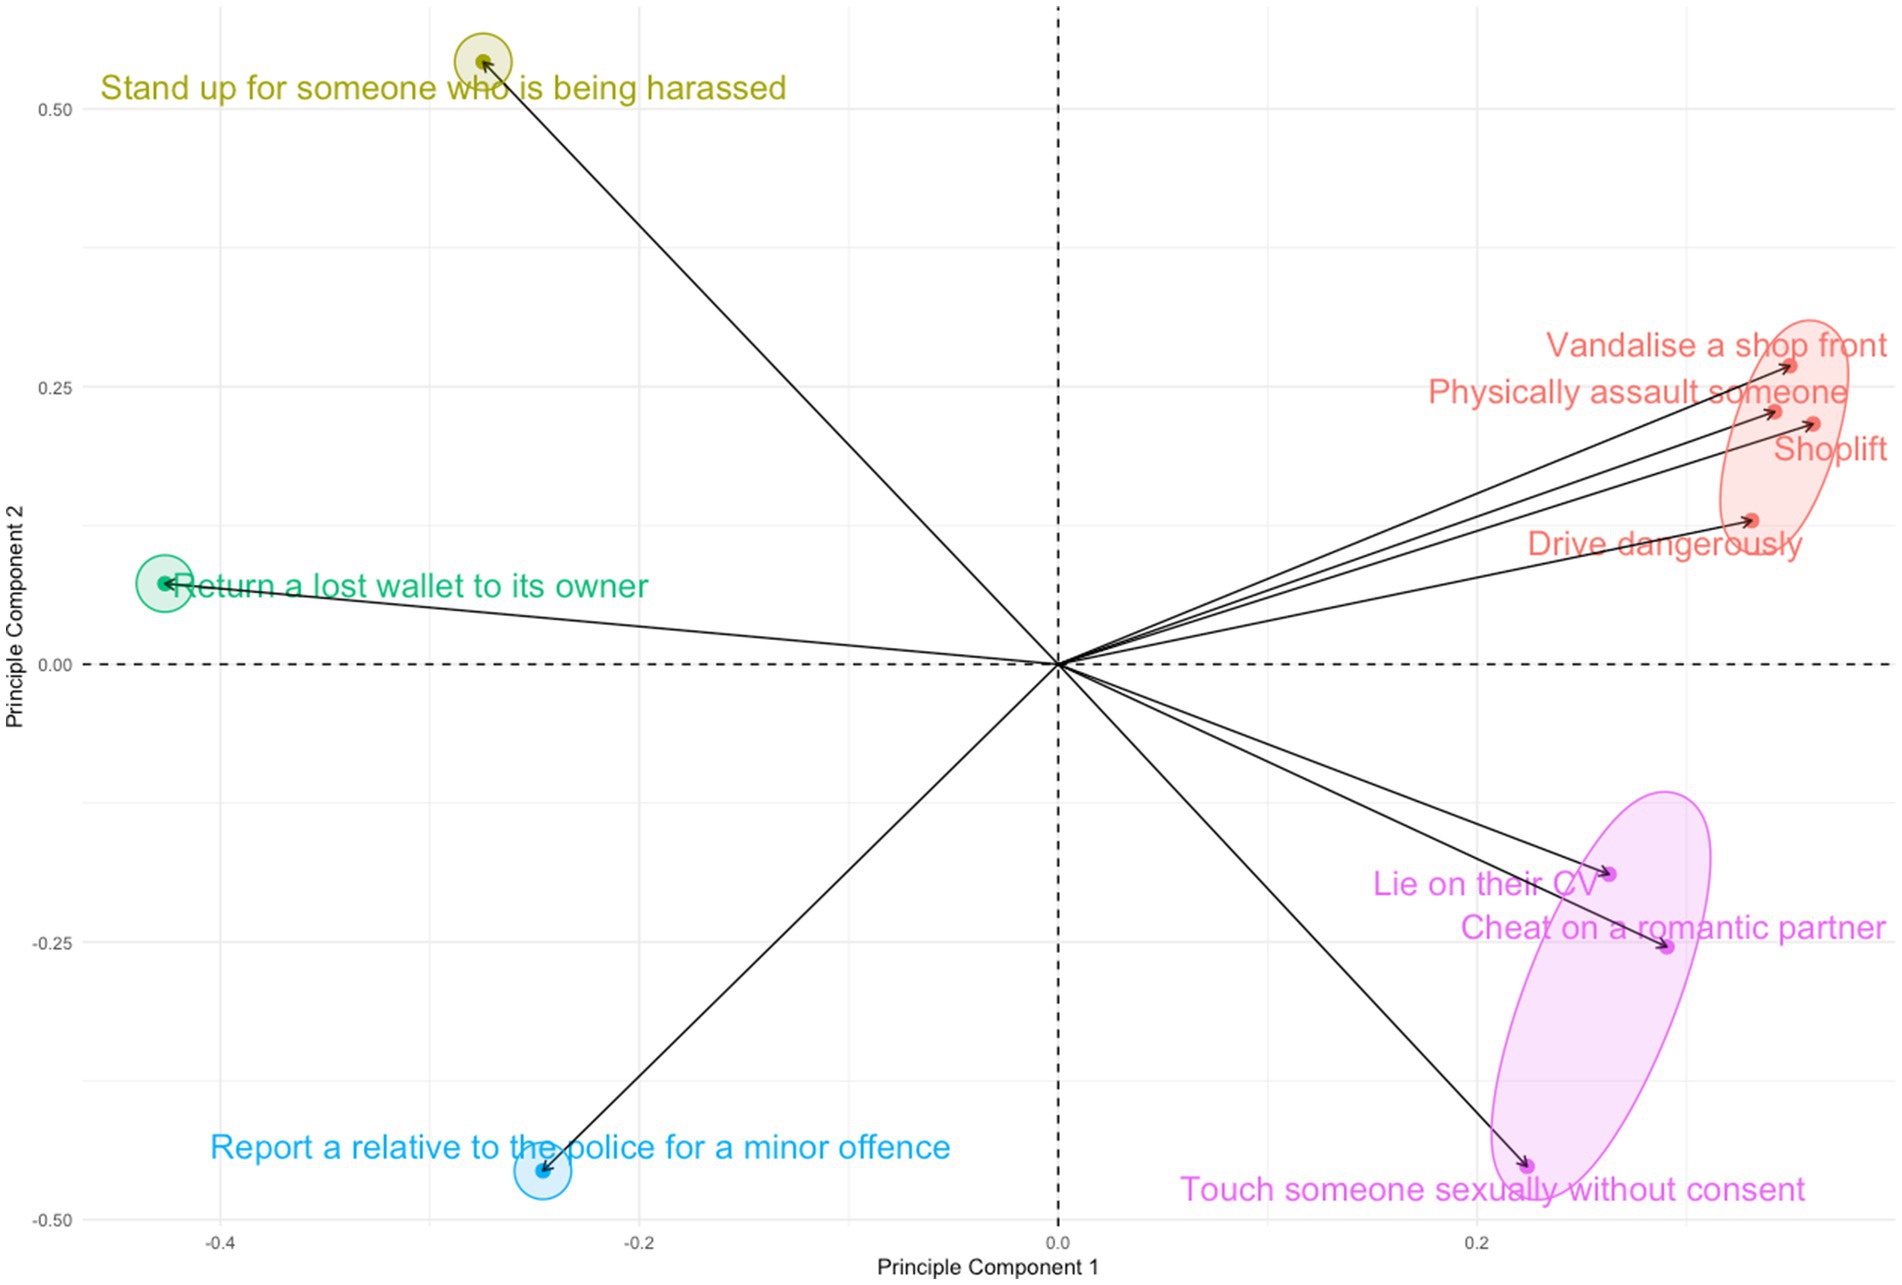
Figure 3. PCA plot of listener judgements of behaviours, showing principal components 1 and 2.
2.4.2 Linear regression
Linear regression models were separately created for each experimental condition in RStudio using the packages lme4 (Bates et al., 2015) and lmerTest (Kuznetsova et al., 2017). A maximal model was created for each condition with the by-participant z-score normalised Likert ratings as dependent variable. Independent variables were stimulus accent, statement group (as defined by the PCA), participant age group and participant gender. A two-way interaction between stimulus accent and statement group was specified. Although it is possible that participant region or ethnicity may have been factors of interest, due to the skew in our data toward White participants and participants from the South East and London leading to small samples from other ethnicities and regions, we did not include these in the statistical model. Using the Multi-Model Inference package (Bartoń, 2022), predictors were removed one by one to create models with all different possible predictor combinations. All models were ranked by their corrected AIC (Akaike Information Criterion) score, a metric to compare regression models by finding the model that best explains the variation in the data, while penalising for excessive parameters. The model with the lowest AICc score (while at least including our main research question of interest, namely the interaction between stimulus accent and statement group as a predictor) was fit to the data to determine the relationship between the predictor variables and the response variable. Using the package emmeans (Lenth, 2024), we conducted post-hoc pairwise comparisons using the estimated marginal means (EMMs) with Tukey’s adjustment for multiple comparisons. Due to the large number of possible pairwise comparisons, the results section focuses only on comparisons with the baseline standard accent ‘SSBE’; the full output tables for all pairwise comparisons are available in the Supplementary Material.
2.4.3 Spearman correlation
Spearman correlation coefficients were calculated in RStudio using the package Hmisc (Harrell, 2022) to test the relationship between z-score normalised responses for all statements and statement groups (grouped traits and grouped behaviours separately). As judgements for traits and behaviours were completed by different groups of participants, a mean of each judgement for each accent was taken to approximate what the average participant judged for each accent. A correlation plot visualising these data was created using the ggcorrplot package (Kassambara, 2023).
3 Results
This section will first explore the results for the two separate conditions - Social Traits and Behaviours – by presenting the results of the Principal Component Analysis and the resulting grouping of statements, and then exploring the main effects of interest in the linear regression models based on these statement groups. Due to the high number of variables, only the statistically significant results are commented upon in the text. Full output tables of the models are provided in the Supplementary Material.
3.1 Social traits
Figure 1 is a PCA plot illustrating the loadings for each statement on the first two dimensions from the PCA. Five clusters were identified from the plot, highlighted in the figure and listed and named in Table 3. The two largest clusters contained statements that, at the design stage of the experiment, had been identified as pertaining to the trait types traditionally investigated in the language attitudes and accent judgements literature, namely ‘solidarity’ (cluster A) and ‘status’ (cluster B). Both ‘working class’ and ‘aggressive’ formed their own individual clusters. Although ‘confident’ fell into the same quadrant as the three status-based traits in cluster B, it loaded considerably lower on both dimensions 1 and 2 compared to the rest of the statements in that cluster. Examining the loadings for the third dimension, which explained a further 4% of the variance in the dataset, revealed that ‘confident’ was strongly negatively associated with this dimension (−0.87), far away from the next nearest statement (‘friendly’) which had a loading of −0.28. No other statements correlated strongly with this dimension either positively or negatively. As a result, ‘confident’ was classified as belonging to a cluster of its own.
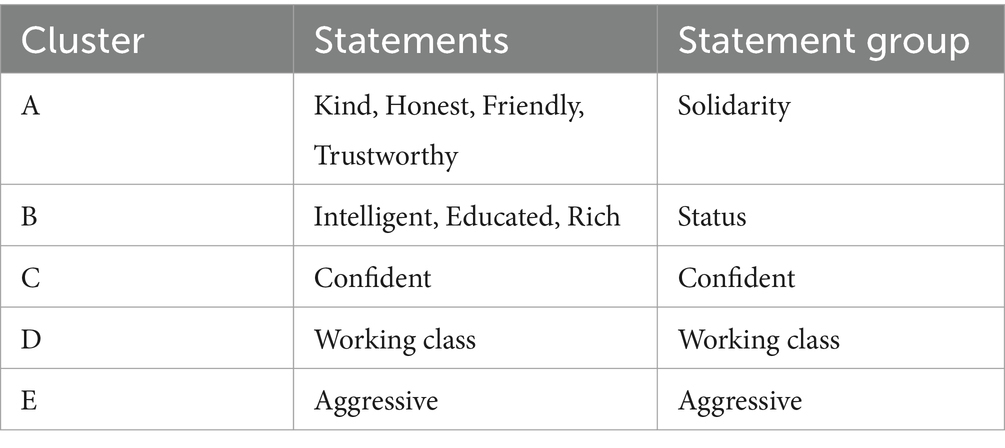
Table 3. Statement groups of traits as identified by clusters of statements in the PCA.
Figure 2 shows a boxplot of the z-scored participant responses for the 10 different voices, grouped by the statement groups identified by the PCA, illustrating the distribution of participants judgements (with outliers excluded). In the linear regression model, the best-fit predictors were: statement group, stimulus accent, and an interaction between statement group and stimulus accent. This model (AICc = 21569.5, df = 51) was a significantly better fit (χ2 = 4,073, p = 0) than the null model (AICc = 25454.4, df = 2). Statement groups and stimulus accent both had a statistically significant effect on the listener ratings, individually and in interaction. Statistically significant differences for the interaction effect of statement groups and stimulus accent are indicated on the plot, where the reference level accent is SSBE. A full report of the model output, including all post-hoc pairwise comparisons between all accents, is included in the Supplementary Material.
In general, differences between the accents for solidarity traits are smaller than for other trait types, and z-scored ratings tend to cluster mostly around the mean (i.e., around 0 on the boxplot in Figure 2). The highest rated accents for these traits were Belfast, Cardiff and Glasgow, while the lowest rated accents were Newcastle and Liverpool. Regarding status-based traits, the SSBE speaker was rated noticeably higher than all other traits, and the lowest rated accents were Liverpool, London and Newcastle. For the ‘working class’ trait, which loaded exactly conversely to the status-based traits in the PCA, we see the exact opposite effect, whereby SSBE rates very low, and the Liverpool, London and Newcastle voices rated the highest, closely followed by Bradford. SSBE also rated as the most confident sounding voice, marginally ahead of Cardiff, Glasgow and Belfast (but not to a significant degree), and the Newcastle accented voice was rated least confident. Liverpool, Newcastle, London and Bradford were all the most aggressive sounding to the listeners, and SSBE was the least aggressive sounding. However overall, listeners tended to use the lower end of the response scale when rating the ‘aggressive’ statement.
3.2 Behaviours
Figure 3 is a PCA plot illustrating the loadings for each statement on the first two dimensions from the PCA. As with the traits, five clusters were identified from the plot and are highlighted in the figure and listed in Table 4. These again fall roughly into the quadrants of the plot. Despite the distinction between crime types during the design of this experiment, some of which were intentionally chosen as less socially stratified, all except one criminal behaviour clustered together. This suggests that overall, the participants perceived and judged behaviours such as physically assaulting someone and driving dangerously in a similar way. The notable exception to this was touching someone sexually without consent, which clustered with other negative, but not criminal, behaviours, distinct from the other types of criminal offence. The implications of this will be further explored in the discussion section of this paper. These were collectively labelled as ‘morally bad’, because all these behaviours could be perceived as morally bad, despite some being illegal and some not.
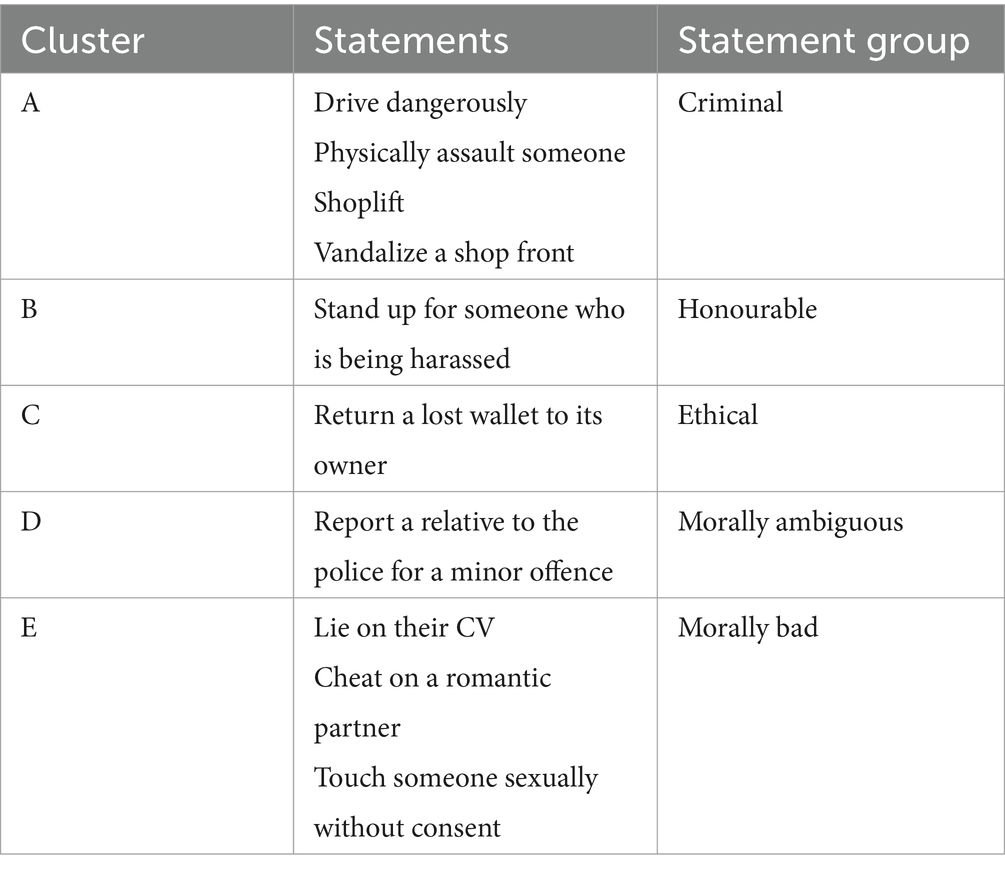
Table 4. Statement groups of behaviours as identified by clusters of statements in the PCA.
‘Return a lost wallet to its owner’ sits close to the x axis. As this behaviour loads roughly halfway between two others on dimension 2 and loads some distance away from them both on dimension 1, it was categorised as its own behaviour type of ‘ethical’. The behaviour of standing up for a victim of harassment was labelled as an ‘honourable’ behaviour. During the design phase of the study, the behaviour of reporting a relative to the police was specifically chosen as a morally ambiguous behaviour. Given that it too clustered on its own according to the PCA loadings, rather than with ‘morally bad’, ‘ethical’ or ‘honourable’, it was labelled as ‘morally ambiguous’.
Figure 4 shows a boxplot of the z-scored participant responses for the 10 different voices, grouped by the statement groups identified by the PCA. The best-fit model predictors were: statement group, stimulus accent, and an interaction between statement group and stimulus accent. This model (AICc = 23457.4, df = 51) was a significantly better fit (χ2 = 1812.9, p = 0) than the null model (AICc = 25171.7, df = 2). Statistically significant differences are again indicated on the plot, where the reference level accent is SSBE. A full report of the model output, including all post-hoc pairwise comparisons, is included in the Supplementary Material.
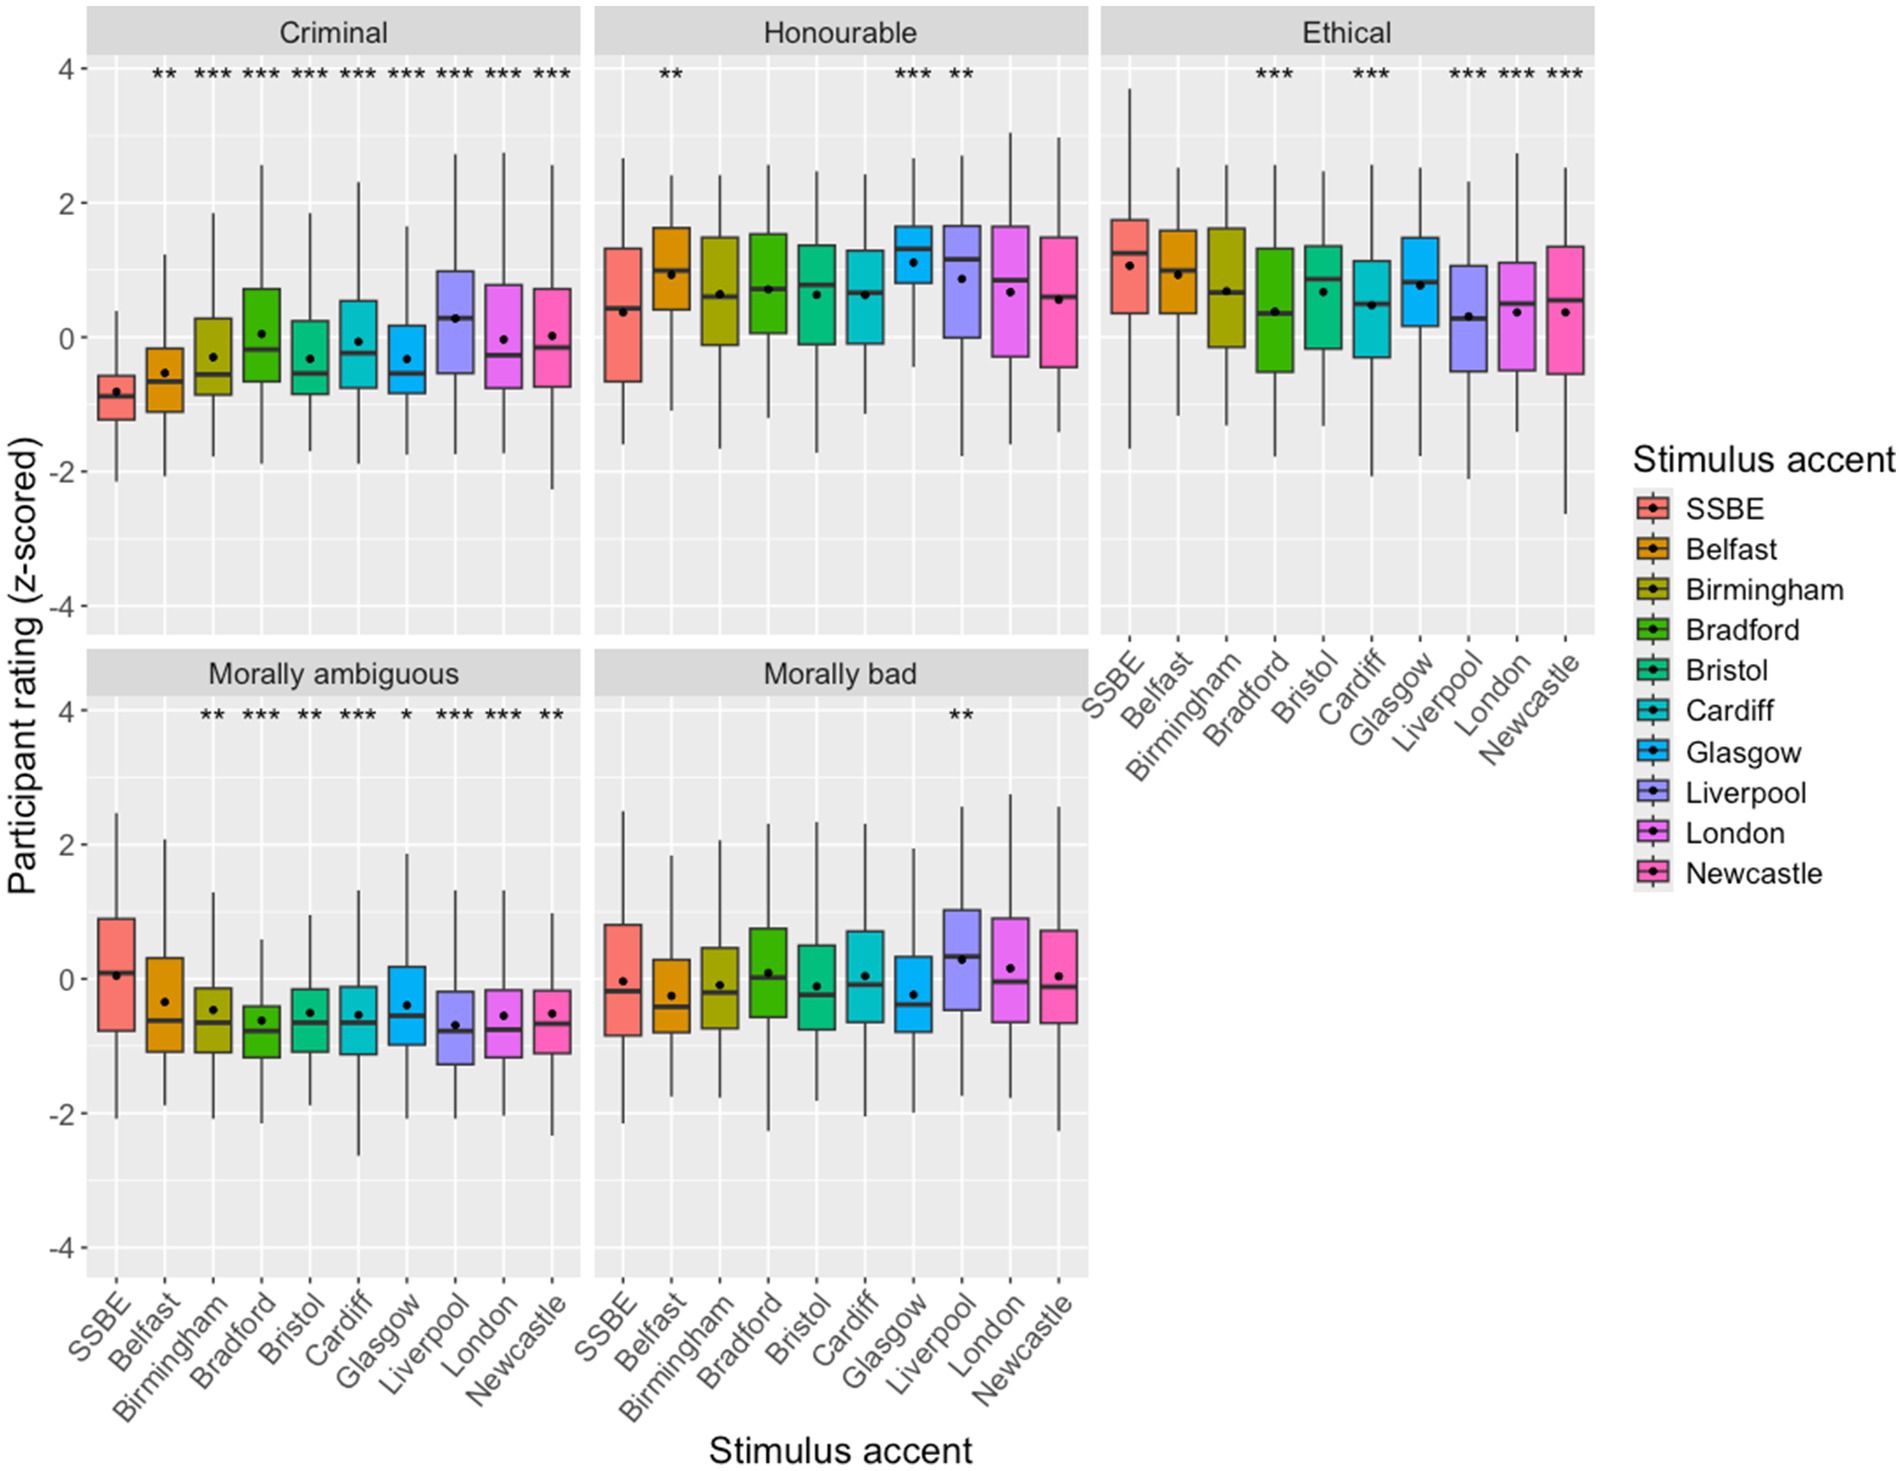
Figure 4. Boxplot of z-scored participant Likert responses for the 10 different voices for each behaviour statement group, with mean values identified with a black dot on each box. Boxes are signified for degree of statistical significance in relation to SSBE with asterisks at the top of the plot.
Overall, ratings for the positive behaviours were higher, while ratings for negative behaviours tend toward the lower end of the scale. Descriptively, the effect of stimulus accent on the ratings for morally bad behaviours appear very similar, but the statistical model revealed there was nevertheless a meaningful difference to be observed. The London and Liverpool speakers were rated the most likely to display morally bad behaviours, while the Glasgow and Belfast speakers were least likely. With the criminal behaviours, the SSBE speaker was instead the least likely to behave in these ways (followed by the Belfast speaker, although the statistical model revealed a significantly higher rating than SSBE), while the Liverpool and Bradford speakers were the most likely.
The two different types of morally good behaviours, as identified in the experimental design stage, both elicit higher agreement ratings, but demonstrate different patterns when it comes to the effect of stimulus accent. For the honourable behaviour, the Glasgow and Belfast voices were most likely to behave in this way, while the SSBE speaker was the least. Conversely, the SSBE speaker was the most likely to exhibit the ethical behaviour, but the Glasgow and Belfast speakers also rated well in this regard. The Liverpool, Bradford, London and Newcastle speakers were the lowest rated for this statement group. The SSBE speaker was rated the highest in terms of behaving in a morally ambiguous way, with the Glasgow speaker the next most likely and with no significant difference in ratings. All other accents rated similarly for this statement type.
3.3 Correlation between traits and behaviours
Figure 5 reports the Spearman’s correlation coefficients for the grouped statements that were reported to be statistically significant. Some relationships observed within the traits and behaviours conditions reflect the findings of the PCA. For example, there is a positive correlation between working class and aggressive (0.77, p = 0.0086); intuitively, the status traits (which are, as observed by the near 100% negative correlation, the inverse of working class) are also negatively correlated with the aggressive trait (−0.83, p = 0.0029). The lack of correlation between honourable and ethical behaviours, and the morally ambiguous and morally bad behaviours, also reflects the observations from the PCA. Although morally bad and criminal behaviours, as denoted by their groupings, formed different clusters in the PCA, they nevertheless have a positive correlation with one another (0.74, p = 0.01). Likewise, despite forming separate clusters according to the first two dimensions of the PCA, average ratings for the ethical and morally ambiguous behaviours are nonetheless highly correlated (0.89, p = 0.0006).
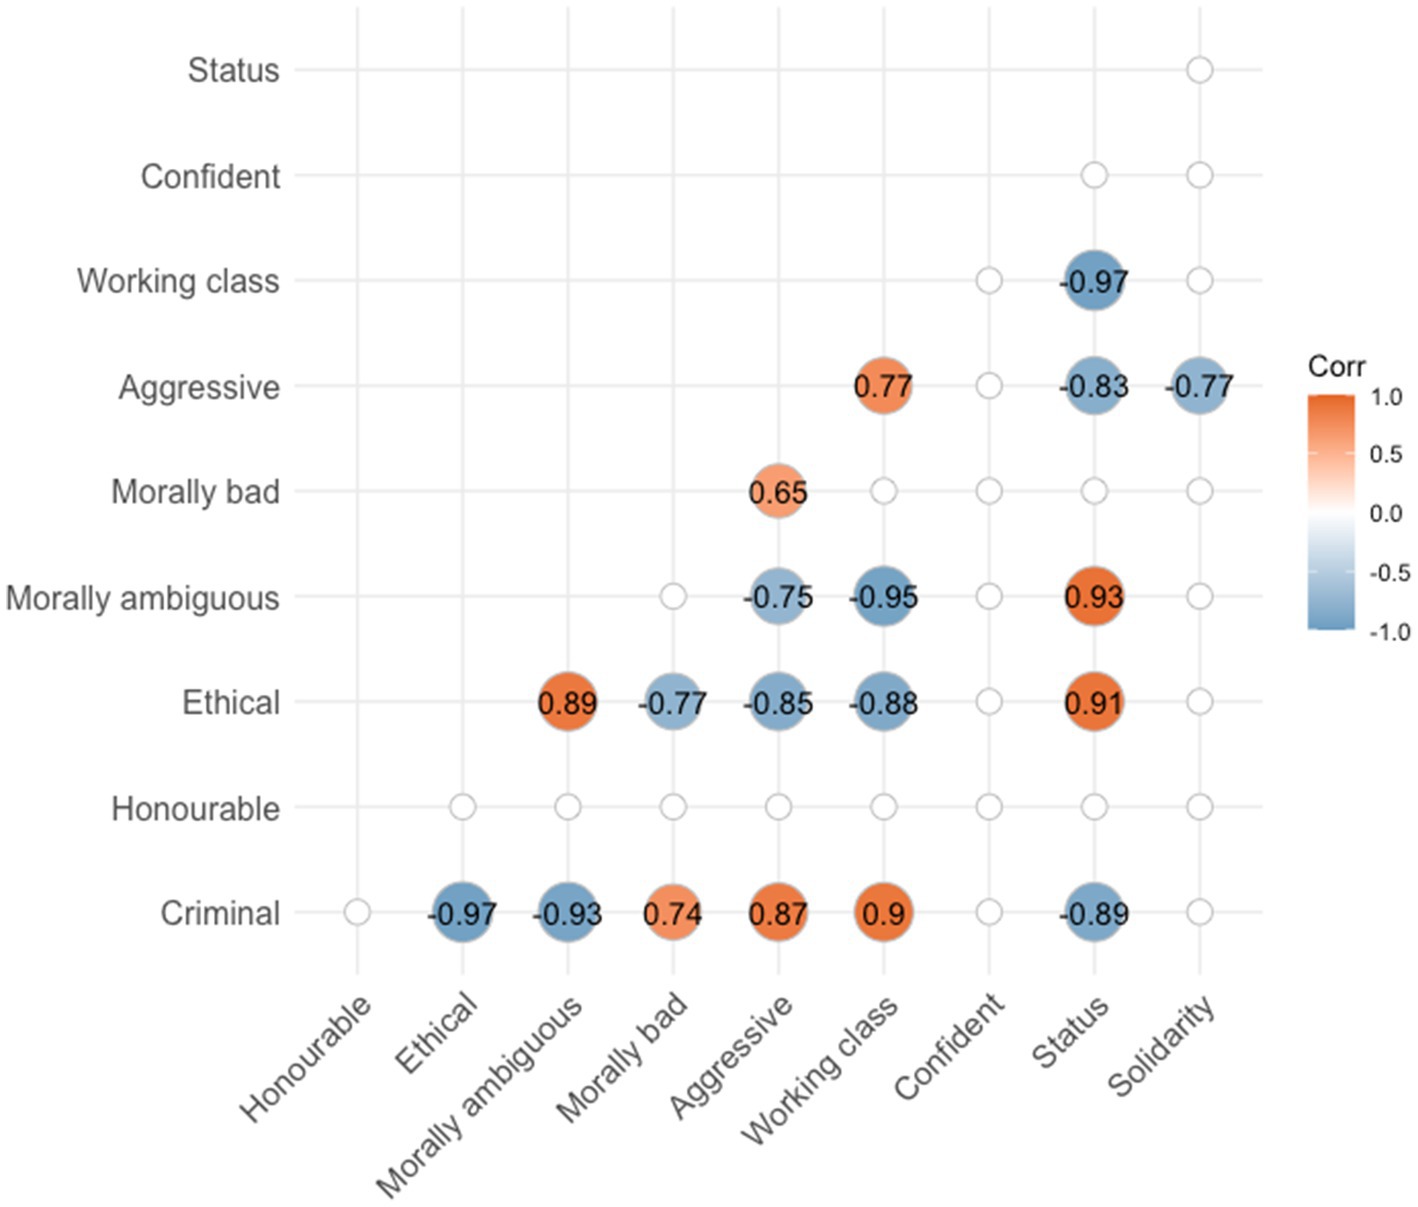
Figure 5. Correlation matrix for grouped traits and behaviours, showing only statistically significant correlations (p < 0.05).
Some notable relationships between traits and behaviours emerge from this analysis. There is a strong positive correlation (0.91, p = 0.0003) between status traits and ethical behaviours. A slightly stronger correlation (0.93, p = 0.00009) between status traits and morally ambiguous behaviours was also observed. Correspondingly, there is a strong negative correlation between status traits and criminal behaviours (−0.89, p = 0.0005). The inverse is true for all of these relationships when it comes to the working class trait, as expected due to the relationship between status and working class.
Somewhat intuitively, a positive correlation between the aggressive trait and both criminal (0.87, p = 0.0012) and morally bad behaviours (0.65, p = 0.041). Aggressive is also negatively correlated with both ethical (−0.85, p = 0.0017) and morally ambiguous (−0.75, p = 0.012) behaviours. A negative relationship exists between ratings for solidarity traits and the morally bad behaviours that is statistically significant (−0.67, p = 0.034). Interestingly, there is no significant correlation between solidarity traits and any of the behaviours; nor with other traits, except for aggressive, where there is a negative correlation between ratings (−0.77, p = 0.0092). There is also no relationship between ratings of confidence and any other traits or behaviours, or between honourable behaviours and any other traits or behaviours, although this may be due to the fact that these two categories consist only of one statement.
4 Discussion
4.1 Hypothesis 1
The first hypothesis of this study predicted that some ‘non-standard’ British accents would be rated higher on solidarity measures but lower on status measures than the ‘standard’ accent. Our results partially support this hypothesis. The ‘standard’ SSBE speaker was rated significantly higher than all nine of the ‘non-standard’ accents for ‘status’ traits, which in this analysis comprised ratings for intelligent, educated and rich. This is in-line with the existing literature, and entirely expected given the status of SSBE as supra-regional standard.
The results for ‘solidarity’ traits, comprising kind, honest, friendly, trustworthy, are less straightforwardly in line with the existing literature. In general, differences between the accents are smaller for solidarity-based traits than for the other trait types. This is in keeping with what has been found elsewhere in the literature, such as by Coupland and Bishop (2007), p. 80 who note that ‘judgements of accent prestige are more widely differentiating and less generous than those for social attractiveness’. The only accent rating significantly lower than SSBE for these traits is Newcastle, which listeners also rated significantly lower than every other accent in this experiment. This finding for Newcastle is broadly in line with the literature that has typically seen standard, more prestigious, varieties rate more positively than urban, non-standard varieties by participants for ‘solidarity’, ‘attractiveness’, ‘pleasantness’ and ‘aesthetic content’ in response to both accent labels and vocal stimuli (Giles, 1970; Bishop et al., 2005; Coupland and Bishop, 2007; Watson and Clark, 2015; Sharma et al., 2022). However, previous studies did find that Newcastle accents rated higher than other similar large urban centres such as Birmingham or Liverpool, sounding particularly friendly and pleasant (Coupland and Bishop, 2007), which was not the case for our speaker. This is perhaps due to some characteristics of the particular stimulus used in our experiment, or could instead be due to changing perceptions of this particular accent in the United Kingdom.
Ratings for the Birmingham accent also stand out here against the results of the existing literature. It was the most favourably rated English accent on both solidarity measures and status measures (except SSBE). This contradicts the results of previous research both older and more recent, which has consistently seen the Birmingham accents rated very poorly across all measures (Bishop et al., 2005; Coupland and Bishop, 2007; Sharma et al., 2022). In this study, the Birmingham accent is rated more favourably than Bradford, Bristol, Liverpool, London, Newcastle on one or both dimensions. Although relatively stable over time (Sharma et al., 2022), language attitudes are not immutable (McKenzie and McNeill, 2022) and we may be capturing a change-in-progress with regard to the perception of the Birmingham and Newcastle accents. It is possible that the use of audio stimuli in this study, rather than accent labels as in some previous experiments, elicited different judgements; notably, Axer (2019), p. 207 also used audio stimuli for her study and found the Birmingham accent to be perceived more favourably than has traditionally been the case. Our findings thus demonstrate the important influence of experimental conditions for ecological validity, in particular in forensic contexts.
The only accent rated higher than SSBE for the solidarity traits is the Cardiff accent. Examining the pairwise comparisons (in Supplementary Material) reveals that Cardiff is rated higher than Bradford, Liverpool, London and Newcastle, as are Belfast and Glasgow. Typically, non-English standard varieties (with broad labels such as ‘Scottish’ or ‘Welsh’, as in Coupland and Bishop, 2007 and Sharma et al., 2022) tend to elicit higher ratings for both status and solidarity ratings with respondents, although these have usually been in response to accent labels rather than audio stimuli. With such a small proportion of our listeners originating from Wales, Scotland and Northern Ireland, we assume that they are not experienced enough with these accents to be able to make fine-grained distinctions between local regional varieties such as Cardiff and Swansea. Instead, they are likely to be mentally assigning a less specific regional label such as ‘Wales’ or ‘Scotland’ to our speakers. As such, the higher ratings of pleasantness for the Cardiff speaker, when compared to the SSBE speaker, are within expectations based on previous research. In relation to ratings for the non-standard British accents, the non-English accents (Belfast, Cardiff and Glasgow) are scored more favourably on both status and solidarity measures than the English non-standard accents. This is also in line with previous literature using both vocal stimuli and accent labels, that has typically seen Celtic accents being judged more positively than their English counterparts (Giles, 1970; Bishop et al., 2005; Coupland and Bishop, 2007; Watson and Clark, 2015; Sharma et al., 2022).
Previous research has typically found an effect of in-group loyalty and proximity effects resulting in participants rating voices more favourably, especially on solidarity traits, when they share a regional accent or come from a nearby area (Long, 1999; Bishop et al., 2005; Coupland and Bishop, 2007). This has been noted particularly in relation to positive ratings of Celtic accents being driven by respondents living in these areas showing ‘in-group loyalty’ (e.g., Bishop et al., 2005, p. 149; Coupland and Bishop, 2007, p. 81). However, 88% of our respondents came from England rather than the rest of the United Kingdom, and therefore such regional loyalty cannot account for the positive evaluations of the Cardiff, Glasgow and Belfast speakers here. These accents are highly rated by listeners who are not from these geographical areas, a result that corresponds with Sharma et al.’s (2022) recent analysis. Perhaps what this result is capturing here is a salience of the divide between regions within the United Kingdom. We have discussed that our participants are unlikely to be able to classify our non-English speakers as coming from a particular city or town. Hence, as its own kind of standard regional variety within its respective nation, Scottish, Welsh or Northern Irish can profit from a privileged status not dissimilar to SSBE. At the same time, these varieties may enjoy the increased in perceived pleasantness that a traditional or rural variety may have that is not benefited to supra-regional standards such as SSBE or RP, which may be associated negatively with snobbery or selfishness – as evidenced in the perception that the SSBE speaker is least likely to behave honourably.
In terms of a social trait, ‘working class’ seemed to operate in our study as the opposite of high status. It patterns exactly conversely to the status-based in that SSBE was judged very low, and the Liverpool, London and Newcastle voices rated the highest, closely followed by Bradford. This accounts for it clustering on its own in the PCA, in a directly opposite position in the quadrant to the status measures (see Figure 1). As will be discussed, ratings of working class have powerful associations with judgements of behaviour types. Finally, ‘aggressive’ patterns in similar ways to ratings of working class, with Liverpool, Newcastle and Bradford being judged most aggressive, and SSBE being least aggressive. Notably, participants used the lower end of the scale when judging voices for aggression, indicating that they are more cautious and conservative when attributing this particular trait to speakers.
4.2 Hypothesis 2
The second hypothesis in this study predicted that regionally accented speakers will be judged as more likely to behave in morally bad ways, including committing criminal offences, than speakers of ‘standard’ accents. The results from the experiment partially support this hypothesis. The SSBE speaker was judged as least likely to behave in criminal ways for the group of criminal behaviours (not including the sex offence), and the difference with all other accents in this study was statistically highly significant. This perception of speakers of ‘non-standard’ regional accents as being more likely to commit criminal offences than speakers of more prestigious standard varieties aligns with findings in the existing literature (Dixon et al., 2002; Dixon and Mahoney, 2004; Axer, 2019; Cantone et al., 2019), and the range of regional accents examined here establish that the previously observed effects were not limited to the varieties in those studies. These results serve to reinforce the warnings that the stereotypes that listeners have about voices can influence their decision making in legal contexts (Frumkin and Stone, 2020, p. 140) and lead to the disparate treatment of accented speakers in the justice system (Cantone et al., 2019, p. 248). This not only includes perceptions of guilt, but also opinions on the severity of punishment for accented speakers (Romero-Rivas et al., 2022) and their increased likelihood of being incorrectly selected from voice identification parades (Nolan, 2003). However, our results also highlight that not all non-standard accents are equal in this respect. The statistical model revealed that the effect size of the difference in ratings for the Belfast speaker when compared to the SSBE speaker was smaller than for the other regional accents. This is consistent with the other findings in this study, whereby the non-English accents (in particular, the Belfast and Glasgow accents) were rated favourably in other regards both for traits and behaviours; Belfast and Glasgow were rated significantly less likely to behave in criminal ways than almost all other varieties. This study highlights the complex nature of perceptions of speakers of regional accents and how the dimensions of prestige, social attractiveness and morality interact.
Furthermore, although the SSBE-accented speaker was considered less likely to be guilty of most crimes, that was not the case for the sex offence, as illustrated in Figure 6. This boxplot illustrates the distribution of listener responses for the different types of crime chosen for this experiment. The Glasgow- and Belfast-accented speakers were rated as the least likely to touch someone sexually without consent. Only the London and Liverpool speakers were judged as being marginally more likely to commit this particular offence than the SSBE speaker. The stark contrast in ratings for the sex offence and other criminal behaviours accounts for why ‘sex offence’ clustered separately from other ‘criminal’ behaviours, patterning instead with other ‘morally bad’ behaviours, namely lying on a CV and being unfaithful to a romantic partner. It tells us that our participants perceive sex offences (or at least this sex offence) differently from how they view non-sex offences, including physical assault. Literature suggests that sex crimes are viewed differently by the public in terms of higher levels of condemnation and hostility (Pickett et al., 2013). Perhaps our listeners take more of a principled stance with this crime, as illustrated by its clustering in the direct opposite quadrant to the honourable behaviour in the PCA plot (Figure 3). Listeners may be judging this offence similarly to other clearly immoral (but not illegal) behaviours and view the other crimes as less clearly morally reprehensible, although they were less inclined to respond with ‘very likely’ to this group of statements as a whole when compared to the criminal behaviours.
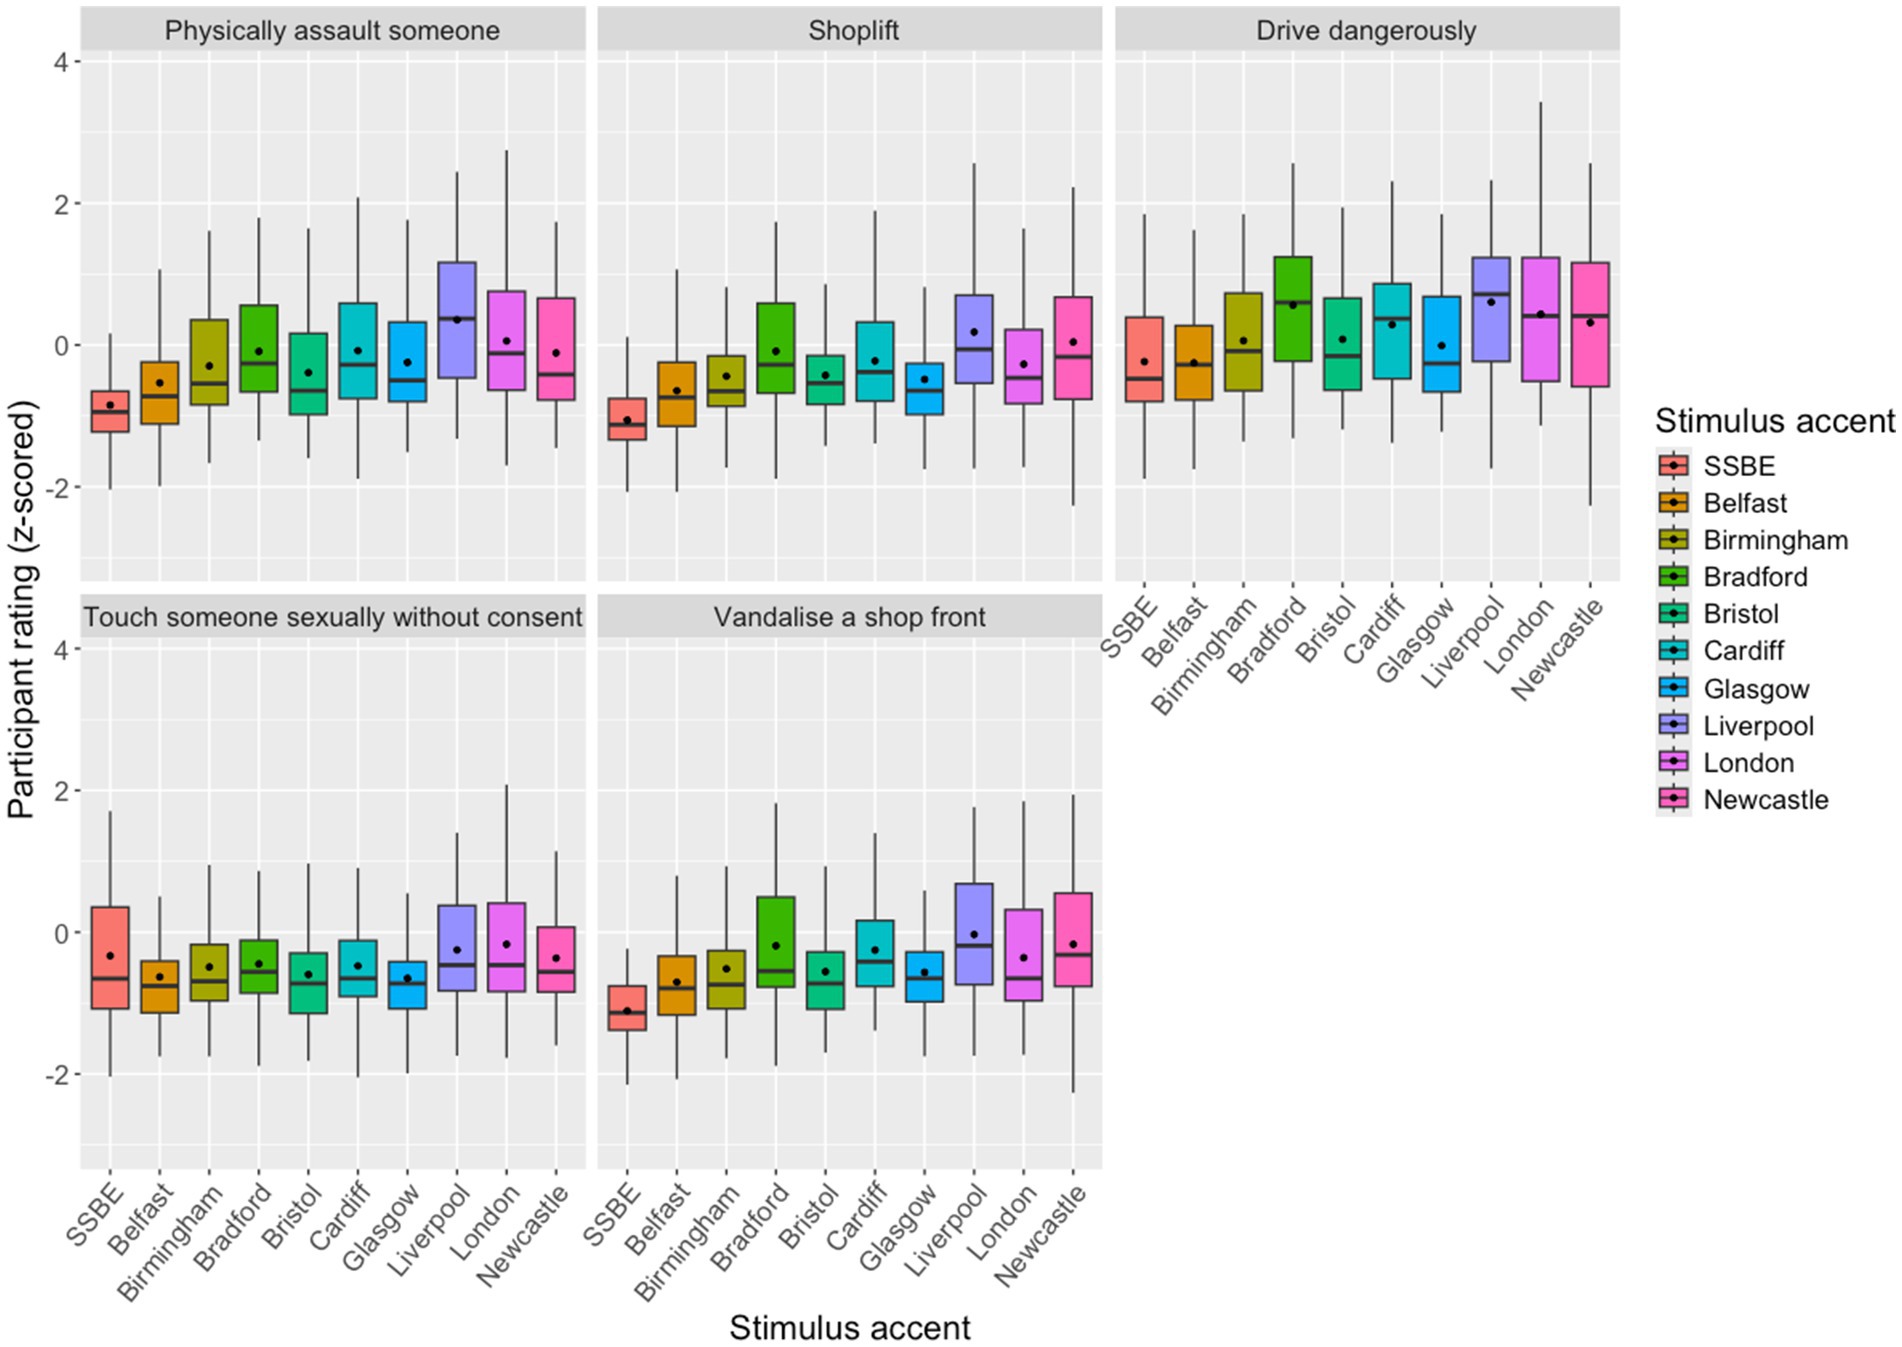
Figure 6. Boxplot of z-scored participant Likert responses for the 10 different voices for each crime, with mean values identified with a black dot on each box.
Most important for our research question is that our participants think that ‘standard’ accented speakers are more likely to commit a sexual assault than they are any of the other offences tested for here. Traditionally, the public image of a sex offender has been a ‘lower-class man’ (Small, 2015, p. 116). However, this is not borne out in our results; despite being judged most favourably in terms of status traits, and as being least working-class, the SSBE speaker was not perceived as being least likely to commit a sexual assault. Although differences between ratings for the accents appear small, SSBE is noticeably high in the ranking for this offence, level with the Liverpool and London varieties. This in turn may indicate shifting perceptions of the ‘type’ of man who can, and does, commit sexual offences. When designing the study, the aim was to investigate whether less class-stratified crime types (the chosen examples were a driving offence and a sex offence) still have an association with perceived social status when it comes to the sound of someone’s voice. While this is not the case for the sex offence, notably the driving offence does appear to pattern with the other crimes, as demonstrated by the PCA, despite not being as explicitly socially stratified as, for example, vandalism. A closer look at the boxplot in Figure 6 does however reveal that listeners were more likely to respond in the affirmative for the driving offence than for any other offence, demonstrating that this particular crime may be less socially stigmatized than others. Furthermore, although the relative patterns of low-status varieties such as Bradford and Liverpool being ranked highest for likelihood of committing this offence mirrors the ranking of accents for the other crimes, the relative distance between the lowest-ranked SSBE speaker and his nearest neighbours is smaller than for the other, non-sexual, offences. These results reveal nuanced differences between perceptions of different accents and their associations with particular crimes. Methodologically, this finding highlights the importance of including crimes that are not stereotypically associated with certain types of offenders (see Axer, 2019, p. 202), such as the intuitively patterned ‘blue’ and ‘white’ collar crimes examined in early work in this area (Seggie, 1983; Dixon et al., 2002; Dixon and Mahoney, 2004). Future work should look to investigate how other factors encoded in voice, such as age, gender, or ethnic background, may affect listener judgements of how likely a person is to commit certain behaviours.
As well as being judged as less likely to commit criminal offences (except the sex offence), the SSBE speaker was also judged as most likely to return a lost wallet, a behaviour we have called ‘ethical’. However, it did not follow that they were considered more likely to behave in other morally ‘good’ ways; they were rated as least likely to stand up for someone being harassed, with Glasgow, Belfast and Liverpool speakers scoring most highly on this behaviour. First, this reflects a difference in how participants perceive ‘ethical’ and ‘honourable’ behaviours, and accounts for why they were clustered differently in the PCA. Second, these results reveal that low ratings for ‘morally bad’ behaviours, cannot be assumed to translate into high ratings for morally ‘good’ behaviours. The same is true of the reverse; the Liverpool-accented speaker was considered most likely to behave in ‘morally bad’ ways, while also being among those most likely to stand up for someone being harassed. Ultimately, these results paint a complex picture of perceptions and predictions of morality when it comes to the ‘standard’ accented speaker. This is further underlined by the fact that they were also perceived as most likely to report a relative to the police, a morally ‘ambiguous’ behaviour.
4.3 Hypothesis 3
The third hypothesis of this study predicted that there would be correlation between trait ratings and behaviour judgements, such that more negative trait judgements will be associated with greater criminality and vice versa. The discussion up to now has indicated a relationship between stereotyped judgements for social traits and behaviours. The SSBE-accented speaker was rated highest of all speakers for both status and solidarity traits, lowest on ‘working class’ and ‘aggressive’, and was also rated least likely to behave in ‘criminal’ ways and most likely to behave ‘ethically’. Similarly, the Glasgow- and Belfast-accented speakers were rated highly on status and solidarity measures and were judged as least likely to behave in ‘morally bad’ ways. On the other hand, the Northern English (Bradford, Liverpool and Newcastle) and London accents were rated more negatively on status and solidarity ratings and were also adjudged as more likely to behave in ‘morally bad’ ways, but least likely to behave in an ‘ethical’ way. The aim of Hypothesis 3 was to test if these relationships between trait and behaviour ratings are statistically significant.
First, our model found a strong negative correlation between status traits and criminal behaviours. That is, the more positively listeners rated an accented voice for status traits, the less likely they think they are to commit criminal offences. This relationship between judgements of speaker characteristics and judgements of guilt has been seen elsewhere in the related literature. Dixon et al. (2002), p. 166 found that a Birmingham-accented speaker was rated as more likely to commit a criminal offence than an RP speaker, and listener ratings of speakers in terms of Superiority and Attractiveness predicted ratings of guilt. Their results, Dixon et al. (2002), p. 166 tentatively suggest, may indicate that regionally accented speakers are perceived as guiltier than RP speakers ‘because their testimony is deemed less assured and therefore more closely associated with shiftiness or related criminal stereotype’. Axer (2019), p. 210 also observed a relationship between stereotyped traits and perceived criminality in the context of suspect interrogation; although non-standard accented speakers in the study were rated more socially attractive but less competent than their standard-accented counterparts, and more likely to be guilty. In their mock jury study, Cantone et al. (2019), p. 241 found a correlation between ratings for ‘defendant characteristics’ and guilt. Participants who judged the defendant to be not guilty also judged them as more kind, intelligent, likable, educated and friendly than those participants who found the defendant guilty. The same was found in Kurinec and Weaver’s (2019) study, in which AAVE-speaking defendants were evaluated more poorly than General American English speakers in terms of their socio-intellectual status and aesthetic qualities and these negative evaluation scores significantly correlated with guilty verdicts. They conclude legal counsel need to be ‘particularly attentive to how stereotypes about speech and dialect may shape jurors’ view of their client’ (Kurinec and Weaver, 2019, p. 823). Unlike previous findings, we did not observe a relationship between solidarity traits and any behaviours in our experiment; for our listeners, status was a more important predictor of this, further entrenching our understanding of how social class and prestige interact with expectations of behaviour. The findings of this study and those of the previous literature align with the long-established relationship in social psychology between stereotyped beliefs and expectancies of others (e.g., Hamilton et al., 1990), and bring into sharp focus the disadvantage that speakers of non-standard accents may face in the criminal justice system.
By including a wide range of behaviours, our results revealed some interesting relationships between traits and behaviours that were not limited to the crime statements in our experiment; the positive relationship between status and both ethical and morally-ambiguous behaviours reveals that listeners expect low-status speakers to be less likely to return a lost wallet to its owner, but also less likely report a relative to the police. Although much of the previous literature has focused on traditional traits of status and solidarity (or similar measures), a trait which clustered individually in the PCA – ‘aggressive’ – correlated negatively with perceived status and positively with criminal behaviours. The correlation between these traits and behaviours indicates that our respondents tend to think that voices that sound low-status also sound aggressive and more criminal-like. In this respect, judgements relating to status and aggressiveness are helpful predictors of perceived criminality. This demonstrates the value of broadening the scope of traits examined beyond the typical ‘status’ and ‘solidarity’ traits.
Uniquely, by testing multiple different non-standard accents (as opposed to two or three) our experiment revealed that these findings can potentially be generalized across a broad range of varieties of British English, although not all. These generalizations can be made with some caution, as we were limited to one voice stimulus per accent, as we discuss in the limitations section 4.4. This distinguishing feature also allows us to reveal nuanced insights into the relationship between assumed traits and behaviours based on a speaker’s regional accent. Some of the non-standard accents in our study (namely the non-English accents), despite not benefiting from the prestigious status of the SSBE variety, nevertheless were consistently ranked more positively in terms of traits and behaviours. In particular, the Glasgow and Belfast speakers were less likely to commit crimes than almost all other speakers, and were also perceived more positively on both status and solidarity trait dimensions. The relationship between perceived status and criminality is therefore compelling, but not completely straightforward. Dragojevic et al. (2017) found that a stronger foreign accent may elicit more negative listener perceptions of a speaker, mediated by processing fluency induced by more difficult processing conditions. Our observation that perceptions of working class correlated strongly with both aggressiveness and criminality may be mirroring this mediating effect, whereby it is the perception of low status that engenders assumptions about how a speaker is likely to behave, rather than the accent itself. It is possible that listeners make these assumptions in a sort of hierarchical or causal manner – a speaker sounds low-status, therefore he is more likely to, e.g., commit vandalism. This is an interesting finding in and of itself and further raises the question of how perceived status interacts with the strength of a regional accent, especially in light of the findings from Dragojevic et al. (2017). If some accents, such as Liverpool or Bradford, are perceived as particularly ‘working class’, do they sound more working class and/or criminal the stronger and more stereotypical the accent is? Do non-standard varieties with higher perceptions of status-based traits, such as Glasgow and Belfast, also sound more working class and/or more likely to commit crimes, when the accent is stronger? We recommend future research replicates the method in the present study with strength of accent controlled for in the stimuli, to explore whether stronger regional accents are consistently judged to sound more working class and/or criminal than weaker ones, or whether this interacts with specific accents.
4.4 Limitations
It is both a practical consideration and a limitation that much research in the field of forensic phonetics focuses on men, as the majority of forensic casework is conducted on men’s voices. So as not to introduce further confounding variables, the decision was made to use only men’s voices for this experiment. Conclusions drawn from this study should therefore be limited to male speakers of these varieties. The decision to use audio stimuli rather than accent labels was motivated by replicating the experience of a lay-listener in the criminal justice system. Due to limitations on available suitable material (high quality recordings of spontaneous speech from a male speaker), this study chose to use only one voice per accent. This had the further benefit of minimizing listener fatigue; one of the research aims was to investigate a broad range of accents and evaluating more than one example for 10 accents would have extended the duration of the experiment to an unreasonable degree. As previously discussed, when listeners express judgements about speakers based on their regional accent, they are projecting assumptions based on stereotypes held about people from the location where they believe the speaker to be from, rather than some inherent properties of the phonetics or acoustics of that accented variety (e.g., Cole, 2021). However, the individual voices may well have had other qualities (other than pitch or articulation rate, which were controlled for) that listeners picked up on that influenced their perception of the speakers. Concerns have been raised to suggest that the speech of one individual cannot represent an entire geographical area (see discussion in McKenzie and Carrie, 2018); however, voices were assessed by the authors, as well as other linguists on the project team, to determine that they were suitably representative of their regional accent. As such, a limitation of this study is that our results may not always be solely tapping into judgements of the intended regional varieties, and this may explain some of our more surprising results, such as for the Newcastle and Birmingham speakers. Despite this limitation, the fact that our results largely follow trends of accent stereotype judgements that have been previously conducted validates our methodological choices. Future research in this area should nevertheless look to replicate this experiment with multiple voices for each regional accent.
5 Conclusion
This research reveals some important insights into the assumptions listeners may make when hearing someone’s voice, that can play into decisions within the criminal justice system. There are three main findings emerging from this study. First, the ‘standard’ SSBE accented speaker in our experiments was judged more positively in terms of status measures than the ‘non-standard’ regionally accented speakers, as we predicted. We also predicted that the regionally accented speech would be rated more highly than SSBE in terms of solidarity traits, but this was only true of the Cardiff speaker, patterning with previous findings for non-English regional varieties. The Liverpool, Newcastle, Bradford and London speakers rated the poorest for both ‘status’ and ‘solidarity’ statement groups. Second, the SSBE speaker was judged as less likely to commit most criminal offences than the regionally accented speakers. Again, the Liverpool and Bradford voices rated particularly poorly in this regard. This generalization does not include sexual assault, as listeners judged the SSBE speaker to be more likely to commit this offence than the majority of other speakers. We have suggested that this is reflective of different perceptions of sex crimes and different stereotyped judgements about perpetrators. Finally, we expected to observe a correlation between trait ratings and behaviour judgement, such that more negative trait judgements will be associated with greater expectations of criminality. We found that positive judgements of status traits were associated with lower expectations of criminal behaviours. The same association was not observed for solidarity traits. Higher ratings for aggressiveness correlated with listeners judging speakers more likely to commit morally bad behaviours including a sex offence, although no meaningful relationship was found between these behaviours and perceived social status. Again, these results show that listeners differentiate between the types of people that they think are likely to commit sex crimes and other crimes. Important findings emerge about perceptions of speakers as being ‘working class’. As a trait, as is expected, it patterned exactly opposite to status traits and there was a significant correlation between high working-class ratings – and, intuitively, low status ratings – and both aggressiveness and likelihood to commit crimes.
This study makes an original contribution to the understanding of voice perception and accent judgements in forensic contexts. It is differentiated from the other work in this area by virtue of both the range of accents and range of behaviour types that it considers. Typically, studies have focused on one or two criminal offences and a small number of accents, generally comparing results for characteristically ‘blue collar’ and ‘white collar’ crimes. By testing judgements for a range of offence types that are not necessarily stereotypically associated with particular offender profiles, and by applying PCA to group behaviours together based on how listeners responded to them, we have advanced understanding of people’s perceptions of crimes and perpetrators. We have found that, for most crimes, people perceive their perpetrators as particularly low-status and working class. At the same time, this approach has revealed that sex offences, and potential perpetrators, are viewed differently by listeners, and do not appear to be associated with the same low status offender profiles as other crimes. Therefore, it is important to underline the fact that perceptions of ‘criminality’, or ‘guilty sounding’ accents, are not homogenous. Finally, by examining correlations between perceived traits and expected behaviours, we have validated these relationship in a statistical manner, while also exploring the way in which listeners make these assumptions in a potentially hierarchical manner. Future research should examine a further range of offence types and consider exploring further the relationships between people’s perceptions of criminality and other, non-criminal, behaviours. Future research could also make us of a broader range of voices for each accent to tease apart the effect of individual voices and the strength of regional accents.
These findings emphasize the fact that people carry with them their stereotyped judgements about accents when making attributions of guilt and this has serious implications for the criminal justice system. Prejudice in the criminal justice system can come from many factors, but unlike some types, for example racial prejudice, voice or accent-based prejudice is not currently something that jurors may be aware of or warned against letting it sway their decisions. This research has highlighted some ways in which a speaker’s accent can influence assumptions people make about them which could feed into decision making in a legal setting. It has also highlighted the importance of a nuanced analysis of voice-based prejudice in a forensic context, both regarding the range of voices and the variety of behaviour and crime types.
Data availability statement
The raw data supporting the conclusions of this article will be made available by the authors, without undue reservation.
Ethics statement
The studies involving humans were approved by University of Cambridge Faculty of Modern and Medieval Languages and Linguistics Research Ethics Committee. The studies were conducted in accordance with the local legislation and institutional requirements. The participants provided their written informed consent to participate in this study.
Author contributions
AP: Conceptualization, Data curation, Formal analysis, Investigation, Methodology, Project administration, Software, Validation, Visualization, Writing – original draft, Writing – review & editing. DW: Conceptualization, Methodology, Project administration, Supervision, Writing – original draft, Writing – review & editing. NB: Conceptualization, Methodology, Project administration, Supervision, Writing – review & editing. NP: Formal analysis, Software, Writing – review & editing.
Funding
The author(s) declare that financial support was received for the research, authorship, and/or publication of this article. This research was supported by the United Kingdom Economic and Social Research Council as part of the project Improving Voice Identification Procedures (IVIP), reference ES/S015965/1. Additional funding was provided by the Isaac Newton Trust.
Acknowledgments
The authors would like to thank the rest of the IVIP team for their incredibly valuable contributions and feedback: Kirsty McDougall, Francis Nolan, Harriet Smith, Peter Goodwin, Jeremy Robson and Katrin Müller-Johnson. The authors would also like to thank the reviewers for their insightful and helpful comments.
Conflict of interest
The authors declare that the research was conducted in the absence of any commercial or financial relationships that could be construed as a potential conflict of interest.
Publisher’s note
All claims expressed in this article are solely those of the authors and do not necessarily represent those of their affiliated organizations, or those of the publisher, the editors and the reviewers. Any product that may be evaluated in this article, or claim that may be made by its manufacturer, is not guaranteed or endorsed by the publisher.
Supplementary material
The Supplementary material for this article can be found online at: https://www.frontiersin.org/articles/10.3389/fcomm.2024.1462013/full#supplementary-material
Footnotes
1. ^International Dialects of English Archive (Meier, 2021).
2. ^WYRED (Gold et al., 2018).
3. ^Scots Syntax Atlas (Smith et al., 2019).
4. ^Eivind Torgersen, personal communication.
5. ^IViE (Grabe and Post, 2002).
6. ^DyViS (Nolan et al., 2009).
References
Anwyl-Irvine, A. L., Massonié, J., Flitton, A., Kirkham, N. Z., and Evershed, J. K. (2019). Gorilla in our midst: an online behavioural experiment builder. Behav. Res. Methods 52, 388–407. doi: 10.3758/s13428-019-01237-x
Audacity Team. (2021). Audacity(R): Free Audio Editor and Recorder. Version 3.0.0. Available at: https://audacityteam.org/
Axer, G. (2019). British accent perceptions and attributions of guilt by native and non-native speakers. J. Lang. Discrimination 3, 195–217. doi: 10.1558/jld.39970
Bartoń, K. (2022). MuMIn: Multi-Model Inference. R package version 1.0. Available at: https://CRAN.R-project.org/package=MuMIn.
Bates, D., Mächler, M., Bolker, B., and Walker, S. (2015). Fitting Linear Mixed-Effects Models Using lme4. Journal of Statistical Software, 67, 1–48. doi: 10.18637/jss.v067.i01
Bishop, H., Coupland, N., and Garrett, P. (2005). Conceptual accent evaluation: thirty years of accent prejudice in the UK. Acta Linguist. Hafniensia 37, 131–154. doi: 10.1080/03740463.2005.10416087
Boersma, P., and Weenink, D. (2022). Praat: doing phonetics by computer. Version 6.2.08. Available at: http://www.praat.org/ (Accessed February 5, 2022)
Cantone, J. A., Martinez, L. N., Willis-Esqueda, C., and Millerd, T. (2019). Sounding guilty: how accent bias affects juror judgments of culpability. J. Ethn. Crim. Justice 17, 228–253. doi: 10.1080/15377938.2019.1623963
Cole, A. (2021). Disambiguating language attitudes held towards sociodemographic groups and geographic areas in south East England. J. Linguist. Geogr. 9, 13–27. doi: 10.1017/jlg.2021.2
Coupland, N., and Bishop, H. (2007). Ideologised values for British accents. J. Socioling. 11, 74–93. doi: 10.1111/j.1467-9841.2007.00311.x
Derwing, T. M., and Munro, M. J. (2008). Putting accent in its place: rethinking obstacles to communication. Lang. Teach. 42, 476–490. doi: 10.1017/S026144480800551X
Dixon, J. A., and Mahoney, B. (2004). The effect of accent evaluation and evidence on a suspect's perceived guilt and criminality. J. Soc. Psychol. 144, 63–73. doi: 10.3200/SOCP.144.1.63-73
Dixon, J. A., Mahoney, B., and Cocks, R. (2002). Accents of guilt? Effects of regional accent, race, and crime type on attributions of guilt. J. Lang. Soc. Psychol. 21, 162–168. doi: 10.1177/02627X02021002004
Dovidio, J. F., and Gaertner, S. L. (1993). “Stereotypes and evaluative intergroup bias” in Affect, cognition, and stereotyping: Interactive processes in group perception. eds. D. M. Mackie and D. L. Hamilton (Cambridge, MA: Academic Press), 167–193.
Dragojevic, M. (2018). “Language attitudes” in Oxford research encyclopedia of intergroup communication. eds. H. Giles and J. Harwood, vol. 2 (Oxford: Oxford University Press), 179–192.
Dragojevic, M., Fasoli, F., Cramer, J., and Rakić, T. (2021). Toward a century of language attitudes research: looking back and moving forward. J. Lang. Soc. Psychol. 40, 60–79. doi: 10.1177/0261927X20966714
Dragojevic, M., Giles, H., Beck, A.-C., and Tatum, N. T. (2017). The fluency principle: why foreign accent strength negatively biases language attitudes. Commun. Monogr. 84, 385–405. doi: 10.1080/03637751.2017.1322213
Eckert, P. (2019). The limits of meaning: social indexicality, variation, and the cline of interiority. Language 95, 751–776. doi: 10.1353/lan.2019.0072
Frumkin, L. A. (2007). Influences of accent and ethnic background on perceptions of eyewitness testimony. Psychol. Crime Law 13, 317–331. doi: 10.1080/10683160600822246
Frumkin, L. A., and Stone, A. (2020). Not all eyewitnesses are equal: accent status, race and age interact to influence evaluations of testimony. J. Ethn. Crim. Justice 18, 123–145. doi: 10.1080/15377938.2020.1727806
Frumkin, L. A., and Thompson, A. (2020). The impact of different British accents on perceptions of eyewitness statements. J. Lang. Discrimination 4, 119–138. doi: 10.1558/jld.39368
Giles, H. (1970). Evaluative reactions to accents. Educ. Rev. 22, 211–227. doi: 10.1080/0013191700220301
Gluszek, A., and Dovidio, J. F. (2010). The way they speak: a social psychological perspective on the stigma of nonnative accents in communication. Personal. Soc. Psychol. Rev. 14, 214–237. doi: 10.1177/1088868309359288
Gold, E., Ross, S., and Earnshaw, K. (2018). The ‘West Yorkshire regional English database’: investigations into the generalizability of reference populations for forensic speaker comparison casework. Proceedings of Interspeech 2018, Hyderabad, pp. 2748–2752.
Goldman-Eisler, F. (1968). Psycholinguistics: Experiments in spontaneous speech. London: Academic Press.
Grabe, E., and Post, B. (2002). Intonational variation in the British Isles. Proc. Speech Prosody 2002, 343–346. doi: 10.21437/speechprosody.2002-71
Hamilton, D., Sherman, S., and Ruvolo, C. (1990). Stereotype-based expectancies: effects on information processing and social behavior. J. Soc. Issues 46, 35–60. doi: 10.1111/J.1540-4560.1990.TB01922.X
Hanani, A., Russell, M. J., and Carey, M. J. (2013). Human and computer recognition of regional accents and ethnic groups from British English speech. Comput. Speech Lang. 27, 59–74. doi: 10.1016/j.csl.2012.01.003
Harrell, F. (2022). HMISC: Harrell miscellaneous. R package version 4.7-1. Available at: https://CRAN.R-project.org/package=Hmisc.
Heblich, S., Lameli, A., and Riener, G. (2015). The effect of perceived regional accents on individual economic behavior: a lab experiment on linguistic performance, cognitive ratings and economic decisions. PLoS One 10, 1–16. doi: 10.1371/journal.pone.0113475
Hudson, T., de Jong, G., McDougall, K., Harrison, P., and Nolan, F. (2007). F0 statistics for 100 young male speakers of standard southern British English. 16th proceedings of the international congress of phonetic sciences, Saarbrücken, pp. 1809–1812.
Kassambara, A. (2023). _ggcorrplot: visualization of a correlation matrix using 'ggplot2'_. R package version 0.1.4.1. Available at: https://CRAN.R-project.org/package=ggcorrplot.
Kuznetsova, A., Brockhoff, P. B., and Christensen, R. H. B. (2017). lmerTest Package: Tests in Linear Mixed Effects Models. Journal of Statistical Software, 82, 1–26. doi: 10.18637/jss.v082.i13
Kurinec, C. A., and Weaver, C. A. (2019). Dialect on trial: use of African American vernacular English influences juror appraisals. Psychol. Crime Law 25, 803–828. doi: 10.1080/1068316X.2019.1597086
Lambert, W. E., Hodgson, R. C., Gardner, R. C., and Fillenbaum, S. (1960). Evaluational reactions to spoken languages. J. Abnorm. Soc. Psychol. 60, 44–51. doi: 10.1037/h0044430
Lenth, R. V. (2024). Emmeans: estimated marginal means, aka least-squares means (R package version 1.10.4). Available at: https://CRAN.R-project.org/package=emmeans.
Levon, E., Sharma, D., Watt, D. J. L., Cardoso, A., and Ye, Y. (2021). Accent bias and perceptions of professional competence in England. J. Engl. Linguist. 49, 355–388. doi: 10.1177/00754242211046316
Lippi-Green, R. (1997). English with an accent: Language, ideology and discrimination in the United States. New York: Routledge.
Llamas, C., and Watt, D. (2014). Scottish, English, British?: innovations in attitude measurement. Lang. Linguist. Compass 8, 610–617. doi: 10.1111/lnc3.12109
Long, D. (1999). “Geographical perceptions of Japanese dialect regions” in The handbook of perceptual dialectology. ed. D. Preston, vol. 1 (Philadelphia, PA: Benjamins), 177–198.
McKenzie, R. M., and Carrie, E. (2018). Implicit-explicit attitudinal discrepancy and the investigation of language attitude change in progress. J. Multiling. Multicult. Dev. 39, 830–844. doi: 10.1080/01434632.2018.1445744
McKenzie, R. M., and McNeill, A. (2022). Implicit and explicit language attitudes: Mapping linguistic prejudice and attitude change in England. London: Routledge.
Meier, P. (2021). International dialects of English archive. Available at: http://dialectsarchive.com.
Nolan, F. (2003). A recent voice parade. Int. J. Speech Lang. Law 10, 277–291. doi: 10.1558/sll.2003.10.2.277
Nolan, F., and Grabe, E. (1996). Preparing a voice lineup. Int. J. Speech Lang. Law 3, 74–94. doi: 10.1558/ijsll.v3i1.74
Nolan, F., McDougall, K., de Jong, G., and Hudson, T. (2009). The DyViS database: style-controlled recordings of 100 homogeneous speakers for forensic phonetic research. Int. J. Speech Lang. Law 16, 31–57. doi: 10.1558/ijsll.v16i1.31
Pickett, J. T., Mancini, C., and Mears, D. (2013). Vulnerable victims, monstrous offenders, and unmanageable risk: explaining public opinion on the social control of sex crime. Criminology 51, 729–759. doi: 10.1111/1745-9125.12018
R Core Team (2021). R: A language and environment for statistical computing. Vienna, Austria: R Foundation for Statistical Computing.
Revelle, W. (2024). Psych: Procedures for psychological, psychometric, and personality research. (R package version 2.4.6). Northwestern University. Available at: https://CRAN.R-project.org/package=psych.
Rickford, J. R., and King, S. (2016). Language and linguistics on trial: hearing Rachel Jeantel (and other vernacular speakers) in the courtroom and beyond. Language 92, 948–988. doi: 10.1353/lan.2016.0078
Romero-Rivas, C., Morgan, C., and Collier, T. (2022). Accentism on trial: categorization/stereotyping and implicit biases predict harsher sentences for foreign-accented defendants. J. Lang. Soc. Psychol. 41, 191–208. doi: 10.1177/0261927X211022785
Rosa, J., and Flores, N. (2017). Unsettling voice and language. Toward a raciolinguistic perspective. Lang. Soc. 46, 621–647. doi: 10.1017/S0047404517000562
Seggie, I. (1983). Attribution of guilt as a function of ethnic accent and type of crime. J. Multiling. Multicult. Dev. 4, 197–206. doi: 10.1080/01434632.1983.9994111
Sharma, D., Levon, E., and Ye, Y. (2022). 50 years of British accent bias: stability and lifespan change in attitudes to accents. Engl. World Wide 43, 135–166. doi: 10.1075/eww.20010.sha
Small, J. L. (2015). Classing sex offenders: how prosecutors and defense attorneys differentiate men accused of sexual assault. Law Soc. Rev. 49, 109–141. doi: 10.1111/lasr.12126
Smith, J., Adger, D., Aitken, B., Heycock, C., Jamieson, E., and Thoms, G. (2019). The scots syntax atlas. University of Glasgow. Available at: https://scotssyntaxatlas.ac.uk.
Smith, H. M. J., Bird, K., Roeser, J., Robson, J., Braber, N., Wright, D., et al. (2020). Voice parade procedures: investigating methods of optimising witness performance. Memory 28, 2–17. doi: 10.1080/09658211.2019.1673427
Tompkinson, J. (2015). “Accent evaluation and the perception of spoken threats”, in Proceedings of the third Postgraduate and Academic Researchers in Linguistics at York conference (PARLAY 2015). University of York, UK, 115–131.
Tompkinson, J. (2023). Spoken threats from production to perception. Cambridge: Cambridge University Press.
Watson, K., and Clark, L. (2015). Exploring listeners’ real-time reactions to regional accents. Lang. Aware. 24, 38–59. doi: 10.1080/09658416.2014.882346
Woods, K. J. P., Siegel, M., Traer, J., and McDermott, J. H. (2017). Headphone screening to facilitate web-based auditory experiments. Atten. Percept. Psychophys. 79, 2064–2072. doi: 10.3758/s13414-017-1361-2
Keywords: forensic linguistics, accent discrimination, accent judgements, United Kingdom accents, forensic phonetics, forensic speech science, guilt perception
Citation: Paver A, Wright D, Braber N and Pautz N (2025) Stereotyped accent judgements in forensic contexts: listener perceptions of social traits and types of behaviour. Front. Commun. 9:1462013. doi: 10.3389/fcomm.2024.1462013
Edited by:
Antonio Bova, Catholic University of the Sacred Heart, ItalyReviewed by:
Kaori Idemaru, University of Oregon, United StatesEthan Kutlu, The University of Iowa, United States
Copyright © 2025 Paver, Wright, Braber and Pautz. This is an open-access article distributed under the terms of the Creative Commons Attribution License (CC BY). The use, distribution or reproduction in other forums is permitted, provided the original author(s) and the copyright owner(s) are credited and that the original publication in this journal is cited, in accordance with accepted academic practice. No use, distribution or reproduction is permitted which does not comply with these terms.
*Correspondence: Alice Paver, YWVncDJAY2FtLmFjLnVr