95% of researchers rate our articles as excellent or good
Learn more about the work of our research integrity team to safeguard the quality of each article we publish.
Find out more
ORIGINAL RESEARCH article
Front. Commun. , 09 March 2023
Sec. Health Communication
Volume 8 - 2023 | https://doi.org/10.3389/fcomm.2023.1008108
 Luna Kinoshita1
 Aya Goto2*
 Satoko Okabe3
 Kenichi Satoh4
 Kaori Honda2
 Kimiko Ueda5
 Michio Murakami6†
 Kenneth E. Nollet7
To investigate school-age children's perspectives on food and nutrition, we pilot tested a method to quantify and analyze crayon drawings collected from students in health education classes at two elementary schools in Fukushima, Japan. Included were 28 students in a mixed class of first and second graders and 26 students in a fourth-grade class. Specific foods, general shapes, and color choices in children's drawings were entered into a spreadsheet and analyzed quantitatively. From first- and second-graders' data, co-occurrence network analysis put meals into three groups: at home, eating out, and lunch boxes. Among fourth graders, co-occurrence network analysis called attention to the cucumber, noteworthy for being a local agricultural product. In addition, students who drew more side dishes also drew more staple foods and main dishes (p = 0.04), used more colors (p = 0.006), and showed satisfaction with their community (p = 0.04). These results suggest that students' understanding of eating was centered on the places where they eat and that they valued regional specialty products. Furthermore, the drawing of side dishes was indicative of a balanced diet, which in turn was associated with higher satisfaction with their community. Our trial indicates that children's drawings can be a useful tool for adults to grasp children's understanding of health-related information in daily living.
A major disaster often sheds light on vulnerable populations and neglected social issues. After the 2011 Great East Japan Earthquake, followed by Fukushima nuclear disaster, the Sendai Framework for Disaster Risk Reduction stated that “Children and youth are agents of change and should be given the space and modalities to contribute to disaster risk reduction” (United Nations International Strategy for Disaster Reduction, 2015). Immediately after the disaster, Fukushima Medical University implemented a Pregnancy and Birth Survey within the broader Fukushima Health Management Survey to monitor local mothers' and children's health and to provide support for those in need. The survey revealed that a high proportion of mothers were depressed and worried about their children's health, so telephone counseling was provided to actively listen to mothers' concerns and empower them to make their own decisions in order to alleviate concerns about rearing children in Fukushima (Ishii et al., 2022).
In contrast to the voices of mothers being heard, more attention was needed to understand and promote roles that children can take in disaster recovery. This reflection on the 2011 disaster experience prompted our design and implementation of a “Creative Health” project to engage school children (Goto et al., 2022). Creative Health activities include children measuring, drawing, and acting about their health, their food, and their place of residence. These shared interactions aim to facilitate students' scientific and creative thinking, working in teams, presenting, and expressing their opinions. Children explore and express how to do things differently to build healthier bodies and more resilient communities. Previous reports evaluating our Creative Health project in general (Goto et al., 2022) and its theater-based approach in particular (Lloyd Williams and Goto, 2022) showed that children became more positive about their health and community, and adults became more aware of the importance of children's perspectives.
This report focuses on a drawing activity in the Creative Health project. Drawing has been used in the psychology field to extract children's opinions (Burgess and Hartman, 1993). One example method is the House-Tree-Person Drawing Test, which asks a child to draw a house, a tree, and a person to assess personal traits and mental health (Guo et al., 2022). There is growing interest in using drawing to facilitate communication with children in wider fields (Rollins, 2005; Kirby et al., 2022). One meta-analysis of studies that tested drawing as part of an interview technique showed that it expanded the content of children's responses (Driessnack, 2005). Aiming to understand children's perspectives on food and nutrition, we pilot-tested a quantitative analysis of children's drawings collected in our Creative Health project. In particular, we analyzed frequencies of—and associations among—items that appeared in children's drawings.
We analyzed children's drawings of their daily meals as part of a Creative Health program conducted at two elementary schools in Fukushima Prefecture, Japan.
The drawings were collected from first and second graders (6–8 years old) in 2019, and from fourth graders (10–11 years old) in 2021 (Table 1). Among 28 first- and second-grade students, five were in a special needs class. Among 26 fourth graders, one was in a special needs class.
Students were given a scenario that “You are going to have lunch after playing outside with your family” and were asked to draw a lunch using pastel crayons with a 15-color palette (school standard). Some students used additional colors. After drawing, the first and second graders were asked “What will you do before you eat?,” “What kind of lunch will you have?,” and “Who will prepare the lunch?” The fourth graders discussed ways to make the drawn meal better balanced.
Data were available from a 2021 self-administered survey of fourth graders (Table 1). We asked students at the end of a health education class, “How do you feel about the place where you live?” Answers were solicited on a 1–5 scale of face icons, with 1 associated with a neutral expression and 5 associated with the happiest expression. The questions were developed to assess the Creative Health project, reported elsewhere (Goto et al., 2022).
Two researchers (first and fifth authors) reviewed and codified the drawings into a data set. Colors were named in accord with a standard 15-color elementary school palette, to which we added white. Each researcher independently listed food items and colors. Food items included names of dishes and ingredients that were visible. For example, miso soup was counted as one dish including two visible ingredients: tofu and seaweed. Dishes were listed by referring to the Dietary Balance Guide of Japan's Ministry of Agriculture, Forestry and Fisheries, but portion sizes were not recorded because they could not be reliably determined from the drawings. Items not recognizable as foods were classified into shapes, e.g., square, circle, and triangle. Both researchers then compared their data sets and resolved discrepancies by consensus to render a final data set in English.
Survey data were analyzed using SPSS version 25 for Windows and R version 4.2.0 (R Core Team, 2022). For the 2019 first- and second-graders' data, the number of food items drawn was dichotomized by median as an indirect index of dietary balance, following advice by a registered dietitian (third author), and its association with each individual item was analyzed using the chi-square test. For the 2021 fourth graders' data, drawing side dishes was considered as an indirect index of dietary balance, and the same analyses were repeated. The fourth graders' data comprised what was derived from the self-administered survey, and students' satisfaction with their community was included in the analysis.
Relationships between foods were visualized by co-occurrence network analysis. Food items in a co-occurrence node were represented graphically with the same color, and connections were determined by Jaccard distances, derived from text analysis (Figures 1, 3). Category labels of food items were assigned by the third author through discussion with colleagues who were also registered dietitians.

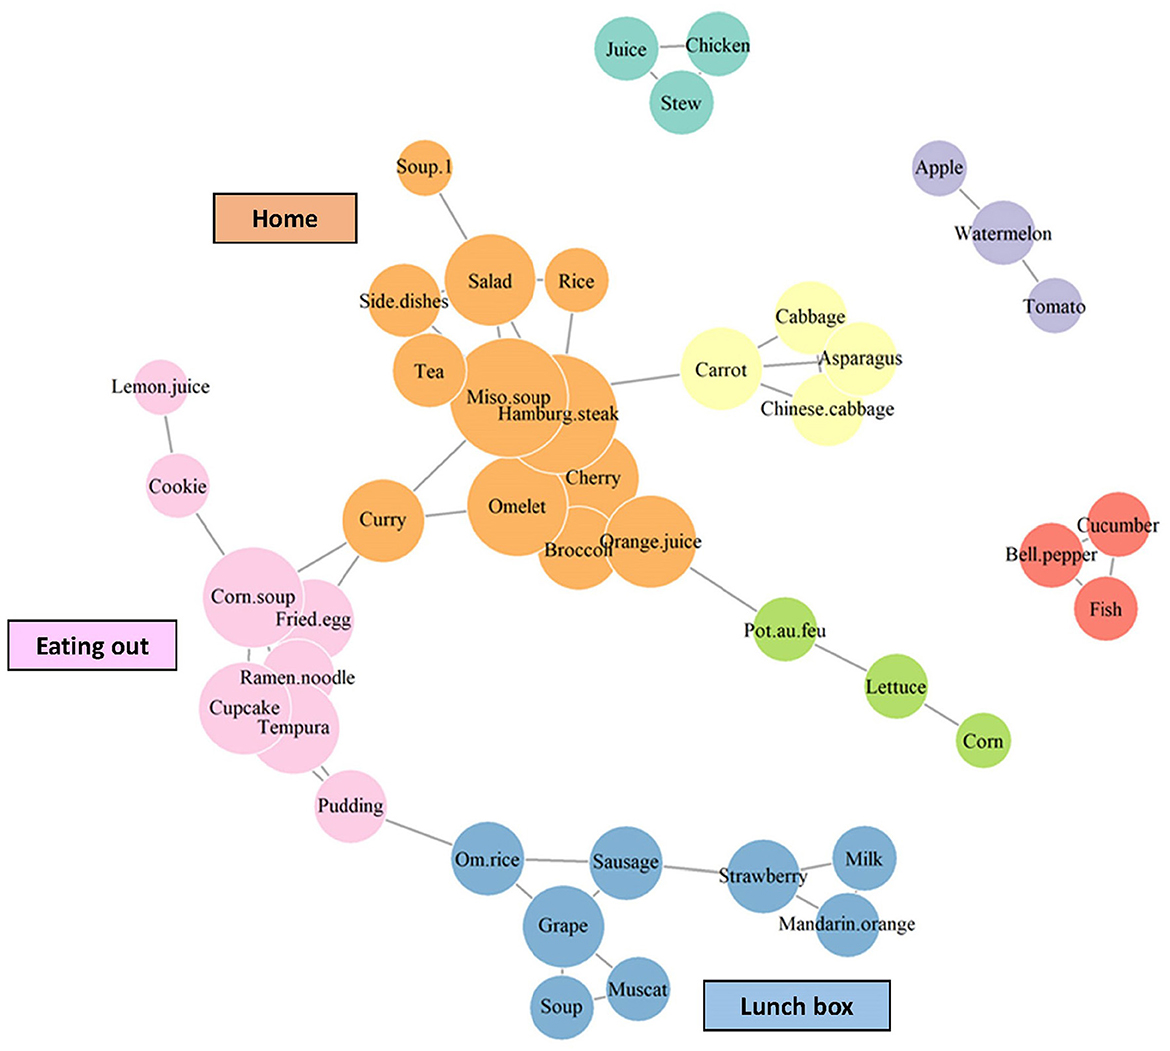
Figure 1. Co-occurrence network of food items in drawings of first and second graders. The size of an item's circle corresponds to the number of lines connecting it to other items. Unique colors are used to identify nodes defined by Jaccard similarity coefficients.
The 2019 data were collected anonymously in a pilot project preceding the Creative Health program, so its analysis could proceed without ethical review, in accordance with ethical guidelines for medical research on human subjects promulgated by Japan's Ministry of Education, Culture, Sports, Science and Technology (MEXT) and the Ministry of Health, Labor and Welfare (MHLW). The 2021 data were collected in the Creative Health project, as approved by the Ethics Committee of Fukushima Medical University (General 2020-060, 16 July 2020).
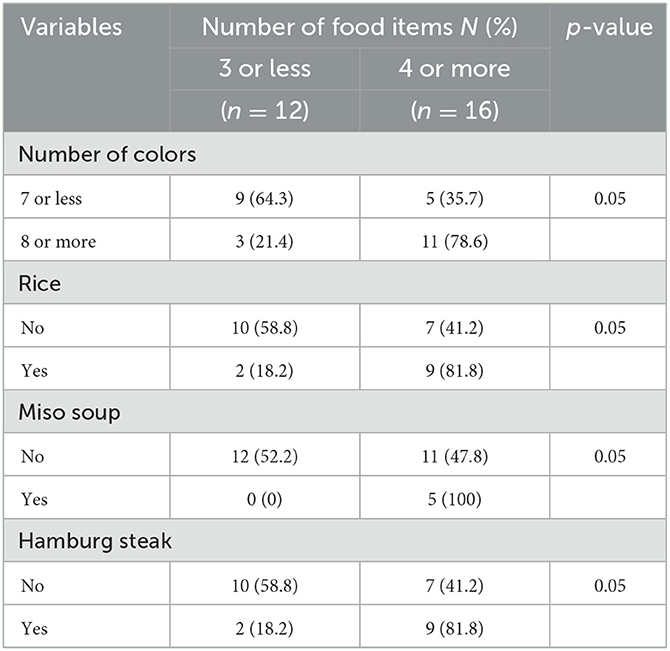
In total, 48 different food items, five shapes, and 16 colors were identified in the children's drawings. Typical food items included rice, Hamburg steak, salad, miso soup, and cherries. Typical shapes included lines, ovals, triangles, and squares. The median number of food items drawn was 4, with 16 students (57%) drawing 4 or more items. The median number of colors used was 8, with brown, yellow, red, and green used frequently, followed by white and black. Only findings with a statistical significance of 0.05 or lower are presented in the tables. Items significantly associated with the number of food items (an indirect indicator of dietary balance) were the number of colors, rice, Hamburg steak, and miso soup (all p = 0.05 in Table 2). There was also a significant association between being in a special needs class and drawing an oval (p = 0.026, data not shown). The oval was drawn by 80% of students with special needs vs. 21.7% of all other students. In the co-occurrence network analysis, drawn items were classified into three groups: at home, eating out, and lunch boxes (Figure 1). In the figure, the size of an item's circle corresponds to the number of lines connecting it to other items. Figure 2 is a typical drawing of items in the “home” group. A traditional Japanese meal at home includes a main dish, soup, and rice. The “lunch box” group included sausages sliced into an octopus shape (indicated simply as “sausage” in Figure 1), which is common in a Japanese lunch box made for children. The “eating out” group included ramen noodles, an economical eating-out choice widely available where the students live.

Table 2. Associations between the total number of food items in children's drawings with the number of colors they use and specific foods that they draw.
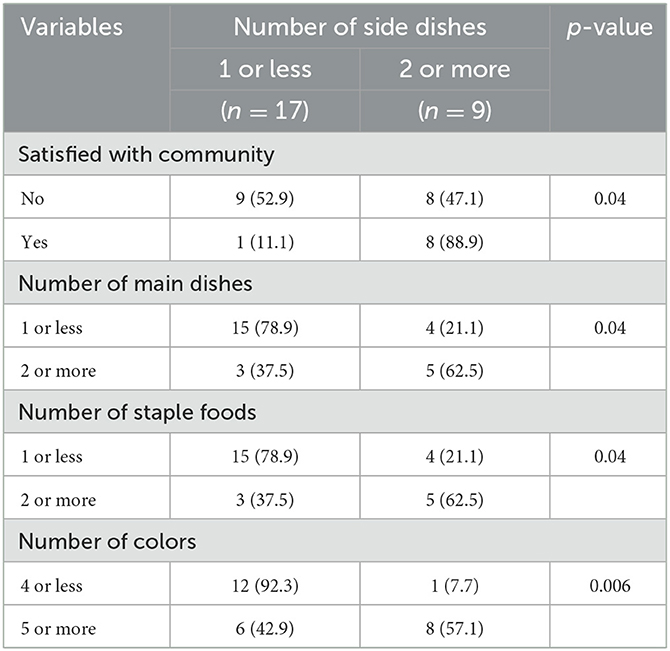
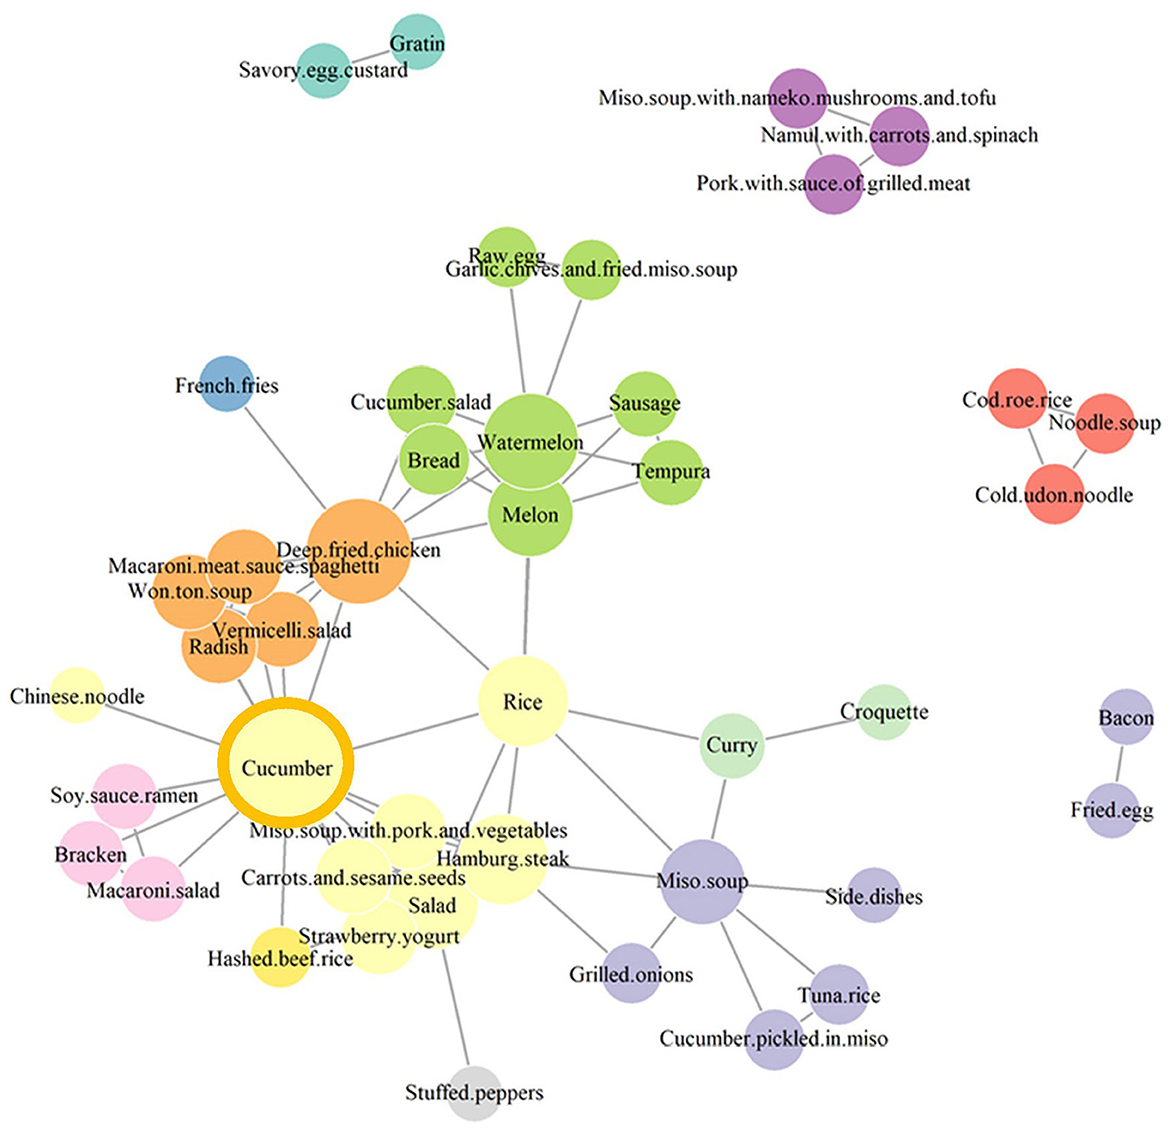
Items identified in the drawings included 18 staple foods, 27 main dishes, 24 side dishes, and three fruits; the number of colors used was 15. Statistically significant findings are shown in Table 3. Specifically, students who drew more side dishes were satisfied with their community (p = 0.04), and along with more side dishes, more staple foods and main dishes were drawn (p = 0.04), and more colors were used (p = 0.006). In the co-occurrence network, an indicator of centrality was highest for the cucumber (Figure 3), a regional agricultural product that, when pickled, is consumed throughout Japan. Figure 4 is a drawing of a typical Japanese meal including pickled cucumber as a side dish.

Table 3. Statistically significant associations between the number of side dishes that children draw and satisfaction with their community of residence and the number of other items that comprise their drawing.

Figure 3. Co-occurrence network of food items in drawings of fourth graders. The size of an item's circle corresponds to the number of lines connecting it to other items. Unique colors are used to identify nodes defined by Jaccard similarity coefficients.
This pilot study showed that how Japanese elementary school children perceive and portray their meals could be interpreted quantitatively for subsequent textual analysis. Drawings from students in lower grades included locations, and drawing more food items was associated with drawing a typical meal set. Higher grade students placed a regional food product in the center of their drawings, and being satisfied with their community was associated with drawing more side dishes. Our findings suggest how children's focus on foods expands from the dinner table to the community. Emmett et al. (2015) reviewed nutrition publications from the Avon Longitudinal Study of Parents and Children in the United Kingdom, and reported changes in a dietary pattern among children, which was associated with family socioeconomic status. The drawing method as piloted in our study can potentially provide context and a deeper understanding of such quantitative data on children's dietary behaviors.
Similar to our study, a cross-cultural study published in 2021, conducted in Denmark and Lithuania, used children's drawings of meals to explore their food preferences (Rageliene, 2021). In that study, children were asked to name the foods in their drawings, from which researchers created a textual database for content analyses. Our study encoded items like dishes, visible ingredients, and colors—directly identified in children's drawings—for quantitative analyses. This text analysis helped us extract possible underlying meanings in children's drawings. Our methods and results indicate that drawing can be a useful tool for adults to assess children's understanding of and preferences for meals, which, in turn, could guide steps to improve their diet and further facilitate children's understanding of their community. A Creative Health collaborator not directly involved in the present study inspired some aspects of our current approach through a model post-disaster project published in 2017, conducted jointly by Lancaster University and Save the Children UK. They applied 3-D model craft and performance-based methods to understand children's experiences of floods (Lloyd Williams et al., 2017). Such a participatory approach provided children a safe space to recall experiences, share stories with peers, and voice their needs. Likewise, our drawing method could be a creative approach to draw, visualize, and help adults understand children's ideas, which could lead to mobilizing a wider community for restoration in response to a disaster or crisis. For example, Kirby et al. (2022) used the drawing method to investigate children's perceived uncertainty about the world during the COVID-19 pandemic. More awareness raising is needed among public health practitioners about using arts when working with children. Incorporating visual art-based training has been gaining attention in medical education for improving students' clinical skills (like observational skills and empathy; Alkhaifi et al., 2022), but the training could also serve as an opportunity for them to gain skills to use creative arts in communicating with their patients and people in a wider community. As such, the first author of the present study was a medical student.
Among first and second graders, students who drew more food items were likely to draw a typical meal set such as a combination of rice as a staple food, Hamburg steak as a main dish, together with miso soup, a traditional Japanese menu item. In addition, these children used more colors. Interestingly, the co-occurrence network of food items suggested that children perceived eating according to location: at home, dining out, and lunch boxes. The “obento” lunch box also reflects Japanese culture. It traditionally includes rice, meat or fish, and vegetable, with artful arrangement and a balance of colors considered to be important. Previous studies among Japanese elementary and high school students reported that the setting and atmosphere of meals have a strong impact on nutrition awareness and mental health (Kawasaki, 2001; Sasaki et al., 2003).
Of note, the association between being in a special needs class and drawing an oval likely reflects developmental milestones. Not only understanding of food, but also, drawing skills, depend on age and developmental stage. Drawing ability improves only moderately between second and third grades, but tracing ability in particular improves significantly due to attentional focus and cognitive development (Cohen et al., 2021). Thus, the inclusion of drawing in nutrition education should take account of children's developmental stages.
Among fourth graders, the cucumber had high centrality in co-occurrence analysis. It is a regional agricultural product where they live. Similarly, the co-occurrence of Ramen noodles with “eating out” among first- and second-grade students may be related to Fukushima Prefecture's rank within the top 10 of 47 Japanese prefectures for high consumption of ramen when eating out (Statistics Bureau of Japan, 2021). It might be inferred that children learn about the place they live and local foods through their daily meals. Furthermore, we found that fourth graders who drew more side dishes were more satisfied with their community. Drawings with more side dishes also included more staples and main dishes, and were drawn with more colors, suggesting a balanced meal. The aforementioned study from Denmark and Lithuania reported cultural differences about vegetables accompanying meat products in children's favorite meals (Rageliene, 2021).
Major limitations of our pilot study include the small number of students included and a lack of background information on students and their families. A larger cohort would yield more robust data, but interpretation of student drawings is labor-intensive. The identification of food items and their colors could be done more efficiently with automated image analysis. The prerequisite machine-learning for such analysis would, based on our pilot, be worthwhile. We anticipate further investigation of drawings taking account of children's developmental levels. Progress in this area would make our research, and the societal objectives that we aim to serve, more inclusive.
While our pilot study leaves much room for improvement, its results are informative enough to justify further efforts that use drawings and their quantitative analyses to understand children's perspectives, from those of us working in Japan, and from international colleagues. We dare to imagine that such research will emerge from other countries and cultures that, collectively, will advance adult understanding of how children view their foods and their communities. In turn, children can be empowered as agents of change in a changing world.
The datasets presented in this article are not readily available because IRB approval of the present study (fourth graders' data) limits data access to the research team. Requests to access the datasets should be directed to AG, YWdvdG9AZm11LmFjLmpw.
The studies involving human participants were reviewed and approved by Ethics Committee of Fukushima Medical University (General 2020-060, 16 July 2020). Written informed consent to participate in this study was provided by the participants' legal guardian/next of kin.
AG, SO, KU, MM, and KN contributed to the study design. LK and KH contributed to data curation. LK and KS contributed to data analysis. LK contributed to write the first draft. All authors to the interpretation of results and revisions to the manuscript.
This research was funded by the Japan Society for the Promotion of Science Grants in Aid for Scientific Research (Nos. 19KK0060 and 19K03120).
We thank all students and teachers who worked with us in the Creative Health Project.
The authors declare that the research was conducted in the absence of any commercial or financial relationships that could be construed as a potential conflict of interest.
All claims expressed in this article are solely those of the authors and do not necessarily represent those of their affiliated organizations, or those of the publisher, the editors and the reviewers. Any product that may be evaluated in this article, or claim that may be made by its manufacturer, is not guaranteed or endorsed by the publisher.
Alkhaifi, M., Clayton, A., Kangasjarvi, E., Kishibe, T., and Simpson, J. S. (2022). Visual art-based training in undergraduate medical education: A systematic review. Med. Teach. 44, 500–509. doi: 10.1080/0142159X.2021.2004304
Burgess, A. W., and Hartman, C. R. (1993). Children's drawings. Child. Abuse. Negl. 17, 161–168. doi: 10.1016/0145-2134(93)90015-W
Cohen, E. J., Bravi, R., and Minciacchi, D. (2021). Assessing the development of fine motor control in elementary school children using drawing and tracing tasks. Percept. Mot. Skills. 128, 605–624. doi: 10.1177/0031512521990358
Driessnack, M. (2005). Children's drawings as facilitators of communication: A meta-analysis. J. Pediatr. Nurs. 20, 415–423. doi: 10.1016/j.pedn.2005.03.011
Emmett, P. M., Jones, L. R., Emmett, P. M., and Jones, L. R. (2015). Diet, growth, and obesity development throughout childhood in the Avon Longitudinal Study of Parents and Children. Nutr. Rev. 73, 175–206. doi: 10.1093/nutrit/nuv054
Goto, A., Lloyd Williams, A., Okabe, S., Koyama, Y., Koriyama, C., Murakami, M., et al. (2022). Empowering children as agents of change to foster resilience in Community: Implementing “Creative Health” in primary schools after the Fukushima nuclear disaster. Int. J. Environ. Res. Public Health 19, 3417. doi: 10.3390/ijerph19063417
Guo, Q., Yu, G., Wang, J., Qin, Y., and Zhang, L. (2022). Characteristics of House-Tree-Person Drawing Test in junior high school students with depressive symptoms. Clin. Child. Psychol. Psychiatr. 2022, 13591045221129706. doi: 10.1177/13591045221129706
Ishii, K., Goto, A., Yoshida-Komiya, H., Ohira, T., and Fujimori, K. (2022). Postpartum mental health of mothers in Fukushima: Insights from the Fukushima Health Management Survey's 8-year trends. J. Epi. 32, S64–S75. doi: 10.2188/jea.JE20210385
Kawasaki, S. (2001). Effect of the quality of diet, the frequency of co-eating, and the atmosphere at dining table on the mental health of junior high school students. J. Home Econ. 52, 923–935. doi: 10.11428/jhej1987.52.923
Kirby, P., Villani, M., and Webb, R. (2022). Children's COVID-19 writing and drawings and the existential imperative to educate for uncertainty. Child. Soc. 2022, 12573. doi: 10.1111/chso.12573
Lloyd Williams, A., Bingley, A., Walker, M., and Mort, M. M. E. (2017). “That's where I first saw the water…”: Mobilizing children's voices in UK flood risk management. Transfers 7, 76–93. doi: 10.3167/TRANS.2017.070307
Lloyd Williams, A., and Goto, A. (2022). “Theatres of resilience: Children as actors in community development in Fukushima,” in The Health, Wellbeing and Community Recovery in Fukushima, eds S. Abeysinghe, C. Leppold, A. Ozaki, and A. Lloyd Williams (London: Routledge) p. 155–170.
R Core Team (2022). R: A Language and Environment for Statistical Computing. Vienna: R Foundation for Statistical Computing. Available online at: https://www.R-project.org/ (accessed February 23, 2023).
Rageliene, T. (2021). Do children favor snacks and dislike vegetables? Exploring children's food preferences using drawing as a projective technique. A cross-cultural study. Appetite 165, 105276. doi: 10.1016/j.appet.2021.105276
Rollins, J. A. (2005). Tell me about it: Drawing as a communication tool for children with cancer. J. Pediatr. Oncol. Nurs. 22, 203–221. doi: 10.1177/1043454205277103
Sasaki, N., Katou, S., Tanaka, H., and Tokita, Y. (2003). Influence of meals with adults on elementary students' food consciousness, the food attitudes and the food knowledge. Jpn. Assoc. Home Econ. Educ. 46, 226–233. doi: 10.11549/jjahee.46.3_226
Statistics Bureau of Japan (2021). Household Expenditure Report. Available online at: https://www.stat.go.jp/data/kakei/5.html (accessed February 23, 2023).
Keywords: science in art, children, health literacy, Japan, quantitative analysis
Citation: Kinoshita L, Goto A, Okabe S, Satoh K, Honda K, Ueda K, Murakami M and Nollet KE (2023) Daily meals in context: A quantitative analysis of elementary school students' drawings. Front. Commun. 8:1008108. doi: 10.3389/fcomm.2023.1008108
Received: 31 July 2022; Accepted: 13 February 2023;
Published: 09 March 2023.
Edited by:
Nicola Mucci, University of Florence, ItalyReviewed by:
Charee Mooney Thompson, University of Illinois at Urbana-Champaign, United StatesCopyright © 2023 Kinoshita, Goto, Okabe, Satoh, Honda, Ueda, Murakami and Nollet. This is an open-access article distributed under the terms of the Creative Commons Attribution License (CC BY). The use, distribution or reproduction in other forums is permitted, provided the original author(s) and the copyright owner(s) are credited and that the original publication in this journal is cited, in accordance with accepted academic practice. No use, distribution or reproduction is permitted which does not comply with these terms.
*Correspondence: Aya Goto, YWdvdG9AZm11LmFjLmpw
†Present address: Michio Murakami, Center for Infectious Disease Education and Research, Osaka University, Suita, Osaka, Japan
Disclaimer: All claims expressed in this article are solely those of the authors and do not necessarily represent those of their affiliated organizations, or those of the publisher, the editors and the reviewers. Any product that may be evaluated in this article or claim that may be made by its manufacturer is not guaranteed or endorsed by the publisher.
Research integrity at Frontiers

Learn more about the work of our research integrity team to safeguard the quality of each article we publish.