- Teachers College, Columbia University, New York, NY, United States
Introduction: This paper reports a time series analysis of day-to-day emotional text related to fund investments on Weibo (Sina Corporation, Beijing, China).
Methods: The present study employed web-crawler and text mining techniques through Python to obtain data from January 1, 2021 to December 31, 2021.
Results: Using an auto-regressive integrated moving average model and vector auto-regressive model, the results indicated that fund performance was a significant predictor of fear, anger, and surprise expressions on Weibo. A relationship among emotions within a certain single fund was not found, but textual emotions could be predicted by ARIMA models within emotions.
Discussion: The findings provide insight for media emotion analysis combining linguistic and temporal dimensions in both the communication and psychology disciplines.
1. Introduction
Watching the stock index turning green or red can be accompanied by significant psychological changes among shareholders. When to sell short, to buy at the bottom, or to leverage are essential decisions for shareholders to make that must be made wisely. In the finance behavioral discipline, researchers look at emotion and its physiological representations along with financial decision-making. In previous studies, a relationship between years of trading experience, heart rate variation, and trading performance was reported (Kandasamy et al., 2016). Similar results were found in other studies on investment banking activities and the financial decision-making process (Quartz, 2009; Martin and Delgado, 2011; Fenton-O'Creevy et al., 2012). In addition, in social psychology, numerous studies have investigated the process of emotion change interacting with financial and media activities. Some studies found emotion to be highly associated with investment and digital media use (Bradley et al., 1996; Shiv et al., 2005).
Social networking sites (SNSs) are platforms the public may use to communicate emotional text. Linguistic features on SNS were found to have correlational patterns over time in previous media and linguistic studies, and the temporal aspect could be a crucial dimension of quantitative modelin (Koplenig, 2017; Tay, 2022). To extend research variety, this study considers messages involving investment-related emotional expression on Weibo (Sina Corporation, Beijing, China), which is one of the most commonly used platforms among Chinese SNS users, to investigate emotion forecasting models. Statistical models were used to study linguistic characteristics on social media for temporal pattern on SNS platforms (Tay, 2018, 2021). Since not much research has focused on statistic computation of social media emotion through quantitative linguistic method, the current study established a three-step filter model to collect real-time scraped SNS data. Emotional messages were categorized into six types, including fear, disgust, surprise, anger, happiness, and sadness, according to Basic Emotion Theory (Ekman, 1992). We then used a time series analysis to understand how emotion and fund performance in the past could be used to predict future fund-related emotional expression on Weibo.
1.1. Emotional as a result of socio-cultural practice
In recent laboratory experiments, emotion was considered to be a passive response following the perception of stimulus (Garrido and Schubert, 2011; Kramer et al., 2014; Luo, 2022). This study took the approach of psychology constructivism, considering emotion as a felt affective experience that occurred after engaging in fund-related activities. Psychology constructivists believe that, through relevant manipulation, the appraisal–emotion association could be assessed by statistical imputation (Zammuner, 1998; Kirkland and Cunningham, 2012). Additionally, a different family of emotion studies have defined emotions as a natural-kind and sharing universal properties (Ross, 2006; Izard, 2007). For instance, the well-known Basic Emotion Theory proposed six kinds of basic emotions, including joy, sadness, anger, fear, disgust, and surprise (Ekman, 1992). Later, scholars re-arranged six prototypical emotions into eight kinds, adding trust and anticipation with positive and negative bases (Plutchik, 1980) and even hierarchical structures across cultures (Shaver et al., 1992, 2001). Other scholars have constructed their own models and up to 22 distinct emotion prototypes (Clore and Ortony, 2013). The emotions in this study are categorized into six types according to Basic Emotion Theory.
The historical debate between natural-kind and psychological constructivist families has continued since researchers first dove into emotion studies from different disciplines. Some recent theoretical studies argue that these two families of emotion could coexist (Panksepp, 2007). In this paper, emotion refers to the result of socio-cultural practice (Jain, 1994; Boiger and Mesquita, 2012; Ahmed, 2013).
1.2. Emotional word in the context of China
Despite that different families of emotion studies have interchangeably led the research trend, emotions are pervasive among humans across languages. Mandarin is the official language used on Weibo. Because emotional expression on Weibo is defined as a socio-cultural experience, socio-cultural differences between China and Western cultures were essential to address in this investigation. Early literature tended to argue that expressions of emotions are universal (Boucher and Carlson, 1980; Ekman and Keltner, 1997), while more recent studies found that they vary among cultures, especially between Eastern and Western ones (Jack et al., 2012). Most literature agrees that basic emotion categories are prevalent universally, but public discourse is government-led in the context of China. Reactionary opinions against governmental authority are not allowed on any platforms, including Weibo. In addition, Chinese cultures are reportedly different from Western ones in dimensions such as individualism vs. collectivism and masculinity vs. femininity (Hofstede, 2001, 2003). Highly related to cultural values, emotional textual messages of lower intensity are embraced more often in China than Western cultures (Lim, 2016), and emotional expression patterns also differ across languages (Ng et al., 2019). As such, there arises a problem to be solved in textual emotion analysis studies through a cross-cultural lens due to a lack of consistency in the emotion lexicon built upon language systems. To date, researchers have developed cultural-specific emotion lexicons regarding odor and food in languages such as French, English, Chinese, and Portuguese (Chrea et al., 2009; King and Meiselman, 2010; Ferdenzi et al., 2013).
This study combined the two following emotion lexicons developed in English and Mandarin, which categorized emotions into six types (fear, disgust, surprise, anger, happiness, and sadness) according to Basic Emotion Theory. First, the Latest Universal Scale (Ferdenzi et al., 2013), having both English and Mandarin versions, contains the most common emotion terms across multiple geographic regions. Second, the Affective Lexicon Ontology in Mandarin has been the most comprehensive lexicon for some time (Xu et al., 2008). However, both emotion lexicons were published around a decade ago, before social media platforms became as widely used as they are in 2021. For thorough data collection, additional online emotion expression vocabulary was included in text mining (TM), which was the method of data collection used in this study.
1.3. Time series analysis and TM on emotion words
A time series analysis of emotional expression on Weibo was not found, although this platform has been widely applied to users to post emotion text and gather fund-related information (Chan et al., 2012). Existing time series analyses of emotion include mothers' negative emotions (Lorber and Smith Slep, 2005), Korean swimmers' Twitter posts (Bollen et al., 2011), digitalized melodies (Vaughn, 1990) and YouTuber channel linguistic features (Tay, 2021). Time series models were widely used for analytic and forecasting purposes in finance-related fields such as daily stock market across countries (Singh and Borah, 2014; Singh, 2021). However, we did not find a time series study of emotion words related to financial service products nor one in the context of Weibo in the literature.
Traditionally, sociopsychological studies of media communication have adopted research methods, such as surveys, experiments, and observations (Dill, 2013). With the emergence of SNSs, the SNS platforms immediately became viral communication methods that overtook traditional forms. The online environment was considered a fresh and essential field for socio-emotional and developmental–emotional analyses (Stein et al., 2008). By May 2018, Weibo reported over 400 million active users monthly (Shan et al., 2021). Weibo is one of the major SNS platforms for financial service consumers to express emotions, other than GuBa (Eastmoney, Shenzhen, China, a stock forum similar to Reddit), and WeChat (Tencent, Shenzhen, China), which are awaiting investigation as well.
The drastic change in SNSs two decades ago attracted researchers to develop new technologies for digital data collection (Sundar and Limperos, 2013). New computational methods, such as TM, have gained attention and validation among researchers since information digitalization has become the new trend (Tang and Guo, 2015). Under the umbrella term of TM, there exist various methods, including natural language processing, information retrieval, and lexical statistics (Chartier and Meunier, 2011). A substantial amount of linguistic emotion studies has adopted TM methods to investigate customer reviews (Li et al., 2020), user behavior (Waterloo et al., 2018), and post-pandemic mentality (Dubey, 2020) on SNSs.
To collect data with fund-relevant emotion words on Weibo, this study embedded both semi-supervised and supervised learning methods in a Python written program to scrape Weibo posts. Both methods were found to be effective in data classification and regression (Zhu and Goldberg, 2009; Koshorek et al., 2018).
2. Materials and methods
In 2021, the amount of public equity funds in China has reached 9,000 and exceed scale of 25 trillion RMB as the fourth largest national fund market. A total of 14,125 Weibo observations were collected from January 1, 2021, to December 31, 2021 across four quarters. Details of sample size determination, all data exclusions, all manipulations, and all measures in the study are reported in the following portion of the text. The dataset can be made available after contacting the author.
2.1. Sample
Only funds launched before October 2018 were considered in this study so as to avoid emotional bias due to pre-launch marketing, promotions, and the bleak performance of the whole fund market in the first quarter. To reduce industry and theme biases, this study sought out funds with various combinations. Three funds with medical, blue-chip, and consumption (liquor) themes, respectively, were selected, which were the Lombarda China Healthcare Mix Fund, E Fund Blue Chip Select Mix Fund, and China Merchants Liquor Index Fund.
2.2. Data collection
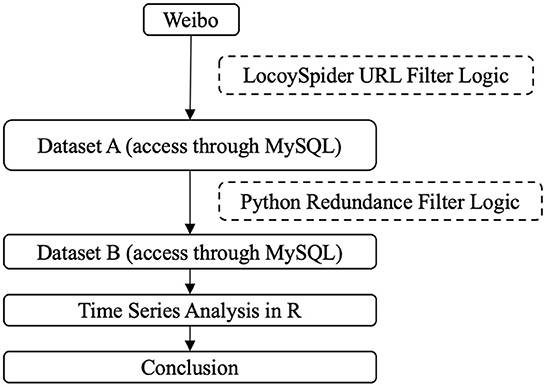
The present study adopted a semi-supervised web crawler technology to obtain data, then used a fully supervised TM method to extract topic-focused data. LocoySpider version 10.2 (Lewei, Hefei, China) was employed to obtain data with the following steps, as seen in Figure 1:
1. Web search domain. We used https://weibo.com/ as the seed set for URLs.
2. Simulation account login. We used a newly created Weibo account and typed in its username and password.
3. Filtering logic. The first filter was a keywords list, which consisted of combinations of companies, themes, and fund types in selected funds. Each combination needed to be semantically meaningful phrases; for instance, keywords for the China Merchants Liquor Index Fund included China Merchant (招商), Liquor (白酒), Index Fund (指数基金), and Fund (基金). Because Weibo has an amount limitation on each data-mining effort made from an external source like LocoySpider, the program was set to run repeatedly every hour.
4. Duplicate and upload data. LocoySpider replicated data meeting filtering logic and uploaded data, content, and URLs to dataset A.
The collected posts were only for data analysis of this research study and available in public domain to all Weibo users. All personally identifiable information were removed from dataset as well as in result reporting. The researchers did not have any interaction and connection with Weibo users, nor disclose personal messages between users. Therefore, no ethic approval was not required.
2.3. Data cleaning
Next, the TM method was applied for data cleaning. New data collected every hour in dataset A were assigned to a filter logic developed in the Python program because the same article could be published repeatedly by multiple sources on Weibo. For the purpose of deleting redundant data, we compared the repetition rate among the textual content of new hourly data and every URL in dataset A. After 2 months of testing, the filtering repetition rate was determined to be 92%. This means that, if the text contents of multiple URLs were ≥92% identical, only the earliest post would be kept, and later posts would be filtered out. Reposting was excluded from redundant observations, as the action amplified the same emotion as the original post (Yi et al., 2022). The filtered data then entered cleaned dataset B. The framework of this study is visualized in Figure 1. The Python scripts are available after contacting the author.
The web crawler and TM methods were tested from October 1, 2020, to December 1, 2020. Noticeably, English and Chinese have different grammar systems where negation words are either separate or not from emotional words. For example, “un-happy” in English would be presented as two separate words in Chinese (“not happy”). To avoid the ambiguity of negation words, a research assistant went through links included in the dataset in dataset B. The backend interface presented the assigned identification number of each link and the publication date and time, link, and title. The research assistant could perform a false delete, which temporarily removed data that included negation words near emotion words and changed the semantic meaning of the sentence. Then, the researcher could review the articles again. After 2 months of training, the inter-rater reliability reached 80%, and the research assistant was able to interpret the content through the researcher's lens.
2.4. Measurement
We employed two types of measurement of fund-relevant Weibo emotion and fund performance as shown below.
2.4.1. Daily emotion word frequency
After testing, the most frequently used 34 words were listed in the Weibo emotion word matrix. Because the Affective Lexicon Ontology in Mandarin (Xu et al., 2008) has not been updated in the 14 years since its publication, we decided to add two more trending emotion words used by a large population of shareholders on Weibo. A total of 36 words were categorized into six basic emotions (fear, surprise, disgust, anger, sadness, and happiness), with six words per basic emotion. Cleaned data in dataset B were accessed with the MySequel programming language. We noticed that some words in the keyword lists were not used throughout the year. Therefore, we decided to exclude the least frequently used two words of every basic emotion for data analysis, leaving four words with daily frequency counts for each. For example, words under fear are “怕(fear),” “吓人(frightening),” and “恐(afraid),” those under surprise are “讶(surprise),” “惊(startled),” and “奇(strange).” Frequency measurements among emotions and funds were independent, meaning that a post containing two emotions or funds would be counted twice.
2.4.2. Fund net worth
The daily unit net worth equals the funds' net market value minus the total liability, divided by the total amount of shares of the day. The daily cumulative net worth refers to the daily unit net worth plus an accumulative bonus available for shareholders. Both were obtained from EastMoney.com, which is a website containing funds information verified by the China Securities Regulatory Commission. Because the stock market opens on weekdays only, unit and cumulative net worth data were not available on weekends or legal holidays. To ensure the missing data pattern was completely at random, weekends and legal holiday observations (n = 122) were omitted from the data frame prior to further analysis.
2.5. Data analysis
The analytic emphasis of this paper focuses on Weibo emotions. We examined cleaned data from three perspectives: inter-emotion, inner-emotion, and net worth–emotion relationships. Two methods were employed, including graphical comparison and statistical model computation. Specifically, inter-emotion analysis aimed to discover the potential relationship between fear, surprise, disgust, anger, sadness, and happiness on Weibo within a single fund, while inner-emotion analysis looked at each emotion within and across funds in an identical time frame. Finally, the net worth–emotion analysis investigated the association between fund performance and Weibo emotion within a fund. The hypotheses of this paper are as follows:
- H1: All six emotions word frequency are predictable itself within a fund.
- H2: All six emotions word frequency are predictable by each other within a fund.
- H3: All six emotions word frequency are impacted by fund performance net worth within a fund.
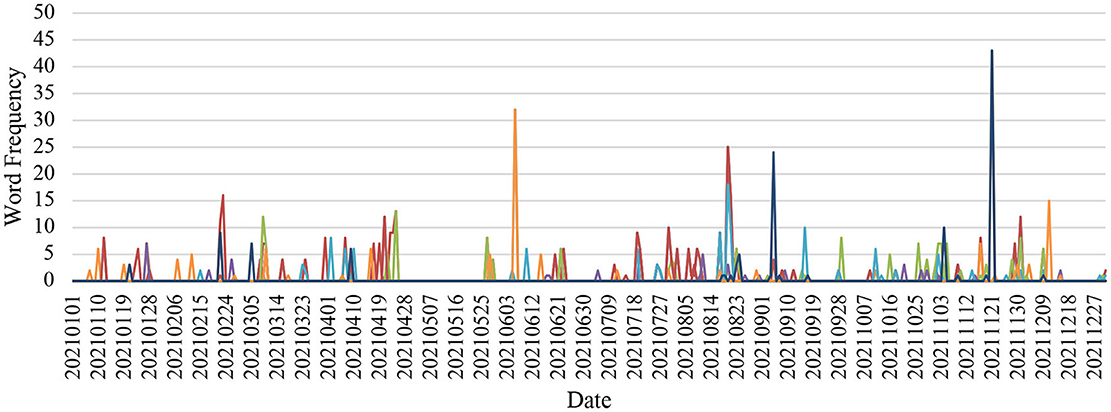
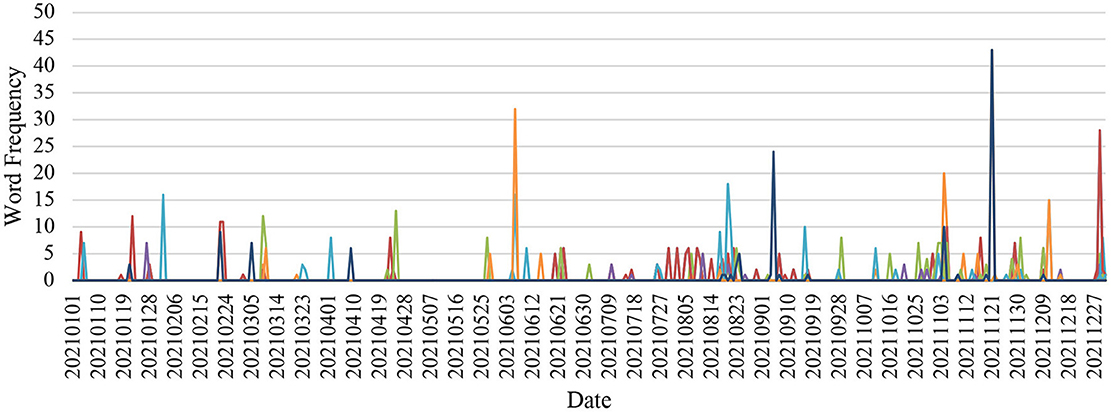
Starting with a graphical comparison, the initial analysis looked at the trend of variables in the same time window. Three time series figures of the Lombarda China Healthcare Mix Fund, E Fund Blue Chip Select Mix Fund, and China Merchants Liquor Index Fund, respectively, were plotted for visual comparison. Then, an auto-regressive integrated moving average (ARIMA) model was employed for time series model analysis of inner-emotions patterns. To satisfy assumptions for ARIMA modeling, we tested the stationarity of time series data with the augmented and applied differencing methods to remove the seasonality of non-stationary data. At the same time, the degree of differencing parameter (d) was calculated. Next, the auto-correlation function (ACF) and partial auto-correlation function (PACF) were examined to identify a range for lag order (p) and order of moving average (q) parameters in ARIMA (p, d, q) models. The time series in which ACF presented a gradually decreasing or geometric pattern, with PACF presenting a sudden cutoff after significant spikes, was tested for a possible auto-regressive (p, d, 0) model. Conversely, time series with the opposite characteristics were tested for the possible moving average (0, d, q) model, while those in which ACF and PACF both presented geometric or gradually decreasing patterns were tested for the auto-regressive moving average (ARMA) model. The model result tables were interpreted as follows:
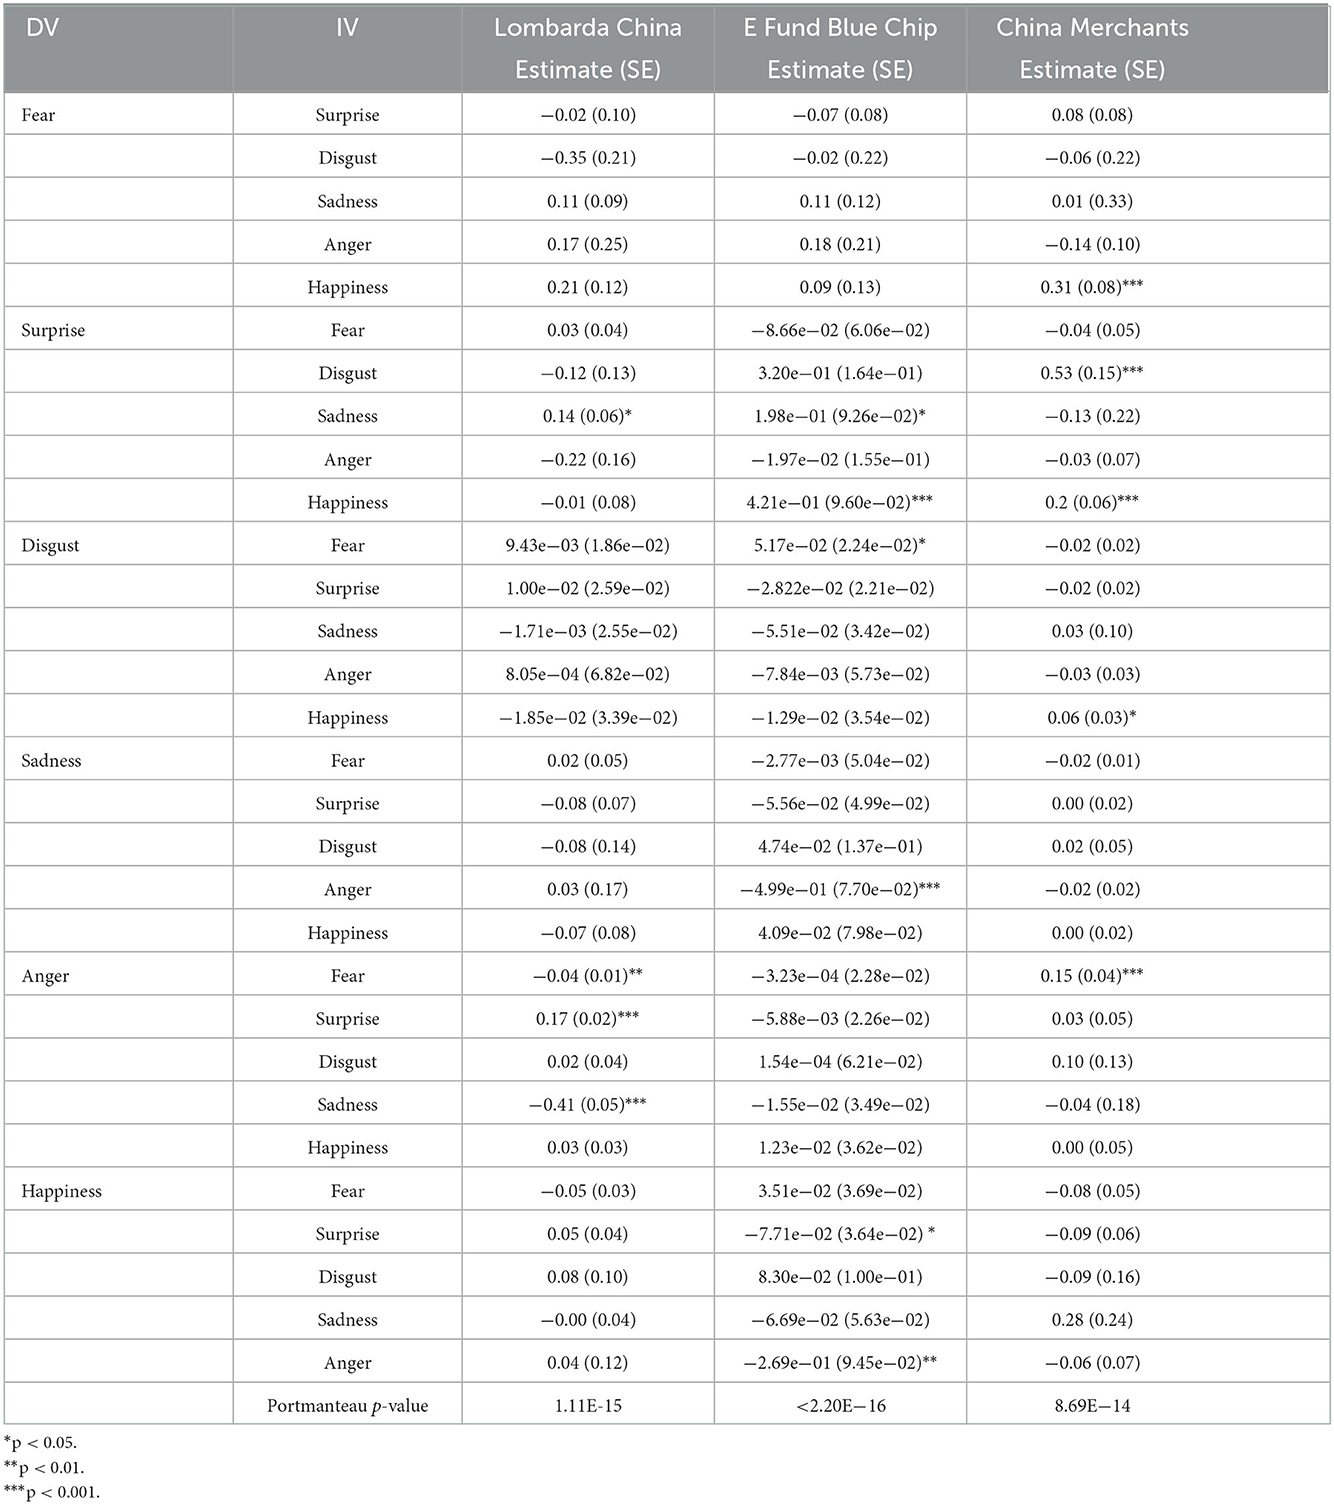
where is the variable being explained at time t, φ is the coefficient of each parameter p, and θ is the coefficient of each parameter q. Because this paper focuses on a time series trend instead of constant, μ as intercept is not presented in the Results section. The Akaike information criterion was used to examine which model best fit the time series, and the Ljung–Box test reporting Q-statistics examined residual auto-correlation. Statistical significance was set at a level of 0.05 as a disciplinary common practice. Plot of ARIMA models were also superimposed on original time series plot to illustrate predictive accuracy through comparing predicted and observed values. After that, vector auto-regressive (VAR) models of six emotion variables within each fund were computed in the R programming software (R Foundation for Statistical Computing, Vienna, Austria). VAR modeling is also helpful for structural analysis among times series variables. For testing residuals' auto-correlation, the Portmanteau test was used to examine all VAR models. The same procedure was repeated with the addition of a single fund performance variable to the VAR model at a time.
3. Results
3.1. Relationship of each emotion among its time intervals
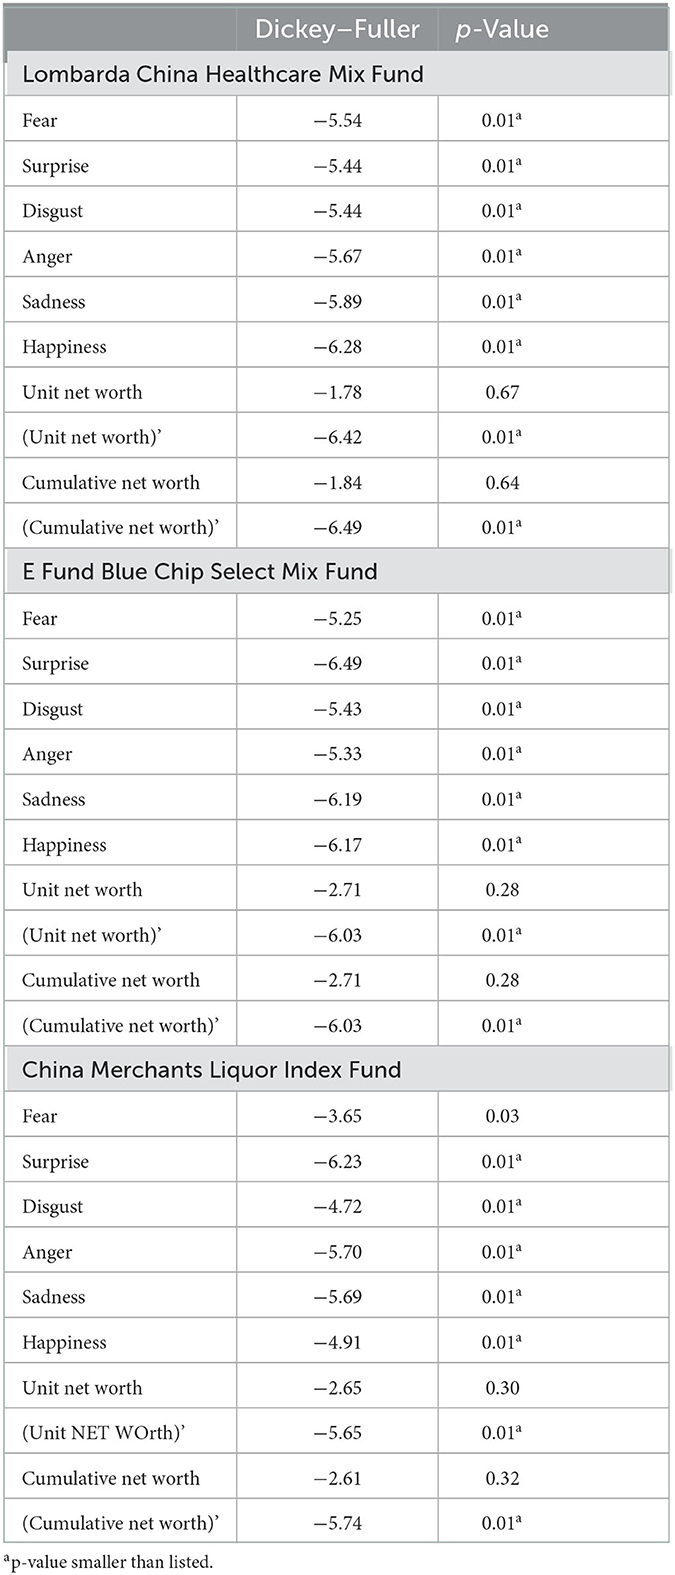
All measurements went through the augmented Dickey–Fuller test for achieving stationarity as seen in Table 1. Although emotion variables were all stationary, unit and cumulative net worth were non-stationarity, with p > 0.05; thus, the significance level of the hypothesis of stationarity was acceptable.
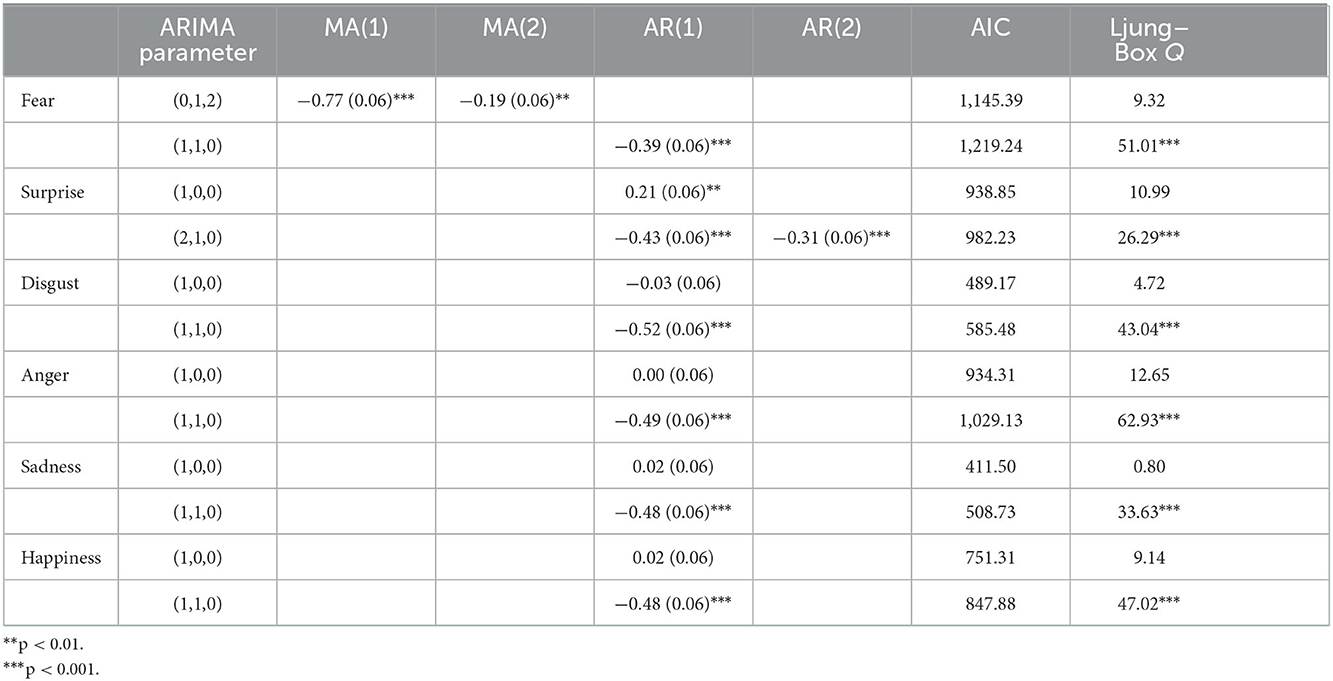
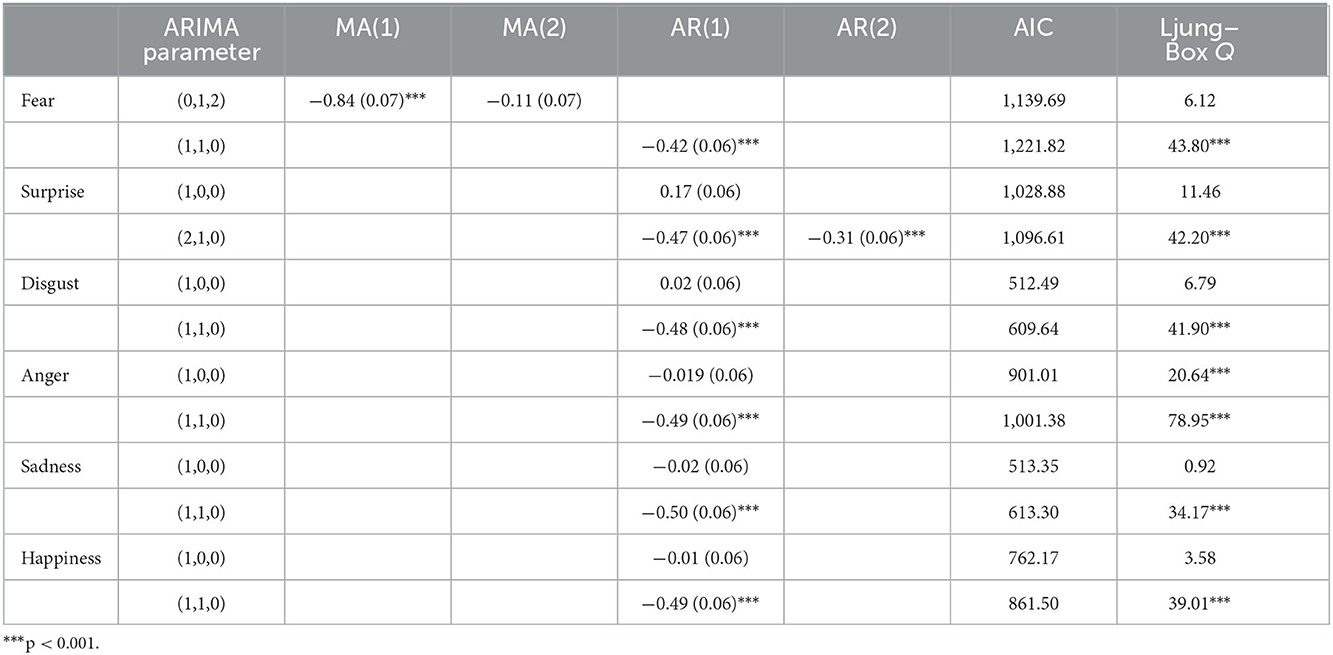
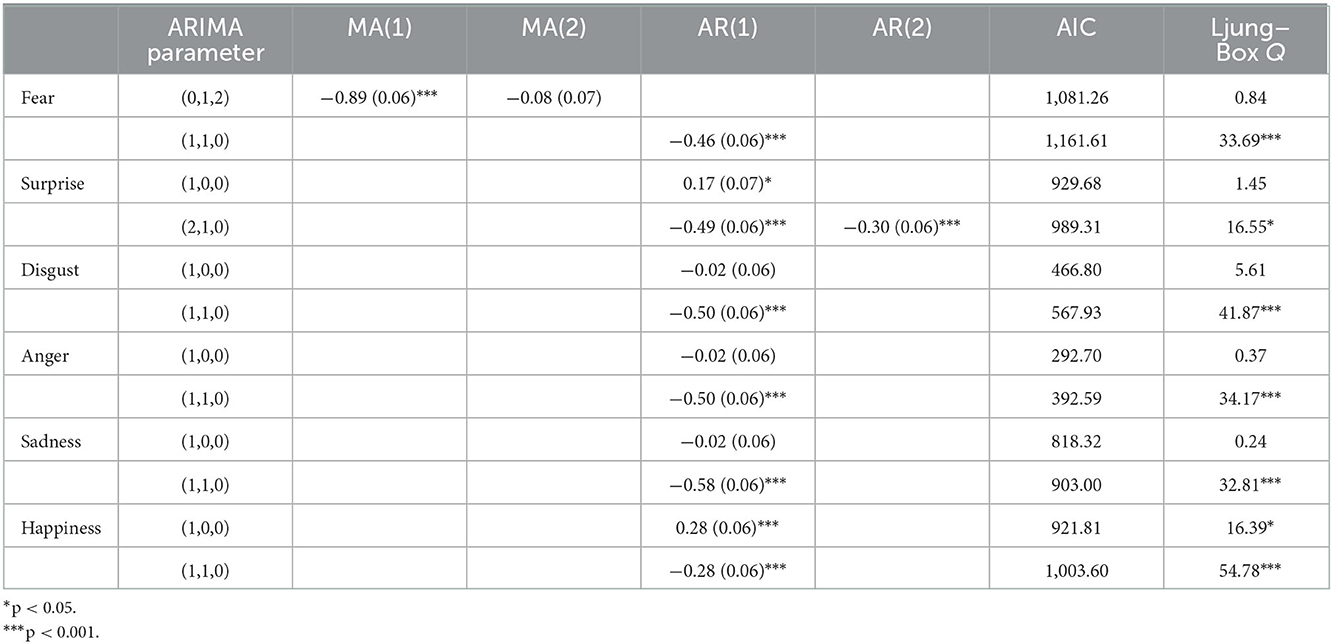
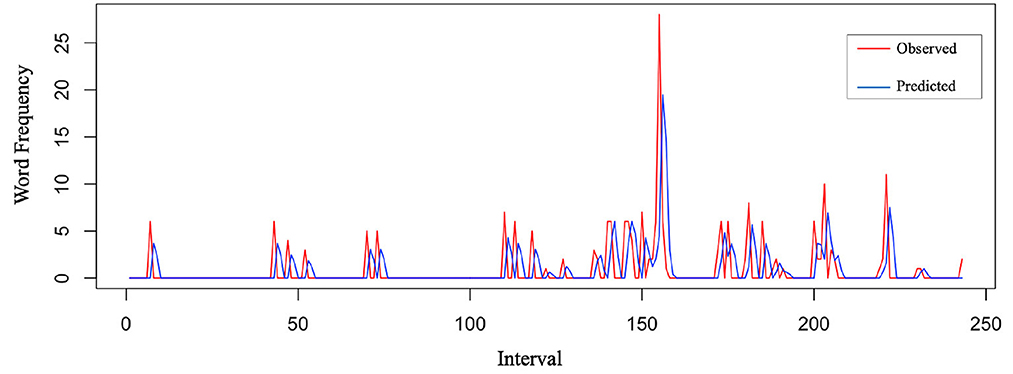
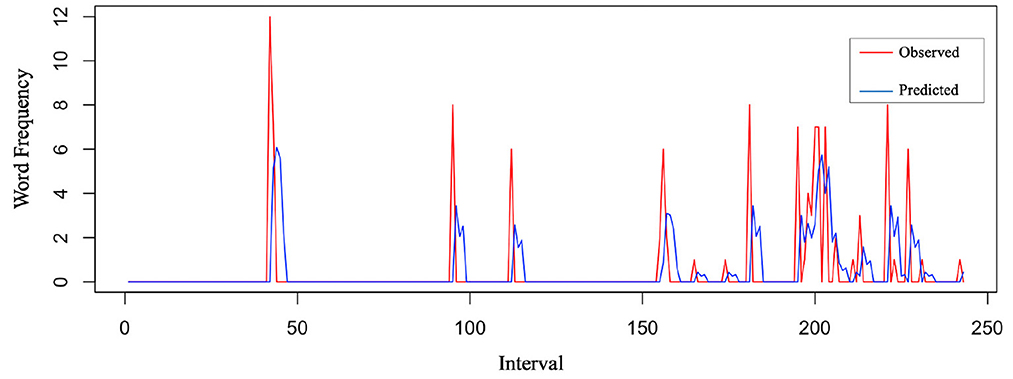
All unit and cumulative net worth time series took the first difference and reported p < 0.01 as stationary (d = 1). No further differencing was computed to avoid unnecessary serial correlation and complexity due to over-differencing. The maximum p and q numbers of ARIMA models were decided to be 2 (0 ≤ p ≤ 2, 0 ≤ d ≤ 1, 0 ≤ q ≤ 2) due to the spikes patterns of the three funds in 18 sets of ACF and PACF graphs. A combination of possible ARIMA(p, d, q) models based on ACT and PACF graphs were tested for all emotions. Fear of the three funds was tested for ARIMA(0,1,2) and ARIMA(1,1,0), and surprise associated with the three funds was tested for ARIMA(1,0,0) and ARIMA(2,1,0). Disgust, anger, sadness, and happiness associated with the three funds were tested for ARIMA(1,0,0) and ARIMA(1,1,0), as reported in Tables 2–4. A priority of model diagnostics was that residuals of the fitted ARIMA model had no auto-correlation. Models with residual auto-correlation were considered to lack overall randomness among a group of lags. Therefore, ARIMA(1,1,0) turned out to be the best forecasting model for fear, disgust, anger, sadness, and happiness of the three funds, while ARIMA(2,1,0) was the best model for surprise, supporting H1 with statistical significance. Predicted values of these models were close to observed values, taking Lombarda China Healthcare Mix Fund fear and surprise as examples in Figures 2, 3.
3.2. Relationship among the six emotions within funds
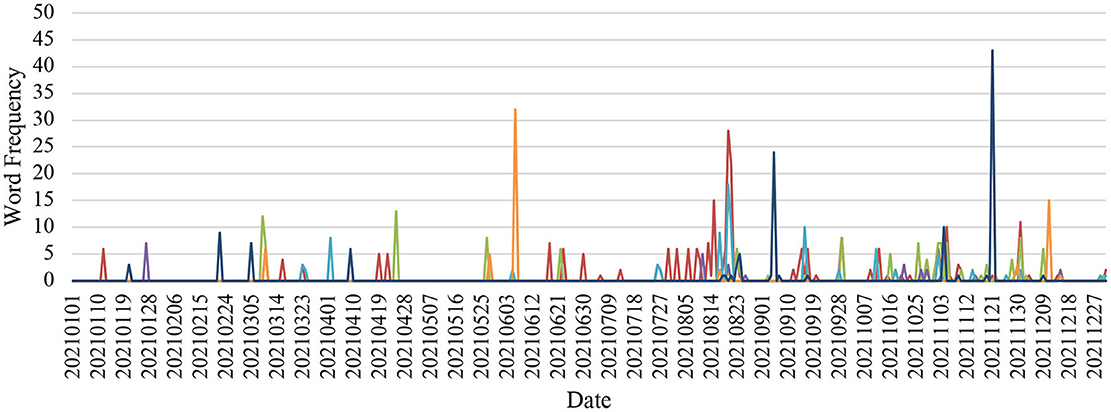
Some patterns of emotional presence in the Lombarda China Healthcare Mix Fund, E Fund Blue Chip Select Mix Fund, and China Merchants Liquor Index Fund were found throughout the year, as seen in Figures 4–6.
In the Lombarda China Healthcare Mix Fund, surprise and sadness concurrently somewhat peaked between March 9–10, 2021, followed by continuing fear until March 26, 2021. A spike of strong sadness showed on June 6, 2021. Fear, surprise, disgust, and anger spikes overlapped on August 20, 2021, while fear and anger repeated overlapping patterns on August 21, 2021. A visually apparent spike of happiness appeared on September 5, 2021. Later, starting with fear, surprise, and anger on November 2, 2021, disgust joined the emotion group on November 3, 2021, and fear lasted until November 6, 2021. A second happiness spike appeared on November 21, 2021. Finally, getting close to the end of the year, some fear, surprise, and anger simultaneously presented on December 1, 2021.
In the E Fund Blue Chip Select Mix Fund, emotion trends were smooth until June 6, 2021, where a sadness spike appeared. Two months later, a combination of fear, anger, and sadness peaked on August 20, 2021. Strong happiness showed on November 21, 2021, with a lower peak of fear, anger, and sadness appearing on December 1, 2021.
In the China Merchants Liquor Index Fund, a small surprise spike showed on January 4, 2021, followed by some sadness on the next day. Simultaneous surprise and happiness spikes appeared on February 22, 2021. Slight levels of fear, along with anger, sadness, and happiness, fluctuated on March 8, 2021. Some disgust peaked on April 22, 2021, followed by some surprise peaking the next day, then slight fear on the day after. Similarly, some surprise resurfaced on June 22, 2021, while fear showed on the next day. A combination of fear, disgust, and anger presented on August 20, 2021, changing to surprise 2 days later, then to happiness. Strong happiness was noticed on November 4 and 21, 2021. Starting with slight surprise on December 28, 2021, strong fear with some disgust and anger joined the next day. On December 30, 2021, slight fear and surprise with some sadness was present, which cooled down to less fear on December 31, 2021.
Several correlations among emotions were found through VAR models, as seen in Table 5. To remove serial correlation, all emotion time series took the first difference. The Portmanteau test result of differenced time series turned out to accept the hypothesis that there was no longer serial correlation at a statistically significant level. However, the coefficient estimates were small in general. Specifically, in the Lombarda China Healthcare Mix Fund, surprise and sadness showed some degree of statistically significant positive correlation in the VAR(1) model (B = 0.14), where sadness served as a predictor. In addition, sadness (B = −0.41), fear (B = −0.04), and surprise (B = 0.17) presented significant correlations with anger. Other equations in VAR(1) did not report correlations at a statistically significant level. Happiness in the China Merchants Liquor Index Fund turned out to be a predictor of fear (B = 0.31) and surprise (B = 0.2). Furthermore, disgust could be a predictor of surprise (B = 0.53), and anger and fear positively correlated with each other. Additionally, some correlations among emotions in the E Fund Blue Chip Select Mix Fund were statistically significant, albeit with a small coefficient. Because a small coefficient indicates that the relationship is subtle, we considered the correlation among these emotions to be rather weak. Therefore, the results failed to validate H2 of this study.
3.3. Relationship between emotions and fund performance
As little correlation was found, the six basic emotions could not be considered as control variables for one another in the VAR model with the addition of funds unit and cumulative net worth. Each emotion time series was computed separately in VAR(1) with the net worth time series of a fund. As seen in Table 6, a statistically significant relationship between fear and unit net worth (B = −0.39) was found in the Lombarda China Healthcare Mix Fund, while fear and cumulative net worth presented an even stronger correlation (B = −5.23). Both unit net worth (B = −3.21) and cumulative net worth (B = −3.25) showed a significant correlation with surprise, while anger has the strongest correlational relationship with unit net worth (B = −5.58). The VAR(1) models of the Lombarda China Healthcare Mix Fund were examined by Portmanteau test and accepted the test hypothesis that there were no serial correlations of the residuals, as well as the E Fund Blue Chip Select Mix Fund, as seen in Table 7. However, none of the coefficients of the E Fund VAR models were statistically significant. In Table 8, the China Merchants Liquor Index Fund modeling results reveal a significant correlation between fear and unit net worth, but this model did not pass the Portmanteau test. Disgust was found to be correlated with both unit and cumulative net worth (B = −3.45), fulfilling the white noise requirement. In general, H3 of this study was accepted.
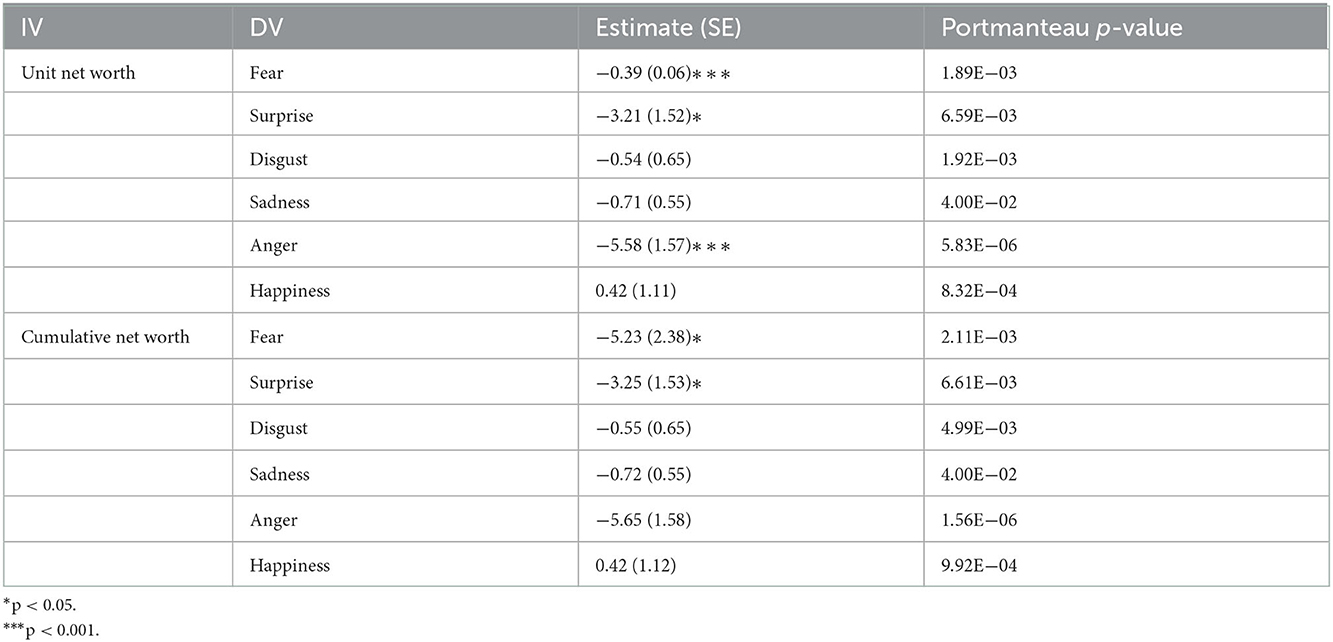
Table 6. Vector auto-regressive model (p = 1) between emotions and fund performance of the Lombarda China Healthcare Mix Fund.
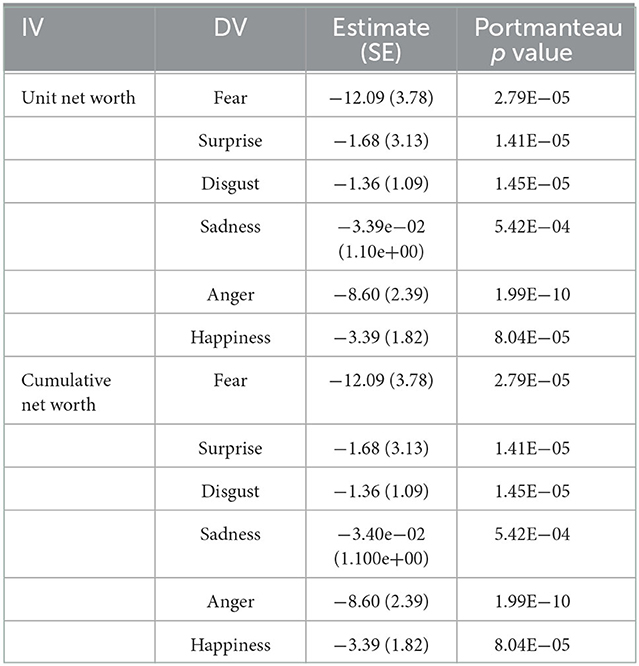
Table 7. Vector auto-regressive model (p = 1) between emotions and fund performance of the E Fund Blue Chip Select Mix Fund.
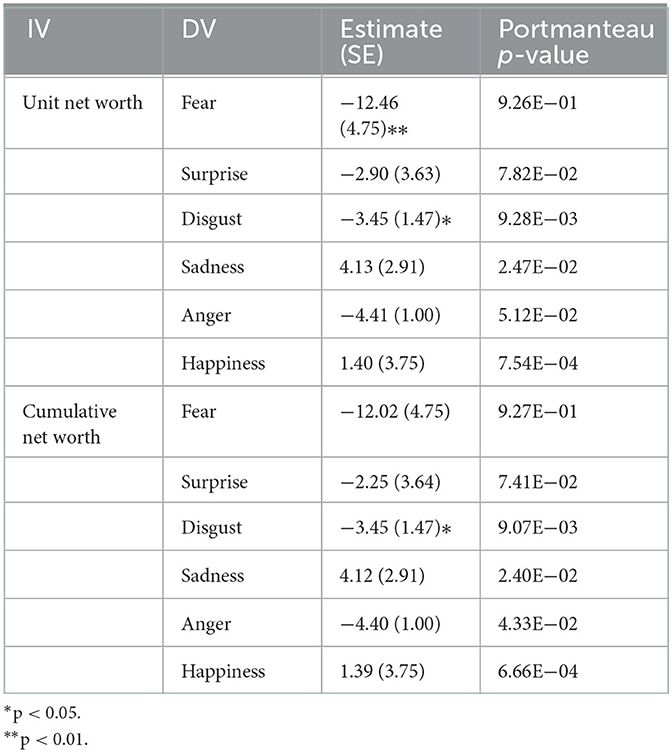
Table 8. Vector auto-regressive model (p = 1) between emotions and fund performance of the China Merchants Liquor Index Fund.
4. Discussion
The results of the ARIMA models of fear, surprise, disgust, anger, sadness, and happiness indicated the best-fit forecast models for the Lombarda China Healthcare Mix Fund, E Fund Blue Chip Select Mix Fund, and China Merchants Liquor Index Fund. Model commonality was found across the three funds, where ARIMA(1,1,0) could be used as a reference for forecasting fear, disgust, anger, sadness, and happiness textual expressions on Weibo and ARIMA(2,1,0) could be used to forecast surprise of Weibo users, respectively. Through the results, we found that Weibo emotions could be predicted by emotions in the previous time point. Because the constants of models were not reported in the Results section, we recommended referencing the ARIMA parameter coefficients for univariate time series trends on emotion. The result of the inter-emotion analysis of each fund revealed a relatively weak or non-significant relationship among fear, surprise, disgust, anger, sadness, and happiness. Although visual trends presented a co-occurrence of multiple emotions during the same time interval, this paper failed to support the idea that a certain textual emotion relevant to a particular fund on Weibo could be a predictor of another. However, a predictive relationship was found in the structural analysis of emotion and fund performance time series. Through VAR models, fear, surprise, and anger on Weibo could be explained by fund performance and reported negative correlations.
An emotional pattern could be generated from our findings; specifically, as the fund net worth becomes lower, there could be a predictable spike in the textual expressions of fear, surprise, and anger on Weibo. This result was also supported by research on emotion and behavior stating that behavioral responses could be forecasted by emotion (Weisbuch and Adams Jr, 2012). Because spelling mistakes of textual emotion analysis were not included in the emotion frequency count, such could be a limitation of neglecting potential Weibo posts, which decreased the sample size of this study. Image mining, including of photos and emojis, was another challenge in this study; for instance, a sarcastic image could sometimes be a form of negation, which was not included in the data collection. We encourage future research on the digital negation of SNSs to improve this research.
5. Conclusion
We believe that this study contributes to a new perspective of linguistic investigation considering temporal aspect with an emphasis on SNSs and innovate statistic models of textual emotions. The results of this study also presented a practical forecasting trend equation of emotions for organizations with a need for Weibo emotion monitoring relevant to funds in China, such as media risk management teams. In addition, this study presented insight into computational linguistic methods in digital emotion studies. As future research, we will consider further validation of modeling of other funds we collected in the same timeframe and apply existing linguistic coding models to dataset. Lastly, we look forward to emotional studies in other fields and languages.
Data availability statement
The raw data supporting the conclusions of this article will be made available by the authors, without undue reservation.
Author contributions
SL has been involved in designing the algorithm logic and analytic algorithm coding, cleaning and analyzing data, and drafting the manuscript.
Conflict of interest
The author declares that the research was conducted in the absence of any commercial or financial relationships that could be construed as a potential conflict of interest.
Publisher's note
All claims expressed in this article are solely those of the authors and do not necessarily represent those of their affiliated organizations, or those of the publisher, the editors and the reviewers. Any product that may be evaluated in this article, or claim that may be made by its manufacturer, is not guaranteed or endorsed by the publisher.
References
Boiger, M., and Mesquita, B. (2012). The construction of emotion in interactions, relationships, and cultures. Emot. Rev. 4, 221–229.
Bollen, J., Mao, H., and Pepe, A. (2011). “Modeling public mood and emotion: twitter sentiment and socio-economic phenomena,” in Proceedings of the International AAAI Conference on Web and Social Media (Menlo Park, CA: AAAI Press), 450–453. doi: 10.1609/icwsm.v5i1.14171
Boucher, J. D., and Carlson, G. E. (1980). Recognition of facial expression in three cultures. J. Cross Cult. Psychol. 11, 263–280. doi: 10.1177/0022022180113003
Bradley, M. M., Cuthbert, B. N., and Lang, P. J. (1996). Picture media and emotion: effects of a sustained affective context. Psychophysiology 33, 662–670. doi: 10.1111/j.1469-8986.1996.tb02362.x
Chan, M., Wu, X., Hao, Y., Xi, R., and Jin, T. (2012). Microblogging, online expression, and political efficacy among young Chinese citizens: the moderating role of information and entertainment needs in the use of Weibo. Cyberpsychol. Behav. Soc. Netw. 15, 345–349. doi: 10.1089/cyber.2012.0109
Chartier, J. F., and Meunier, J. G. (2011). Text mining methods for social representation analysis in large corpora. Pap. Soc. Represent. 20, 37.1−37.47. Available online at: https://psr.iscte-iul.pt/index.php/PSR/article/view/452
Chrea, C., Grandjean, D., Delplanque, S., Cayeux, I., Le Calvé, B., Aymard, L., et al. (2009). Mapping the semantic space for the subjective experience of emotional responses to odors. Chem. Senses. 34, 49–62. doi: 10.1093/chemse/bjn052
Clore, G. L., and Ortony, A. (2013). Psychological construction in the OCC model of emotion. Emot. Rev. 5, 335–343. doi: 10.1177/1754073913489751
Dill, K. E. (2013). The Oxford Handbook of Media Psychology. Oxford: Oxford University Press. doi: 10.1093/oxfordhb/9780195398809.001.0001
Dubey, A. D. (2020). Twitter sentiment analysis during COVID-19 outbreak. SSRN Electron. J. 1–9. doi: 10.2139/ssrn.3572023
Ekman, P. (1992). An argument for basic emotions. Cogn. Emot. 6, 169–200. doi: 10.1080/02699939208411068
Ekman, P., and Keltner, D. (1997). “Universal facial expressions of emotion,” in Nonverbal Communication: Where Nature Meets Culture, eds U. P. Segerstrale, and P. Molnar (Oxford: Oxford University Press), 27, 46.
Fenton-O'Creevy, M., Lins, J. T., Vohra, S., Richards, D. W., Davies, G., and Schaaff, K. (2012). Emotion regulation and trader expertise: heart rate variability on the trading floor. J. Neurosci. Psychol. Econ. 5, 227. doi: 10.1037/a0030364
Ferdenzi, C., Delplanque, S., Barbosa, P., Court, K., Guinard, J. X., Guo, T., et al. (2013). Affective semantic space of scents. towards a universal scale to measure self-reported odor-related feelings. Food Qual. Prefer. 30, 128–138. doi: 10.1016/j.foodqual.2013.04.010
Garrido, S., and Schubert, E. (2011). Individual differences in the enjoyment of negative emotion in music: a literature review and experiment. Music Percept. 28, 279–296. doi: 10.1525/mp.2011.28.3.279
Hofstede, G. (2001). Culture's Consequences: Comparing Values, Behaviors, Institutions and Organizations across Nations. Thousand Oaks, CA: Sage Publications.
Hofstede, G. (2003). Cultural Dimensions. Available online at: https://www.geert-hofstede.com (accessed July 25, 2022).
Izard, C. E. (2007). Basic emotions, natural kinds, emotion schemas, and a new paradigm. Perspect. Psychol. Sci. 2, 260–280. doi: 10.1111/j.1745-6916.2007.00044.x
Jack, R. E., Garrod, O. G., Yu, H., Caldara, R., and Schyns, P. G. (2012). Facial expressions of emotion are not culturally universal. Proc. Nat. Acad. Sci. 109, 7241–7244. doi: 10.1073/pnas.1200155109
Jain, U. (1994). Socio-cultural construction of emotions. Psychol. Dev. Soc. J. 6, 151–168. doi: 10.1177/097133369400600205
Kandasamy, N., Garfinkel, S. N., Page, L., Hardy, B., Critchley, H. D., Gurnell, M., et al. (2016). Interoceptive ability predicts survival on a London trading floor. Sci. Rep. 6, 697. doi: 10.1038/srep32986
King, S. C., and Meiselman, H. L. (2010). Development of a method to measure consumer emotions associated with foods. Food Qual. Prefer. 21, 168–177. doi: 10.1016/j.foodqual.2009.02.005
Kirkland, T., and Cunningham, W. A. (2012). Mapping emotions through time: how affective trajectories inform the language of emotion. Emotion 12, 268–282. doi: 10.1037/a0024218
Koplenig, A. (2017). Why the quantitative analysis of diachronic corpora that does not consider the temporal aspect of time-series can lead to wrong conclusions. Digit. Scholarsh. Humanit. 32, 159–168. doi: 10.1093/llc/fqv030
Koshorek, O., Cohen, A., Mor, N., Rotman, M., and Berant, J. (2018). Text segmentation as a supervised learning task. arXiv. [Preprint]. doi: 10.18653/v1/N18-2075
Kramer, A. D. I., Guillory, J. E., and Hancock, J. T. (2014). Experimental evidence of massive-scale emotional contagion through social networks. Proc. Nat. Acad. Sci. 111, 8788–8790. doi: 10.1073/pnas.1320040111
Li, H., Liu, H., and Zhang, Z. (2020). Online persuasion of review emotional intensity: a text mining analysis of restaurant reviews. Int. J. Hosp. Manag. 89, 102558. doi: 10.1016/j.ijhm.2020.102558
Lim, N. (2016). Cultural differences in emotion: differences in emotional arousal level between the East and the West. Integr. Med. Res. 5, 105–109. doi: 10.1016/j.imr.2016.03.004
Lorber, M. F., and Smith Slep, A. M. (2005). Mothers' emotion dynamics and their relations with harsh and lax discipline: microsocial time series analyses. J. Clini. Child Adolesc. Psychol. 34, 559–568. doi: 10.1207/s15374424jccp3403_11
Luo, S. (2022). “Examining the association between color and mood,” in Advances in Social Science, Education and Humanities Research (Paris: Atlantis Press SARL), 253–259. doi: 10.2991/assehr.k.220131.046
Martin, L. N., and Delgado, M. R. (2011). The influence of emotion regulation on decision-making under risk. J. Cogn. Neurosci. 23, 2569–2581. doi: 10.1162/jocn.2011.21618
Ng, B. C., Cui, C., and Cavallaro, F. (2019). The annotated lexicon of Chinese emotion words. Word 65, 73–92. doi: 10.1080/00437956.2019.1599543
Panksepp, J. (2007). Neurologizing the psychology of affects: how appraisal-based constructivism and basic emotion theory can coexist. Perspect. Psychol. Sci. 2, 281–296. doi: 10.1111/j.1745-6916.2007.00045.x
Plutchik, R. (1980). “A general psychoevolutionary theory of emotion,” in Theories of Emotion, ed H. Kellerman (Cambridge, MA: Academic Press), 3–33. doi: 10.1016/B978-0-12-558701-3.50007-7
Quartz, S. R. (2009). Reason, emotion and decision-making: risk and reward computation with feeling. Trends Cogn. Sci. 13, 209–215. doi: 10.1016/j.tics.2009.02.003
Ross, A. A. G. (2006). Coming in from the cold: constructivism and emotions. Eur. J. Int. Relat. 12, 197–222. doi: 10.1177/1354066106064507
Shan, S., Ju, X., Wei, Y., and Wang, Z. (2021). Effects of PM2, 5. on people's emotion: a case study of Weibo (Chinese Twitter) in Beijing. Int. J. Environ. Res. Public Health. 18, 5422. doi: 10.3390/ijerph18105422
Shaver, P. R., Murdaya, U., and Fraley, R. C. (2001). Structure of the Indonesian emotion lexicon. Asian J. Soc. Psychol. 4, 201–224. doi: 10.1111/1467-839X.00086
Shaver, P. R., Wu, S., and Schwartz, J. C. (1992). “Cross-cultural similarities and differences in emotion and its representation,” in Emotion, ed M. S. Clark (Thousand Oaks, CA: Sage Publications, Inc.), 175–212.
Shiv, B., Loewenstein, G., Bechara, A., Damasio, H., and Damasio, A. R. (2005). Investment behavior and the negative side of emotion. Psychol. Sci. 16, 435–439. doi: 10.1111/j.0956-7976.2005.01553.x
Singh, P. (2021). FQTSFM: a fuzzy-quantum time series forecasting model. Inf. Sci. 566, 57–79. doi: 10.1016/j.ins.2021.02.024
Singh, P., and Borah, B. (2014). Forecasting stock index price based on M-factors fuzzy time series and particle swarm optimization. Int. J. Approx. Reason. 55, 812–833. doi: 10.1016/j.ijar.2013.09.014
Stein, N. L., Hernandez, M. W., and Trabasso, T. (2008). “Advances in modeling emotion and thought: The importance of developmental online, and multilevel analyses,” in Handbook of Emotions, eds M. Lewis, J. M. Haviland-Jones, and L. F. Barett (Guilford Press), 574–586.
Sundar, S. S., and Limperos, A. M. (2013). Uses and grats 2.0: new gratifications for new media. J. Broadcast. Electron. Media. 57, 504–525. doi: 10.1080/08838151.2013.845827
Tang, C., and Guo, L. (2015). Digging for gold with a simple tool: validating text mining in studying electronic word-of-mouth (eWOM) communication. Mark. Lett. 26, 67–80. doi: 10.1007/s11002-013-9268-8
Tay, D. (2018). Time Series Analysis of Discourse: Method and Case Studies. London: Routledge. doi: 10.4324/9780429505881
Tay, D. (2021). Modelability across time as a signature of identity construction on YouTube. J. Pragmat. 182, 1–15. doi: 10.1016/j.pragma.2021.06.004
Tay, D. (2022). “Covid-19 press conferences across time: World Health Organization vs. Chinese Ministry of Foreign Affairs,” in Pandemic and Crisis Discourse: Communicating COVID-19 and Public Health Strategy, eds A. Musolff, R. Breeze, K. Kondo, and S. Vilar-Lluch (London: Bloomsbury Academic), 13–30. doi: 10.5040/9781350232730.ch-001
Vaughn, K. (1990). Exploring emotion in sub-structural aspects of Karelian lament: application of time series analysis to digitized melody. Yearb. Tradit. Music. 22, 106–122. doi: 10.2307/767934
Waterloo, S. F., Baumgartner, S. E., Peter, J., and Valkenburg, P. M. (2018). Norms of online expressions of emotion: Comparing Facebook, Twitter, Instagram, and WhatsApp. New Media Soc. 20, 1813–1831.
Weisbuch, M., and Adams, R. B. Jr (2012). The functional forecast model of emotion expression processing. Soc. Personal. Psychol. Compass. 6, 499–514. doi: 10.1111/j.1751-9004.2012.00443.x
Xu, L., Lin, H., Pan, Y., Ren, H., and Chen, J. (2008). Constructing the affective lexicon ontology. J. China Soc. Sci. Tech. Inf. 27, 180–185. Available online at: https://www.researchgate.net/publication/285878236_Constructing_the_affective_lexicon_ontology
Yi, J., Gina Qu, J., and Zhang, W. J. (2022). Depicting the emotion flow: super-spreaders of emotional messages on Weibo during the COVID-19 pandemic. Soc. Media Soc. 22, 1–15. doi: 10.1177/20563051221084950
Zammuner, V. L. (1998). Concepts of emotion: “emotionness,” and dimensional ratings of Italian emotion words. Cogn. Emot. 12, 243–272. doi: 10.1080/026999398379745
Keywords: emotion analysis, forecast model, time series, web crawler, text mining
Citation: Luo S (2022) Forecasting fund-related textual emotion trends on Weibo: A time series study. Front. Commun. 7:970749. doi: 10.3389/fcomm.2022.970749
Received: 16 June 2022; Accepted: 02 December 2022;
Published: 16 December 2022.
Edited by:
Debora Bettiga, Politecnico di Milano, ItalyReviewed by:
Pritpal Singh, Jagiellonian University, PolandDennis Tay, Hong Kong Polytechnic University, Hong Kong SAR, China
Copyright © 2022 Luo. This is an open-access article distributed under the terms of the Creative Commons Attribution License (CC BY). The use, distribution or reproduction in other forums is permitted, provided the original author(s) and the copyright owner(s) are credited and that the original publication in this journal is cited, in accordance with accepted academic practice. No use, distribution or reproduction is permitted which does not comply with these terms.
*Correspondence: Sha Luo,  c2w0Mzk2QHRjLmNvbHVtYmlhLmVkdQ==
 Sha Luo