- College of Foreign Languages and Literature, Fudan University, Shanghai, China
Linguistic profiles, which are often established through the measurement of linguistic features, are able to demonstrate characteristics shared by a specific type of text or a group of language learners. This paper examines the contexts and purposes related to profiling research in language studies, meanwhile synthesizing quantitative profiling methods such as cluster analysis, Principal Component Analysis (PCA), and Factor Analysis (FA). A profiling study of high-proficiency L2 English speakers' test performance is also presented, which explains the profiling procedure in L2 speaking assessment. Cluster analysis conducted on speech fluency and vocabulary variables rendered four different speech profiles, which are associated with the speakers' L1 background and L2 English proficiency level. This paper also discusses the interpretation of linguistic profiles, as well as the statistical concerns involved in the profile construction process.
Introduction
Individual-differences (ID) research, which was described by Ciszér and Dornyei (2005) as the study of language learners' stable and systematic deviations from “normal blueprints […] typically aimed at identifying dimensions of enduring language learner characteristics relevant to the mastery of an L2 that are assumed to apply to everybody and on which people differ by degree” (p. 613). As a method capable of capturing language learners' individual differences in their performance, linguistic profiling has been more frequently applied in studies related to language learning. According to Halteren (2007), the concept of profiling focuses on linguistic features, the statistical calculation of which could assist researchers in looking for information underlying the text.
In this paper, the selection and quantification of linguistic features not only set descriptive parameters for a specific variety of text, but also represent the language practices of a particular learner group. The linguistic features involved, which often undergo procedures such as frequency counts, normalization, and statistical calculations that are inferential, present profiles demonstrating individual patterns with numerical specifications. Furthermore, a comparison among all the linguistic profiles generated allows researchers to access possible variations across multiple text types and language users. Sufficient methodological support and unbiased interpretation framework are thus pivotal to explaining the linguistic profiles in language studies, which are expected to facilitate researchers' comprehension of language learners' individual characteristics. Through the investigation of literature published on the discussion of linguistic profiles, this paper examines the construction of linguistic profiles from two aspects:
a) What are the research contexts for conducting linguistic profiling research?
b) What are the commonly used statistical methods for constructing linguistic profiles quantitatively?
Answering these two questions will provide practical suggestions for researchers aiming to use profiling as a research method. In addition, this paper features a study that extracts linguistic profiles through L2 speech data collected from an oral English test. Linguistic profiles, which were built through cluster analysis, consist of variables measuring L2 English speakers' speech fluency and their use of vocabulary. This empirical study exemplifies procedural steps of creating profiles through multivariate statistical method, and emphasizes the necessity of reducing dimensions after obtaining the measurement results of multiple linguistic features. The author also provides interpretation for the profiles generated from the study, while discussing possible statistical concerns and pedagogical implications.
The construction of linguistic profiles in language studies
Purposes and themes of linguistic profiling research
Linguistic profiling, which is often embedded as a preliminary phase in the research process, provides supporting evidence for more overarching research questions regarding individual differences in second/foreign language studies. In general, the research purposes for linguistic profiling analysis include: (a) identifying the language proficiency level of L2 learners (Pienemann, 1998; Pienemann and, 2005; Pienemann and Keβler, 2011) and the strategies used by individual learners (Graham et al., 2020), (b) exploring for linguistic profiles of texts through corpus data (Friginal and Weigle, 2014), and (c) offering description for a country where multilingualism is practiced (Esseili, 2017; Banat, 2021) or sociolinguistic profiles of a particular group of second/foreign language learners (Alarcón, 2010). This literature review section further explains the targets and methods of building linguistic profiles, whose interpretation varies across diverse research contexts.
When associated with the learning process of adult L2 speakers, linguistic profiles have been built to describe the linguistic systems of learners at a specific stage (Clahsen, 1985; Brindley, 1998; Bartening, 2000; Ågren et al., 2012). More specifically, researchers created linguistic profiles of learners at different proficiency levels, which were then used as benchmarks in comparison to individual speech samples (Keβler and Liebner, 2011; Grandfeldt and Ågren, 2014). L2 learners would display a variety of morphosyntactic and grammatical patterns at different L2 proficiency levels, which suggest a developmental progression. The linguistic profiles individualizing L2 learning stages have been applied in the research area of Computer Assisted Language Learning (CALL) and Computer Assisted Language Testing (CALT), such as the development of language learning platforms and automatic scoring systems.
From a pedagogical perspective, linguistic profiling has enabled language teachers and instructors to document the progress of L2 speakers. For example, Van Compernolle (2014) recorded L2 learners' development of sociolinguistic knowledge in strategic interaction scenarios, where an individual learner's profile was built through detailed discourse analysis. The profiling process, which is realized by dynamic assessment and a series of pre-designed pedagogical modules, embodies the learner's growing control of verbal negation in French and provides insights into language course design.
Linguistic profiles have also been constructed using a large amount of observational data drawn from corpora. In Russian, for instance, Kuznetsova (2015) recognized gender-related profiles through “verbs that have a prevalence of masculine vs. feminine past tense endings” and then examined “the gender stereotypes that affect the activities denoted by the verbs” (p. 262). Corpus-based profiling results are also grounded in the correlation between semantic and distributional properties, or connections among distribution, form, and meaning (Divjak and Gries, 2006; Gries, 2010). As a result, profiles generated from the correlation between form and meaning have helped researchers predict meaning through the distribution of forms. In addition, corpus-based studies have provided large volumes of descriptive data for linguistic features in a specific category, the frequency of which has led to the establishment of more nuanced profiles. Hoffmann (2012), for instance, reported the cohesive profiles of spoken dialogues and written monologs, which further explained the linguistic difference across genres of texts.
From a sociolinguistic perspective, linguistic profiles of speaker groups have been produced through questionnaire data, where components for profile construction are drawn from both social factors and linguistic features. Research efforts have been dedicated to extracting a detailed profile of a particular type of speakers from survey responses. For example, Fabricius (2006) examined Danish listeners' attitudes to British Received Pronunciation (RP) through open-ended questions and Likert scales. After listening to pre-recorded speech with RP, listeners responded to questions regarding the speaker's occupation, place of origin, socio-economic background, and personality. All these elements constitute a multi-faceted sociolinguistic profile for the speaker. Wang et al. (2021) designed the Linguistic Multicompetence Questionnaire to weigh in social factors such as migrant status, language maintenance beliefs, and cultural identity, which also assisted speech pathologists with comprehending different representations of multicompetence. Research on language learning and speech pathologies is enriched by the linguistic profiling of multilingual speakers, as multilingualism and speech disorders were treated as different concepts. To examine the linguistic profiles of heritage language speakers more closely, the survey instrument in Prentza and Kaltsa (2020) inquired speakers' exposure to specific languages, their attitudes toward different languages, and language using both at home and school.
Profiling information accessed through sociolinguistic documentation has diversified researchers' understanding of individuality in the age of new media, as both transcribed speech production and text information are considered as convincing evidence of language users' personal characteristics. Along with detecting the possible connections between social factors and individual differences among language users, Author Profiling (AP) on social media has also become a prominent strand of sociolinguistic profiling, which has integrated Natural Language Processing techniques into producing profiles of news media writers. Linguistic features such as text string length and word frequency were used to construct computational models and build text classifiers (Peng et al., 2016; Manna et al., 2019; Kowsari et al., 2020). Multimodal texts including emails, microblogs, movie reviews, and online bulletin boards provided input data for text classifiers, which are capable of predicting text authors' age, gender, and first language background. Author Profiling (AP) exemplifies the contribution of language engineering through text mining techniques and deep learning architecture. With input from corpus data, AP-related research outcome has been referenced for author attribution (Delmondes Neto and Paraboni, 2022; Deutsch and Paraboni, 2022), plagiarism detection (Potthast et al., 2014), and the identification of cyber troll accounts (Lundberg and Laitinen, 2020).
Methodological support, or a clarification of the commonly-used methods, is the prerequisite for the establishment of linguistic profiles. The next section of this paper will synthesize the quantitative procedures for linguistic profile extraction, which depends largely on the core statistics retrieved by the researchers.
Quantitative methods for linguistic profiling
From a feature-based perspective, linguistic profiling could be accomplished through statistical methods that function in either a descriptive or predictive manner. In comparison to descriptive methods, which generate profiles through the measurement of linguistic features, predictive methods involve inferential models that quantify the contribution of each variable to the models' prediction accuracy. This section of paper discusses the application of both descriptive approaches and predictive models for rendering linguistic profiles, both of which function to identify the individuality of language learners, types and genres of texts, or language varieties.
Descriptive approaches of building linguistic profiles
The comparison among language speakers' use of linguistic features is also conducted through non-parametric tests, as the prerequisite of normal distribution is not always fulfilled by linguistic data. In order to profile non-native speakers' nautical communication practices on board ships, John et al. (2017) compared non-native English speakers' speech patterns during bridge team communication (a subgenre of Maritime English) and non-nautical communication. Nonparametric statistics resulted from the Mann–Whitney U-tests, the Kruskal–Wallis test, and the calculation of effect sizes were presented in the study, which helped pinpoint a linguistic profile of non-native speakers' use of Maritime English in concrete settings of English for Specific Purposes (ESP).
In addition to non-parametric tests, profiles have been presented through statistical methods such as Z-score and chi-square test. As a statistic that measures the distance from the mean, Z score has been used to represent intergroup variations of language learners' ability (Potocki et al., 2017). Students' performance on a two-part reading comprehension test were transformed to Z-score, representing their decoding and comprehending abilities, respectively. Different combinations of the two-part Z score thus yielded multiple learner profiles, which calls for more accommodating pedagogical guidance to address the needs of different learners. The chi-square statistic, which is calculated from a contingency table, also examines the association between categorical variables as a non-parametric statistic. When used in profiling research that quantifies linguistic features through frequency numbers, the rows and columns of the contingency table could be interpreted as numerical representations of a multidimensional linguistic space. Through calculating the frequencies of linguistic variables within each language variety, Delaere et al. (2012) computed profile-based chi-square to measure the distance across multiple translated text types, thus offering explanations for the “standardness” issue in translational studies.
Compared with Z-score method, which is conveniently used on a limited number of variables, cluster analysis is a multivariate statistical procedure that places cases with similar numerical patterns into the same group. Labeled as “a statistical procedure that is relatively rarely used” (Ciszér and Dornyei, 2005, p. 613), cluster analysis is currently applied in language learning research that covers a broader scope of topics. Ryslewicz (2008) conducted cluster analysis on the assessment results of L2 learners' aptitude, intelligence, and proficiency level. Cognitive profiles emerged for successful and unsuccessful L2 English learners, which highlighted the contribution of inductive language learning abilities and expert use of first language to ESL students' learning achievement. When analyzing highly-rated English compositions, both Jarvis et al. (2003) and Friginal et al. (2014) implemented cluster analysis on features such as text length, conjuncts, hedges, and nominalization. The quality of students' writing depends on a balanced use of all the feature options, and essays written by native speaker of English have demonstrated a wider variety of styles.
It could be observed from the studies cited above that Z-score method and cluster analysis directly present profiles through the measurement results of features and variables. Principal Component Analysis (PCA) and Factor Analysis (FA), however, function to detect possible factors from sets of variables prior to profile construction. Principal Component Analysis (PCA) combines highly-correlated variables into a new component, which is consecutively used in description of the generated profiles. For example, Zheng et al. (2019) conducted Principal Component Analysis (PCA) on college students' responses to questionnaire statements inquiring their attitudes, beliefs, and experiences of learning a third language. The statements were grouped into generalized factors that compose various motivational profiles, which helped disentangle the relationship between motivation and instrumentality. Factor Analysis (FA), also interpreted as Multi-dimensional Analysis (MDA) in corpus linguistics, is also used as an efficient tool for profiling analysis. Friginal and Weigle (2014) computed the rate of occurrence for multiple linguistic features in L2 academic essays, and used Factor Analysis to identify four functional dimensions (e.g., Personal Opinion vs. Interpersonal Evaluation/Assessment). These dimensions have been enumerated as functional profiles that embody text parameters of L2 writing.
Predictive models of building linguistic profiles
Regression models, which are used to recognize statistically significant predictors for a measurable variable, function to further examine the features included for profile construction. Based on the rating results of speech fluency, Saito et al. (2018) categorized L2 speakers as learner profiles of low, medium, and high fluency through cluster analysis. Multiple regression analysis was then conducted to identify acoustic variables that contribute the most to speech fluency ratings. Instead of directly yielding profiling result, regression models provide a more granular view of objective features that constitute linguistic profiles.
In addition, profiling techniques also include building predictive models and developing computational methods for AP, which is often related to Author Attribution (AA). In this research context, digital texts retrieved from the Internet and social network platforms were used to identify their authors. Custódio and Paraboni (2021) reviewed the influence of text representation (e.g., online chats, blogs, reviews), choice of linguistic features (e.g., part of speech n-grams, character n-grams), and a variety of computational methods (e.g., Naïve Bayes, Random Forest, Support Vector Machine) on author identification accuracy. The discussion is continued in Deutsch and Paraboni (2022), where the task of gaining more knowledge of digital text authors is accomplished through building text classifiers.
Explanations have also been provided for the statistic models applied to identify authors of digital texts, particularly in cases where both linguistic features and demographic features were tapped by researchers. Moreno-Sandoval et al. (2021) described the functioning of a Multinominal Logit Model in quantifying the contribution of linguistic features in Twitter posts to understanding the celebrity's demographic background in reality (e.g., gender, fame, and occupation). The application of predictive models, however, cannot be separated from the discussion of dimension reduction, which is an important statistical concern in profiling analysis.
Well-established linguistic profiles are expected to capture the essential characteristics of a group of cases and require the inclusion of sufficient linguistic features. It is not unreasonable to hypothesize that inadequate features will result in the failure of extracting representative linguistic profiles, as all cases might appear to be homogeneous. An overflow of linguistic features, however, may cause problems such as collinearity. Dimension reduction is thus a necessary step to consider before conducting more complicated statistical investigation. In the study of Moreno-Sandoval et al. (2021), both Principal Component Analysis (PCA) and Multiple Correspondence Analysis (MCA) were applied as dimension reduction procedures for interval data and categorical data, which have demonstrated to be efficient in combining highly-correlated features or variables.
The implementation of statistical methods is often embedded in the fundamental steps for profile extraction. It is necessary for researchers to recognize the major dimensions that are essential to build up linguistic profiles. The second step is to pin down features and indices to represent these major dimensions, followed by selecting appropriate techniques to classify data into different categories. These categories, which contain cases sharing similarities in numerical values of all the features, will be rendered as profiles exhibiting individual characteristics.
Researching the individual differences among language learners, however, is sometimes challenged by issues such as a limited number of data cases, learners located in a restricted range of language proficiency levels, or the difficulty in choosing representative linguistic features for profile construction. This paper presents a study conducted by the author, which illustrates the profiling process through a combinational use of dimension reduction technique and multivariate statistical method. Both PCA and cluster analysis were adopted as profiling techniques, which were used to process dataset with possible concerns of collinearity and unequal sample sizes. In this study, speech data collected from an oral English test demonstrated the linguistic profiles of high-proficiency L2 English speakers, which were built upon fluency and vocabulary features. The profiling outcome provides opportunities for exploring interactions among L2 speakers' performances, their L2 proficiency level, and their L1 background. The cognitive activities L2 speakers are experiencing during speech production, which await to be explored in future studies, may offer explanations for the variances among different profiles. In addition to unpacking individual characteristics displayed in high-proficiency L2 English speakers' test responses, the study also holds a discussion of using holistic scales in speaking test, where a balance between rating efficiency and individual differences needs to be delicately maintained.
Linguistic profiles of high proficiency L2 English speakers—A combination of fluency and vocabulary features
Research background
In this study, linguistic profiles were established for L2 English speakers at high proficiency levels, who participated in an oral English test at a university in the United States. This test is generally administered to international graduate students monthly to probe their eligibility to serve as teaching assistants. A six-point holistic scale (35, 40, 45, 50, 55, and 60) was designed to evaluate test takers' performance. Speakers rated 50, 55, and 60 are considered proficient enough to teach undergraduate courses in English independently. Among all the test takers, L1 Mandarin and L1 Hindi speakers constitute the two largest examinee groups, since a high percentage of admitted international graduate students come from China and India.
The performance of each examinee was scored by two raters, and a third rater was consulted when disagreements occurred. While referring to a holistic rubric for test response evaluation, raters need to balance different factors before making their final scoring decision, such as grammar, pronunciation, and syntactic complexity. Before initiating the rating tasks, all raters assigned were required to participate in a monthly training session, which opens a space for discussions over benchmark speech samples and possible difficulties raters have encountered.
During the training sessions, raters repeatedly reported that delivery speed and vocabulary use were two of the most prominent characteristics in differentiating speakers across proficiency levels. Although examinees of high proficiency are often characterized by faster delivery speed and diverse use of vocabulary, speakers who obtained the same high score might still display different patterns of fluency and vocabulary features in their responses. For example, examinees who deliver with a fast speed were scored the same with test takers who speak slower. High speed delivery, however, is accompanied by less diverse or sophisticated vocabulary. In comparison, slower speakers are able to compose their responses with advanced words that appear more frequently in academic contexts. These different combinations of fluency and vocabulary features are not reflected in a holistic rubric, but might cause scoring hesitancy among raters of the test.
This issue becomes more prominent when speakers at a high proficiency level, those who have been rated 50 or above for the oral English test, are involved. Having surpassed the basic “threshold” of linguistic competence, L2 speakers at a high proficiency level may showcase stronger individuality in their use of language. Speakers rated 60 are expected to be differentiated from speakers rated 50 with less effort, and profiles constructed for speakers of these two scores are hypothesized to be clear-cut and more identifiable. This study thus focuses on L2 English speakers rated either 50 or 60 on the test, with an L1 Hindi or L1 Mandarin Chinese background. In total, 409 speech samples were collected from the examinees who participated in the test between the years 2009 and 2015. More detailed information about the speech samples can be found in Table 1 below.
As is shown in Table 1, the sample sizes are uneven for high-proficiency L2 English speakers with an L1 Mandarin or L1 Hindi background. From 2009 to 2015, 3,484 examinees took the oral English test, among whom L1 Mandarin speakers (n =1,166) and L1 Hindi speakers (n = 251) were two prominent examinee groups. As for all the L2 English examinees who scored 50 and above (n = 1,705), 235 out of 251 L1 Hindi speakers were rated as high-proficiency L2 English speakers (Level 50, Level 55, and Level 60), while the number for L1 Mandarin Speakers is 419. It is also noticeable that most of the high-proficiency L1 Mandarin speakers were rated 50 (n = 286), and only a few L1 Mandarin speakers (n = 11) were scored 60. The fact that L1 Mandarin examinees outnumber L1 Hindi examinees resulted in a larger sample size of L1 Mandarin speakers rated 50. The limited number of L1 Mandarin speakers rated 60 may be attributed to the overall English instructional context in China, where more attention is placed on test preparation rather than speaking. Also, the admission policies for some of the departments set rather flexible minimum requirements for the TOEFL speaking score, which might reduce the possible impact of English proficiency level on international students' admission to graduate programs.
The oral English test contains 12 items in total and was designed in four different formats. Examinees' responses were recorded and saved in a data base for research purposes. In this study, the researcher analyzed test takers' response to the first test item, which lasts for 2 min maximum. The speakers needed to read a newspaper headline, and then express their opinions based on a short question. Four testing formats were randomly distributed to speakers during the test. All of the test items are closely related to campus life, which are indicated as the following:
a) Do you think that taking college courses on-line is a good way to study? Why or why not?
b) Do you think a television announcement will have a significant effect on the amount that they recycle? Why or why not?
c) Do you believe that class size affects the quality of education? Why or why not?
d) Do you think it is the university's responsibility to prevent students from illegally downloading music? Why or why not?
Research questions
The current study is designed to investigate the following research questions:
a) Will cluster analysis render linguistic profiles characterized by different combinations of fluency and vocabulary features?
b) Will L2 speakers' English proficiency level and their L1 background have an influence on their profile membership?
Research methods
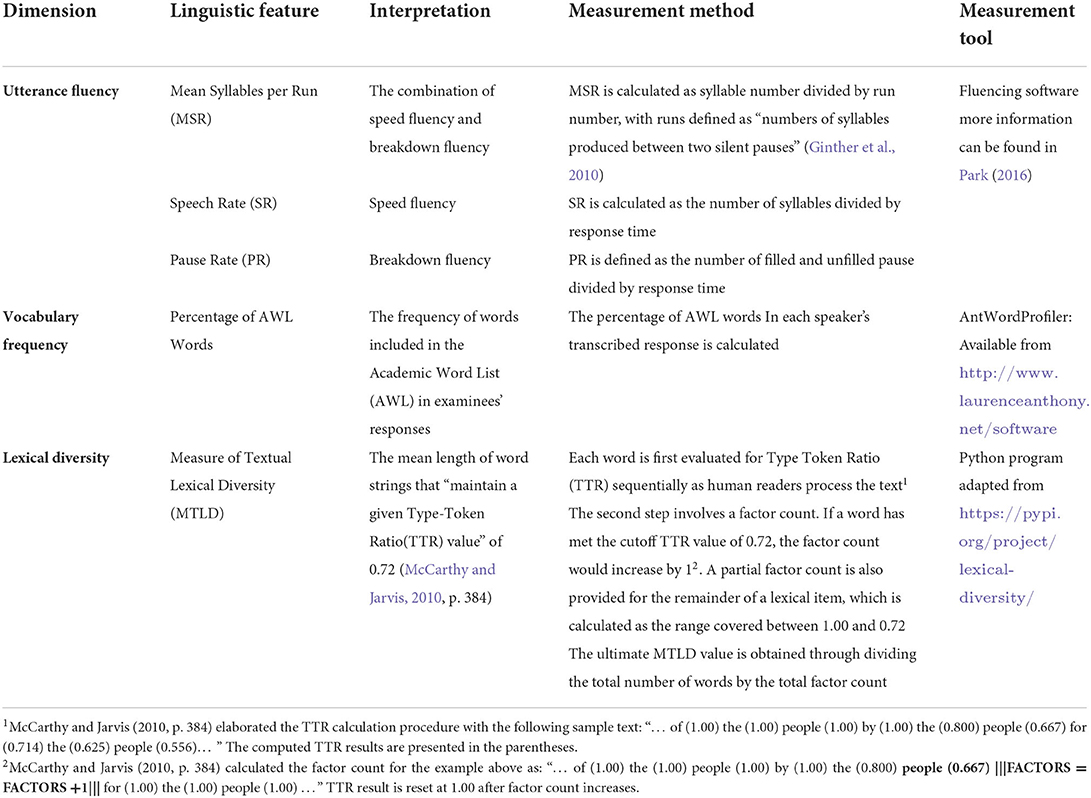
In this study, utterance fluency and vocabulary are two major dimensions for the construction of linguistic profiles. Five indices were measured in total: Mean Syllables per Run (MSR), Speech Rate (SR), Pause Rate (PR), Measure of Textual Lexical Diversity (MTLD), and percentage of words in the Academic Word List (AWL). Table 2 explains the calculation procedure of the five indices, which represent fluency and vocabulary usage from multiple facets.
The second phase of this study involves a Hierarchical Cluster Analysis (HCA) based on all the five fluency and vocabulary measures. As a statistical method that recognizes homogeneity among data, cluster analysis places cases of similar numerical attribution into the same group. Staples and Biber (2015) provided more detailed explanations for the application of cluster analysis in applied linguistics research:
Cluster analysis is a multivariate exploratory procedure that is used to group cases (e.g. participants or texts). Cluster analysis is useful in studies where there is extensive variation among the individual cases within predefined categories. For example, many researchers compare students across proficiency level categories, defined by their performance on a test or holistic ratings. But a researcher might later discover that there is an extensive variation among the students within those categories with respect to their use of linguistic features or with respect to attitudinal or motivational variables. (p. 243)
Among all the clustering techniques, Hierarchical Cluster Analysis (HCA) forms the backbone of cluster analysis (Everitt et al., 2011), where the concepts of homogeneity and separation are of great importance. All agglomerative hierarchical methods ultimately reduce data into one single cluster, while divisive techniques help split data into different groups. Agglomerative HCA is capable of producing a series of data partitions, or groups of speech samples demonstrating identical numerical patterns of the five measures.
In this study, the dataset used for cluster analysis include all four groups of speakers: L1 Hindi speakers rated 50, L1 Mandarin speakers rated 50, L1 Hindi speakers rated 60, and L1 Mandarin speakers rated 60. Profiles emerging from these cases could be used as informative evidence to identify individual linguistic features across different types of L2 speech output. Language teachers and educators are also able to collect important information and adjust pedagogical strategies accordingly.
Before cluster analysis is conducted, measurement outcomes for each of the five variables need to undergo normality and correlation check. Clustering results will be heavily influenced when highly-correlated features are simultaneously included, resulting in collinearity and inaccurate profile extraction. Researchers, however, may not be certain whether the variables selected are highly correlated due to the exploratory nature of cluster analysis. These statistical concerns thus demand for researchers' careful consideration before the implementation of cluster analysis.
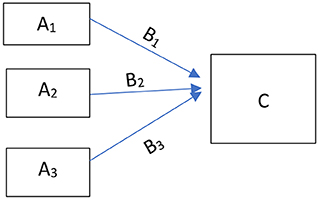
To curb the influence of possible collinearity, PCA is often conducted to tackle the effect caused by significant correlation. The purpose of conducting PCA also lies in identifying index variables from a larger set of measures, as researchers are capable of creating a new index variable through linear combination when correlated variables load on the same dimension. Figure 1 is an explanation of the working mechanism of PCA, where variable A1, A2, and A3 are combined into one component C for further analysis. B1, B2, and B3 are coefficient of the linear combination.
The differences between PCA and EFA were further explicated by Phakiti (2018): “While EFA aims at generalizing to the target population, PCA only aims at reproducing the sample being used” (p. 424). Although both Exploratory Factor Analysis (EFA) and Principal Component Analysis (PCA) are dimension reduction techniques that are exploratory in nature, they differ in theoretical assumptions. EFA is grounded in the assumption that all the observed variables could be explained by a latent variable. Under the framework of PCA, however, the variances of observed variables are calculated to derive a new component.
Research results
Linguistic profiling outcome
Descriptive statistics and box plots of Mean Syllables per Run (MSR), Speech Rate (SR), Pause Rate (PR), Measure of Textual Lexical Diversity (MTLD), and the percentage of words on the Academic Word List (AWL) are presented in Table 3 and Figure 2, respectively.
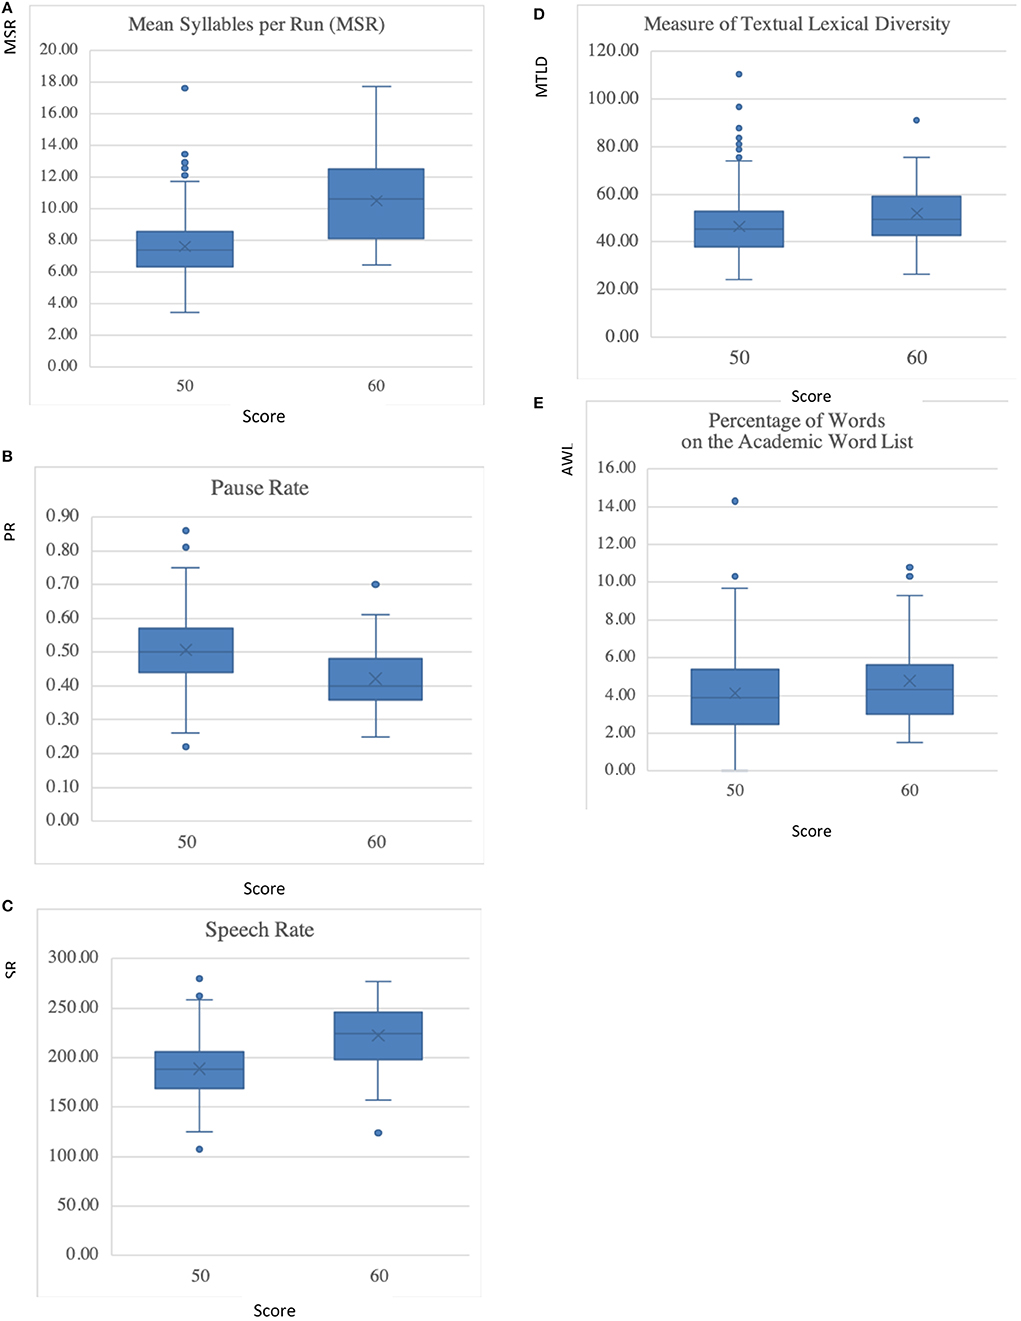
Figure 2. Boxplots of fluency and vocabulary measures across proficiency levels. (A) Mean Syllables per Run (MSR). (B) Pause Rate. (C) Speech Rate. (D) Measure of Textual Lexical Diversity (MTLD). (E) Percentage of Words in the Academic Word List.
Boxplots in Figure 2 demonstrate that the five variables across the two proficiency levels are approximately normally distributed. In addition, the Kurtosis and Skewness statistics for all the variables are within the range between −0.61 and 2.56, indicating that the assumption of normality has been fulfilled.
The correlational results between variables are presented in Table 4. For all of the speakers in this study, Mean Syllables per Run (MSR) is strongly correlated with Speech Rate (SR; r = 0.75) and Pause Rate (PR; r = −0.72). These results are not unexpected, as MSR is a composite variable that integrates both speed fluency and breakdown fluency. The inclusion of MSR in this study is due to its strong effect in differentiating high proficiency L2 English speakers' performances. The two vocabulary measures, Measure of Textual Lexical Diversity (MTLD) and the percentage of words in the Academic Word List (AWL), are correlated with each other to a lesser extent. It should be pointed out that the correlation examination in the study applies to this particular dataset only, and bears limited inferential capacity. The measurement results for each group of speakers are located within a restricted range of L2 English proficiency level. No conclusion should be drawn as significant/insignificant correlation exists when a group of L2 English speakers at a different proficiency level are involved.
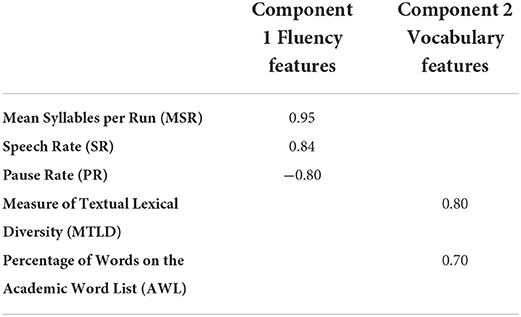
Correlational results in Table 4 suggest that PCA is needed to reduce fluency and lexical variables, so that components to be used for cluster analysis will not induce collinearity. Two components are expected to be created after PCA, where the three fluency variables would load on one component and the two vocabulary features would load on another. The two new components will later be used for Hierarchical Cluster Analysis (HCA).
Speakers rated 50 and 60 were pooled together for PCA, so that common coefficients of linear combination could be obtained. Before conducting PCA, all data were checked for Kaiser–Meyer–Olkin (KMO) measure of sampling adequacy and Bartlett's test of sphericity. KMO is a statistic indicating the proportion of variance that might be caused by underlying factors. While KMO close to 1 suggests inadequate sampling, values lower than 0.5 would lead to an unmeaningful interpretation of PCA results. As for Bartlett's test of sphericity, significant values smaller than 0.05 mean that PCA would be beneficial to data explanation. For the pooled group of data, Bartlett's test of sphericity is <0.01. The KMO measure of sampling adequacy is close to 0.6, which is above the minimum value recommended for PCA. Oblique (Promax) rotation is used for PCA, as fluency and vocabulary measures are assumed to be related in explaining language proficiency test performance.
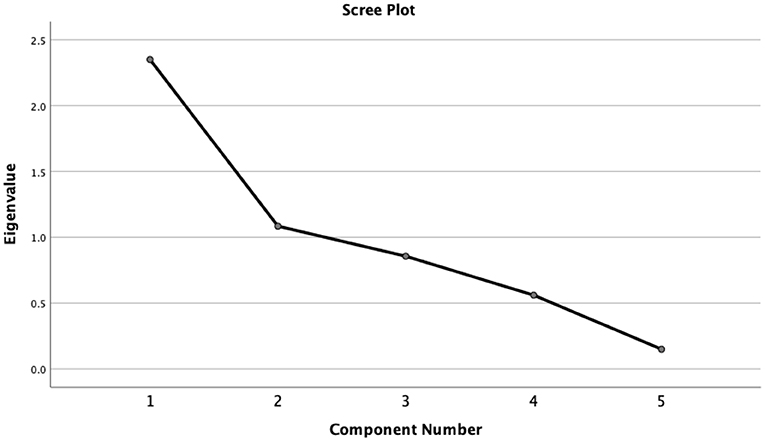
The scree plot in Figure 3 suggests that two components can be extracted. As shown in Table 5, fluency measures are all significantly loaded on Component 1, while Component 2 includes the two vocabulary measures. Component 1 is thus named as fluency features, and Component 2 is named as vocabulary features. The two extracted components account for 68.68% of the variance among the five features. Correlation between the two components, which were used for the subsequent cluster analysis, is reduced to 0.20 after PCA.
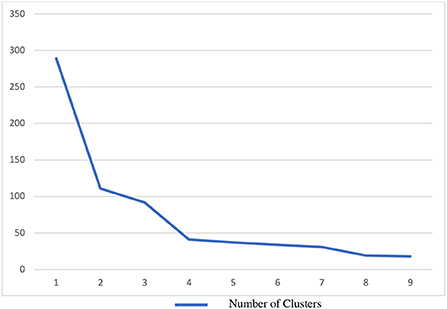
HCA was applied to data analysis with Ward's method of minimum within-group variance. In this study, two main techniques were consulted to decide the number of clusters: (a) Dendrogram observation and (b) scree plot of coefficient change. Figure 4 shows the dendrogram generated for agglomerative HCA, and the scree plot for coefficient change is presented in Figure 5. Both the dendrogram and scree plot are references for deciding the number of clusters. The dendrogram in Figure 4 demonstrates a preliminary view of different clusters along the branches. The scree plot in Figure 5 shows a bending point following a sharp decline of coefficients. Additional new cases are not creating new clusters after the bending point, suggesting that a four-cluster solution is optimal.
Actual results from the cluster analysis are presented in Table 6, which includes descriptive statistics of Component 1 (fluency features) and Component 2 (vocabulary features) across clusters.

Table 6. Descriptive statistics of component 1 (fluency features) score and component 2 (vocabulary features) score across clusters.
Each of the four clusters generated from HCA represents a profile. The cluster mean was transformed to an ordinal scale before the mean value of the five fluency and vocabulary features of each cluster are reported. Table 7 lists more detailed information about the numerical range of each variable and its corresponding ordinal value. Table 8 demonstrates a closer examination at the five individual fluency and vocabulary variables, including mean values of each measure across the four clustered profiles.
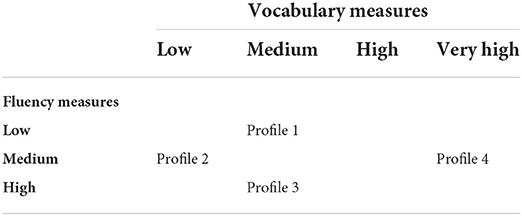
Four profiles can be categorized based on the clustering results, and Table 10 provides a direct view of the characteristics demonstrated in these different profiles.
Profile 1: Low fluency measures + medium vocabulary measures
Low Mean Syllables per Run (MSR), low Speech Rate (SR), very high Pause Rate (PR), medium Measure of Textual Lexical Diversity, and medium percentage of words in the Academic Word List (AWL).
Profile 2: Medium fluency measure + low vocabulary measures
Medium Mean Syllables per Run (MSR), medium Speech Rate (SR), high Pause Rate (PR), low Measure of Textual Lexical Diversity, and low percentage of words in the Academic Word List (AWL).
Profile 3: High fluency measures + medium vocabulary measures
High Mean Syllables per Run (MSR), high Speech Rate (SR), low Pause Rate (PR), medium Measure of Textual Lexical Diversity, and medium percentage of words in the Academic Word List (AWL).
Profile 4: Medium fluency measures + very high vocabulary measures
Medium Mean Syllables per Run (MSR), medium Speech Rate (SR), low Pause Rate (PR), very high Measure of Textual Lexical Diversity, and very high percentage level of words in the Academic Word List (AWL).
Profiles, L1 background, and L2 proficiency level
Further investigation into each profile with Chi-square test shows that profile membership is associated with speakers' L1 background (χ2 = 49.84, p < 0.01) and their overall oral proficiency level (χ2 = 36.99, p < 0.01). Table 9 presents general profile information characterized by fluency and vocabulary measures. Table 10 lists the number of speakers in each cluster grouped by their L1 background and oral English test scores. Although most of the L1 Hindi speakers rated 50 concentrated in Profile 3, the same profile also contains a large number of speakers rated 60.
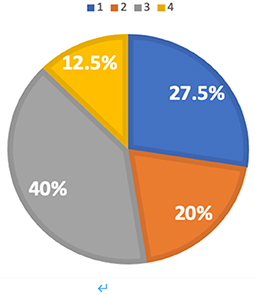
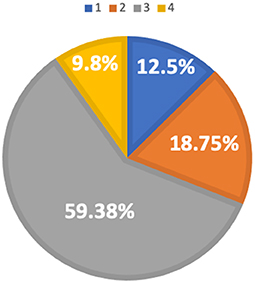
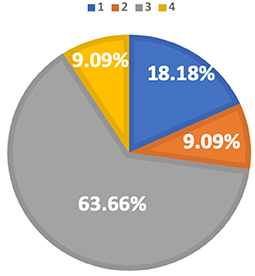
The relationship between speakers' L1 background and their profile membership is displayed in Figures 6–9. Figure 6 is a percentage pie chart illustrating the profile membership of L1 Hindi speakers rated 50. Among all the L1 Hindi speakers who were rated 50, 27.5% of the speakers are in Profile 1, 20% of the speakers are in Profile 2, 40% of the speakers are in Profile 3, and 12.5% of the speakers are in Profile 4. The majority of L1 Hindi speakers are located in Profile 3 based on the measurement results of the five fluency and vocabulary features.
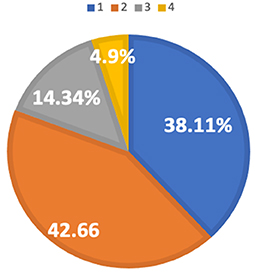
Figure 7 shows the percentage for L1 Mandarin speakers who were rated 50. According to the pie chart, 38.11% percent of the L1 Mandarin speakers are in Profile 1, 42.66% of the speakers are in Profile 2, 14.34% of the speakers are in Profile 3, and 4.9% of the speakers are in Profile 4. In comparison to L1 Hindi speakers rated as 50, most of the L1 Mandarin speakers rated as 50 are in Profile 1 and Profile 2 rather than Profile 3.
The pattern of distribution for the two groups of speakers rated 60, however, does not exhibit as much of a difference as the speakers rated 50. As is shown in Figures 8, 9, most of the L1 Hindi speakers (59.38%) and L1 Mandarin speakers (63.55%) are in Profile 3. However, more L1 Hindi speakers (18.75%) are in Profile 2 when compared with L1 Mandarin speakers (9.08%).
Discussion of linguistic profiles
After cluster analysis, four different profiles emerged from the 409 speech samples, which have showcased different combinations of fluency and vocabulary features. The individuality of each profile indicates the connection between profiling analysis and L2 speaking pedagogy.
A straightforward observation of the profiling results is the reverse relationship between speakers' delivery speed and their use of vocabulary. More specifically, high delivery speed does not coexist with speakers' use of more diverse and complex vocabulary. Speakers in Profile 1 demonstrate medium values in fluency features and low values in vocabulary features, while the situation is the opposite for Profile 2. Speakers located in Profile 2 have enhanced values of vocabulary measures but deliver at a slower speed. A similar phenomenon can also be found in Profile 3 and Profile 4. Speakers of Profile 3 manifest high values in fluency features, in combination with medium values of vocabulary features. Speakers in Profile 4, however, showcase medium-level fluency features but very high values in vocabulary features.
The combination of fluency and vocabulary features in Profile 4 requires more detailed examination. Values for fluency measures (Speech Rate and Mean Syllables per Run) in Profile 4 are lower than Profile 3, and are closer to those of Profile 2. The vocabulary measures of Profile 4, however, are noticeably higher than in any other profiles. It is possible that speakers who use more diverse vocabulary and more academic words control their delivery speed on purpose. In this occasion, lower measures of Speech Rate and Mean Syllables per Run may indicate higher proficiency.
In addition, Profile 4 includes speakers across both proficiency levels and L1 backgrounds: 12.5% of the L1 Hindi speakers rated as 50, 9.8% of the L1 Hindi speakers rated 60, 9.8% of the L1 Mandarin speakers rated 50, and 9.09% of the L1 Mandarin speakers rated 60. Speakers in Profile 4 ranked above average with respect to both delivery speed and vocabulary use, and should have received a score of 60 based on their performance in these two dimensions. Contrary to this hypothesis, Profile 4 contains a relatively high number of speakers rated 50. Other linguistic features, such as discourse structure, rhetorical patterns, and grammatical accuracy, might be influential factors worthy of exploration in future studies.
The association between speakers' L1 background and their profile membership may reflect the disparities in the English instruction received by the L2 English speakers. A large number of L1 Mandarin speakers rated 50 were located in Profile 1 and Profile 2, whereas L2 Hindi speakers rated 50 mostly fell in Profile 3. Profile 1 and Profile 2 is characterized by either slower delivery speed or less diverse vocabulary, which might suggest that instructions on fluency and vocabulary need to be prioritized in the refinement of L1 Mandarin speakers' oral English delivery. It could also be observed that both groups of L2 English speakers were rated 50 on a holistic rubric regardless of their differences in delivery speed and use of vocabulary. These two dimensions are important building blocks for linguistic profiles of L2 spoken English. However, raters' perception of speakers' overall English proficiency level may still be affected by other factors, such as accent, syntactic complexity, and grammatical accuracy.
This study also offers insights into the use of holistic rubrics in L2 speaking testing and assessment. Profiling results have indicated that speakers rated at the same level still fully demonstrate individuality regarding vocabulary and delivery fluency. Holistic rubrics, which ask raters to make the scoring decision based on an overall evaluation of all the key dimensions involved, could reduce possible disagreement and help reach consensus in an efficient manner. It is important for language researchers and teachers to keep in mind, however, that holistic rubrics are not in denial of the existence of individual differences. Learners' L1 background, L2 proficiency level, and delivery style are intricately intertwined, which requires more careful observation and analysis before explanations of individual differences can be provided.
Profiling, pedagogical implications, and possible concerns
From the perspective of language teaching and learning, linguistic profiling presents an opportunity for language teachers to adopt a more accommodating approach to pedagogy design. This study, for example, provided L2 speakers with possible guidance for delivery skill refinement. Speakers in Profile 3 demonstrated the fastest delivery speed, while speakers in Profile 4 used more diverse and complex vocabulary. Both profiles contained L2 speakers who scored 50 as well as L2 speakers who scored 60. In other words, delivering content at a fast speed and using diverse and complex vocabulary often offset one another. Achieving high measurement results at one dimension does not necessarily lead to an increase in the overall test score. It is possible that vocabulary use and fluency work together in a balanced way to reach the goal of effective communication. In spite of the fact that examinees who were rated 50 and 60 are qualified to teach undergraduate-level courses, mapping out their different linguistic profiles is still of great benefit for L2 English speakers if further progress is desired. It could also be hypothesized that speakers make use of different strategies intentionally when delivering in a second/foreign language, which might lead to the individuality demonstrated in their responses. More exploration is thus needed to investigate the reasons for individual differences in speech production. Possible research designs include connecting L2 speakers' language performance with cognitive tasks, or conducting qualitative interviews to inquire the strategies L2 speakers adopt for test-taking purposes.
Interpretation made from linguistic profiling results has been integrated in research fields such as law, criminology, and social justice (Welch, 2007; Legewie, 2016; Baugh, 2018; Minhas and Walsh, 2018). Equity is advocated through disconnecting linguistic profiling outcome from stereotypical attributes of the language users. To avoid misunderstanding linguistic profiling as one of the causes of stereotyping, researchers need to articulate the method and primary purpose. The construction of linguistic profiles is realized through the selection of key dimensions and the measurement of linguistic features. The research goal, however, is not to fit individual learners into a fixed category or pin labels on them based on anecdotal snippets.
Linguistic profiling research presents another important issue for consideration: How multi-faceted should linguistic profiles be? Researchers need to identify the major dimensions for establishing profiles, which could be represented by a myriad of quantitative indices. Index selection, however, often leads to a conflict between interpretability and parsimony. A limited volume of indices would result in an incomplete presentation of the major dimensions, causing inaccurate profile extraction. Various computational tools are indeed of great assistance for automatically calculating the quantitative indices' numerical values, but the involvement of a large number of indices may increase the risk of collinearity. It is not difficult to predict that methodological justifications and statistical interpretations would remain critical concerns for linguistic profiling research in the future.
Data availability statement
The raw data supporting the conclusions of this article will be made available by the authors, without undue reservation.
Author contributions
The author confirms being the sole contributor of this work and has approved it for publication.
Funding
This paper represents independent research part-funded by the Chenguang Scholar Grant (Grant Number 20CG04), which is jointly provided by Shanghai Municipal Education Committee and Shanghai Education Development Foundation.
Acknowledgments
The author would like to thank Dr. April Ginther and Dr. Nancy Kauper for kindly providing access to the testing data. Valuable comments and feedback from the journal editor and reviewers are also deeply appreciated.
Conflict of interest
The author declares that the research was conducted in the absence of any commercial or financial relationships that could be construed as a potential conflict of interest.
Publisher's note
All claims expressed in this article are solely those of the authors and do not necessarily represent those of their affiliated organizations, or those of the publisher, the editors and the reviewers. Any product that may be evaluated in this article, or claim that may be made by its manufacturer, is not guaranteed or endorsed by the publisher.
References
Ågren, M., Granfeldt, J., and Schlyter, S. (2012). “The growth of complexity and accuracy in L2 French: past observations and recent applications of developmental stages,” in Dimensions of L2 Proficiency and Performance: Complexity, Accuracy and Fluency in SLA, eds A. Housen, F. Kuiken, and I. Vedder (Amsterdam and Philadelphia: John Benjamins Publishing Company), 95–119. doi: 10.1075/lllt.32.05agr
Alarcón, I. (2010). Advanced heritage learners of Spanish: a sociolinguistic profile for pedagogical purposes. Foreign Lang. Ann. 43, 269–288. doi: 10.1111/j.1944-9720.2010.01078.x
Banat, H. (2021). The status and functions of English in contemporary Lebanon. World Englishes 40, 268–279. doi: 10.1111/weng.12513
Bartening, I. (2000). Gender agreement in L2 French: pre-advanced vs advanced learners. Stud. Linguist. 54, 225–237. doi: 10.1111/1467-9582.00062
Baugh, J. (2018). Linguistics in Pursuit of Justice. Cambridge, UK: Cambridge University Press. doi: 10.1017/9781316597750
Brindley, G. (1998). “Describing language development? Rating scales and SLA,” in Interface Between Second Language Acquisition and Language Testing, eds L. F. Bachman and A. D. Cohens (Cambridge, UK: Cambridge University Press), 112–140. doi: 10.1017/CBO9781139524711.007
Ciszér, K., and Dornyei, Z. (2005). Language learner” motivational profiles and their motivated learning behavior. Lang. Learn. 55, 613–659. doi: 10.1111/j.0023-8333.2005.00319.x
Clahsen, H. (1985). “Profiling second language development: a procedure for assessing second language proficiency,” in Modelling and Assessing Second Language Acquisition, eds K. Hiltenstam and M. Piennemann (Clevedon, UK: Multilingual Matters), 283–331.
Custódio, J., and Paraboni, I. (2021). Stacked authorship attribution of digital texts. Expert Syst. Appl. 176, 114866. doi: 10.1016/j.eswa.2021.114866
Delaere, I., De Sutter, G., and Plevoets, K. (2012). Is translated language more standardized than non-translated language?: using profile-based correspondence analysis for measuring linguistic distances between language varieties. Target Int. J. Transl. Stud. 24, 203–224. doi: 10.1075/target.24.2.01del
Delmondes Neto, J., and Paraboni, I. (2022). Multi-source BERT stack ensemble for cross-domain author profiling. Expert Syst. 39, 1–19. doi: 10.1111/exsy.12869
Deutsch, C., and Paraboni, I. (2022). Authorship attribution using author profiling classifiers. Nat. Lang. Eng. 1−28. doi: 10.1017/S1351324921000383. [Epub ahead of print].
Divjak, D. T., and Gries, S. (2006). Ways of trying in Russian: clustering. Corpus Linguist. Linguist. Theory 2, 23–60. doi: 10.1515/CLLT.2006.002
Esseili, F. (2017). A sociolinguistic profile of English in Lebanon. World Englishes 36, 684–704. doi: 10.1111/weng.12262
Everitt, B. S., Landau, S., Leese, M., and Stahl, D. (2011). Cluster Analysis. Chichester, UK: Wiley.
Fabricius, A. (2006). The “vivid sociolinguistic profiling” of received pronunciation: responses to gendered dialect-in-discourse. J. Sociolinguist. 10, 111–122. doi: 10.1111/j.1360-6441.2006.00320.x
Friginal, E., Li, M., and Weigle, S. (2014). Revisiting multiple profiles of learner compositions: a comparison of highly rated NS and NNS essays. J. Second Lang. Writ. 23, 1–16. doi: 10.1016/j.jslw.2013.10.001
Friginal, E., and Weigle, S. (2014). Exploring multiple profiles of L2 writing using multi-dimensional analysis. J. Second Lang. Writ. 26, 80–95. doi: 10.1016/j.jslw.2014.09.007
Ginther, A., Dimova, S., and Yang, R. (2010). Conceptual and empirical relationships between temporal measures of fluency and oral English proficiency with implication for automated scoring. Lang. Test, 27, 377–399.
Graham, S., Woore, R., Porter, A., Courtney, L., and Savory, C. (2020). Navigating the challenges of L2 reading: self-efficacy, self-regulatory reading strategies, and learner profiles. Mod. Lang. J. 104, 693–714. doi: 10.1111/modl.12670
Grandfeldt, J., and Ågren, M. (2014). SLA developmental stages and teachiers' assessment of written French: exploring Direkt Profil as a diagnostic assessment tool. Lang. Test. 31, 285–305. doi: 10.1177/0265532214526178
Gries, S. T. (2010). Behavioral profiles: a fine-grained and quantitative approach in corpus-based lexical semantics. Ment. Lex. 5, 323–346. doi: 10.1075/ml.5.3.04gri
Halteren, H. (2007). Author verification by linguistic profiling. ACM Trans. Speech Lang. Process. 4, 1–17. doi: 10.1145/1187415.1187416
Hoffmann, C. (2012). Cohesive Profiling: Meaning and Interaction in Personal Weblogs. Amsterdam/Philadelphia: John Benjamins. doi: 10.1075/pbns.219
Jarvis, S., Grant, L., Bikowski, D., and Ferris, D. (2003). Exploring multiple profiles of highly rated learner compositions. J. Second Lang. Writ. 12, 377–403. doi: 10.1016/j.jslw.2003.09.001
John, P., Brooks, B., and Schriever, U. (2017). Profiling maritime communication by non-native speakers: a quantitative comparison between the baseline and standard marine communication phraseology. English Specif. Purp. 47, 1–14. doi: 10.1016/j.esp.2017.03.002
Keβler, J. U., and Liebner, M. (2011). “Diagnosing L2 development: rapid profile,” in Studying Processability Theory: An Introductory Textbook, eds M. Pienemann and J. U. Keβler (Amsterdam/Philadelphia: John Benjamins), 133–148. doi: 10.1075/palart.1.11dia
Kowsari, K., Heidarysafa, M., Odukoya, T., Potter, P., Barnes, L., Brown, D., et al. (2020). Gender detection on social networks using ensemble deep learning. arXiv [Preprint]. arXiv:2004.0651.
Kuznetsova, J. (2015). Linguistic Profiles: Going from Form to Meaning via Statistics. The Hague: Morton. doi: 10.1515/9783110361858
Legewie, J. (2016). Racial profiling and the use of force in police stops. Am. J. Sociol. 122, 379–424. doi: 10.1086/687518
Lundberg, J., and Laitinen, M. (2020). Twitter trolls: a linguistic profile of anti-democratic discourse. Lang. Sci. 79, 101268–101214. doi: 10.1016/j.langsci.2019.101268
Manna, R., Pascucci, A., and Monti, J. (2019). “Gender detection and stylistic differences and similarities between males and females in a dream tales blog,” in CLiC-it 2019 Sixth Italian Conference on Computational Linguistics (Vol. 2481) (Bari).
McCarthy, P. M., and Jarvis, S. (2010). MTLD, vocd-D and HD-D: A validation study of sophisticated approaches to lexical diversity assessment. Behav. Res. Methods 42, 381–392.
Minhas, R., and Walsh, D. (2018). Influence of racial stereotypes on investigative decision making in criminal investigations: a qualitative comparative analysis. Cogent Soc. Sci. 4, 1538588. doi: 10.1080/23311886.2018.1538588
Moreno-Sandoval, L., Pomares-Quimbaya, A., and Alvarado-Valencia, J. (2021). Celebrity profiling through linguistic analysis of digital social networks. Comput. Soc. Netw. 8, 1–36. doi: 10.1186/s40649-021-00097-w
Park, S. (2016). Measuring fluency: Temporal variables and pausing patterns in L2 English speech. (Unpublished Doctoral Dissertation). Purdue University, West Lafayette, IN.
Peng, J., Choo, K., and Ashman, H. (2016). Bit-level n-gram based forensic authorship analysis on social media: identifying individuals from linguistic profiles. J. Netw. Comput. Appl. 70, 171–182. doi: 10.1016/j.jnca.2016.04.001
Phakiti, A. (2018). “Exploratory factor analysis,” in The Palgrave Handbook of Applied Linguistics Research Methodology, eds A. Phakiti, P. De Costa, L. Plonsky, and S. Starfield, S. (London, UK: Palgrave Macmillan), 423–457.
Pienemann, M. (1998). Language Processing and Second Language Development: Processability Theory. Amsterdam/Philadelphia: John Benjamins. doi: 10.1075/sibil.15
Pienemann, M. ed (2005). Cross-linguistic Aspects of Processability Theory. Amsterdam/Philadelphia: John Benjamins. doi: 10.1075/sibil.30
Pienemann, M., and Keβler, J. U. eds (2011). Studying Processability Theory: An Introductory Textbook. Amsterdam/Philadelphia: John Benjamins. doi: 10.1075/palart.1
Potocki, A., Ecalle, J., and Magnan, A. (2017). Early cognitive and linguistic profiles of different types of 7- to 8-year-old readers. J. Res. Read. 40, S125–S140. doi: 10.1111/1467-9817.12076
Potthast, M., Gollub, T., Rangel, F., Rosso, P., Stamatatos, E., Stein, B., et al. (2014). “Improving the reproducibility of PAN's shared tasks. Plagiarism detection, author identification, and author profiling, in Information Access Evaluation. Multilinguality, Multimodality, and Interaction. CLEF 2014. Lecture Notes in Computer Science, 8685. Cham: Springer. doi: 10.1007/978-3-319-11382-1_22
Prentza, A., and Kaltsa, M. (2020). Linguistic profiling of heritage speakers of an endangered language: the case of Vlach Aromanian-Greek bilingual. Open Linguist. 6, 626–641. doi: 10.1515/opli-2020-0034
Ryslewicz, J. (2008). Cognitive profiles of (un)successful FL learners: A cluster analytical study. Mod. Lang. J. 92, 87–99.
Saito, K., Ilkan, M., Magne, V., Tran, M., and Suzuki, S. (2018). Acoustic characteristics and learner profiles of low-, mid- and high-level second language fluency. Appl. Psycholinguist. 39, 593–617. doi: 10.1017/S0142716417000571
Staples, S., and Biber, D. (2015). “Cluster analysis,” in L. Plonsky (Ed.), Advanced Quantitative Methods in Second Language Research (New York, NY: Routledge), 243–74. doi: 10.4324/9781315870908-11
Van Compernolle, R. A. (2014). Profiling second language sociolinguistic development through dynamically administered strategic interaction scenarios. Lang. Commun. 37, 86–99. doi: 10.1016/j.langcom.2014.01.003
Wang, C., Verdon, S., McLeod, S., and Tran, V. (2021). Profiles of linguistic multicompetence in Vietnamese–English speakers. Am. J. Speech Lang. Pathol. 30, 1711–1727. doi: 10.1044/2021_AJSLP-20-00296
Welch, K. (2007). Black criminal stereotypes and racial profiling. J. Contemp. Crim. Justice 23, 276–288. doi: 10.1177/1043986207306870
Keywords: linguistic profiling analysis, cluster analysis, L2 speech production, quantitative research methods, language testing
Citation: Gao J (2022) An investigation of high-proficiency L2 English speakers' oral test performance: A profiling approach. Front. Commun. 7:926409. doi: 10.3389/fcomm.2022.926409
Received: 22 April 2022; Accepted: 24 October 2022;
Published: 10 November 2022.
Edited by:
Boping Yuan, University of Cambridge, United KingdomReviewed by:
Alessia Cherici, Indiana University Bloomington, United StatesFengchao Zhen, Shanghai Jiao Tong University, China
Copyright © 2022 Gao. This is an open-access article distributed under the terms of the Creative Commons Attribution License (CC BY). The use, distribution or reproduction in other forums is permitted, provided the original author(s) and the copyright owner(s) are credited and that the original publication in this journal is cited, in accordance with accepted academic practice. No use, distribution or reproduction is permitted which does not comply with these terms.
*Correspondence: Jie Gao, Z2FvX2ppZUBmdWRhbi5lZHUuY24=
 Jie Gao
