
94% of researchers rate our articles as excellent or good
Learn more about the work of our research integrity team to safeguard the quality of each article we publish.
Find out more
ORIGINAL RESEARCH article
Front. Commun., 09 June 2022
Sec. Psychology of Language
Volume 7 - 2022 | https://doi.org/10.3389/fcomm.2022.869084
This article is part of the Research TopicEffective and Attractive Communication Signals in Social, Cultural, and Business ContextsView all 36 articles
 Emma Rodero1,2*
Some non-verbal cues, such as voice pitch and gestures, can influence the individual's emotional response to different messages. For this reason, non-verbal communication can be understood as the language of emotion, while the content is the language of ideas. But the research question here is what voice pitch and hand gesture strategies are more effective, attractive, and elicit a stronger emotional response. To answer this question, this study analyzes some pitch and hand gesture strategies in public discourses. In the experiment, 120 participants were exposed to different public presentations with three conditions for voice pitch (few, medium, and many variations) and three for hand gestures (smooth, medium, and strong intensity). Then, they rated the effectiveness and attractiveness levels and self-report arousal and valence while their emotional response was registered. Physiological arousal was measured with electrodermal activity (EDA) and valence with facial expression recognition. Participants perceived the medium pitch variations and the medium intensity of gestures as the most effective and attractive strategies with the highest self-reported arousal and valence. The combination that elicited the strongest autonomic arousal was medium pitch variations-strong gestures. Finally, the most positive emotional valence was for many pitch variations and medium gestures and the happiest for the combination many-strong.
When we see and listen to a person talking, two different parts can be distinguished in communication: what this person says and how they say it, or in other words, the content and the form of the message. How this person says something or the form of the message, is called non-verbal communication, and it is as important or more as speech content (Birdwhistell, 1970; Guyer et al., 2019). Every part of our body, each movement, facial expression, or pitch variation have a meaning (Burgoon et al., 2010). In fact, our brain can draw impressions about a speaker in milliseconds, just by looking at the speakers' faces and bodies (Bar et al., 2006) or by listening to their voices.
Knapp (1980) provided a classification of seven dimensions of non-verbal communication. These components are kinesics (gestures, movement, and postures), paralanguage (related to voice features), proxemics (space and distances), physical contact (touching), physical characteristics of people (skin color…), adornments (clothes, jewelry…), and environmental factors (related to the physical setting). Of all of them, the most relevant codes are kinesics and vocalics (Burgoon et al., 2010). Therefore, in this study, we will focus on these two categories.
There are some studies about non-verbal communication analyzing the different components, especially kinesics. The most productive research period was between 1970 and 1980. However, according to Gordon et al. (2006), much of this research has a theoretical research orientation or an application demonstration orientation, with no empirical data to support the analysis and conclusions. Along with a lack of empirical research, few studies have employed psychophysiological methods to know the underlining mechanisms of these codes and how they are cognitively processed. Using these techniques applied to the study of non-verbal communication has some advantages (Potter and Bolls, 2012; Rodero, 2021). The first one is that the response is registered at the same time that people are exposed to the non-verbal stimulus. Therefore, we do not have to trust in individuals' perceptions, in what they think or perceive when they are not in front of the stimulus. The second is that we can measure the individuals' unconscious or implicit responses. This benefit is very important when analyzing non-verbal communication, as most signals are processed unconsciously. The third is that we can have a more objective measure of the non-verbal stimulus than trusting self-reporting. Consequently, it is essential to include these techniques to examine non-verbal signals, add rigor to the analysis, and have a better idea of what subjects are thinking and feeling.
Non-verbal communication cues can influence the message's perception and processing (Newman et al., 2016; King et al., 2020). We use our body and voice changes to reinforce or qualify what we are saying, convey emotions, attitudes, and intentions, regulate the flow of communication, establish contact, and provide feedback with/to other people. Clark and Greatbatch (2011) have shown that charismatic leaders use voice pitch variations, eye contact, gestures, and facial expressions. Consequently, how presenters in public speaking use their voices and gestures is crucial to engage the audience, attract attention, and elicit different emotions (Jackob et al., 2011; Talley and Temple, 2015). Scott (1920), in an old document titled Elocution, defined nonverbal communication as the language of sentiment and emotion, whereas the content was the language of ideas. As voice pitch and gestures can be relevant in determining how effective and attractive a public speech is (Beattie and Shovelton, 2005; Dargue et al., 2019) and elicit emotional reactions, we will focus on these features and variables in this study, analyzed with self-report and psychophysiological techniques. Therefore, this research aims to analyze the effectiveness, attractiveness, and emotional response (arousal and valence) of different strategies, such as pitch variations and intensity of hand gestures, in public discourses.
The main contributions of this study will be 2-fold: a) to advance in the analysis of non-verbal cues, such as voice pitch and gestures and their influence on information processing and emotional response; b) to establish some practical recommendations to use these two features when delivering public speeches.
Our voice plays a huge role in our social relationships (Cherry, 1953; Belin et al., 2004) and, therefore, in persuasive messages as public discourses (Rodero et al., 2022). How we use it is called prosody. Prosody is very important in non-verbal communication as it represents the set of features that we use when speaking. If the voice is our instrument, prosody metaphorically could be the song we play. Prosody is a linguist component with an essential role in communication, as it can influence the perception of a speaker (Elbert and Dijkstra, 2014; Varghese and Nilsen, 2020; Weinstein et al., 2020) and affect the cognitive processing of messages (Hirschberg and Pierrehumbert, 1986; Levi and Pisoni, 2007; Rodero et al., 2017). How a person speaks can be very relevant for the level of effectiveness and the listeners' cognitive and emotional response.
Prosody is composed of intonation, stress, and rhythm, among other features (Wells, 2007; Rodero et al., 2019). One of the main components is intonation. Intonation is composed of the different pitch variations (rises and falls) produced in spoken language (Tench, 2015). However, research about the influence of these tone or pitch variations in public speaking is scarce despite its importance. The studies about their impact on persuasive messages indicate that the most effective strategy is using a moderate pitch level with significant pitch variations, especially against monotonous styles (Burgoon et al., 1990; Hincks, 2004; Strangert, 2005; Yang et al., 2020). Jackob et al. (2011) found that substantial pitch changes increased persuasiveness and credibility. Rosenberg and Hirschberg (2009), Yang et al. (2020), and Niebuhr and Silber-Varod (2021) concluded that a higher and varied pitch is related to charisma. Rodero et al. (2017) demonstrated that the strategies with pitch variations in commercials increased listeners' attention and the ads were better recalled. Moreover, the messages with changes were perceived as the most effective and adequate. Recently, in public discourses, Rodero et al. (2022) showed that a moderate emphatic intonation was considered the most effective and credible, grabbed more attention, and elicited higher autonomic arousal. Conversely, other authors have not found pitch effects on persuasion (Elbert and Dijkstra, 2014), credibility (Chebat et al., 2007), or the attitude toward the message (Gélinas-Chebat et al., 1996).
The reason why pitch variations can work better from a cognitive point of view is that tone changes can more easily grab the listeners' attention and improve comprehension compared to a lack of variations or less variety, according to the Principle of Distinctive and Contrastive Coherence of Prosody (Rodero, 2015). When the spoken sequence is produced with pitch changes, there is an acoustic contrast between intonation rises and falls. Then, this sequence sounds more dynamic (Addington, 1968) and, hence, more effective (Rodero et al., 2017). But what is more important is that this auditory difference may attract the listener's attention and increase arousal, especially in high tones or rising contours (Hill and Miller, 2010). Together with this contrastive effect, these changes also act by differentiating the relevance of the content (less important in high pitch and more important in low pitch) and, consequently, beneficiating comprehension. However, although these changes are essential, an excessive number of variations could be counter-productive, as the sequence could sound exaggerated or unnatural. Therefore, theoretically, a moderate strategy with progressive pitch variations could be the best option (Rodero et al., 2022). On the contrary, if there are not many pitch changes, the sequence can sound monotonous and dull; thus, less effective and attractive (Glass, 1991; Knapp and Hall, 2007; Rodero, 2013). An unsuccessful speaker is monotonous (Strangert and Gustafson, 2008). Moreover, this lack of variation may affect arousal and attention due to the perception of a constant and repetitive sound. It is the phenomenon called “sensory adaptation” (Wark et al., 2007). Our brain becomes fatigued, as there is no acoustic contrast. Therefore, this monotony could hinder the emotional response, reducing participants' arousal, and being perceived as more negative. Based on these studies and ideas, we formulate the two first hypotheses of this research.
H1: The style with medium pitch variations will be perceived as more effective and attractive than few and many changes.
H2: The style with medium pitch variations will elicit higher arousal and positive valence than few and many changes, both in self-report and physiological and facial expression analysis.
With prosody, gestures are important for a message's perception and information processing (King et al., 2020; Rodero et al., 2022). Inside this category, hand gestures are the spontaneous movements individuals make with their hands while talking (Wagner et al., 2014). These movements usually accompany speech (Iverson and Goldin-Meadow, 1998). According to Ekman and Friesen (1969), there are five kinds of gestures: illustrators (that convey semantic content), emblems (that represent conventional signs), regulators (that control conversational flow), emotional displays (for expressing emotions), and adaptors (to contact and touch). Most research has been devoted to analyzing illustrators (Harris, 2003). These gestures are coordinated with speech and aligned with semantic content (Jannedy and Mendoza-Denton, 2005). As this research also explores voice pitch, a feature related to speech, illustrators will be the gestures examined here.
Hand gestures, especially illustrators and regulators, aid lexical and semantic processing (Krauss et al., 1991) and provide some information to the listener (Kendon, 1981). Therefore, its use has shown to be beneficial for perception and cognitive processing, especially compared to the lack of them (Ekman et al., 1980; Loehr, 2004). For perception, people that use hand gestures are considered as more effective (Beattie and Shovelton, 2005), persuasive (Jackob et al., 2011; Peters and Hoetjes, 2017), credible (Maricchiolo et al., 2009), dominant (Gnisci and Pace, 2014), extrovert (Neff et al., 2010), sociable (Burgoon et al., 1990), and honest (King et al., 2020). Therefore, there is a positive perception when someone uses hand movements. For cognitive processing, some studies have shown that these gestures can improve understanding and comprehension (Graham and Argyle, 1975; Riseborough, 1981; Hostetter, 2011; Kelly et al., 2015; Dargue et al., 2019), attention (Berger and Popelka, 1971), memory (Ianı̀ and Bucciarelli, 2017; Clough and Duff, 2020), stimulate emotional reactions (Jackob et al., 2011), and clarify the discourse content (Holle and Gunter, 2007). According to the integrated system hypothesis (Kelly et al., 2010), gestures are part of an integrated system together with speech. They illustrate and draw what we are saying; therefore, they can help to understand the message.
Most research has compared the use against not use of hand gestures. For instance, Maricchiolo et al. (2009) showed that effectiveness was higher in the gesture presence condition than in the no-gesture condition. However, studies about the way to use them are scarce. Specifically, the number or intensity of gestures can be the determinant variables that affect perception and emotional response, as they can modify the expressivity level. In this regard, some studies have demonstrated positive results for a high number of gestures. Gnisci and Pace (2014) found that some speakers were considered more dominant when making a high rate of gestures. Along with this, a study of the well-known TED talks concluded that hand gestures made the speaker seem more compelling. In the most popular talks, the speakers used 465 hand gestures, whereas in the least popular, the speakers used 272 gestures (Van Edwards, 2017). However, these were self-report and perception studies that did not measure the emotional response and did not use psychophysiological techniques. The most similar study to this research was conducted recently by Rodero et al. (2022). These authors compared three different amounts of gestures. They concluded that using a moderate quantity of gestures was perceived as the most effective and credible, and a high quantity of gestures increased the participants' attention and body activation. But, along with the number of gestures, the intensity of these hand movements could also be an influent factor, as this study analyzes. A person moving both hands simultaneously could be considered more expressive than an individual moving gently only one hand when speaking. However, as with voice pitch, an excessive intensity in making gestures might be exaggerated and provoke distractions, especially as these features are visually registered. Therefore, this research hypothesizes that the medium intensity of gestures (not smooth but not strong) could be the best strategy. Strongly marked gestures could distract the audience, whereas smooth gestures could not elicit a significant emotional response. In consequence, we posit the last hypotheses of this study.
H3: The style with medium intensity of gestures will be perceived as more effective and attractive than the styles with smooth and strong gestures.
H4: The style with medium intensity of gestures will elicit higher arousal and positive valence than the styles with smooth and strong gestures, both in self-report and physiological and facial expression analysis.
The design of this study was a 3-voice pitch variation (few–medium–many) by 2 (scripts) within-subject experiment applied to effectiveness and self-reported valence and arousal. The design was the same for gestures but with three different intensities (smooth–medium–strong). The statistical analyses of physiological data (arousal) and valence were submitted to a 3-pitch variation (voice pitch styles or gestures) ANOVA. The voice pitch and gestures styles and actors were within-subject factors, whereas the two discourses were between-subject factors.
A total of forty-eight videos were recorded for this experiment, 24 on each speech, 12 by each of the four speakers. The discourses were prepared specifically for this study to control all the variables. The content was neutral and familiar for college students. The discourses were short as elevator pitches with an average of 25 s. Actors recorded both speeches with a different combination of non-verbal features: three pitch variations (few–medium–many) and three intensities of gestures (smooth–medium–strong).
Voice pitch was analyzed using Praat's acoustic analysis software (Boersma and Weenink, 2022) by measuring pitch level and pitch range. There were three different types of pitch variations (few–medium–many). The pitch values were calculated in semitones (re 1Hz). The pitch level average in the strategy with few pitch variations was 80.68 st. In the strategy with medium variations, the pitch level average in actors was 85.23 st. Finally, in many variations, the level was 90.82 st. There were significant differences among the three pitch variations (F (2,9) = 13.98, p = 0.002). The pitch range or the variation between the maximum and the minimum pitch was 19.85 st. in the strategy with few pitch variations, 24.13 st. in medium variations, and 29.33 st. in the many variations style. There were significant differences among the three pitch variations (F (2,9) = 6.85, p = 0.016). Figure 1 shows the curves of intonation with the same text.
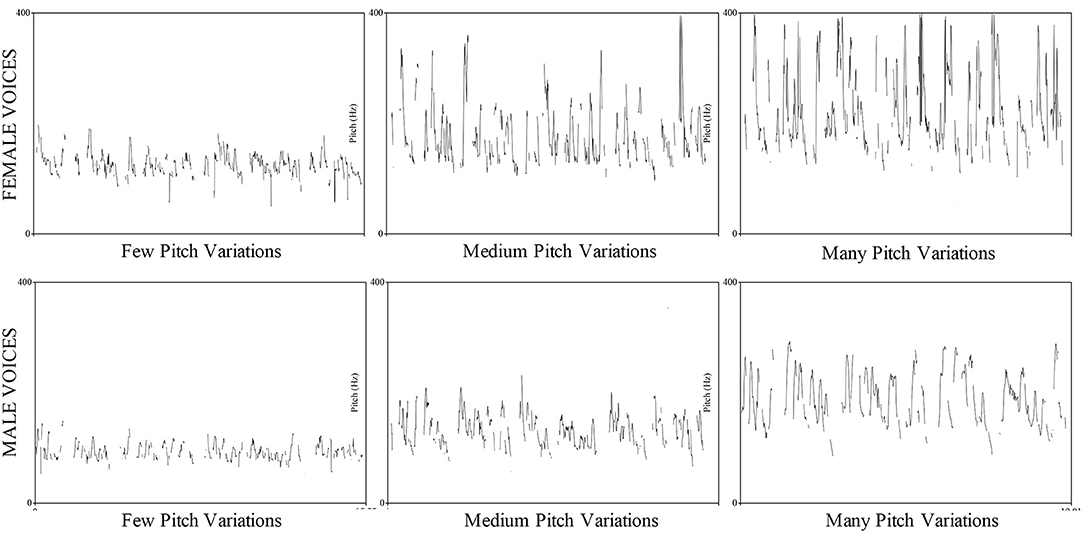
Figure 1. Intonation.
The intensity of gestures was controlled and measured with the software Codimg, a performance analysis application that classifies gestures. The gestures used in this study were illustrators (Ekman and Friesen, 1969). The movement was slight in the smooth strategy with one hand in the low part of the body, more intense with one hand in the high part of the body for the medium strategy, and more marked using two hands chest-high for strong gestures, as shown in Figure 2. Accordingly, facial expressions were growing in intensity from smooth to strong.
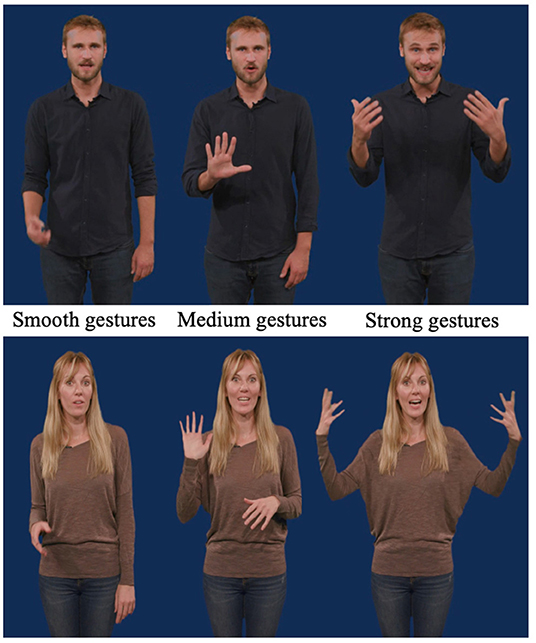
Figure 2. Gestures.
The discourses were recorded in a TV studio equipped with a teleprompter for the actors to read the speeches, similar lights and acoustic conditions, a professional lavalier microphone, and a blue background. In postproduction, all the audios were normalized by using Pro Tools.
A total of one hundred and twenty university students (79 women and 41 men) aged between 20 and 30 years (M = 21, SD = 1.08) formed the sample of this study. Participants were communication students. They were divided into two groups. A total of sixty watched the first discourse (24 videos) and 60 the second one (24 videos). The 120 participants were exposed to all the experimental conditions except the type of discourse: 3 voice pitch variations (few–medium–many) and 3 intensity gestures (smooth–medium–strong) by 4 actors.
For effectiveness, we partially used a scale based on the Rodero et al. (2013) effectiveness index. The scale measured how natural, clear, and understandable the speech was. These three dimensions were measured on a 5-point scale, with 1 representing the minimum value and five the maximum. The scale had a high Cronbach's alpha coefficient (α = 0.83).
Participants rated how competent, persuasive, and pleasant the speech was for attractiveness. These three dimensions were measured on a 5-point scale, with 1 representing the minimum value and five the maximum. The scale had a high Cronbach's alpha coefficient (α = 0.90).
The emotional response was analyzed using their two main dimensions: arousal and valence (Bradley and Lang, 1994), both in self-report and physiological (arousal) and facial recognition (valence) response. The first dimension, arousal, is responsible for body activation and is the state of being awake and alert (Dawson et al., 2000). This state is produced as sympathetic nervous system response. If the level of arousal is high, there is a strong emotional activation. The second dimension, valence, determines whether this emotion is pleasant or attractive (positive) or unpleasant or avert (negative). When individuals are exposed to a stimulus, they can react positively (approaching) by activating the appetitive system or, on the contrary, with rejection by activating the aversive system (Lang and Bradley, 2013). For example, happiness is a positive emotion, while sadness is a negative one.
To measure arousal and valence in self-report, the Self-Assessment Manikin (SAM) scale was used (Bradley and Lang, 1994). Self-report arousal, defined as the intensity of the emotion, was a 5-point scale. Self-report valence, how positive and negative the emotion is, was registered on two 5-point scales: one for positive and one for negative. The final valence was computed by subtracting the positivity score from the negativity score.
Physiological arousal was measured in this study by registering the electrodermal activity. This technique measures the changes in the skin's electrical properties in response to the activity of the eccrine glands. If individuals are developing a complex task or being nervous, the sympathetic nervous system activates the body, increasing sweat secretion. The electrodermal activity registers the changes in the skin conductance provoked by sweating by applying a constant voltage. If the individuals are aroused, they are better electrical conductors, and the response is higher. Therefore, electrodermal activity is considered a measure of the sympathetic nervous system's activity to register the motivational response and increase emotional activation or arousal (Potter and Bolls, 2012). In this study, the electrodermal activity (EDA) was quantified by measuring the conductance of a constant voltage (0.5V) delivered to two 8-mm AG/AGCL electrodes placed on the participants' fingers of the non-dominant hand and connected to a Biopac bioamplifier MP-160. The signal was recorded with a sampling rate of 1,000 Hz and low pass filters.
Apart from self-report, valence can be measured by different means, such as electromyography or software for facial gesture recognition. The emotional valence is analyzed in this study using Facereader, a software for facial gesture recognition. This software measures facial movements to identify emotional expressions based on Ekman's face studies. The analysis indicates the emotional valence (positive or negative), and the kind of emotion, among other parameters.
Participants arrived at the laboratory, and they read and signed the consent form. Then, the electrodermal activity sensors were attached to the participant's fingers, and they were sitting in a comfortable armchair. Participants used headphones to listen to the videos. The order was random. After watching each video, participants had to rate the effectiveness and attractiveness levels. This procedure was repeated with all the videos. When participants finished, the sensors were removed, and they were dismissed. The experiment was conducted in two different sessions of 40 min (speech one and speech two). Students received two credits for their participation.
To test H1 and H3, a 3-pitch variation (few–medium–many) by 3 intensities of gestures (smooth–medium–strong) by 2 scripts (discourse one and discourse two) factorial MANOVA was performed on the effectiveness and attractiveness variables. There were no significant differences in scripts in any of them. The combination resulted in significant main effects for voice pitch in effectiveness, F (2, 118) = 1117, p < 0.001, partial η2 = 0.139. The medium style was the most effective, followed by many and few variations. The post hoc tests (Tukey) showed significant differences among all the conditions. Also, there were significant differences for attractiveness, F (2, 118) = 1682, p < 0.001, partial η2 = 0.195. The most attractive style was the strategy with medium variations, followed by many and few changes. The significant differences were among all the conditions, according to the post hoc tests.
Regarding gestures, the combined dependent variables resulted in significant main effects for effectiveness, F (2, 118) = 18.99, p < 0.001, partial η2 = 0.003. The medium intensity of gestures was the most effective style, followed by strong and smooth gestures. The post hoc tests showed significant differences among all the conditions. There also were significant differences for attractiveness, F (2, 118) = 4.63, p = 0.010, partial η2 = 0.001. The most attractive style was medium gestures, followed by strong and smooth. There were no significant differences between medium and strong intensities of gestures, according to the post hoc tests.
The interaction between voice pitch and gestures also was significant in effectiveness, F (4, 116) = 17.62, p < 0.001, partial η2 = 0.005. The medium variations with medium intensity of gestures were the most effective style, followed by medium pitch variations with strong and smooth gestures. The second group was formed by the strategies with medium pitch variations and the combination of medium, smooth, and strong gestures, in that order. Finally, the fewer effective styles were composed of the strategies with few pitch variations combined with strong, medium, and smooth intensities of gestures, in that order.
For attractiveness, the interaction also was significant, F (4, 116) = 27.43, p < 0.001, partial η2 = 0.008. The most attractive strategies, as in effectiveness, were the styles with medium pitch variations combined, in this order, with strong, medium, and smooth intensities of gestures. The next styles were with many pitch variations and, in this order, medium, strong, and smooth gestures. Finally, the less attractive were the strategies with few pitch variations and, in this order, strong, smooth, and medium intensities of gestures. Table 1 shows the descriptive statistics for these two variables. These results confirm H1 and H3.
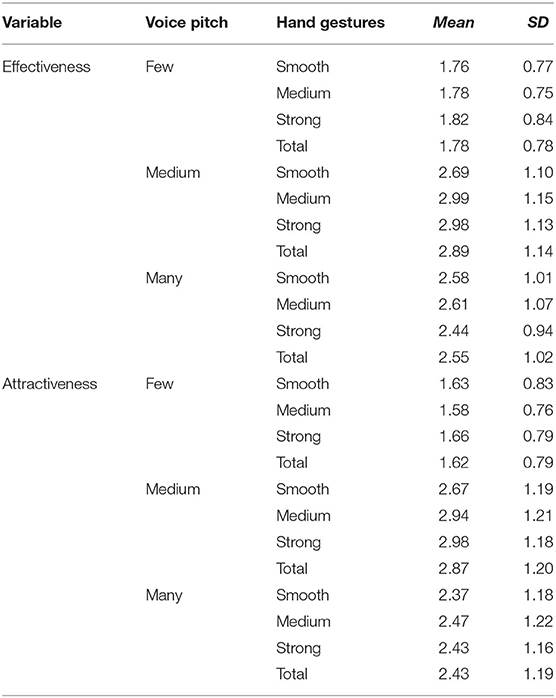
Table 1. Effectiveness and attractiveness of voice pitch and gestures.
To test H2 and H4, a 3-pitch variation (few–medium–many) by 3 intensities of gestures (smooth–medium–strong) by 2 scripts (discourse one and discourse two) factorial MANOVA was performed on self-reported arousal and valence. As in the other variables, there were no significant differences by script.
In self-report, voice pitch had a significant main effect on arousal, F (2, 118) = 1,507, p < 0.001, partial η2 = 0.178. The medium strategy elicited the highest arousal, followed by the many and the few pitch variations. The post hoc tests indicated significant differences among all the conditions. Concerning valence, there were significant differences for voice pitch, F (2, 118) = 2,273, p < 0.001, partial η2 = 0.246. The strategy with many pitch variations was perceived as the most positive, followed by the medium. The strategy with few changes was considered negative. The post hoc tests showed significant differences among all the conditions.
The intensity of gestures had a significant main effect on arousal, F (2, 118) = 4.20, p = 0.015, partial η2 = 0.001. The medium intensity of gestures achieved the highest arousal, followed by strong and smooth gestures. The post hoc tests showed no significant differences between the medium and strong gestures. In valence, there also were significant differences, F (2, 118) = 3.23, p = 0.019, partial η2 = 0.000. The medium intensity of gestures was perceived as less negative, followed by strong and smooth gestures. There were no significant differences between the medium and strong styles, as shown in the post hoc tests.
The interaction between voice pitch and gestures also was significant in arousal, F (2, 118) = 24.74, p < 0.001, partial η2 = 0.007, and valence, F (2, 118) = 18.81, p < 0.001, partial η2 = 0.005. The stronger arousal was stimulated by combining the strategies with medium pitch variations and strong gestures, followed by medium and smooth. The second group was composed of the styles with many pitch variations combined with medium, smooth, and strong gestures, in that order. The third group was a few pitch variations combined, in this order, with strong, smooth, and medium intensities of gestures. The most positive valence was elicited by many pitch variations combined with smooth intensity of gestures followed by many pitch variations-medium intensity of gestures, medium-strong, medium-medium, many-strong, medium-smooth. The most negative strategies were a few pitch variations combined with, in this order, smooth, strong, and medium intensities. Table 2 shows the results.
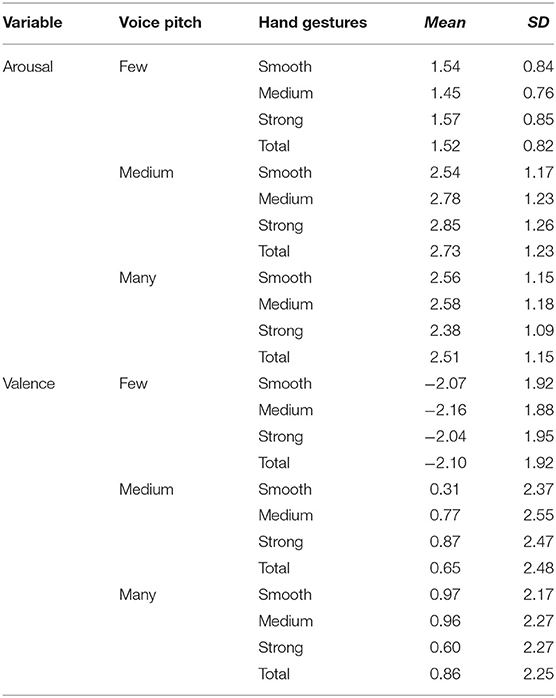
Table 2. Self-reported arousal and valence of voice pitch and hand gestures.
Physiological arousal was analyzed using a 3-pitch variation (few–medium–many) ANOVA. The results were significant, F (2, 118) = 15.43, p < 0.001, partial η2 = 0.012. The medium style achieved the highest arousal (M = 0.43; SD = 0.97), followed by many (M = 0.28; SD = 0.60), and few (M = 0.23; SD = 0.54). The strategy with medium pitch variations stimulated the strongest emotional activation followed by many and few changes. There were no significant results among many and few.
About gestures, the data were analyzed using a 3-intensity (smooth–medium–strong) ANOVA. There were no significant results, F (2, 118) = 2.29, p = 0.101, partial η2 = 0.002. The strategy with strong gestures achieved the greater arousal (M = 0.43; SD = 0.81), followed by medium (M = 0.34; SD = 0.91), and smooth gestures (M = 0.28; SD = 0.64).
However, the interaction between voice pitch and gestures in arousal was significant, F (4, 116) = 2.54, p = 0.038, partial η2 = 0.004. The combination with the strongest activation was medium pitch variations-strong gestures, followed by medium variations-medium gestures, medium variations-smooth gestures, many variations-medium gestures, many variations-smooth gestures, many variations-strong gestures, few variation-medium gestures, few variations-strong gestures, and few variations-smooth gestures. Figure 3 shows the results.
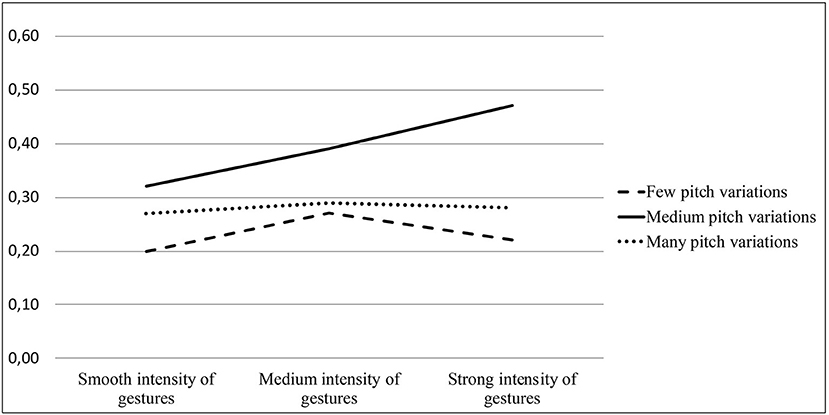
Figure 3. EDA interaction voice pitch-hand gestures.
Finally, in valence, there were significant results for voice pitch measured with the facial recognition of emotions (Facereader), F (2, 118) = 256.75, p < 0.001, partial η2 = 0.324. The most positive style was many pitch variations, followed by medium and few changes. There were no significant differences between medium and many variations, as shown in the post hoc tests. Along with this, there were significant differences in happiness, F (2, 118) = 220.52, p < 0.001, partial η2 = 0.292, and sadness, F (2, 118) = 113.87, p < 0.001, partial η2 = 0.175. The happiest strategy was with many pitch variations, followed by medium and few changes, whereas the saddest style was the opposite, in this order: few, medium, and many. Post hoc tests showed significant differences among the three styles in happiness and sadness.
The intensity of gestures also had a significant main effect on valence, F (2, 118) = 97.09, p < 0.001, partial η2 = 0.153. The most positive style was the medium intensity, followed by strong and smooth. There were significant differences among the three styles, as shown in the post hoc tests. Also, there were significant differences in the two main emotions, happiness F (2, 118) = 9.03, p < 0.001, partial η2 = 0.017, and sadness, F (2, 118) = 77.94, p < 0.001, partial η2 = 0.127. Participants showed more happiness with the medium intensity of gestures, followed by strong and smooth. They expressed more sadness with the style with smooth intensity of gestures followed by medium and strong. There were no significant differences between medium and strong gestures, as shown in the post hoc tests.
The interaction between voice pitch and gestures also was significant in valence, F (4, 116) = 55.91, p < 0.001, partial η2 = 0.173, happiness, F (4, 116) = 16.94, p < 0.001, partial η2 = 0.060, and sadness, F (4, 116) = 19.53, p < 0.001, partial η2 = 0.068. The most positive strategy was the medium followed by all the styles with many pitch variations combined with medium, strong, and smooth intensities of gestures, in that order. However, participants expressed more happiness with the strategies of many pitch variations with medium, strong, and smooth intensities of gestures, in this order. The less happy strategy combined a few pitch variations with smooth gestures. In contrast, the strategy that elicited more sadness was a few pitch variations with smooth gestures followed by medium-strong. The less sad strategy was medium pitch variations with strong gestures. These results confirm H2 and H4. Table 3 shows the descriptive statistics.
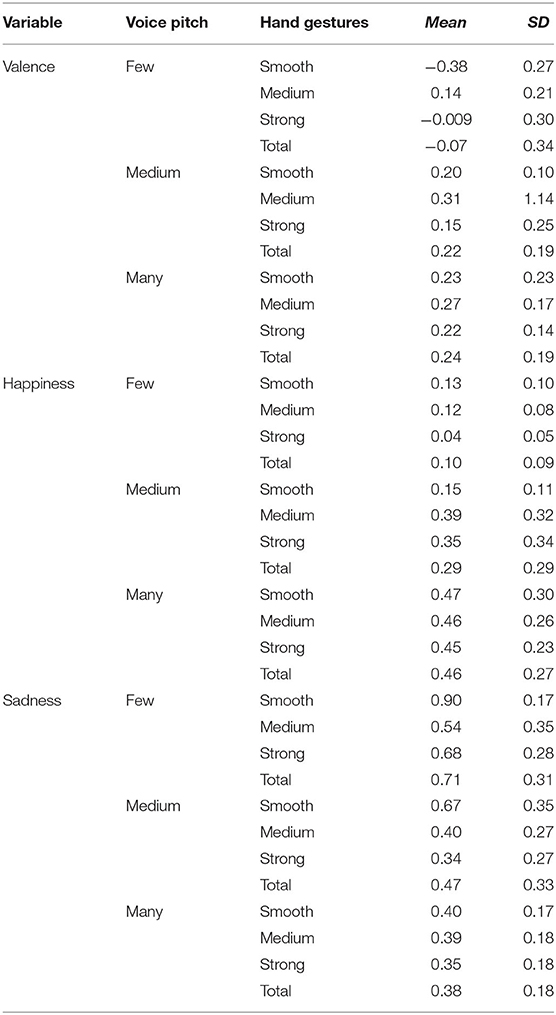
Table 3. Valence, happiness, and sadness of voice pitch and hand gestures.
This study aimed to analyze the effectiveness, attractiveness, and emotional response (arousal and valence) of different pitch variations and intensities of hand gestures in public discourses. To do so, this research combined different methods: self-report, physiological response, and facial recognition of emotions, with a within-subject design, as it is common in physiological studies due to their complexity. The findings showed that the non-verbal communication cues examined in this research were relevant in determining how effective and attractive a public speech is and affecting the participants' emotional response.
About effectiveness and attractiveness, the results indicated that the strategy with medium pitch variations was considered the most effective and attractive, followed by the styles with many and few changes. This result was expected, in line with previous studies that revealed better perception of pitch variations (Rodero et al., 2017), significantly when they are moderated (Rodero et al., 2022) and compared to monotonous strategies (Burgoon et al., 1990; Glass, 1991). A balanced strategy with pitch changes, nor few nor excessive, can be perceived as more dynamic (Addington, 1968) and, consequently, more effective and attractive, as the data have shown. The second-best style was many pitch variations, as a more expressive voice is always better perceived than dull strategies (Rodero et al., 2022). Therefore, the less effective and attractive style was few variations, as it sounded more monotonous, and this characteristic hindered perception (Knapp and Hall, 2007; Strangert and Gustafson, 2008).
As with voice pitch, in gestures, the data showed the same trend for perception. The most effective and attractive style was the medium intensity of gestures, followed by strong and smooth. A balanced strategy also was the best perceived by the participants. The medium intensity of gestures was enough to be rated as the most effective and attractive, in line with previous research in which speakers making hand gestures have been assessed with positive traits, such as effective, persuasive, credible, dominant, extrovert, sociable, and honest (Burgoon et al., 1990; Beattie and Shovelton, 2005; Maricchiolo et al., 2009; Neff et al., 2010; Jackob et al., 2011; Gnisci and Pace, 2014; Peters and Hoetjes, 2017; King et al., 2020).
The interaction between these two non-verbal features revealed a slightly different pattern. The most effective and attractive strategies were those with medium pitch variations combined with medium (effective) and strong gestures (attractive). Therefore, the best styles were medium pitch variations with medium or strong gestures. When both features act together, the expressivity level is the same as individually for effectiveness (medium-medium) but higher (medium-strong) for attractiveness. These results are according to the studies showing that there is a positive perception when speakers use pitch variations (Hincks, 2004; Strangert, 2005; Yang et al., 2020; Rodero et al., 2022) and a high quantity of gestures (Maricchiolo et al., 2009; Gnisci and Pace, 2014; Van Edwards, 2017), mainly to be evaluated as attractive, as the data show.
Concerning self-reported arousal, both in voice pitch and in gestures, the medium strategies (medium pitch variations and medium intensity of gestures) achieved the highest level. These data also represent an expected result, in line with previous studies. If a speaker talks with enough pitch changes and hand movements, these variations can increase arousal. A balanced strategy with medium pitch variations, guided by the Principle of Distinctive and Contrastive Coherence of Prosody (Rodero, 2015), elicited the strongest self-report arousal. The second-best strategy was the styles with many changes that, although achieved a high activation, were less intense than the medium ones. We can suggest that these variations and intensity of gestures were excessive, and therefore, counter-productive. Finally, the worst evaluated strategies were the less expressive styles: few pitch variations with smooth intensity of gestures, as it seems reasonable. The lack of change with a more regular voice and smooth physical hand movements reduced arousal, according to the “sensory adaptation” (Wark et al., 2007).
However, in physiological arousal, the results were different in gestures. The moderate pitch variations had to be complemented with strong gestures to achieve the most significant body activation. The acoustic changes were not enough and needed intense hand movements in gestures. This result is in line with the data on the interaction between the two non-verbal features. In this case, the strongest arousal and activation in self-report and physiological response was the combination of the strategies with medium pitch variations and strong gestures, followed by medium and smooth. Therefore, for physiological arousal in gestures and when both features act together, voice pitch is complemented with strong gestures to attain the highest arousal level. This result suggests that the expressivity attained by voice pitch was not enough to aroused participants, and it had to be completed with a strong intensity of gestures to achieve an adequate expressivity level. Participants perceived this combination as the most attractive and were more aroused and activated when exposed to it.
Finally, there were no differences between voice pitch and gestures regarding self-reported valence and facial recognition of emotions (Facereader). Here, the results are different than in other variables. The strategy with many pitch variations was perceived as the most positive in voice pitch, followed by medium and few changes. The style with few changes was considered the most negative. In gestures, the most positive was medium, followed by strong and smooth gestures, both in self-report and in facial recognition. Therefore, many pitch changes were needed to be perceived as positive, while in gestures, the medium intensity was enough.
However, as in the other variables, the results slightly differed in the interaction between the two non-verbal features. In this case, the most positive strategy was the medium styles in both variables, followed by the strategies with many pitch variations combined with medium, strong, and smooth gestures. So, although in arousal, a higher intensity of gestures was necessary, the results revealed that the balanced or moderated strategy was the most positive, once again as the high change styles could have been considered excessive. On the contrary, the most negative styles were the less expressive: few pitch variations and smooth intensity of gestures. As the data showed, this monotony and lack of movement could have affected participants' attention and, thus, arousal and valence.
Finally, the happiest strategy was for many pitch variations, followed by medium and few changes, whereas the saddest style was the opposite. In gestures, the results were the same (strong–medium–smooth) in both variables. As it seems logical, participants expressed the highest happiness level (shown in their facial expressions) with the strategies with many pitch variations and strong intensity of gestures. In contrast, sadness was shown especially with the fewer expressivity strategies (few pitch variations and smooth gestures).
In conclusion, the results indicated that participants perceived as more effective, attractive, and positive and felt happier and more aroused with medium-level strategies (medium pitch variations and medium intensity of gestures) when both features were analyzed separately. This balanced strategy contained enough pitch variations and hand movements to be positively perceived and elicit a beneficial emotional response in arousal and valence. However, when the analyzed features acted together, the medium pitch variation strategy had to be complemented with strong intensity of gestures to be perceived as the most attractive and achieve the highest arousal. This result can indicate that the strategy with medium pitch variations in this study could not have been sufficiently expressive to raise high attractiveness and arousal levels. In any case, the results are consistent individually, and in the rest of the variables, so it can be concluded that the best combination between voice pitch and gestures is an expressive style medium-medium or medium-strong, but not many-strong, as it can be excessive, or few-smooth, as it is monotonous.
This study has three main limitations that must be considered to interpret the results. The first limitation was to record all the presentations controlling voice pitch and gestures variations while the rest of the variables maintained stable. When someone speaks, many variables are acting at the same time. Despite this difficulty, the training hours with the actors and the posterior analysis confirm that the results were accurate. Along with this, the second limitation was the limited number of analyzed strategies. Further research should extend the results to different voice and gestures combinations and other features. Finally, the third limitation was the number of actors (four) and the short speeches. We hypothesize that, in this study, the style of these concrete actors could have influenced the results. However, the video recording and the analysis showed that all of them were neutral in their performances and achieved the described styles according to the previously given guidelines. Anyhow, it would be convenient to extend the number of speakers by including more ethnicities and appearances. Also, future research should analyze long discourses. In this study, the duration of the speeches was deliberately short due to the extensive number of data generated, particularly by the physiological analysis. Finally, participants watched a high number of videos with the same content. As the order and the speakers were varied, and each session was completed in 40 min, signs of tiredness were not perceived, but a slight fatigue effect could have influenced the results.
All in all, the contributions of this study were both scientific and professional. The results of this study allow us to advance in the analysis of non-verbal cues, such as voice pitch and gestures and their influence on emotional response. Along with this, the findings can be applied to train speakers in public discourses. The main recommendation is to use an expressive performance with pitch variations and medium or strong intensity of hand gestures.
The original contributions presented in the study are included in the article/supplementary materials, further inquiries can be directed to the corresponding author/s.
The studies involving human participants were reviewed and approved by Barcelona School of Management. The patients/participants provided their written informed consent to participate in this study. Written informed consent was obtained from the individual(s) for the publication of any potentially identifiable images or data included in this article.
ER states that her contribution as an author of the present manuscript follows the authorship definition of the International Committee of Medical Journal Editors. She has directed the research and done all the contributions to the conception or design of the work. She was in charge of the project coordination, acquisition, analysis, and interpretation of data for the work. Furthermore, she has revised the work critically for important intellectual content and has prepared the final version to be published. Finally, she agrees to be accountable for all aspects of the work in ensuring that questions related to the accuracy or integrity of any part of the work are appropriately investigated and resolved.
This research was funded by the Barcelona School of Management.
The author declares that the research was conducted in the absence of any commercial or financial relationships that could be construed as a potential conflict of interest.
All claims expressed in this article are solely those of the authors and do not necessarily represent those of their affiliated organizations, or those of the publisher, the editors and the reviewers. Any product that may be evaluated in this article, or claim that may be made by its manufacturer, is not guaranteed or endorsed by the publisher.
Addington, D. W. (1968). The relationship of selected vocal characteristics to personality perception. Speech Monogr. 35, 492–503. doi: 10.1080/03637756809375599
Bar, M., Neta, M., and Linz, H. (2006). Very first impressions. Emotion 6, 269–278. doi: 10.1037/1528-3542.6.2.269
Beattie, G., and Shovelton, H. (2005). Why the spontaneous images created by the hands during talk can help make TV advertisements more effective. Br. J. Psychol. 96, 21–37. doi: 10.1348/000712605X103500
Belin, P., Fecteau, S., and Bédard, C. (2004). Thinking the voice: neural correlates of voice perception. Trend Cogn. Sci. 8, 129–135. doi: 10.1016/j.tics.2004.01.008
Berger, K. W., and Popelka, G. R. (1971). Extra-facial gestures in relation to speechreading. J. Commun. Disord. 3, 302–308. doi: 10.1016/0021-9924(71)90036-0
Birdwhistell, R. (1970). Kinesics and Context. Philadelphie, PA: University of Pennsylvania Press. doi: 10.9783/9780812201284
Boersma, P., and Weenink, D. (2022). Praat: doing phonetics by computer. 10. Available online at: https://www.fon.hum.uva.nl/praat/
Bradley, M. M., and Lang, P. J. (1994). Measuring emotion: the self-assessment manikin and the semantic differential. J. Behav. Ther. Exper. Psychiat. 25, 49–59. doi: 10.1016/0005-7916(94)90063-9
Burgoon, J. K., Birk, T., and Pfau, M. (1990). Nonverbal behaviors, persuasion, and credibility. Hum. Commun. Res. 17, 140–169. doi: 10.1111/j.1468-2958.1990.tb00229.x
Chebat, J. C., El Hedhli, K., Gélinas-Chebat, C., and Boivin, R. (2007). Voice and persuasion in a banking telemarketing context. Percep. Motor Skill. 104, 419–437. doi: 10.2466/pms.104.2.419-437
Cherry, E. C. (1953). Some experiments on the recognition of speech, with one and two ears. J. Acoust. Soc. Am. 25, 975–979. doi: 10.1121/1.1907229
Clark, T., and Greatbatch, D. (2011). Audience perceptions of charismatic and non-charismatic oratory: The case of management gurus. Leadersh. Q. 22:22–32. doi: 10.1016/j.leaqua.2010.12.004
Clough, S., and Duff, M. C. (2020). The role of gesture in communication and cognition: implications for understanding and treating neurogenic communication disorders. Front. Hum. Neurosci. 14, 323. doi: 10.3389/fnhum.2020.00323
Dargue, N., Sweller, N., and Jones, M. P. (2019). When our hands help us understand: a meta-analysis into the effects of gesture on comprehension. Psychol. Bull. 145, 765–784. doi: 10.1037/bul0000202
Dawson, M. E., Schell, A. M., and Filion, D. L. (2000). “The electrodermal system”, in Cacioppo J., Tassinary L. G., Berntson G. G., eds. Handbook of Psychophysiology. New York, NY: Cambridge University Press. p. 200–223.
Ekman, P., and Friesen, W. V. (1969). The repertoire of nonverbal behavior. Semiotica 1, 49–98. doi: 10.1515/semi.1969.1.1.49
Ekman, P., Friesen, W. V., O'Sullivan, M., and Scherer, K. (1980). Relative importance of face, body, and speech in judgments of personality and affect. J. Person. Soc. Psychol. 38, 270–277. doi: 10.1037/0022-3514.38.2.270
Elbert, S. P., and Dijkstra, A. (2014). An experimental test of the relationship between voice intonation and persuasion in the domain of health. Psychol. Health. 29, 1014–1031. doi: 10.1080/08870446.2014.903482
Gélinas-Chebat, C., Chebat, J. C., and Vaninsky, A. (1996). Voice and advertising: Effects of intonation and intensity of voice on source credibility attitudes toward the advertised service and the intent to buy. Percept. Motor Skill. 85, 243–262. doi: 10.2466/pms.1996.83.1.243
Gnisci, A., and Pace, A. (2014). “The Effects of Hand Gestures on Psychosocial Perception: A Preliminary Study”, in Recent Advances of Neural Network Models and Applications. S. Bassis, A. Esposito, and F. C. Morabito (Eds.), Smart Innovation, Systems and Technologies (Vol. 26, pp. 305–314). Springer. doi: 10.1007/978-3-319-04129-2_30
Gordon, R. A., Druckman, D., Rozelle, R. M., and Baxter, J. C. (2006). Non-Verbal Behaviour as Communication: Approaches, Issues and Research. The Handbook of Communication Skills. Routledge.
Graham, J. A., and Argyle, M. (1975). A cross-cultural study of the communication of extra-verbal meaning by gestures (1). Int. J. Psychol. 10, 57–67. doi: 10.1080/00207597508247319
Guyer, J. J., Briñol, P., Petty, R. E., and Horcajo, J. (2019). Nonverbal behavior of persuasive sources: a multiple process analysis. J. Nonverbal Behav. 43, 203–231. doi: 10.1007/s10919-018-00291-x
Harris, T. (2003). Listening with your eyes: the importance of speech-related gestures in the language classroom. Fore. Langu. Ann. 36, 180–187. doi: 10.1111/j.1944-9720.2003.tb01468.x
Hill, K. T., and Miller, L. M. (2010). Auditory attentional control and selection during cocktail party listening. Cerebr. Cortex 20, 583–590. doi: 10.1093/cercor/bhp124
Hincks, R. (2004). “Processing the prosody of oral presentations”, in ICALL-2004, Symposium on Computer Assisted Learning.
Hirschberg, J., and Pierrehumbert, J. (1986). “Intonational structuring of discourse”, in Proceedings of 24th Meeting of the Association for Computational Linguistics. Nueva York p. 136–144. doi: 10.3115/981131.981152
Holle, H., and Gunter, T. C. (2007). The role of iconic gestures in speech disambiguation: ERP evidence. J. Cogn. Neurosci. 19, 1175–1192. doi: 10.1162/jocn.2007.19.7.1175
Hostetter, A. B. (2011). When do gestures communicate? A meta-analysis. Psychol. Bull. 137, 297–315. doi: 10.1037/a0022128
Ianì, F., and Bucciarelli, M. (2017). Mechanisms underlying the beneficial effect of a speaker's gestures on the listener. J. Memory Lang. 96, 110–121. doi: 10.1016/j.jml.2017.05.004
Iverson, J. M., and Goldin-Meadow, S. (1998). Why people gesture when they speak. Nature 396, 228. doi: 10.1038/24300
Jackob, N., Roessing, T., and Petersen, T. (2011). The effects of verbal and nonverbal elements in persuasive communication: Findings from two multi-method experiments. Communications. 36, 245–271. doi: 10.1515/comm.2011.012
Jannedy, S., and Mendoza-Denton, N. (2005). “Structuring information through gesture and intonation”, in: Interdisciplinary studies on information structure: ISIS; working papers of the SFB 632, 199–244.
Kelly, S., Healey, M., Özyürek, A., and Holler, J. (2015). The processing of speech, gesture, and action during language comprehension. Psychon. Bull. Rev. 22, 517–523. doi: 10.3758/s13423-014-0681-7
Kelly, S. D., Özyürek, A., and Maris, E. (2010). Two sides of the same coin: Speech and gesture mutually interact to enhance comprehension. Psychol. Sci. 21, 260–267. doi: 10.1177/0956797609357327
King, J. P. J., Loy, J. E., Rohde, H., and Corley, M. (2020). Interpreting nonverbal cues to deception in real-time. PLoS ONE 15, 1–25. doi: 10.1371/journal.pone.0229486
Knapp, M. L., and Hall, J. A. (2007). Nonverbal Communication in Human Interaction. Thomas Learning.
Krauss, R. M., Morrel-Samuels, P., and Colasante, C. (1991). Do conversational hand gestures communicate? J. Person. Soc. Psychol. 61, 743. doi: 10.1037/0022-3514.61.5.743
Lang, P. J., and Bradley, M. M. (2013). Appetitive and defensive motivation: goal-directed or goal-determined? Emot. Rev. 5, 230–234. doi: 10.1177/1754073913477511
Levi, S. V., and Pisoni, D. B. (2007). “Indexical and linguistic channels in speech perception: Some effects of voiceovers on advertising outcomes”, in T.M. Lowrey (Ed.), Psycholinguistic Phenomena in Marketing Communications. Lawrence Erlbaum Associates.
Maricchiolo, F., Gnisci, A., Bonaiuto, M., and Ficca, G. (2009). Effects of different types of hand gestures in persuasive speech on receivers' evaluations. Langu. Cogn. Process. 24, 239–266. doi: 10.1080/01690960802159929
Neff, M., Wang, Y., Abbott, R., and Walker, M. (2010). “Evaluating the effect of gesture and language on personality perception in conversational agents”, in: International Conference on Intelligent Virtual Agents. (pp. 222-235). Springer, Berlin, Heidelberg. doi: 10.1007/978-3-642-15892-6_24
Newman, R., Furnham, A., Weis, L., Gee, M., Cardos, R., Lay, A., et al. (2016). Nonverbal presence: how changing your behaviour can increase your ratings for persuasion, leadership and confidence. Psychology 07, 488–499. doi: 10.4236/psych.2016.74050
Niebuhr, O., and Silber-Varod, V. (2021). How versatility performance influences perception of charismatic speech: a study on two Israeli politicians. Interact. Stud. 22, 303–342. doi: 10.1075/is.00007.nie
Peters, J., and Hoetjes, M. W. (2017). “The effect of gesture on persuasive speech”, in Interspeech 2017, p. 659–663. doi: 10.21437/Interspeech.2017-194
Potter, R. F., and Bolls, P. D. (2012). Psychophysiological Measurement and Meaning: Cognitive and Emotional Processing of Media. Routledge. doi: 10.4324/9780203181027
Riseborough, M. G. (1981). Physiographic gestures as decoding facilitators: Three experiments exploring a neglected facet of communication. J. Nonverbal Behav. 5, 172–183. doi: 10.1007/BF00986134
Rodero, E. (2015). The principle of distinctive and contrastive coherence of prosody in radio news: an analysis of perception and recognition. J. Nonverbal Behav. 39, 79–92. doi: 10.1007/s10919-014-0201-5
Rodero, E. (2021). “Measuring People's Cognitive and Emotional Response”, Psychophysiological methods to study sound design, in Filimowicz, M. (ed.), Doing Research in Sound Design. New York, NY: Routledge. doi: 10.4324/9780429356360-5
Rodero, E., Larrea, O., Rodríguez-de-Dios, I., and Lucas, I. (2022). The expressive balance effect. perception and physiological responses of prosody and gestures. J. Langu. Soc. Psychol. doi: 10.1177/0261927X221078317. [Epub ahead of print].
Rodero, E., Larrea, O., and Vázquez, M. (2013). Male and female voices in commercials. Analysis of effectiveness, adequacy for product, attention and recall. Sex Roles 68, 349–362. doi: 10.1007/s11199-012-0247-y
Rodero, E., Potter, R. F., and Prieto, P. (2017). Pitch range variations improve cognitive processing of audio messages. Hum. Commun. Res. 43, 397–413. doi: 10.1111/hcre.12109
Rodero, E., Mas, L., and Blanco, M. (2019). The influence of prosody on politician's credibility. J. Appl. Linguist. Profess. Pract. 11, 89–111. doi: 10.1558/japl.32411
Rosenberg, A., and Hirschberg, J. (2009). Charisma perception from text and speech. Speech Commun. 51, 640–655. doi: 10.1016/j.specom.2008.11.001
Scott, W. (1920). Lessons in Elocution, or, a Selection of Pieces, in Prose and Verse, for the Improvement of Youth in Reading and Speaking. Montpelier: E. P. Walton.
Strangert, E. (2005). “Prosody in public speech: analyses of a news announcement and a Political interview”, in INTERSPEECH-2005, Eurospeech, 9th European Conference on Speech Communication and Technology. doi: 10.21437/Interspeech.2005-827
Strangert, E., and Gustafson, J. (2008). “What makes a good speaker? subject ratings, acoustic measurements and perceptual evaluations”, in: Ninth Annual Conference of the International Speech Communication Association. p. 1688–1691. doi: 10.21437/Interspeech.2008-368
Talley, L., and Temple, S. (2015). How leaders influence followers through the use of nonverbal communication. Leaders. Organiz. Develop. J. 36, 69–80. doi: 10.1108/LODJ-07-2013-0107
Van Edwards, V. (2017). You are contagious. Available online at: https://www.youtube.com/watch?v=cef35Fk7YD8
Varghese, A. L., and Nilsen, E. S. (2020). Is that how you should talk to her? Using appropriate prosody affects adults', but not children's, judgments of communicators' competence. J. Lang. Soc. Psychol. 39, 738–750. doi: 10.1177/0261927X19871692
Wagner, P., Malisz, Z., and Kopp, S. (2014). Gesture and speech in interaction: an overview. Speech Commun. 57, 209–232. doi: 10.1016/j.specom.2013.09.008
Wark, B., Lundstrom, B. N., and Fairhall, A. (2007). Sensory adaptation. Curr. Opin. Neurobiol. 17 , 423–429. doi: 10.1016/j.conb.2007.07.001
Weinstein, N., Vansteenkiste, M., and Paulmann, S. (2020). Don't you say it that way! Experimental evidence that controlling voices elicit defiance. J. Exper. Soc. Psychol. 88, 103949. doi: 10.1016/j.jesp.2019.103949
Keywords: voice pitch, hand gestures, effectiveness, attractiveness, emotional response, arousal, valence
Citation: Rodero E (2022) Effectiveness, Attractiveness, and Emotional Response to Voice Pitch and Hand Gestures in Public Speaking. Front. Commun. 7:869084. doi: 10.3389/fcomm.2022.869084
Received: 03 February 2022; Accepted: 12 April 2022;
Published: 09 June 2022.
Edited by:
Oliver Niebuhr, University of Southern Denmark, DenmarkReviewed by:
Melisa Stevanovic, Tampere University, FinlandCopyright © 2022 Rodero. This is an open-access article distributed under the terms of the Creative Commons Attribution License (CC BY). The use, distribution or reproduction in other forums is permitted, provided the original author(s) and the copyright owner(s) are credited and that the original publication in this journal is cited, in accordance with accepted academic practice. No use, distribution or reproduction is permitted which does not comply with these terms.
*Correspondence: Emma Rodero, ZW1tYS5yb2Rlcm9AdXBmLmVkdQ==
Disclaimer: All claims expressed in this article are solely those of the authors and do not necessarily represent those of their affiliated organizations, or those of the publisher, the editors and the reviewers. Any product that may be evaluated in this article or claim that may be made by its manufacturer is not guaranteed or endorsed by the publisher.
Research integrity at Frontiers
Learn more about the work of our research integrity team to safeguard the quality of each article we publish.