 Katherine Glover1
 Jennifer A. Rudd1
 Daniel R. Jones1
 Elaine Forde2Michael E. A. Warwick1William J. F. Gannon1
 Charles W. Dunnill1*
- 1Energy Safety Research Institute, Faculty of Science and Engineering, Bay Campus, Swansea University, Fabian Way, Swansea, United Kingdom
- 2Morgan Academy, School of Management, Bay Campus, Swansea University, Fabian Way, Swansea, United Kingdom
As the international community aims to reduce its reliance on fossil fuels, green hydrogen has great potential to replace methane as a clean source of fuel. A novel public engagement activity, The Hydrogen Bike, has been developed to demonstrate the production and use of green hydrogen from water. The aim of the activity is to educate, entertain and inform young people and adults so that they have an opportunity to form an opinion about the use of hydrogen as a fuel. Using a novel two-part data collection system participants are briefly surveyed for their opinion on hydrogen before and after participating in The Hydrogen Bike activity. Through this we have found that most participants (73%) are considered to have no opinion or a neutral opinion on hydrogen before participating in The Hydrogen Bike activity. After participation 88% of those who were originally neutral or had no opinion on hydrogen self-reported a positive feeling about hydrogen. The method of data collection was quick, intuitive and suitable for an audience attracted from passing footfall.
Introduction
The human race relies on energy to stay warm, grow food, travel, clothe themselves and complete the myriad of survival tasks required on a daily basis. Historically our energy predominantly came from fossil fuels; Oil in particular fuels society as its components contribute to heating, transport, fertilisers and pharmaceuticals to name a few (IAOGP, 2017). However, the use of fossil fuels leads to serious planetary consequences as the combustion of fossil fuels produces carbon dioxide, a well-documented contributor to global heating (Sawyer, 1972).
Following the Paris Agreement of 2016, countries around the world pledged to ensure that the average global temperature does not exceed 1.5°C1 above pre-industrial levels by the end of the century (Hulme, 2016; IPCC, 2018). Therefore, the human race needs to rely instead on energy generated from zero-carbon sources. However, the dominant sources of renewable energy production – solar and wind – are affected by seasonality i.e. more solar power is generated in the summer months when there is less demand for energy, more wind power generated at night, again when energy demand is low. Batteries are typically used for storing excess energy but this energy can also be stored in the form of “green hydrogen”. The main advantages of hydrogen generation over batteries are as follows:
1) Hydrogen can be stored over a long period of time
2) Hydrogen can be transported
3) Batteries have a limited number of charge-discharge cycles whereas hydrogen production is non-limited.
In February 2020 the United Kingdom Government announced a £90 million pound package to tackle carbon dioxide emissions, including the development of blue and green hydrogen generation (Karteng, 2020). “Blue hydrogen” is created by stripping hydrogen from methane and capturing the resulting carbon dioxide using carbon capture technology (Evangelopoulou et al., 2019). “Green hydrogen” is hydrogen generated through the splitting of water into hydrogen and oxygen using renewable energy sources (Widera, 2020). In total, £70 million was committed to three projects, two of which were for “blue hydrogen” and one for “green hydrogen” (Karteng, 2020). A number of other hydrogen generation projects are in development in the United Kingdom, including the Hydrogen Research and Demonstration Centre at Baglan Energy Park in South Wales where a hydrogen filling station is available for hydrogen-powered cars to fill up with green hydrogen (h2wales.org.uk). Therefore, the technological capability and political ambition for a low-carbon hydrogen economy appear to be present in the United Kingdom. However, for a technology to succeed it still needs to be accepted by the end-user. For a hydrogen-economy the end-user will typically be an individual over 17 years of age driving a hydrogen-powered vehicle or an individual (young person or adult) using pure or blended hydrogen in their homes for cooking and/or heating. Therefore, it is important that young people and adults across the United Kingdom are aware of and feel safe around hydrogen as a fuel (Schulte et al., 2004).
Recent research by (Scott and Powells, 2020) with communities in the North East and North West of England has shown that individuals have safety concerns around the use of hydrogen, “some participants did have an overarching perception of hydrogen as dangerous, flammable, and explosive – in many cases to a greater extent than natural gas” (p. 101,346). Participants were also concerned about what the hydrogen flame would look like. However, education and, in particular, first hand experience of hydrogen can make individuals feel more confident and therefore more positive about the use of hydrogen (POST, 2002; Haraldsson et al., 2006). A significant number of studies have been carried out assessing the opinions of adults in the United Kingdom about hydrogen (Cherryman et al., 2008; Thesen and Langhelle, 2008; Bellaby et al., 2016; Scott and Powells, 2020). However, to the best of our knowledge, very few intervention studies have been carried out to show a change in opinion. The most relevant intervention study, as it is centered in South Wales, was carried out by Bellaby and Clark (2014). Briefly, Bellaby and Clark (2014) carried out focus groups with people in three categories “14 year old Baccalaureate students; 18–19 year old students at Tertiary College; and adult-members of a Citizens’ Panel” (p. 15,125) who had attended an organized visit to the Baglan Hydrogen Research and Demonstration Centre. The analysis of the focus groups showed that the school-age participants thought of hydrogen in the context of hydrogen-powered cars, while the Citizens’ Panel participants took a wider view. Many participants were reassured about the safety of hydrogen following their visit to the Centre and overall the authors stated that “showing the unfamiliar technology in action does enhance public understanding” (p. 15,130). Discussions within the focus group also allowed students in particular to think more widely than just hydrogen as a fuel with discussion of the energy system as a whole prompted as they thought about the intermittency of renewable energy and how hydrogen could be produced and stored to compensate. This study is encouraging but has the disadvantage of having a fixed location. Interested parties must go to the Centre, rather than the technological demonstration being portable.
As a research group with expertize in the production of green hydrogen (Phillips and Dunnill, 2016; Phillips et al., 2017; Jones et al., 2018) we have developed an accessible, interactive and engaging outreach activity, called The Hydrogen Bike. The Hydrogen Bike has an advantage over the Baglan Centre in that it is portable, as will be demonstrated in the methods section. The aims of The Hydrogen Bike activity are to
1) inform the general public about hydrogen
2) allow the participants to form an opinion about hydrogen
3) measure a change in opinion as a result of engaging with the activity
Measuring the change in opinion requires the initial opinions of respondents to be captured as a baseline for the investigation, as well an opinion at the end of the activity. A variety of different methods may be used to gather data from outreach activities, including recalling interactions (Mokros and Atkinson, 2018), Likert-scale surveys (Caref et al., 2018), or written assessments to gauge what knowledge was gained (Jones et al., 2019). Not all outreach activities that capture data are clear about measuring a change an outreach activity induces; for example, they may not establish a baseline.
We describe here how to set up and operate The Hydrogen Bike, including the variety of locations and audiences for which it is suited. Furthermore, we discuss our methodology, using a two-part data collection, to assess how participating in The Hydrogen Bike activity may have enabled the participant to form an opinion about hydrogen.
Materials and Methods
Exhibit Overview
The Hydrogen Bike was designed with science fairs, aimed at secondary school children, in mind, but can be adapted to be suitable for primary school children, all the way up to adults with science backgrounds. Its primary focus is to engage participants in extra-curricular science, alongside the secondary objective; to collect data about the effect of the outreach activity on their feelings toward hydrogen. Interactions with the bike typically last between 5–8 min, so data collection must be quick, and not detract from the main outreach activity.
Figure 1 is a diagram of the setup used during The Hydrogen Bike demonstration. The setup consists of a bicycle equipped with a dynamo, an alkaline electrolyser, gas collection tubes, feedback collection tubes, and posters visually explaining the demonstration and two to five trained hydrogen bike facilitators.
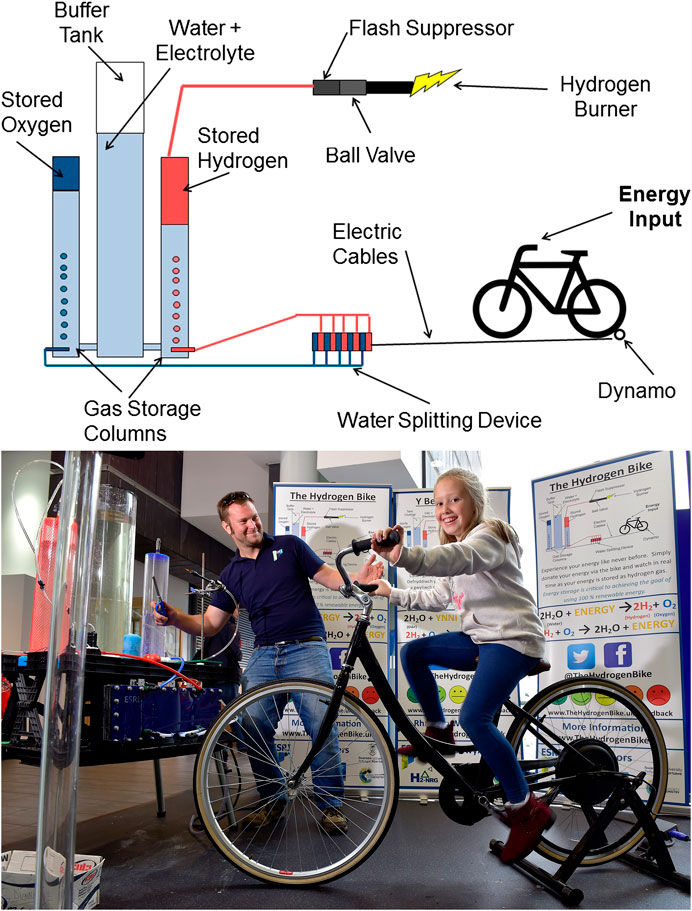
FIGURE 1. (A). Schematic of The Hydrogen Bike exhibit, depicting the alkaline electrolysis cell powered by a dynamo built into the rear wheel of the stationary bicycle. Also shown are the hydrogen and oxygen gas collection containers and the central “buffer tank” into which aqueous sodium bicarbonate electrolyte is forced during gas collection. During the demonstration, stored hydrogen is continuously used by a hydrogen fuel cell to power LEDs beneath each of the gas storage columns, and the gas is also admitted to a burner to demonstrate a stable hydrogen flame. (B). Photo of a participant on The Hydrogen Bike.
As Wales is a bilingual country The Hydrogen Bike poster is available in both Welsh and English. The poster was translated by the Swansea University Welsh translation service, which is a professional translating service. In addition, at the National Eisteddfod, a Welsh arts and culture festival where Welsh Language is given primacy over English, exclusively bilingual (English-Welsh language) speaking facilitators were present to run The Hydrogen Bike exhibit and the question on the feedback collection tubes, depicted in Figure 2, was bilingual.
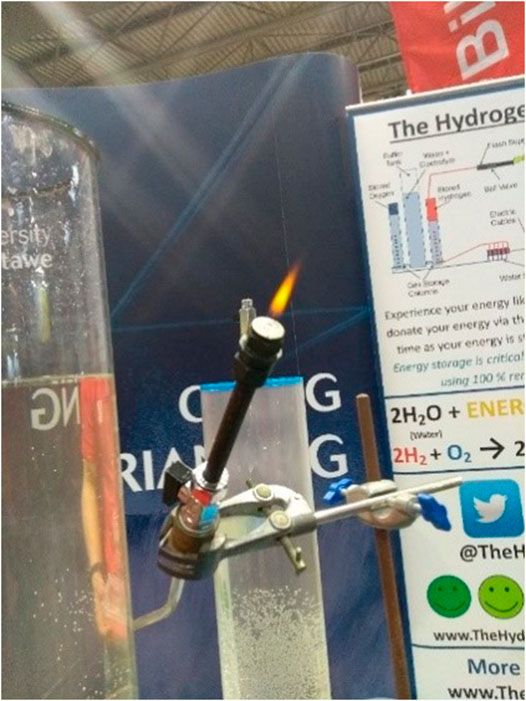
FIGURE 2. Tokens are placed in one of five tubes, labeled with different emoticons representing a participant’s final opinion in answer to the question: “How do you feel about a hydrogen powered future?”
During a typical exhibition, waiting participants are approached by a facilitator and their individual opinions on hydrogen are canvassed. Based on their opinion, each individual is given their own colored token and invited in turn by a facilitator to pedal a stationary bicycle with an electric dynamo in the back wheel. Each individual in turn is given approximately 1 min to pedal the bike. While participants interact with the bike, the facilitator will engage them in a discussion about the intermittency of renewable energy and the role of hydrogen as a grid stabiliser.
After all of the participants from the group have cycled on the bike, the facilitator asks the group how they feel about a hydrogen powered future. The individuals are then invited to place their colored token into the feedback collection tube with the emoticon best representing how they feel. The demonstration then begins again with a new group of waiting participants. Multiple facilitators present at the demonstration enable a seamless transition between groups.
Equipment Description
The dynamo powers an alkaline electrolyser described in detail in our previous research papers (Passas and Dunnill, 2015; Phillips and Dunnill, 2016; Phillips et al., 2017). Briefly, water in the sodium bicarbonate electrolyte is split into hydrogen and oxygen gas, (Eqn 1). Collecting the gases in custom-made gas collection tubes, allows the audience to compare the stoichiometry of hydrogen and oxygen generated from the water-splitting process. In general, the oxygen is vented to the atmosphere while the hydrogen is used for the rest of the display.
Hydrogen is supplied to a 3 V hydrogen fuel cell, powering a set of LEDs illuminating the base of each collection chamber. The application of fuel cells for powering cars, and conceivably homes and businesses, is discussed with the audience, aided by a Hyundai Ix35 hydrogen fuel cell vehicle depicted in Figure 3, which is used by The Hydrogen Bike’s team to transport the equipment to and from events.
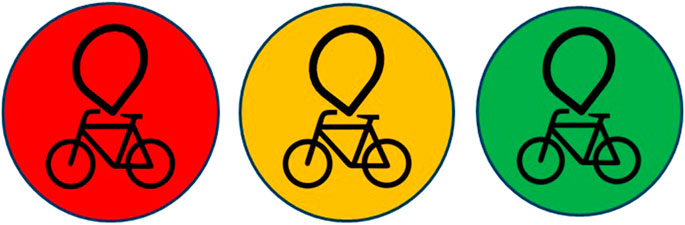
FIGURE 3. The ESRI Hyundai Ix35, a hydrogen fuel cell-powered car that transports The Hydrogen Bike team and equipment to events.
As the climax of the demonstration, stored hydrogen is ignited at the output of the micro burner to form a stable flame, as shown in Figure 4. This demonstrates to the audience that it is possible to combust the gas in a safe and stable manner, analogous to the domestic natural gas with which they are likely more familiar. While hydrogen flames are typically colorless (Crowl and Jo, 2007), the flame displayed during the exhibit is orange in color due to the presence of sodium impurities (Driscoll, 1997) from the aqueous sodium bicarbonate electrolyte; this observation is explained to the audience and the associated implications regarding user safety are discussed, recognizing that the phenomenon fortuitously enhances flame visibility and thereby decreases the risk to the burner operator.
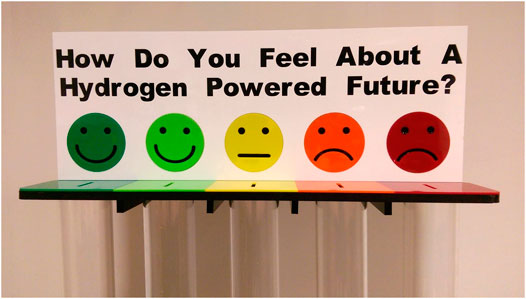
FIGURE 4. Image of the stable hydrogen flame presented as the climax of the demonstration.
Training of the Facilitators
Facilitators are trained by the principal investigator, creator of The Hydrogen Bike. Training includes the set-up and technical operation of the hydrogen bike. Training also covers the impact assessment questions and token distribution. Facilitators are told to ask the question “How do you feel about hydrogen?” at the start of the interaction, thus ensuring uniformity independent of facilitator, participant or event. A token is given to each participant, of which the color is chosen by the facilitator according to the following schedule. A red token signifies that the recipient has expressed a negative opinion, such as ‘scary’, ‘explosions’ or ‘Hindenburg’. A yellow token is handed to those who say things analogous to ‘don’t know’, ‘no idea’, ‘not really sure’. Despite being asked for their feeling, participants often offer up facts about hydrogen such as ‘it’s part of water’, and these would be given a yellow token also. A green token is for those with a positive feeling, using words such as ‘great’ or ‘hydrogen is the future’. Welsh-speaking facilitators are trained in English but are fully bilingual and we are therefore not concerned that the message is changed by translation.
Assessing Impact
To assess the impact of The Hydrogen Bike on the opinion of hydrogen, a token-based emoticon feedback system was employed. Each participant is asked upon arrival to the stand about their perception of hydrogen using an unbiased “initial-question” to ascertain a baseline:
“How do you feel about hydrogen?”
Facilitators on the stand have a training session, so there is uniformity in the question. Subsequently each participant is given a circular plastic token, as illustrated in Figure 5, the color of which is dependent on their response. The color of the token should be chosen by the facilitator within the first few seconds of the interaction, based on the ‘gut-reaction’ of the participants and the information given in the facilitator’s training session described the previous section. A three point scale was chosen so that the token allocation is quick, so as not to distract from the wider demonstration. The participant holds onto their token throughout the demonstration.
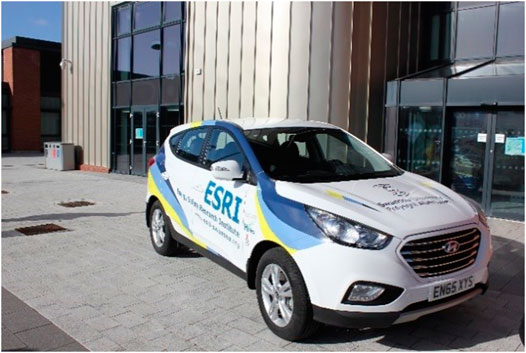
FIGURE 5. Tokens given to participants before The Hydrogen Bike demonstration, as part of the initial interaction. Typically, a Hydrogen Bike team member begins each interaction by asking the question: “How do you feel about hydrogen?” Red tokens correspond to negative responses, whereas green tokens signify a positive opinion. Yellow tokens are given to participants who offer no opinion on hydrogen.
The nature of science fairs means discussions can be between a demonstrator and a single participant, or groups of up to approximately 12. With multiple demonstrators on the stand, multiple discussions may be happening in parallel. In order to avoid potential participants joining an existing discussion an effort is made to have enough facilitators available that facilitators can identify and approach potential participants quickly to ensure that these participants are given the demonstration from the beginning. However, at busy events, individuals do join existing discussions as not enough facilitators are available. However, these individuals do not receive a token and are therefore not included in the data collection, preventing feedback being given by those who have not had their baseline opinion taken. Only those asked the initial question will be in possession of a token.
Following the demonstration, the participant is asked a second question:
“How do you feel about a hydrogen powered future?”
The question is said verbally by a facilitator to the group, as well as being written above the emoticons on the feedback collection tubes. To answer this question, individually the participants place their token in one of five tubes, each labeled by a different emoticon, depicted in Figure 2. Participants who are not asked the initial question are not in possession of a token, so are not included in the dataset. Participants who walk away from the demonstration before being asked the second question do not deposit their token in a tube, and also aren’t included in the dataset. The placement of the token in a tube concludes the participant’s interaction with The Hydrogen Bike.
The verbalization of the feedback question and other discussions was combined with the use of tokens and emoticons to facilitate the participation in an inclusive and efficient manner, while ensuring that the collection of data did not adversely affect the ability of The Hydrogen Bike team to deliver the demonstration. The use of a single, simple question is aimed to maximize the rate of audience feedback by requiring minimal participant input. The question is phrased in a manner chosen to avoid biasing a listener’s response; it would be inappropriate to offer the question, “Is hydrogen power the future?”, as this wording introduces a subtle positive bias that could jeopardize the reliability of the assessment. Indeed, the dropping of tokens into tubes labeled with an emoticon were employed as a further strategy to avoid biasing the results of the feedback: by allowing respondents to indicate their final opinion in this way, rather than via an interaction with a member of The Hydrogen Bike team, the process minimizes the possibility of a false response resulting from a team member’s expectation of a positive result. The five color coded faces, ranging from “very happy” to “very sad”, allows even young participants to quickly identify which option corresponds to their present opinion. This procedure is similar to the Faces Pain Scale, which was developed for children to be able to consistently self-assess pain (Bieri et al., 1990), and a technique employed when requiring instantaneous customer feedback on the quality of a service such as in airports. The use of emoticons to record participant feedback also corresponds to the widespread adoption of emoticons in text-based communication. (Kaye et al., 2017).
Participants
The Hydrogen Bike demonstration has been conducted across the United Kingdom since 2016. The described feedback system was employed over seven events between July 2018 and March 2019. The participants were self-selecting and nearly 4,700 participants took part in the activity and gave their feedback according to the method described above.
The Eisteddfod, Swansea Science Festival, and Big Bang Fair (Saturday only) were events aimed at families with school age children. The Big Bang Fair (weekdays) and Your Green Future were aimed at school age children as an extra-curricular school outing. Wales on Wheels and Swansea Clean Air Show relied on passing public interest in a public space. The Low Carbon Heating Forum had a very different demographic, namely business professionals who work on gas and hot water distribution networks at a local and national level.
The data for each event are presented separately, alongside keywords describing the broad demographics of the attendees. The short interaction time meant collecting demographic data from participants was not appropriate.
Results
Table 1 presents the datasets from each individual event. The allocation of each color of token, and the emoticon to which they are returned, are given in percentages. The proportion of people with an initial positive perception of hydrogen varied between events. Swansea Science Festival was aimed at families with school age children, attendance is free, but likely to be attended by families with an interest in extra-circular science. The lowest take-up of green tokens was from this event at 9%. The highest allocation of green tokens, 81%, was at the Low Carbon Heating forum, attended by adults who work in the heating and hot water industry.
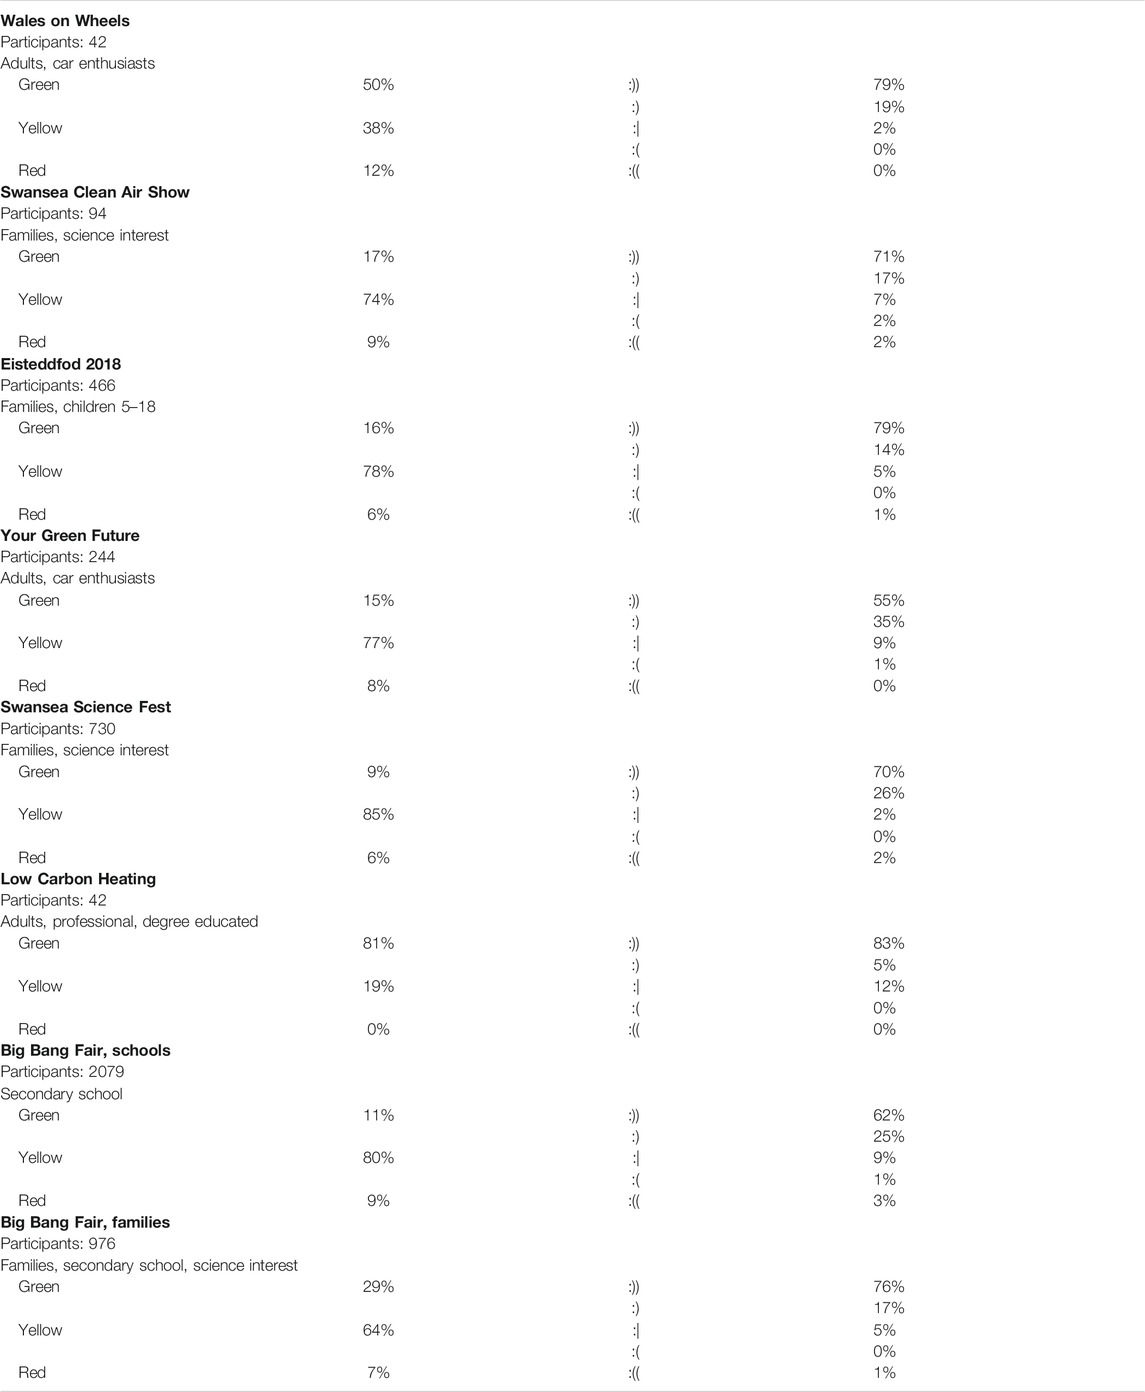
TABLE 1. These seven events were attended by The Hydrogen Bike with one to three keywords describing the assumed demographics of the attendees of the events. In response to the two questions about the participants’ feelings towards hydrogen, the percentage of each colour of token allocated and where those tokens were returned is listed. :)) :) :| :( and :(( represent the dark green, light green, yellow, orange and red faces on the tubes in Figure 2 respectively. Full data available in the Supplementary Table S1.
There is a general trend toward a more positive feeling about hydrogen after an interaction with The Hydrogen Bike, with every event having more tokens returned to the most positive emoticon than green tokens given out. It’s worth noting here, that not all green tokens are returned to positive emoticon; some are returned to either the neutral or negative emoticons. This is shown in Figure 6, and discussed more fully later.
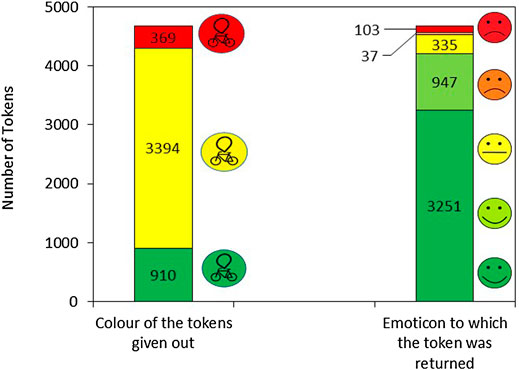
FIGURE 6. A total of 4,673 participants’ opinions were recorded. The color of the segments in the first bar corresponds to the color of the token issued to a participant, red, yellow or green. The color of the segments in the second bar indicates where the participant left their token, according to how they felt about a hydrogen powered future, ranging from dark green indicating very positive to red indicating very negative.
Over 65% of the data below comes from The Big Bang Fair in 2019. The Big Bang Fair, aimed at secondary school children, is over four days, and attracts visitors from all over the United Kingdom. Over the first three days, Wednesday to Friday, the majority of attendees are secondary school students (11–16) brought as a year or school group by teachers, and the final day, Saturday, is mostly families bringing their 11–16 year old children. Attendance is free, but the event is held in an exhibition center on the outskirts on Birmingham, central England. Participants attend from across the United Kingdom but as this involves significant travel for most participants it’s assumed that most families or teachers attending want to increase their children’s/students’ participation in STEM activities. In total the Big Bang Festival 2019 was attended by 80,000 visitors2, of which 3,055 (∼3.8%) answered both questions about their feelings toward hydrogen. 11% of participants attending during the weekdays expressed opinions that allocated them a green token, but the majority (80%) were allocated a yellow token. In contrast, on Saturday 29% of participants expressed an opinion that allocated them a green token. This might be because of the increased average age of the participants and therefore, the possibility that they had had more exposure to the concept of hydrogen. At the end of the demonstration 62% of respondents during the weekdays indicated they felt very positive about a hydrogen powered future, lower than on Saturday where 76% of respondents were very positive. This is possibly due to facilitators working with smaller, family groups, on the family day where groups were no more than five people on average, compared to groups of up to 12 individuals on the school days. The smaller groups on the family day, gave the opportunity for a more tailored discussion with a facilitator, which may have contributed to the stronger positive feeling shown at the end of the interaction.
Compiling data from the seven events, Figure 6, illustrates how many of each token was handed out and where those tokens were placed in answer to the second question. Of the 4,673 participants in the study, 73% of participants were judged by facilitators to have no initial opinion on hydrogen (yellow token), while 19% had a positive opinion (green token) and the remainder (8%) perceived hydrogen negatively (red token). The second series of Figure 6 shows the distribution of the tokens into the five emoticon categories, where the color of each segment corresponds to the color of the emoticon. The majority of participants felt positive about a hydrogen powered future at the end of the demonstration: by this final stage of the feedback process, 90% of participants self-reported a positive view (indicated by placing their token in either of the tubes labeled with a green smiley face), with 7% recording a neutral view (indicated by placing their token in the tube labeled with a yellow face with a neutral expression) and 3% placed their token in tubes labeled with either the red or orange sad face).
Figure 7 displays the distribution of which color tokens went into each of the five emoticon categories in response to the feedback question. The color of the segment corresponds to the color of the token given to a participant at the start of the demonstration. 73% of people were given a yellow token. People considered by the facilitators to have no initial opinion on hydrogen typically returned their tokens to either of the two collection tubes marked with green smiley faces after their participation: within this group 88% of participants reported feeling positive about hydrogen as an energy vector after taking part. After the demonstration 9% of people with no initial opinion remained neutral and the remaining 3% developed a negative stance. Therefore, 91% of those initially with no strong feelings or knowledge about hydrogen indicated they were able to form an opinion after interacting with The Hydrogen Bike. Bellaby and Clark (2014) found that adults and students who visited a hydrogen research and demonstration center were better informed after the visit; “Following the visit, on average people of every age knew more about hydrogen energy than they did beforehand” (p. 15,131). So, it is possible that the participants in the Hydrogen Bike demonstration were able to change their opinion of hydrogen as a fuel of the future as a result of their gain in information. However, we can’t meaningfully equate returned tokens to long-term opinion change, as The Hydrogen Bike does not have the scope to follow-up with participants.
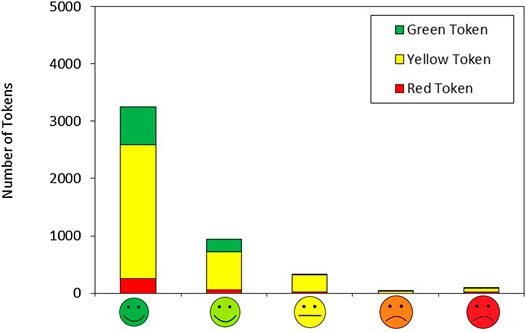
FIGURE 7. Bar chart of participant feelings on hydrogen following The Hydrogen Bike demonstration. There were five different tubes to place a token at the end of demonstration, each marked with an emoticon. The color of the bar denotes the color of the token the participant was issued at the start of the demonstration.
Positive impact was also observed in the group containing people who were initially negative about hydrogen (8% of all participants): by the end of the demonstration, 88% of these participants felt positively about hydrogen, with more than 70% of the group selecting the most positive category. This is consistent with the findings from (Bellaby and Clark, 2014) who found that secondary school students and adults who visited a hydrogen research and demonstration center were “reassured by what they saw at the Centre” (p. 15,130) re: the safety of hydrogen and its potential as a future fuel. Twenty five people with an initially negative view, or 7% of the group issued a red token, did not have their opinions altered by the demonstration, while 6% of the group shifted to a more neutral standpoint.
Discussion
Systematic Error of Data Collection
One must address possible errors that may have arisen during collection of the data. Members of The Hydrogen Bike team reported instances of perceived “false readings” from the public, including young participants mistakenly believing that they should “color match” their token by placing it into the feedback tube marked by an emoticon of the same color. To serve as a rudimentary estimate of the error resulting from this erroneous usage of the feedback system, it is to be assumed that respondents who were initially favourable toward hydrogen were unlikely to alter to a negative or neutral opinion following their participation; from this assumption it follows that such responses may be rationalized as an incorrect feedback submission, and a similar percentage error may subsequently be assumed for the recipients of red or yellow tokens. Of the 901 people who initially responded positively to the prospect of a hydrogen powered future, 17 submitted a neutral response at the end of the presentation, with a further 17 indicating that they had correspondingly developed a negative opinion. These 34 votes account for less than 4% of the green tokens taken, and less than 1% of interactions overall; accordingly, one estimates an error of approximately 4% in the total error in the accumulated responses.
While evidence of systematic error during The Hydrogen Bike demonstration is predominantly anecdotal in nature, it is notable that no green tokens were submitted to negative or neutral feedback tubes at three of the seven events attended; indeed, changes in an initially positive perception of hydrogen were measured only at the largest three events, namely the National Eisteddfod 2018, the Swansea Science Festival 2018, and the Big Bang Fair 2019. A possible explanation for this outcome is that the three festivals attracted a high number of families containing children younger than six years of age. Despite these children not being asked the initial question and not being allocated a token by facilitators, a tiny fraction of these young attendees were given the token allocated to another participant, and loaded the token into the feedback tubes. We believe this fraction to be insignificant, nevertheless contributed to the feedback study. Other reported instances of such misuse include the placement of tokens in the feedback tubes of equivalent color, while other respondents were observed to base their selections on the likelihood of a hydrogen powered future, rather than on their own opinion of whether such a circumstance would be desirable.
This method of collecting feedback has the limitation that participants may apply some interpretation to the two questions, or the unintentionally answer questions other than those asked. The questions are designed to be neutral and not leading, and deliberately don’t ask for an opinion on the quality of the stall or the facilitators. However, we acknowledge that although the same questions are always asked, they might not be the questioned answered, particularly the post-activity question. It’s possible that some participants are reporting a positive feeling after enjoying the activity, or enjoying the science fair in general.
There was a slight difference in wording between the pre- and post-activity questions. This difference reduces confidence when interpreting results and establishing the extent to which The Hydrogen Bike actually influenced respondents' opinions about "a hydrogen-powered future".
It’s outside of the scope of this activity to capture data about the long term impact the Hydrogen Bike has on a participants’ opinion on the use of hydrogen as an energy carrier.
Future Adjustments
As an additional precaution to prevent bias in the feedback assessment, future events are likely to adopt opaque tubes to hide the tokens of past respondents from future participants. In this way, it may be ensured that the responses of new respondents are not biased by the views of those who participated previously. For the purpose of allowing both The Hydrogen Bike team members and past respondents to view the cumulative results, it may be preferable to include a measure to display the tokens within the tubes at the team’s discretion, such as by making the tubes transparent on one side.
To ensure that the baseline established pre-activity can be related to the post-activity responses, it’s recommended that the same question is asked pre- and post-activity.
Conclusion
The Hydrogen Bike project was designed with an aim to positively sway public perception concerning the use of hydrogen to store energy from renewable sources, and to demonstrate a novel method of measuring changes in public opinion following their participation in STEMM outreach activities. After interacting with The Hydrogen Bike, overall self-reporting of negative opinions toward hydrogen decreased from 8% to 3%, while neutral viewpoints decreased tenfold from 72% to 7%; correspondingly, the proportion of respondents reporting positive opinions on hydrogen as an energy vector increased from 20% to 90% as a consequence of their participation. Overall, 92% of participants who took a red or yellow token returned their token to a tube marked with a green smiling face.
By issuing colored tokens to participants based on their perception of hydrogen, followed by the return of those tokens into emoticon-labelled tubes at the culmination of the display, The Hydrogen Bike team were able to collect opinions before and after participation. Our data collection was a simple, quick and intuitive method that is applicable to many outreach activities.
Data Availability Statement
The datasets generated for this study are available on request to the corresponding author.
Ethics Statement
Written informed consent was obtained from the minor(s)’ legal guardian/next of kin for the publication of Figure 1B, a potentially identifiable image.
With the exception of Figure 1B, no identifying information was collected from participants. As such, no ethics approval was sought for this study. No identifying information is reported in this paper and the information collected isn’t sensitive so no written consent from participants was required. Taken from the British Psychology Society’s Code of Human Research (2014) “For anonymised-at-source, non-sensitive data, consent may be considered to have been given by the act of participation”
Author Contributions
DRJ, JAR, KG, EF, MEAW, CWD, WJFG all contributed to writing the manuscript. CWD designed and built The Hydrogen Bike. EF and CWD designed the impact measurement. CWD, DRJ, KG, MEAW and WJFG have all been involved in demonstrations of The Hydrogen Bike. All authors contributed to manuscript revision, read and approved the submitted version.
Funding
The Hydrogen Bike has benefited from support from a number of projects. The Royal Society of Chemistry provided the team with a £2000 grant to improve the display and sponsored the exhibit at the Big Bang Fair 2019, while the FLEXIS project has sponsored other improvements to the set-up. KG and JAR acknowledge funding from the RICE project. DRJ acknowledges funding from the FLEXIS project. Both RICE and FLEXIS have been part-funded by the EU’s European Regional Development Fund through the Welsh Government (Grant numbers 81435 and 80835 respectively). MEAW acknowledges the European Union’s Horizon 2020 research and innovation program under the Marie Skodowska-Curie grant agreement No 663830. WJFG PhD is funded by a Zienkiewicz Scholarship
Conflict of Interest
CWD is the director of H2-NRG LTD., a spin out company associated with Swansea University, with interests in energy recycling, energy recovery and on-demand renewable energy.
The remaining authors declare that the research was conducted in the absence of any commercial or financial relationships that could be construed as a potential conflict of interest.
Acknowledgments
The authors would like to thank all of the people who have helped to run the display over the years, and are grateful to the many participants who have engaged with the demonstration.
Supplementary Material
The Supplementary Material for this article can be found online at: https://www.frontiersin.org/articles/10.3389/fcomm.2020.540635/full#supplementary-material.
Footnotes
1Warming is expressed relative to the period 1850–1900, used as an approximation of pre-industrial temperatures (IPCC 2018).
2https://www.fenews.co.uk/press-releases/39065-uk-s-largest-celebration-of-stem-the-big-bang-fair-announces-new-series-of-regional-events
References
Bellaby, P., and Clark, A. (2014). Lay discourse about hydrogen energy and the environment: discussion by young people and adults following a first visit to a Hydrogen Research and Demonstration Centre. Int. J. Hydrogen Energy 39 (27), 15125–15133. doi:10.1016/j.ijhydene.2014.07.090
Bellaby, P., Upham, P., Flynn, R., and Ricci, M. (2016). Unfamiliar fuel: how the UK public views the infrastructure required to supply hydrogen for road transport. Int. J. Hydrogen Energy 41 (15), 6534–6543. doi:10.1016/j.ijhydene.2016.03.024
Bieri, D., Reeve, R. A., David Champion, G., Addicoat, L., and Ziegler, J. B. (1990). The faces pain scale for the self-assessment of the severity of pain experienced by children: development, initial validation, and preliminary investigation for ratio scale properties. Pain 41, 139–150. doi:10.1016/0304-3959(90)90018-9 |
Caref, E., Rex, M., Lederberg, A., and Moore, G. (2018). If you give a kid an oyster: reflections on collaborations in place-based STEM education through oyster restoration science in New York city. J. Stem Outreach. 1 (1), 1–11. 10.15695/JSO.V1I2.4510
Cherryman, S. J., King, S., Hawkes, F. R., Dinsdale, R., and Hawkes, D. L. (2008). An exploratory study of public opinions on the use of hydrogen energy in Wales. Publ. Understand. Sci. 17 (3), 397–410. doi:10.1177/0963662506068053
Crowl, D. A., and Jo, Y.-D. (2007). The hazards and risks of hydrogen. J. Loss Prev. Process. Ind. 20 (2), 158–164. doi:10.1016/j.jlp.2007.02.002
Driscoll, J. A. (1997). Acid rain demonstration: the formation of nitrogen oxides as a by-product of high-temperature flames in connection with internal combustion engines. J. Chem. Educ. 74 (12), 1424. doi:10.1021/ed074p1424
Evangelopoulou, S., De Vita, A., Zazias, G., and Capros, P. (2019). Energy system modelling of carbon-neutral hydrogen as an enabler of sectoral integration within a decarbonization pathway. Energies 12 (13), 2551. 10.3390/en12132551
Haraldsson, K., Folkesson, A., Saxe, M., and Alvfors, P. (2006). A first report on the attitude towards hydrogen fuel cell buses in Stockholm. Int. J. Hydrogen Energy 31 (3), 317–325. doi:10.1016/j.ijhydene.2005.11.008
Hulme, M. (2016). 1.5°C and climate research after the Paris Agreement. Nat. Clim. Change 6 (3), 222–224. doi:10.1038/nclimate2939
IAOGP (2017). Oil in Everyday Life [Online]. Available at: https://32zn56499nov99m251h4e9t8-wpengine.netdna-ssl.com/wp-content/uploads/2017/07/Oils-Many-Uses-ENG.pdf (Accessed January 7, 2021).
IPCC (2018). Global warming of 1.5 degrees centigrade. Special report. Geneva, Switzerland: IPCC Special report.
Jones, A., Chang, A., Carter, R., and Roden, W. (2019). Impacts of hands-on science curriculum for elementary school students and families delivered on a mobile laborator. J. STEM Outreach. 2, 1–12. doi:10.15695/jstem/v2i1.02
Jones, D. R., Al-Masry, W. A., and Dunnill, Charles. W. (2018). Hydrogen-enriched natural gas as a domestic fuel: an analysis based on flash-back and blow-off limits for domestic natural gas appliances within the UK. Sustain. Energ. Fuels 2 (4), 710–723. doi:10.1039/C7SE00598A
Karteng, K. (2020). £90 million UK drive to reduce carbon emissions. London, United Kingdom: UK Research and Innovation. E.I.S. Department for Business Available at: https://www.gov.uk/government/news/90-million-uk-drive-to-reduce-carbon-emissions (Accessed February 18, 2020).
Kaye, L. K., Malone, S. A., and Wall, H. J. (2017). Emojis: insights, affordances, and possibilities for psychological science. Trends Cognit. Sci. 21 (2), 66–68. doi:10.1016/j.tics.2016.10.007
Mokros, J., and Atkinson, J. (2018). Farmers markets and fairs as venues for doing math in rural settings. J. STEM Outreach. 1 (1).
Passas, G., and Dunnill, C. W. (2015). Water splitting test cell for renewable energy storage as hydrogen gas. J. Fund. Renew. Energy Appl. 5, 188. doi:10.4172/20904541.1000188
Phillips, R., and Dunnill, C. W. (2016). Zero gap alkaline electrolysis cell design for renewable energy storage as hydrogen gas. RSC Adv. 6 (102), 100643–100651. doi:10.1039/C6RA22242K
Phillips, R., Edwards, A., Rome, B., Jones, D. R., and Dunnill, C. W. (2017). Minimising the ohmic resistance of an alkaline electrolysis cell through effective cell design. Int. J. Hydrogen Energy 42 (38), 23986–23994. doi:10.1016/j.ijhydene.2017.07.184
POST, (2002). Prospects for a hydrogen economy. Available at: https://post.parliament.uk/research-briefings/post-pn-186/ (Accessed October 1, 2002).
Sawyer, J. S. (1972). Man-made carbon dioxide and the “greenhouse” effect. Nature 239 (5366), 23–26. doi:10.1038/239023a0
Schulte, I., Hart, D., and van der Vorst, R. (2004). Issues affecting the acceptance of hydrogen fuel. Int. J. Hydrogen Energy 29 (7), 677–685. doi:10.1016/j.ijhydene.2003.09.006
Scott, M., and Powells, G. (2020). Towards a new social science research agenda for hydrogen transitions: social practices, energy justice, and place attachment. Energy Res. Soc. Sci. 61, 101346. doi:10.1016/j.erss.2019.101346
Thesen, G., and Langhelle, O. (2008). Awareness, acceptability and attitudes towards hydrogen vehicles and filling stations: a Greater Stavanger case study and comparisons with London. Int. J. Hydrogen Energy 33 (21), 5859–5867. doi:10.1016/j.ijhydene.2008.07.006
Keywords: green hydrogen, science communication, energy, renewables, public opinion, energy storage
Citation: Glover K, Rudd JA, Jones DR, Forde E, Warwick MEA, Gannon WJF and Dunnill CW (2021) The Hydrogen Bike: Communicating the Production and Safety of Green Hydrogen. Front. Commun. 5:540635. doi: 10.3389/fcomm.2020.540635
Received: 05 March 2020; Accepted: 17 December 2020;
Published: 10 March 2021.
Edited by:
Kathleen P. Hunt, SUNY New Paltz, United StatesReviewed by:
Ann Grand, The Open University, United KingdomDara M. Wald, Iowa State University, United States
Copyright © 2021 Glover, Rudd, Jones, Forde, Warwick, Gannon and Dunnill. This is an open-access article distributed under the terms of the Creative Commons Attribution License (CC BY). The use, distribution or reproduction in other forums is permitted, provided the original author(s) and the copyright owner(s) are credited and that the original publication in this journal is cited, in accordance with accepted academic practice. No use, distribution or reproduction is permitted which does not comply with these terms.
*Correspondence: Charles W. Dunnill, Yy5kdW5uaWxsQHN3YW5zZWEuYWMudWs=