 Sarah A. Sauvé
 Praveena Satkunarajah
 Benjamin Rich Zendel
- 1Cognitive Aging and Auditory Neuroscience Lab, Division of Community Health and Humanities, Faculty of Medicine, Memorial University of Newfoundland and Labrador, St. John's, NL, Canada
- 2School of Psychology, College of Social Science, University of Lincoln, Lincoln, United Kingdom
Introduction: The tonal hierarchy is a perceived musical structure implicitly learned through exposure. Previous studies have demonstrated that new grammars, for example based on the Bohlen-Pierce scale, can be learned in as little as 20 minutes.
Methods: In this study, we created two grammars derived from the Bohlen-Pierce scale similar in complexity to the western tonal hierarchy. Participants rated the goodness-of-fit of all Bohlen-Pierce scale notes in a probe tone paradigm before and after 30 minutes of exposure to one of the two grammars. Participants were then asked about their experience in a short interview.
Results: Results do not support the learning of the artificial grammar: correlations between goodness-of-fit ratings and pitch frequency distribution of a grammar were no different before and after exposure to a grammar. Interviews suggest that participants are bad at identifying the strategy they used to complete the task. Testing the strategies reported on the data revealed that ratings decreased with increasing distance of the probe tone from the tonic.
Discussion: This is consistent with early brain responses to chromatic pitches of the tonal hierarchy. We suggest that longer exposure time is necessary to learn more complex grammars.
1. Introduction
Tonality is a hierarchical structure of pitch in western tonal music. The tonal hierarchy reflects the perceptual organization of the relationships between the 12 pitches of the chromatic scale. It is learned implicitly through passive exposure to music during development (Krumhansl and Keil, 1982; Saffran et al., 1999; Tillmann et al., 2000), and fully assimilated around middle childhood (Krumhansl and Keil, 1982). However, the mechanisms by which the perception of the tonal hierarchy is formed are not fully understood and require further investigating. The type of passive learning by which the tonal hierarchy is learned is referred to as statistical learning (Aslin et al., 1999; Saffran et al., 1999). In general, statistical learning is the process of implicitly extracting statistical regularities in perceptual information. In music, certain notes are more likely to occur based on the global and local context. Saffran et al. (1999) demonstrated implicit statistical learning in music by exposing listeners to “tone words” made up of three pure tones spanning an octave. For each tone word, the transitional probability, that is, the probability of one note following another, was higher within-word (mean 0.64) than between-word (mean 0.14). With only transitional probability to guide them, listeners were reliably able to identify tone words from non-words in a two-alternative forced-choice paradigm after 21 min of exposure. This replicated findings of implicit statistical learning for language stimuli (Aslin et al., 1999).
Implicit statistical learning is the theoretical foundation of all work discussed in this paper. The tonal hierarchy was empirically defined using a probe tone method (Krumhansl and Shepard, 1979; Krumhansl and Kessler, 1982; Krumhansl et al., 1987). In this method, a tonal context (an arpeggio, a chord progression, a scale or a melody) is followed by a probe tone. Participants rate how well the probe tone fits with the given tonal context. Perception of fit is generally grouped into three categories: tonic chord tones (scale degrees 0, 4, and 7 in the chromatic scale), diatonic tones (2, 6, 9, and 11) and chromatic tones (1, 3, 5, 8, and 10). Probe tone ratings generally match the statistical distribution of notes in western tonal music (Krumhansl, 1990; Krumhansl and Cuddy, 2010).
There has been recent research into the neural underpinnings of the tonal hierarchy (Sankaran et al., 2018, 2020; Quiroga-Martinez et al., 2020; Sauvé et al., 2021). These studies collected EEG (Sauvé et al., 2021) or MEG (Sankaran et al., 2018, 2020; Quiroga-Martinez et al., 2020) data from participants while they listened to a probe tone paradigm (Sankaran et al., 2018, 2020; Sauvé et al., 2021) or a series of melodies (Quiroga-Martinez et al., 2020). The context for the probe tone paradigm was an arpeggio (Sauvé et al., 2021) or a chord progression (Sankaran et al., 2018, 2020). Participants either listened passively while watching a silent film (Sauvé et al., 2021) or performed a related (in-key v. out-of-key) or unrelated (timbre) judgment task (Sankaran et al., 2018, 2020; Quiroga-Martinez et al., 2020). Sankaran et al. (2018) and Sankaran et al. (2020) found that early neural responses to the probe tone (0–200 ms) correlated most strongly with pitch height. Late neural responses (200–1,000 ms) correlated most strongly with the structure of the tonal hierarchy. Quiroga-Martinez et al. (2020) also found a correlation between the N1m and pitch height. Later components MMNm and P3am were found to correlate with information content. Information content is correlated with measures of expectation, where high information content reflects high surprise and low information content low surprise (Hansen and Pearce, 2014). This is comparable to the measure of the tonal hierarchy. Specifically, notes with high information content would be rated as having low fit in a probe tone paradigm; notes with low information content would be rated as having high fit. Finally, Sauvé et al. (2021) found that both pitch height and the tonal hierarchy correlated similarly to N1 and P2 amplitude and latency, and ERAN amplitude. They also found high levels of individual differences in magnitude and direction of these correlations.
We know from its high replication rate that the tonal hierarchy is robust. However, given that it is developed at a young age (Krumhansl and Keil, 1982; Trainor and Trehub, 1992, 1994; Koelsch et al., 2003; Schellenberg et al., 2005) it is difficult to study the formation of such a complex hierarchy. Artificial musical grammars have been a critical tool in beginning to understand musical learning (Altmann et al., 1995; Saffran et al., 1999; Loui and Wessel, 2008; Loui et al., 2010; Tillmann and Poulin-Charronnat, 2010; Loui, 2012; Prince et al., 2018; Guillemin and Tillmann, 2021). Some grammars use frequencies selected from the western major scale (e.g., Tillmann and Poulin-Charronnat, 2010; Guillemin and Tillmann, 2021). These focus on the transitional relationships between 4 to 6 chosen states to construct a grammar. Another option is to create a new grammar based on a scale unfamiliar to western listeners, the Bohlen-Pierce scale (Mathews et al., 1984, 1988). A particular advantage of the Bohlen-Pierce scale is that it can convincingly link the tonal hierarchy to statistical patterns instead of any kind of specialness of the frequencies (F0) or frequency relationships of western music. It is also rarely used in commercial music composition, meaning that it is novel to almost all listeners, regardless of cultural background. This allows the tracking of the emergence of a percept like a tonal hierarchy in truly naïve listeners. In the western chromatic scale, the octave (2:1 frequency ratio) is logarithmically divided into 12 pitches. In the Bohlen-Pierce scale, a tritave (3:1 frequency ratio) is logarithmically divided into 13 steps. The notes of the Bohlen-Pierce scale are generated using:
where k is the starting frequency.
The Bohlen-Pierce scale has been used by Psyche Loui and colleagues to investigate musical system learning in both behavioral (Loui and Wessel, 2008; Loui et al., 2010; Loui, 2012) and neurophysiological studies (Loui et al., 2009). In these studies, three chords were derived from the Bohlen-Pierce scale, each built of three pitches with an ~3:5:7 ratio. These three chords were used to create two 4-chord progressions. The two progression consisted of identical chords with one progression in reverse order to the other (i.e. 1–2–3–1; 1–3–2–1). Melodies were generated by applying rules according to a finite-state grammar. In this grammar, each chord was a state and each pitch in that chord was a node. Each chord (state) could repeat itself or move to the next chord (state) with equal probability. Each note (node) within a given chord was equally likely to occur. For more details, see Loui and Wessel (2008), Loui et al. (2010), and Loui (2012).
Loui's work has shown that after a mere 25–30 min of exposure, participants were, in a forced choice paradigm, able to recognize melodies they had heard before. They were also able to generalize the grammar to new melodies using the same grammar (Loui and Wessel, 2008; Loui et al., 2010). This was found whether the participants were musicians or non-musicians (Loui et al., 2010). More specifically, recognition was increased by the repetition of a few melodies during the exposure phase. In contrast, generalization was only possible with a greater variety of melodies that were not repeated (Loui and Wessel, 2008; Loui et al., 2010). Preference ratings were also affected by repetition. Specifically, fewer repeated melodies received higher preference ratings than many unrepeated melodies (Loui and Wessel, 2008; Loui et al., 2010).
Furthermore, Loui (2012) demonstrated that transitional probabilities were crucial to learning a new grammar. She found that recognition and generalization tasks were performed at chance levels when select melodic transitions were removed from the exposure phase. Loui et al. (2010) also investigated more fine-grained statistical learning patterns. They applied the probe tone paradigm (Krumhansl and Shepard, 1979; Krumhansl and Keil, 1982) before and after exposure to a new grammar using one of the generated melodies as a context. Correlation between goodness-of-fit ratings and pitch frequency across the exposure phase was calculated, with the frequency of the context melody pitches partialled out. This partial correlation was near-zero before exposure, and higher (non-zero) after exposure.
Finally, in an EEG paradigm, Loui et al. (2009) presented listeners with chords that were derived from the Bohlen-Pierce scale. A standard chord progression was presented 70% of the time, a deviant chord progression with a different chord in the third position was presented 20% of the time, and the standard chord progression where the second chord was faded out in volume was presented 10% of the time. Participants' task was to listen for fade-out chords. Loui et al. (2009) observed an early right anterior negativity (ERAN) and a late negative wave in response to deviant chords in four-chord progressions. This is consistent with previous work demonstrating an ERAN in response to a deviant chord in a western context (e.g., Koelsch et al., 2001), and suggests that listeners can rapidly learn new musical systems through passive exposure. Critically, the musical grammar used in the above studies is not as complex as the western tonal hierarchy. It used three chords, using six different pitches out of the 13 pitches of the Bohlen-Pierce scale. In contrast, the western major scale has seven pitches, out of a possible twelve, and far more than three chords. To validate statistical learning for a real-world context like learning the western tonal system, a more complex grammar must be tested. Furthermore, only one study probed the listener's underlying statistical knowledge of the acquired system (Loui et al., 2010), as opposed to recognition and generalization (Loui and Wessel, 2008; Loui et al., 2009; Loui, 2012).
Accordingly, the goal of the current study is to test if a musical grammar that was more closely comparable in complexity to the western tonal system could be learned in the lab based on statistical properties alone. To do this, we will generate an artificial tonal hierarchy derived from the Bohlen-Pierce scale and attempt to detect this hierarchy in listeners. Novel melodies will be generated based on a hierarchical system of constructed chords, an extension of the grammar developed in Loui and Wessel (2008) and Loui et al. (2010). Behavioral emergence of a perceived hierarchy will be measured using the probe tone paradigm (Krumhansl and Shepard, 1979). The context for the probe tone paradigm will be an ascending and descending scale consisting of a subset of pitches from the Bohlen-Pierce scale. This subset will be selected based on the statistical frequency of each Bohlen-Pierce pitch in the generated grammar. To track the emergence of a perceived hierarchy over time, the probe tone paradigm will be employed before and after exposure to the novel musical grammar. We expect that before exposure, there will be near-zero correlation between goodness-of-fit ratings and pitch frequency of the grammar. After exposure, goodness-of-fit ratings to probe tones will correlate with the statistical distribution of the pitch frequencies in the grammar. In both cases, the statistical distribution of the context will be partialled out. To ensure that exposure effects can be attributed to the underlying grammar and not another variable, such as pitch height, two grammars will be designed. We expect goodness-of-fit ratings of participants hearing Grammar 1 to correlate more strongly to Grammar1's pitch frequency distribution than to Grammar 2's, and vice versa for participants hearing Grammar 2.
In addition to these quantitative measures, short interviews will be conducted with participants after they have completed the probe tone paradigms. These will ask participants to share their experience of the study, such as strategies they used to complete the probe tone task or observations they made during the exposure phase or while doing the task. Interviews giving insight into the participant's experience will provide valuable information that cannot be gathered from correlations alone. Indeed, the combination of qualitative and quantitative methods are a useful way to gain differing insights into a research question (e.g., Perkins and Williamon, 2014). Furthermore, interviews are a method of doing research with the participants, here in addition to doing research on the participants (Leckenby and Hesse-Biber, 2007; Hesse-Biber, 2012).
2. Materials and methods
2.1. Participants
Fourteen participants (seven women, mean age 34, age range 20–54) were recruited from Memorial University of Newfoundland and Labrador and the local population. They provided written informed consent in accordance with the Interdisciplinary Committee on Ethics in Human Research at Memorial University of Newfoundland and Labrador (20220415-ME). This recruitment strategy was likely to yield a Western, Educated, Industrialized, Rich, Democratic (WEIRD) sample, a sampling bias in the psychological sciences (Henrich et al., 2010). We considered it justifiable in this study (Broesch et al., 2020) for two primary reasons: (1) we are not explicitly investigating cross-cultural issues of perception and are indeed seeking to better understand the emergence of the western perceptual tonal hierarchy; and (2) the previous work cited in relation to this study also very likely had WEIRD samples (not explicitly reported). In relation to the second point, we will be able to compare our results to the literature already discussed. Indeed, the majority of participants identified as white or Caucasian (8/14). Other identities included Asian, Middle Eastern, European and mixed. Each participant received a small honorarium for their time at a rate of $10/h.
An a priori power analysis using the effect size obtained in piloting (r = 0.13, with n = 2) suggested a sample size of seven participants per group. The effect size was measured by the difference in partial correlations between pre- and post-exposure to the grammar.
2.2. The grammars
We began with the three “major” chords used in Loui et al. (2010). We then created five new chords with varying levels of consonance for a total of 8 chords. Chords could be thought of as the equivalent of diatonic or chromatic, where the “major,” or diatonic chords use “scale degrees” (a subset of the Bohlen-Pierce scale), and chromatic chords include “non-scale degrees.” As a result, all 13 pitches of the Bohlen-Pierce scale were used at least once. These chords were organized into four-chord progressions. Each position in the progression was a state, and each state could have one or more chord options (see Table 1). One chord was defined as the “tonic.” Similarly to Loui et al. (2010), this “tonic” was always the first and last chord, or state. The remaining seven chords were placed in the second or third state, similar to the western tonal subdominant and dominant functions. In the “subdominant,” or second state, there were five chord options. In the “dominant,” or third state, there were two chord options. Each state could repeat itself or move onto the next state. If a state repeated itself, it could repeat the same chord or select a different chord in that same state according to the transitional probabilities outlined in Figures 1, 2. When arriving at a new state, the probability of each chord being selected differed as outlined in Figures 1, 2. For example, in Grammar 1, the first chord was always Chord 1. In state 1, there was a 20% probability of remaining in state 1 and an 80% probability of moving to state 2. If remaining in state 1, there was a 100% probability of chord 1 repeating itself. If moving on to state 2, there was a 60% probability of selecting chord 2, a 20% probability of selecting chord 6, a 10% probability of selecting chord 5 and a 5% probability each of selecting chords 4 and 8. If chords 2, 5 or 6 were selected, there was a 40% probability of remaining in state 2 and a 60% probability of moving on to state 3. If chords 4 or 8 were selected, there was a 100% probability of remaining in state 2, but selecting chords 2, 5 or 6. Within each chord, a pitch was selected with probabilities [0.45, 0.35, 0.2] for the first, second and third pitch respectively. This process was undertaken until 7–9 pitches were selected, forming a melody. For the final chord, pitch selection more heavily favored the tonic with probabilities [0.85, 0.1, 0.05]. Though parallels to the western tonal system can be drawn and inspires the design of this grammar, the artificial grammar does not map perfectly onto the western tonal system. This is intentional. The primary goal was to design a more complex grammar than previously tested. Figure 3 illustrates the distribution of chords and pitches in each grammar.
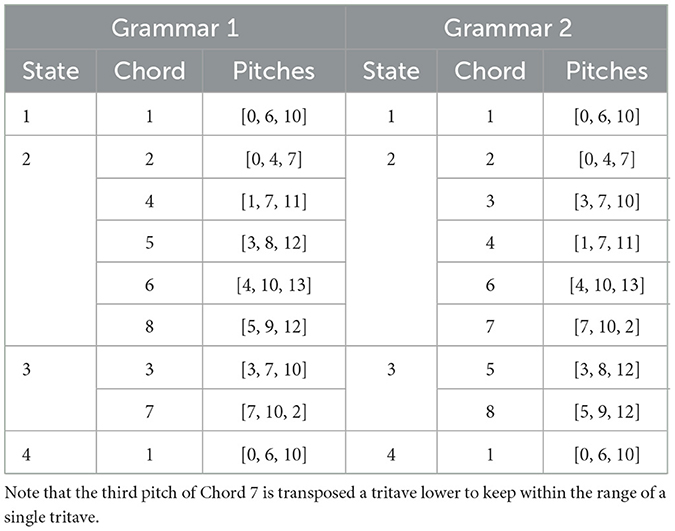
Table 1. Each state and its corresponding chord options and pitches for Grammars 1 and 2.
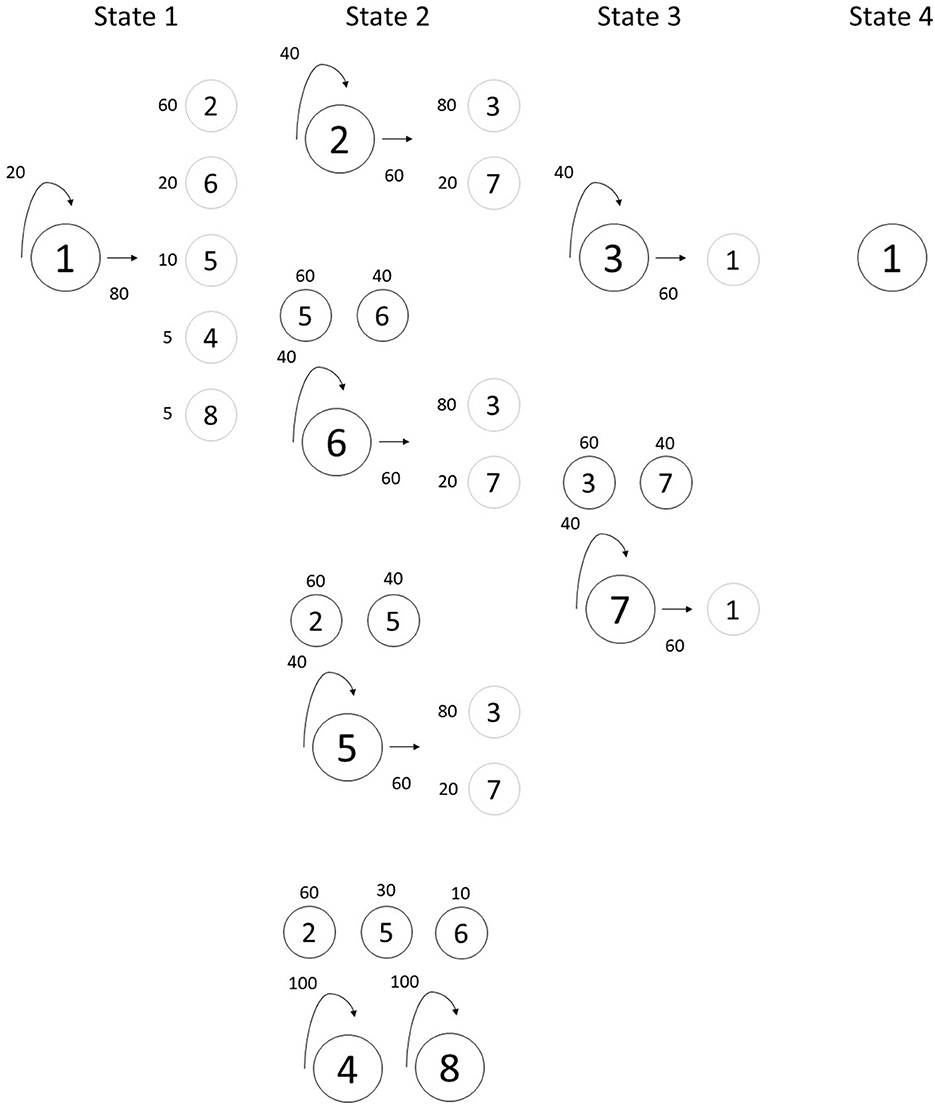
Figure 1. Illustration of Grammar 1's finite-state grammar. Large circles denote each chord in a state. The arrows coming from the large circles and the numbers associated with them denote the probabilities of remaining in the same state (curved arrow on the left) or moving to the next state (straight arrow to the right). The smaller circles denote the chords that can be moved to. The associated numbers denote each of these chords' probabilities. Small dark circles (above large circles) denote chords in the same state and small light gray circles (to the right of large circles) denote chords in the next state. When there is no small dark circle associated with a chord and if remaining in the same state, the only option is for the chord to repeat itself.
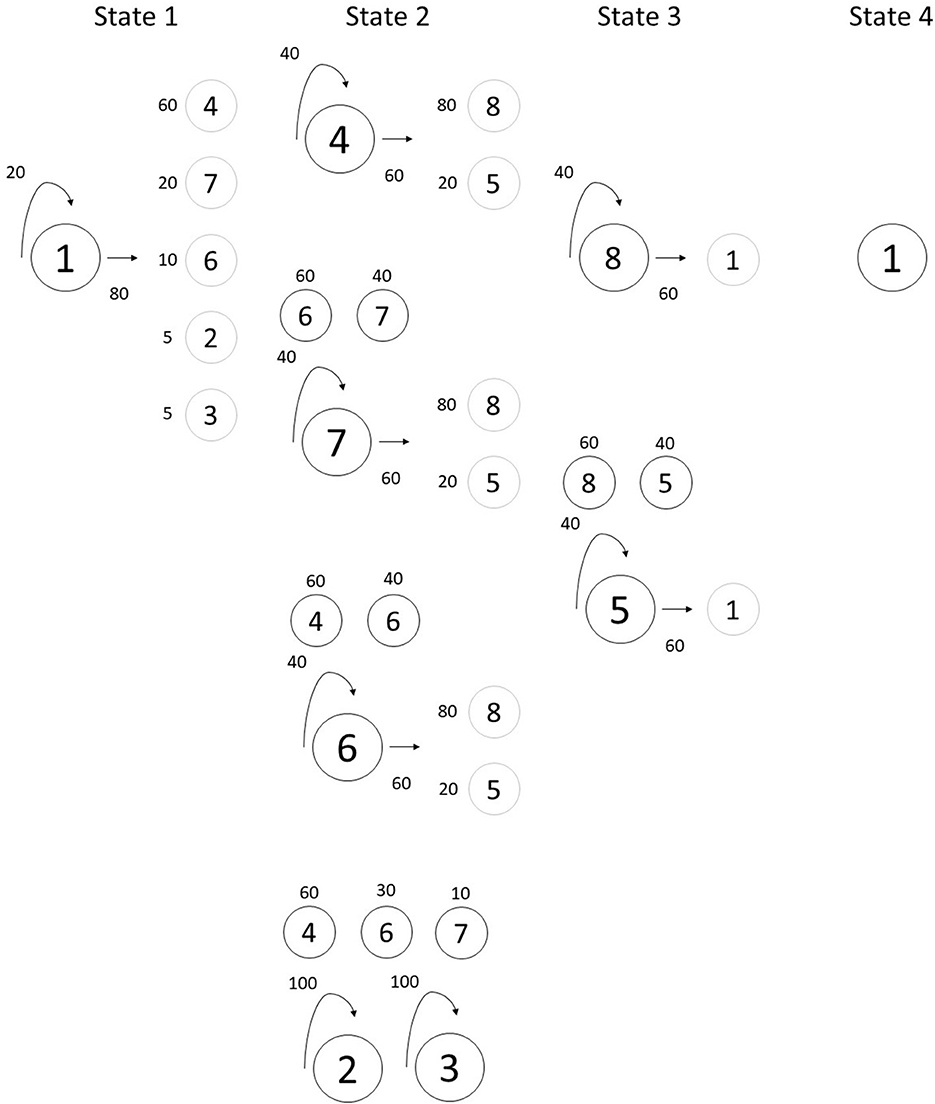
Figure 2. Illustration of Grammar 2's finite-state grammar. Large circles denote each chord in a state. The arrows coming from the large circles and the numbers associated with them denote the probabilities of remaining in the same state (curved arrow on the left) or moving to the next state (straight arrow to the right). The smaller circles denote the chords that can be moved to. The associated numbers denote each of these chords' probabilities. Small dark circles (above large circles) denote chords in the same state and small light gray circles (to the right of large circles) denote chords in the next state. When there is no small dark circle associated with a chord and if remaining in the same state, the only option is for the chord to repeat itself.
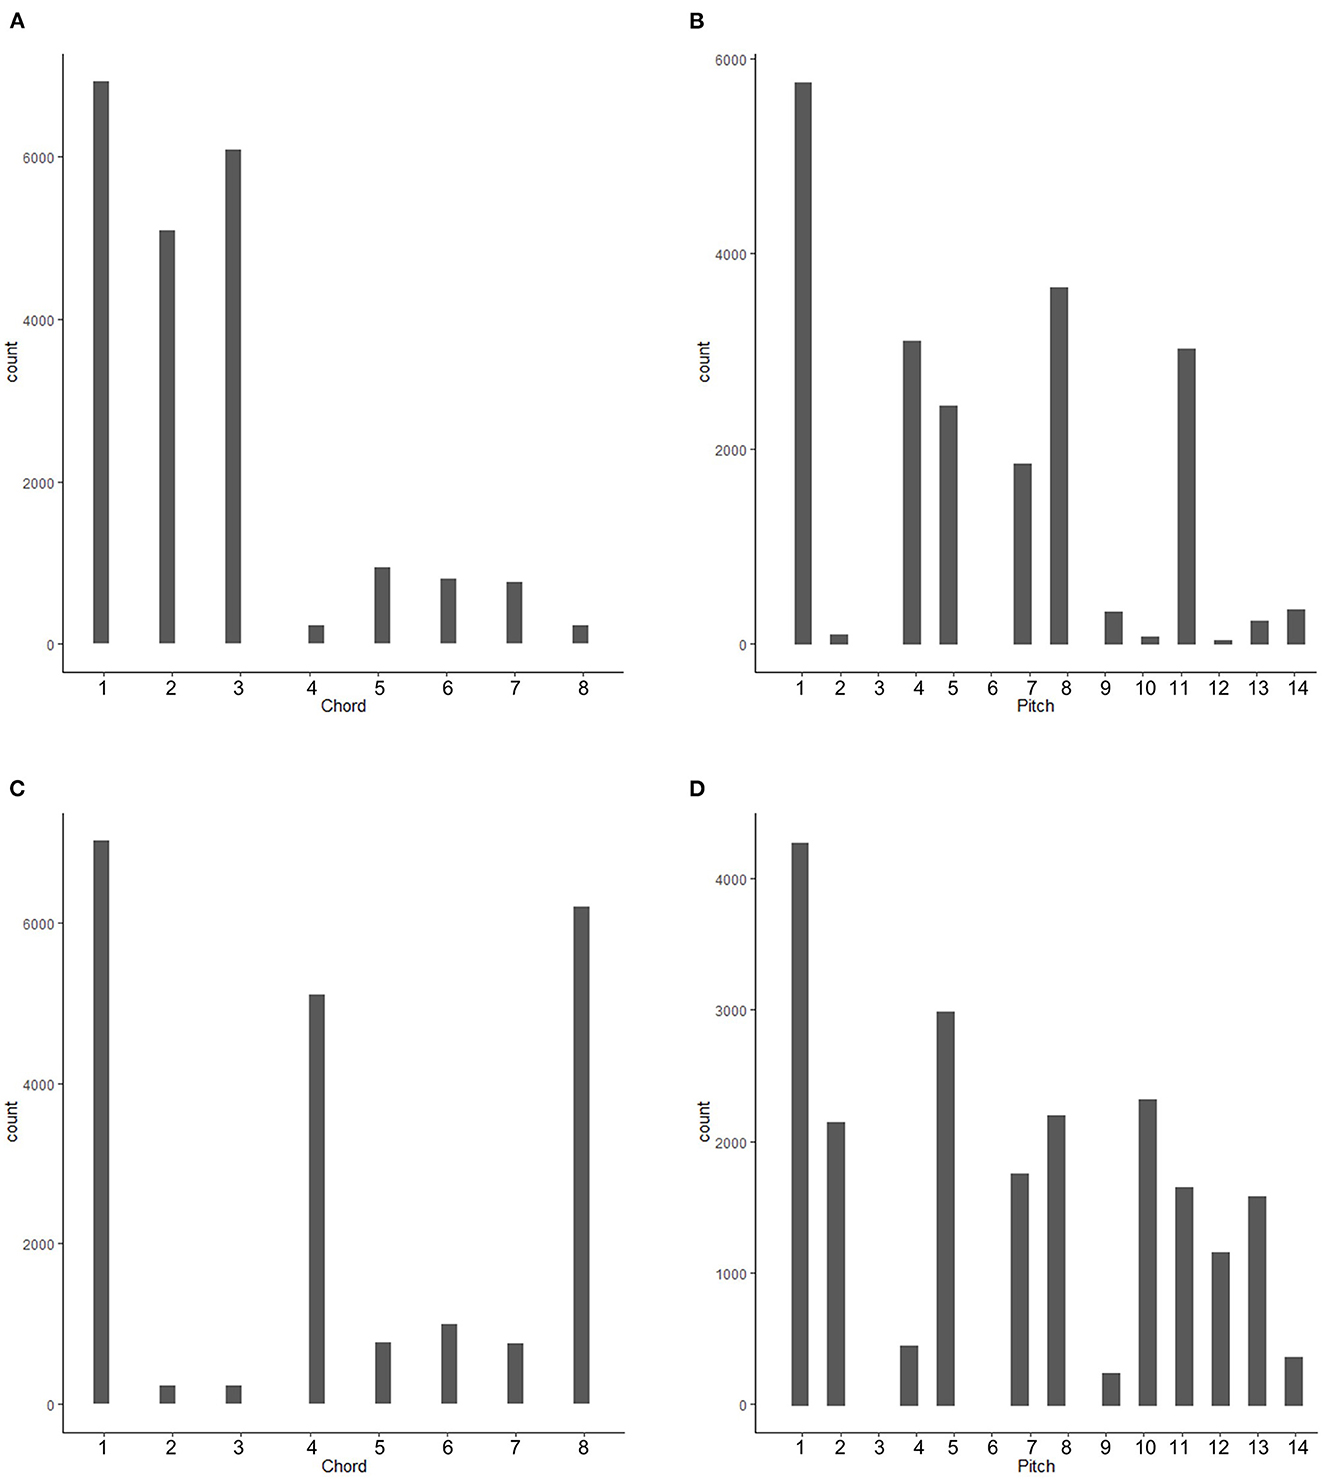
Figure 3. Frequency distribution of chords (A, C) and pitches (B, D) of Grammars 1 (A, B) and 2 (C, D).
2.3. Melody construction
Two thousand pitch sequences were generated using each grammar; for this study, 349 were used from Grammar 1 and 350 for Grammar 2. The base frequency of the Bohlen-Pierce scale was 190 Hz. Wave files were created for each pitch of the Bohlen-Pierce scale by (1) exporting a wave file with a piano sound from MuseScore for each chromatic pitch from G3 to D4; (2) applying Audacity's change tempo function to shorten each file to 600 ms and its change pitch function to modify the closest western chromatic pitch to each Bohlen-Pierce pitch (e.g., G3, with a frequency of 195.9 was modified to a frequency of 190 Hz, the first pitch of this Bohlen-Pierce scale); (3) combining wave files according to the generated pitch sequences using R's seewave package (Sueur et al., 2008); (4) adding a 500 ms silence between each sequence. Each melody consisted of 7–9 tones. It is worth noting that the overtones of the piano sounds do not match the tuning of the scale. However; given the entire musical system was foreign, and the sounds were designed to be as musical-sounding as possible, this was not anticipated to cause any particular difficulties. Future work could investigate this assumption. The lists of raw generated sequences for each grammar and the complete .wav stimuli files can be found on the project's OSF page.
2.4. Probe tone paradigm
Each trial consisted of a context and a probe tone. The context was a scale, ascending and descending (top note not repeated), made up of a subset of pitches from the Bohlen-Pierce scale. This subset was selected based on pitch frequencies in the grammar. For Grammar 1, the subset was 1, 4, 5, 7, 8, 11, and 14 and for Grammar 2, it was 1, 2, 5, 8, 10, 13, and 14. The probe tone was one of the 13 notes of the Bohlen-Pierce scale. Each tone was 600 ms long, the inter-onset-interval (IOI) was 600 ms and the IOI between the last context tone and the probe tone was 1,200 ms. The context sequence and probe tones (in the same range as the context) were created by combining the wave files created to generate the melodies, described above. These stimuli can be found on the project's OSF page.
2.5. Procedure
Participants first read and signed the informed consent form and were given the opportunity to ask questions. They filled out a short demographic slip asking for age, gender and race information; participants could choose a “prefer not to say” option or refrain from providing any information. Participants then (1) performed a probe tone task (before); (2) listened to 30 min of melodies (Grammar 1 or Grammar 2) while watching a silent movie, and (3) performed the probe tone task a second time (after). An exposure phase of 30 min was determined through piloting, where participants were exposed to 30 min each day for five consecutive days and performed probe tone ratings before and after each exposure phase. A learning effect was seen after the first exposure phase. Stimuli were presented through over-ear headphones (Sennheiser HDA 200) at a comfortable level. Finally, in an effort to better understand participant experience and strategies (Bernard, 2006; Broesch et al., 2020), in this case for judging “fit,” participants were asked the following questions: (1) did you have any strategies while doing the task?; (2) did you find anything different between each time you completed the task, i.e., before and after?; and (3) did you notice anything about the music that you want to share? Interviews were recorded for transcription and analysis. All tasks took place in a double-walled sound proof booth; interviews took place outside the booth. This study was pre-registered.
2.6. Analysis
This study was carried out according to a post-positivist framework. It was informed by practices in cognitive psychology, computational musicology and music perception. It assumes that data are a partial reflection of the world and that inferences about the world can be drawn from that data. Though the 7-point Likert scale is common in the fields named above, it assumes that participants are able to transfer a definition of “fit” onto a numerical scale. We take a dual hypothesis-driven and exploratory approach. Analysis was based on frequentist statistics and qualitative content analysis. Analysis was carried out in R 3.3.2 and on pen and paper. For statistical analysis, alpha was set at 0.01, with the conservative Bonferroni correction applied for multiple comparisons. Effect sizes are reported for all statistical tests. Where a statistical effect was null, a two-one-sided t-test (TOST) procedure was applied using the TOSTER package (Lakens, 2017). An equivalence test detects whether an effect is statistically different from zero and whether an effect is larger than a set smallest interesting effect size, or equivalence bound. In other words, in the presence of a null effect according to the omnibus test, the TOST procedure assesses whether the effect is non-zero and if it is large enough to be considered interesting. Here, the equivalence bound, or smallest interest effect size was set to Cohen's d of 0.2. Statistical tests pre-registered on OSF will be reported first, followed by a qualitative analysis of the interviews, and finally exploratory analysis inspired by the qualitative analysis and reviewer requests.
Partial correlation was calculated using the following formula (Loui et al., 2010):
where x was the goodness-of-fit ratings profile, y was the grammar's frequency profile and z was the probe tone context profile. Partial correlations were calculated for before and after exposure. Partial correlations were used instead of regular correlations because listeners' ratings may be influenced by the context, in which some pitches are played and others are not. This is necessary as it is difficult to create a “tonal”-like context when using all the notes of a given musical system. Partial correlation accounts for a correlation between ratings and the frequency profile of the context.
Interviews with participants were transcribed and translated from French where relevant (one participant) by the first author, a native speaker of both languages. They were printed and read through twice before any notes were taken. The interviews were mined for strategies used to complete the task, whether or not participants noticed a difference in performing the task each time, and any other observations they shared about their experience. Passages exemplifying these strategies and observations were highlighted for potential inclusion in the manuscript. Some notes and passages were made and extracted after initial analysis as the manuscript evolved.
3. Results
3.1. Confirmatory analysis
Raw goodness-of-fit ratings files were converted to data frames in R. Each grammar's frequency distribution according to pitch was calculated using all 2,000 sequences generated for each grammar by tallying the number of times each pitch appeared. This distribution was no different from the distribution of pitches calculated using only the melodies presented, according to Chi-square tests. The probe tone context profile was also a frequency distribution according to pitch, tallying the number of times each scale degree appeared in the context. Figure 4 presents mean ratings before and after exposure alongside each grammar's frequency distribution. Eight partial correlations were calculated (Table 2), using the before and after goodness-of-fit ratings of all participants for each grammar, testing their correlations with the frequency profile of both grammars.

Figure 4. Mean ratings for the before and after phases plotted alongside grammar frequencies for Grammar 1 (A) and Grammar 2 (B).
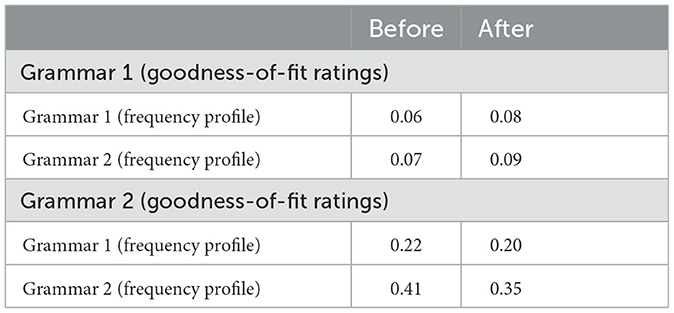
Table 2. Partial correlations calculated for each grammar before and after exposure and for each grammar's frequency profile.
To test whether there is a difference between before and after, four one-sided paired t-tests were implemented using partial correlations calculated for each participant. No t-test was significant: t(6) = 0.39, p > 0.01, d = −0.09 for Grammar 1 goodness-of-fit ratings partially correlated with the Grammar 1 frequency profile; t(6) = −0.16, p > 0.01, d = 0.07 for Grammar 1 goodness-of-fit ratings partially correlated with the Grammar 2 frequency profile; t(6) = 0.84, p > 0.01, d = −0.19 for Grammar 2 goodness-of-fit ratings partially correlated with the Grammar 1 frequency profile; and t(6) = 1.98, p > 0.01, d = −0.36 for Grammar 2 goodness-of-fit ratings partially correlated with the Grammar 2 frequency profile. Unlike with the pilot participants and previous literature, there was no significant difference in the partial correlation of goodness-of-fit ratings to a grammar's frequency profile before and after exposure. A TOST procedure was applied to each paired t-test and was not significant in each case, p > 0.01. However, the confidence intervals in each test exceeded the upper and lower equivalence bounds, indicating that the effect is neither equivalent to zero nor different from zero and thus inconclusive.
3.2. Qualitative analysis
Six observations about performing the rating task were reported by 11 participants. These were:
• They rated probe tones higher in the after phase than in the before phase (four participants);
“I seemed to rate, uh, the notes as a better fit more so the second part than the first.”—PP8
“before when I had not heard it, I was generally giving lower scores […] the second time I did it [….] my scores were a little on the higher side.”—PP11
• The range of ratings they used was larger in the after phase than in the before phase (two participants);
“your ratings were getting further and further apart over time” – interviewer paraphrasing what PP3 had shared during a break; “I was definitely going to extremes.”—PP3 in response
“I did have more of a range the second time”—PP11
• Their ratings increased over time (one participant);
“afterwards I was listening to all these strange notes and I think my rating went a little bit higher because it sounded less bad.”—PP7
“when you start recognizing, it sounds better.”—PP7
• High probe tones were rated as good and low probe tones as bad (one participant);
“the notes which had a higher note at the end I recorded as a good fit and which had a lower note, a lower pitch at the end, I recorded it as a bad fit.”—PP14
• They experienced more doubt in the after phase than in the before phase (two participants);
“I found myself doubting a little more during the second period.”—PP1
“my ideas of pitch and what matched that sequence was like a little more unclear when I listened to it the second time.”—PP6
• They experienced more certainty in the after phase than in the before phase (three participants).
“I did the task again […] I seemed a bit better able to have an opinion one way or the other.”—PP10
“the second time […] it was easier a bit, to yeah, to distinguish.”—PP12
“it seemed like it was maybe easier the second time to go […] either the note that was being played wasn't in the notes that were given.”—PP13
Two other participants simply reported using high ratings for high perceived fit and low ratings for low perceived fit.
“if they sounded right I would go higher and if they sounded wrong I would go lower.”—PP5
Three participants explicitly reported noticing a difference between the before and after tasks while three reported no difference.
“it's funny that my brain changes its mind like that and I'm able to analyse sounds that are… the same, I don't know but they must be the same and I change my mind and I find that it goes better in fact than the first time.”—PP2
“No, they were the same to me.”—PP5
Four participants reported mostly ignoring the music during the exposure phase, noticing the music faded into the background after the first few minutes.
“during the watching phase um after about five minutes I didn't really notice the sounds in the background much.”—PP1
“the music kind of disappeared when I was watching Modern Family.”—PP5
Four participants applied western structures to the music, using words like “flat,” “major,” “equal temperament” and “octave,” or listening attentively and trying to find patterns in the music.
“I found myself drifting back and forth, sometimes paying attention closely and sometimes reading [the subtitles].”—PP3
“everything I listen to I listen to as a musician […] I started sort of analyzing what the notes were and going okay yeah do, di, etc.”—PP4
“there'd be some flat notes throughout but then there'd also be some minor major notes.”—PP8
Two participants reported finding the music unpleasant, especially the timbre.
“While I was watching the show it was like really, really not pleasant.”—PP9
“the sounds themselves […] just kind of irked me I guess, like it's not a nice scale or like a minor or major.”—PP13
Finally, as mentioned in the analysis section, this study makes a number of assumptions. In one, participants understand the 7-point Likert scale and are able to map a perception of “fit” onto it. However, this assumption may not be warranted. Indeed, two participants explicitly mentioned difficulty interpreting the rating task.
“should I be comparing it to the next note in the scale or how close it is to the note – how close it is to the last note.”—PP3
“I wasn't sure really what fit meant, like, whether, what's the best fit of a note, like I don't really know that […] I always find whenever I'm grading anything on a 1 to 7 scale or 1 to 10 scale or something […] I always struggle with that sort of uh, qualitative, sort of.”—PP10
Another implied this difficulty, changing ratings seemingly for the sake of variation but not utilizing the full range of a scale while describing stimuli as “really bad” or “good” with only two points difference:
“I can't sit here and press five all the time and yeah and then okay this one is really bad I take it four, ok, four and then yeah I came back five, five, five, yeah I should change, five ohh this one was nice, six, some variation.”—PP7
3.3. Exploratory analysis
Each observation reported by participants tested, first only for the participant(s) who reported that observation and then for all participants. Additional analysis is then reported.
3.3.1. Higher ratings after vs. before
There was no difference in raw ratings between the before and after tasks for either the group of participants reporting this strategy (t(456) = −2.72, p > 0.01, d = 0.25) or for all participants (t(1,608) = −1.94, p > 0.01, d = 0.10). Both were one-tailed independent samples t-tests.
3.3.2. Increased range
This observation was true for one reporting participant. Their response range increased from three to five between before and after. For the other participant reporting this observation, the range was 6 both times, the maximum range possible. Of all participants, three others had changes in ranges, all decreasing by one point from before to after. A one-tailed paired t-test confirms a lack of difference in ranges, t(13) = 0.29, p > 0.01, d = −0.06.
3.3.3. Ratings increase over time
This observation is consistent with the connection between familiarity and liking (Hargreaves, 1984; Loui and Wessel, 2008). It is difficult to reliably test this observation here. There are only four or five iterations of each scale degree for each of the before and after task. Ratings for each scale degree were plotted over time for each participant, as well as ratings for each scale degree, averaged over participants (Figure 5A). Some increase over time can be seen. When ratings for each participant were plotted over time, averaged over scale degrees, some upward trends can be observed (Figure 5B). To test whether this pattern could be found over the course of a task, ratings for each participant were plotted over time, averaged over scale degrees. No discernable pattern was visible. A linear model with time point as a predictor of ratings found that time point was not a significant predictor of ratings, t(1,608) = 0.59, p > 0.01.
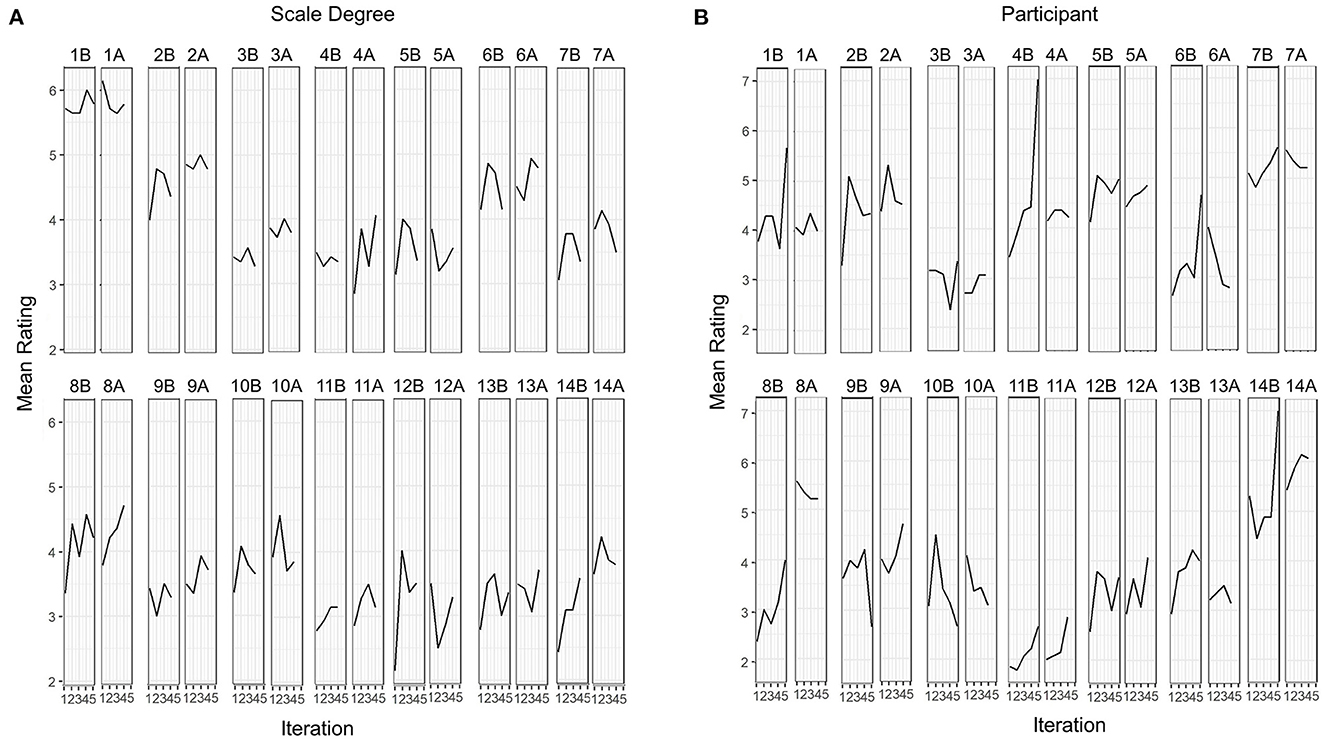
Figure 5. Mean goodness-of-fit ratings for each scale degree (A) and each participant (B) over iterations of (A) each scale degree and (B) the nth time any scale degree was presented in before (nB) and after (nA) tasks.
3.3.4. High is good; low is bad
To test this strategy, scale degrees were divided into high (>7) and low (<8). A one-sided independent sample t-test was conducted to compare ratings between high and low scale degrees. The t-test was not significant for the participant reporting the strategy, t(100) = −0.08, p > 0.01, d = 0.02. The t-test for all participants was significant, but in the opposite direction. Low scale degrees had higher ratings (M = 4.30, SD = 2.08) than higher scale degrees (M = 3.53, SD = 1.96), t(1,426) = 7.50, p < 0.01, d = −0.38. For a more fine-grained approach, a linear model with scale degree as a fixed predictor for rating was implemented. Scale degree was a significant predictor, t(1,608) = −9.82, p < 0.01. The coefficient was −0.12, indicating that ratings decreased ~0.12 points for each scale degree as it moves away from the first scale degree. In other words, ratings for the highest scale degree are ~1.68 points lower than the first scale degree.
3.3.5. Decreased certainty after vs. before
This observation cannot be directly tested as no measures of certainty were collected. However, standard deviation could be interpreted as a proxy for certainty. A high standard deviation, or low consistency, could reflect low certainty. A low standard deviation, or high consistency, could reflect high certainty. Therefore, each participant's standard deviations for each scale degree before, and after were compared using a one-sided independent sample t-test. First, the t-test was applied only to the participants who reported this observation; it was not significant, t(53) = −0.07, p > 0.01, d = 0.02. When applied to all participants, the t-test was significant but in the opposite direction, t(371) = 3.78, p < 0.01, d = −0.38. In other words, the mean standard deviation was smaller in the after phase than it was in the before phase. If standard deviation is related to certainty, this pattern aligns with the last observation reported by participants, that they felt more certain of their ratings in the after phase than in the before phase.
3.3.6. Inter-rater agreement
A two-way random effects, average rating interclass correlation coefficient testing for agreement was applied to each grammar to assess agreement between participant ratings. The test was implemented using R's psych package (Revelle, 2022). For Grammar 1, ICC = 0.44, 95% CIs [−0.15, 0.79], F(13,84) = 1.8, p < 0.01. For Grammar 2, ICC = 0.81, 95% CIs [0.61, 0.93], F(13,84) = 5.2, p < 0.01. While there was poor agreement between participants for Grammar 1, agreement for Grammar 2 was good, and significantly different from zero.
3.3.7. “Scale” vs. “non-scale” tones
It is possible that ratings increased more for “scale” tones than “non-scale” tones, given they occurred more frequently. One-sided independent t-tests were applied to compare before and after ratings for “scale” tones (tones presented in the probe tone paradigm context) and “non-scale” tones separately, for each grammar. No test was significant, p > 0.01.
4. Discussion
The goal of this study was to extend statistical learning to a more complex hierarchy mirroring the western tonal hierarchy using an artificial grammar. An artificial grammar is useful for avoiding enculturation. It also provides insight into how the brain learns a structure such as a tonal hierarchy when it has had no previous exposure to such a musical system. An artificial grammar was created based on work by Loui and Wessel (2008) and Loui et al. (2010). Participants performed goodness-of-fit ratings in a probe tone paradigm (Krumhansl and Keil, 1982) before and after 30 min of exposure to the artificial grammar during which they watched a silent film. Participants were exposed to and tested on one of two grammars. Two types of partial correlation were calculated. First, a partial correlation between goodness-of-fit ratings, and the frequency distribution of the grammar the participant was tested on. Second, a partial correlation between goodness-of-fit ratings and the frequency distribution of the grammar the participant was not tested on. In both cases, the frequency distribution of the probe tone context was partialled out. Contrary to our hypothesis, there was no increase in partial correlations after exposure when compared to before. This is true for both grammars. However, the null effect was not confirmed by a two-one-sided t-test procedure, suggesting that the study was under-powered. This is unexpected given the a priori power analysis based on pilot data. The simplest explanation for this discrepancy may be that the pilot data was unusual in some way and was not representative of a population. Pilot participants did not watch a silent film but instead could pass time on their phone, as long as this did not include any sound. This was not expected to make any difference to learning but may have resulted in differing levels of engagement, where higher levels of engagement with personal media may have transferred to learning. This can only be resolved with further study comparing types of tasks undertaken while passively listening and larger participant sample sizes overall. Given the ambiguity of the statistical results, no certain conclusions can be drawn from the quantitative analysis of this study.
That being said, if the effect was null, it could be explained by the proportion of smaller to larger intervals than is typical of western tonal music, where in western tonal music there is “virtually an exponential decrease of proportional occurrence in melodies of intervals larger than five to six semitones” (Vos and Troost, 1989, p. 383). In both grammars created here, smaller intervals occur more often than larger intervals, but the relationship between frequency and intervals size is more akin to a decreasing linear function than an exponential function. To paraphrase Loui (2012), music can be characterized by conditional probabilities (the artificial grammar), melodic interval sizes and Gestalt psychology, or the coherent percept of auditory objects. Indeed, previous work has demonstrated that violating melodic interval rules such as Narmour's (1990) melodic principles or the gap-fill model (Krumhansl, 1995) impedes the learning of an artificial grammar (Loui, 2012; Rohrmeier and Cross, 2013). Given such a context, the present study may be probing at the limits of statistical learning's capacity to explain the implicit learning of a musical system.
While our hypothesis was neither confirmed nor supported, it is interesting that participant ratings correlated more strongly with frequency distribution of the grammar in Grammar 2, r = 0.41, r = 0.35 for before and after, respectively, compared to Grammar 1, r = 0.06 and 0.08 for before and after, respectively. Goodness-of-fit ratings for Grammar 2 even correlated more strongly with Grammar 1, r = 0.22 and r = 0.20 for before and after, respectively, than goodness-of-fit ratings for Grammar 1 correlated with Grammar 1, r = 0.06 and r = 0.08 for before and after, respectively. Inter-rater agreement is also higher for Grammar 2. This is especially intriguing since the correlation between goodness-of-fit ratings and frequency profile for Grammar 2 is high even before exposure to the grammar, and having accounted for the scale context. Furthermore, Grammar 2 contains more larger intervals than Grammar 1, where smaller intervals are preferred (Loui, 2012; Rohrmeier and Cross, 2013).
Other potential explanations for null findings could be that ratings reflect some kind of prior entrenched learning, or innate psychoacoustic preferences. For example, in Grammar 1, scale degree 8 (see Figure 4) was consistently rated poorly even though it was common in the grammar. This could be because the interval between scale degrees 1 and 8 falls between a minor and a major seventh, so could have been perceived as a mistuned note, regardless of its regularity in the grammar. This might suggest that listeners have innate psychoacoustic preferences for certain intervals over other. However, this was not true of Grammar 2, where the same scale degree is rated in line with its occurrence in the grammar; another explanation must be sought. It is possible that some unmeasured participant trait may explain these differences. For example, musical training history was not collected as it was originally considered irrelevant, given no participants had been exposed to this musical grammar before. However, musicians have more entrenched expectations about the tonal hierarchy (Hansen and Pearce, 2014) than non-musicians, which could have impeded their learning of a new musical system. Clearly, more work is needed to better understand the mechanisms at play during the implicit learning of a musical grammar, and to further probe the limits of existing explanations.
4.1. Qualitative results, issues and assumptions
In addition to goodness-of-fit ratings, we conducted short interviews with participants. This interview was focused on three primary topics. First, participants were asked about strategies they may have used to complete the goodness-of-fit rating task. Second, they were asked whether they noticed any differences between the before and after tasks. Third, they were asked whether they had any other observations to share. None of these questions evaluate the implicit nature of learning in exposure-based training; rather, they target the study task itself. Six strategies and observations were pulled from these interviews. We subsequently statistically tested each strategy and observation. Most strategies and observations were not borne out in the data. This suggests that participants generally have poor insight into their performance and/or strategies used in the rating task. We do not consider this an explanation for our null results, but rather an interesting additional finding worth discussing. Lack of insight into performance is in line with literature examining metacognition of performance (e.g., Dunlosky and Thiede, 2013; Hadwin and Webster, 2013), especially the Dunning-Kruger effect (Kruger and Dunning, 1999; Dunning, 2011). The Dunning-Kruger effect summarizes the observation that participants with low performance overestimate their performance on a task. In contrast, participants with high performance underestimate their performance. The Dunning-Kruger effect was originally interpreted as poor metacognition – those who are unskilled are unaware of their lack of skill (Kruger and Dunning, 1999). It has also been interpreted as regression to the mean (Krueger and Mueller, 2002). Most recently, it was interpreted as a rational Bayesian inference (Jansen et al., 2021). In this explanation, participants lack enough information to override their prior expectations of doing well. However, our study does not specifically ask participants to evaluate their performance, but rather to describe how they performed the task. The metacognition literature on strategy surveyed was focused on learning and problem-solving (e.g., Black, 2004; Yayli, 2010; Geurten and Lemaire, 2019; Vermunt, 2020). Some of this work suggests that participants are aware of strategies, able to voice them and can adapt their strategies to improve task performance (Li and Munby, 1996; Maia and McClelland, 2004; Finley and Benjamin, 2012). However, these were learning tasks where there were correct answers and participants could improve their scores or performance. This is not the case for our study. We did not find literature on retrospective reporting of strategy for using a Likert scale, or performing an auditory task.
There is existing critique of the Likert scale (e.g,. Busch, 1993; Gu, 1995). Specifically, that individuals have different frames of reference, and therefore will interpret the numbers on the scale differently. Furthermore, cultural differences have been identified (Zax and Takahashi, 1967). For example, the cultural value of modesty in Asian respondents is reflected in a tendency toward mid-scale responses. The cultural value of sincerity in Mediterranean respondents is reflected in a tendency toward scale extremes. Indeed, some of our participants stated that they were unsure how to use the scale. There may be cultural differences among our sample. However, their recruitment from a university campus and community in a Canadian provincial capital suggests they could be labeled as WEIRD. The WEIRDness of our sample was expected as part of experimental design. Therefore, individual differences are more likely to explain variation in uses and interpretations of the Likert scale. Unfortunately, the source of this variation is difficult to qualify and we therefore assume, as in most uses of a Likert scale in music science, that ratings can be meaningfully averaged across participants. This issue and assumption demonstrate that data is not simply information that is “out there” to collect, but is constructed by the choices made in experimental design (Ellingson and Sotirin, 2020).
4.2. Quantitative results derived from qualitative interviews
Three significant patterns were uncovered based on participant strategies. First, and least robust, we found that participants' ratings increased over time. This is in line with previous literature reporting liking with exposure (e.g., Hargreaves, 1984). This pattern is the least robust because of the small number of iterations of each scale degree over time. The pattern indicates that ratings increased with each additional iteration of a probe tone, regardless of the probe tone. Ratings were also tested for increase over a whole task (before or after) and no effect of exposure was found. Second, we found that rating standard deviations for each scale degree are lower after exposure than before. We used standard deviation as a proxy for certainty. Some participants reported more certainty after compared to before. Other participants reported less certainty after compared to before. If we assume that more certainty leads to less variation around ratings for a particular scale degree, standard deviation is an appropriate proxy for certainty. However, future research should explicitly measure certainty to better verify these participants' experiences. It is also interesting that an equal number of participants reported opposite trends in certainty. Further research could also investigate these individual differences.
Finally, the most robust finding uncovered in exploratory analysis was that ratings were higher for probe tones closest to the first scale degree and lower for probe tones furthest away. This pattern was supported by a linear model confirming that an increase in scale degree corresponds to a decrease in rating. In other words, ratings were driven by the probe tone's distance from the first scale degree, where smaller distances from the first scale degree were perceived as a better fit. It is possible that early in exposure, participants relied on a simple “distance from last note” cue. Since our grammar was more complex than the grammar used in previous studies (e.g., Loui et al., 2010), reflection of a hierarchy in ratings may require longer exposure times. This is consistent with the relationship previously observed between magnitude of brain responses and scale degrees in a western scale (tonal hierarchy) probe tone paradigm (Quiroga-Martinez et al., 2020; Sankaran et al., 2020; Sauvé et al., 2021). Early (0–200 ms) neural responses correlate with pitch height, or distance from the tonic. Late neural responses (200–1,000 ms) correlate with the tonal hierarchy. The other primary difference between this study and Loui's (2010) study was the context: in this study, a scale, in Loui et al. (2010), a melody. This may have encouraged listeners to rate probe tones in relation to the tonic rather than overall tonality.
To continue to track the emergence of a tonal hierarchy in a complex artificial grammar, future research should use longer exposure times and larger participant samples. It would also be interesting to record EEG throughout probe tone paradigms and exposure phases. This would allow the tracking of early and late responses to each scale degree over time. Overall, this study suggests that learning complex grammars requires more than 30 min of exposure and may involve mechanisms other than the tracking of conditional probabilities, that participants tend to have poor insight into their strategies, and offers several potential avenues for future research.
Data availability statement
The datasets presented in this study can be found in online repositories. The names of the repository/repositories and accession number(s) can be found at: https://osf.io/pwnhg/.
Ethics statement
The studies involving human participants were reviewed and approved by Interdisciplinary Committee on Ethics in Human Research at Memorial University of Newfoundland and Labrador (20220415-ME). The patients/participants provided their written informed consent to participate in this study.
Author contributions
SS: conceptualization, data curation, formal analysis, investigation, methodology, project administration, visualization, writing—original draft, and writing—reviewing and editing. PS: software and writing—review and editing. BZ: funding acquisition, resources, supervision, and writing—review and editing. All authors contributed to the article and approved the submitted version.
Funding
The author(s) disclosed receipt of the following financial support for the research, authorship, and/or publication of this article: this work was supported by BZ's Natural Sciences and Engineering Research Council of Canada grant.
Acknowledgments
We acknowledge the land on which we live and work as the stolen and unceded ancestral homelands of the Beothuk, the island of Newfoundland as part of the traditional territories of the Mi'kmaq and Labrador as the traditional territories of the Inuk of Nunatsiavut and NunatuKavut and the Innu of Nitassinan. We are thankful to live and work here as settlers (SS and BZ) and visitors (PS).
Conflict of interest
The authors declare that the research was conducted in the absence of any commercial or financial relationships that could be construed as a potential conflict of interest.
Publisher's note
All claims expressed in this article are solely those of the authors and do not necessarily represent those of their affiliated organizations, or those of the publisher, the editors and the reviewers. Any product that may be evaluated in this article, or claim that may be made by its manufacturer, is not guaranteed or endorsed by the publisher.
References
Altmann, G., Dienes, Z., Goode, A. (1995). Modality independence of implicitly learned grammatical knowledge. J. Exp. Psychol. Learn. Mem. Cogn. 21, 899. doi: 10.1037/0278-7393.21.4.899
Aslin, R. N., Saffran, J. R., Newport, E. L. (1999). “Statistical learning in linguistic and nonlinguistic domains,” in The Emergence of Language, eds B. MacWhinney (Mahwah, NJ: Lawrence Erlbaum Associates Publishers), 359–380.
Bernard, H. R. (2006). Methods in Anthropology: Qualitative and Quantitative Approaches. Oxford: AltaMira Press.
Black, W. L. (2004). Assessing the metacognitive dimensions of retrospective miscue analysis through discourse analysis. Read. Horiz. 45, 1.
Broesch, T., Crittenden, A. N., Beheim, B. A., Blackwell, A. D., Bunce, J. A., Colleran, H., et al. (2020). Navigating cross-cultural research: methodological and ethical considerations. Proc. R. Soc. B. 287, 20201245. doi: 10.1098/rspb.2020.1245
Busch, M. (1993). Using Likert scales in L2 research. A researcher comments. TESOL Q. 27, 733–736. doi: 10.2307/3587408
Dunlosky, J., Thiede, K. W. (2013). Four cornerstones of calibration research: why understanding students' judgments can improve their achievement. Learn. Instr. 24, 58–61. doi: 10.1016/j.learninstruc.2012.05.002
Dunning, D. (2011). “The Dunning–Kruger effect: on being ignorant of one's own ignorance,” in Advances in Experimental Social Psychology, eds J. M. Olson, and M. P. Zanna (Cambridge, MA: Academic Press) 247–296. doi: 10.1016/B978-0-12-385522-0.00005-6
Ellingson, L. L., Sotirin, P. (2020). “Doing data engagement,” in Making Data in Qualitative Research, eds L. L. Ellingson, and P. Sotirin (London: Routledge). doi: 10.4324/9780429058240
Finley, J. R., Benjamin, A. S. (2012). Adaptive and qualitative changes in encoding strategy with experience: evidence from the test-expectancy paradigm. J. Exp. Psychol. Learn. Mem. Cogn. 38, 632–652. doi: 10.1037/a0026215
Geurten, M., Lemaire, P. (2019). Metacognition for strategy selection during arithmetic problem-solving in young and older adults. Aging Neuropsychol. Cogn. 26, 424–446. doi: 10.1080/13825585.2018.1464114
Gu, Y. (1995). How often is often? Reference ambiguities of the Likert-scale in language learning strategy research. Occas. Pap. Engl. Lang. Teach. 5, 19–35.
Guillemin, C., Tillmann, B. (2021). Implicit learning of two artificial grammars. Cogn. Process. 22, 141–150. doi: 10.1007/s10339-020-00996-2
Hadwin, A. F., Webster, E. A. (2013). Calibration in goal setting: examining the nature of judgments of confidence. Learn. Instr. 24, 37–47. doi: 10.1016/j.learninstruc.2012.10.001
Hansen, N. C., Pearce, M. T. (2014). Predictive uncertainty in auditory sequence processing. Front. Psychol. 5, 52. doi: 10.3389/fpsyg.2014.01052
Hargreaves, D. J. (1984). The effects of repetition on liking for music. J. Res. Music Educ. 32, 35–47. doi: 10.2307/3345279
Henrich, J., Heine, S. J., Norenzayan, A. (2010). The weirdest people in the world? Behav. Brain Sci. 33, 61–83. doi: 10.1017/S0140525X0999152X
Hesse-Biber, S. (2012). Feminist approaches to triangulation: uncovering subjugated knowledge and fostering social change in mixed methods research. J. Mix. Methods Res. 6, 137–146. doi: 10.1177/1558689812437184
Jansen, R. A., Rafferty, A. N., Griffiths, T. L. (2021). A rational model of the Dunning–Kruger effect supports insensitivity to evidence in low performers. Nat. Hum. Behav. 5, 756–763. doi: 10.1038/s41562-021-01057-0
Koelsch, S., Grossmann, T., Gunter, T. C., Hahne, A., Schröger, E., Friederici, A. D., et al. (2003). Children processing music: electric brain responses reveal musical competence and gender differences. J. Cogn. Neurosci. 15, 683–693. doi: 10.1162/jocn.2003.15.5.683
Koelsch, S., Gunter, T. C., Schröger, E., Tervaniemi, M., Sammler, D., Friederici, A. D., et al. (2001). Differentiating ERAN and MMN: an ERP study. Neuroreport 12, 1385–1389. doi: 10.1097/00001756-200105250-00019
Krueger, J., Mueller, R. A. (2002). Unskilled, unaware, or both? The better-than-average heuristic and statistical regression predict errors in estimates of own performance. J. Pers. Soc. Psychol. 82, 180. doi: 10.1037/0022-3514.82.2.180
Kruger, J., Dunning, D. (1999). Unskilled and unaware of it: how difficulties in recognizing one's own incompetence lead to inflated self-assessments. J. Pers. Soc. Psychol. 77, 1121. doi: 10.1037/0022-3514.77.6.1121
Krumhansl, C., Cuddy, L. (2010). “A theory of tonal hierarchies in music,” in Music Perception, eds M. R. Jones, R. R. Fay, and A. N. Popper (New York, NY: Springer)51–87. doi: 10.1007/978-1-4419-6114-3_3
Krumhansl, C. L. (1990). Cognitive Foundations of Musical Pitch. Oxford: Oxford University Press. Available online at: https://books.google.co.uk/books?hl=en&lr=&id=J4dJCAAAQBAJ&oi=fnd&pg=PT11&dq=krumhansl+cognitive+foundations&ots=PF47VC1-Cj&sig=DjBgMy-284NnR8pLJ3cb6AHMuZI
Krumhansl, C. L. (1995). Music psychology and music theory: problems and prospects. Music Theory Spectr. 17, 53–80. doi: 10.2307/745764
Krumhansl, C. L., Keil, F. C. (1982). Acquisition of the hierarchy of tonal functions in music. Mem. Cognit. 10, 243–251. doi: 10.3758/BF03197636
Krumhansl, C. L., Kessler, E. J. (1982). Tracing the dynamic changes in perceived tonal organization in a spatial representation of musical keys. Psychol. Rev. 89, 334. doi: 10.1037/0033-295X.89.4.334
Krumhansl, C. L., Sandell, G. J., Sergeant, D. C. (1987). The perception of tone hierarchies and mirror forms in twelve-tone serial music. Music Percept. 5, 31–78. doi: 10.2307/40285385
Krumhansl, C. L., Shepard, R. N. (1979). Quantification of the hierarchy of tonal functions within a diatonic context. J. Exp. Psychol. 5, 579. doi: 10.1037/0096-1523.5.4.579
Lakens, D. (2017). Equivalence tests: a practical primer for t tests, correlations, and meta-analyses. Soc. Psychol. Personal. Sci. 8, 355–362. doi: 10.1177/1948550617697177
Leckenby, D., Hesse-Biber, S. N. (2007). Feminist approaches to mixed-methods research. Femin. Res. Pract. 249–291. doi: 10.4135/9781412984270.n9
Li, S., Munby, H. (1996). Metacognitive strategies in second language academic reading: a qualitative investigation. English Specif. Purp. 15, 199–216. doi: 10.1016/0889-4906(96)00004-X
Loui, P. (2012). Learning and liking of melody and harmony: further studies in artificial grammar learning. Top. Cogn. Sci. 4, 554–567. doi: 10.1111/j.1756-8765.2012.01208.x
Loui, P., Wessel, D. (2008). Learning and liking an artificial musical system: effects of set size and repeated exposure. Music Sci. 12, 207. doi: 10.1177/102986490801200202
Loui, P., Wessel, D. L., Kam, C. L. H. (2010). Humans rapidly learn grammatical structure in a new musical scale. Music Percept. 27, 377–388. doi: 10.1525/mp.2010.27.5.377
Loui, P., Wu, E. H., Wessel, D. L., Knight, R. T. (2009). A generalized mechanism for perception of pitch patterns. J. Neurosci. 29, 454–459. doi: 10.1523/JNEUROSCI.4503-08.2009
Maia, T. V., McClelland, J. L. (2004). A reexamination of the evidence for the somatic marker hypothesis: what participants really know in the Iowa gambling task. Proc. Nat. Acad. Sci. 101, 16075–16080. doi: 10.1073/pnas.0406666101
Mathews, M. V., Pierce, J. R., Reeves, A., Roberts, L. A. (1988). Theoretical and experimental explorations of the Bohlen–Pierce scale. J. Acoust. Soc. Am. 84, 1214–1222. doi: 10.1121/1.396622
Mathews, M. V., Roberts, L. A., Pierce, J. R. (1984). Four new scales based on nonsuccessive-integer-ratio chords. J. Acoust. Soc. Am. 75, S10. doi: 10.1121/1.2021272
Narmour, E. (1990). The Analysis and Cognition of Basic Melodic Structures: The Implication-Realization Model. Chicago, IL: University of Chicago Press.
Perkins, R., Williamon, A. (2014). Learning to make music in older adulthood: a mixed-methods exploration of impacts on wellbeing. Psychol. Music 42, 550–567. doi: 10.1177/0305735613483668
Prince, J. B., Stevens, C. J., Jones, M. R., Tillmann, B. (2018). Learning of pitch and time structures in an artificial grammar setting. J. Exp. Psychol. Learn. Memory Cognit. 44, 1201. doi: 10.1037/xlm0000502
Quiroga-Martinez, D. R., Hansen, N. C., Højlund, A., Pearce, M., Brattico, E., Vuust, P., et al. (2020). Decomposing neural responses to melodic surprise in musicians and non-musicians: evidence for a hierarchy of predictions in the auditory system. Neuroimage 215, 116816. doi: 10.1016/j.neuroimage.2020.116816
Revelle, W. (2022). psych: Procedures for Psychological, Psychometric, and Personality Research. Available online at: https://CRAN.R-project.org/package=psych
Rohrmeier, M., Cross, I. (2013). Artificial grammar learning of melody is constrained by melodic inconsistency: Narmour's principles affect melodic learning. PLoS ONE8, e66174. doi: 10.1371/journal.pone.0066174
Saffran, J. R., Johnson, E. K., Aslin, R. N., Newport, E. L. (1999). Statistical learning of tone sequences by human infants and adults. Cognition 70, 27–52. doi: 10.1016/S0010-0277(98)00075-4
Sankaran, N., Carlson, T. A., Thompson, W. F. (2020). The rapid emergence of musical pitch structure in human cortex. J. Neurosci. 40, 2108–2118. doi: 10.1523/JNEUROSCI.1399-19.2020
Sankaran, N., Thompson, W. F., Carlile, S., Carlson, T. A. (2018). Decoding the dynamic representation of musical pitch from human brain activity. Sci. Rep. 8, 839. doi: 10.1038/s41598-018-19222-3
Sauvé, S. A., Cho, A., Zendel, B. R. (2021). Mapping tonal hierarchy in the brain. Neuroscience 465, 187–202. doi: 10.1016/j.neuroscience.2021.03.019
Schellenberg, E. G., Bigand, E., Poulin-Charronnat, B., Garnier, C., Stevens, C. (2005). Children's implicit knowledge of harmony in Western music. Dev. Sci. 8, 551–566. doi: 10.1111/j.1467-7687.2005.00447.x
Sueur, J., Aubin, T., Simonis, C. (2008). Seewave, a free modular tool for sound analysis and synthesis. Bioacoustics 18, 213–226. doi: 10.1080/09524622.2008.9753600
Tillmann, B., Bharucha, J. J., Bigand, E. (2000). Implicit learning of tonality: a self-organizing approach. Psychol. Rev. 107, 885. doi: 10.1037/0033-295X.107.4.885
Tillmann, B., Poulin-Charronnat, B. (2010). Auditory expectations for newly acquired structures. Q. J. Exp. Psychol. 63, 1646–1664. doi: 10.1080/17470210903511228
Trainor, L. J., Trehub, S. E. (1992). A comparison of infants' and adults' sensitivity to Western musical structure. J. Exp. Psychol. 18, 394–402. doi: 10.1037/0096-1523.18.2.394
Trainor, L. J., Trehub, S. E. (1994). Key membership and implied harmony in Western tonal music: developmental perspectives. Percept. Psychophys. 56, 125–132. doi: 10.3758/BF03213891
Vermunt, J. D. (2020). “Surveys and retrospective self-reports to measure strategies and strategic processing,” in Handbook of Strategies and Strategic Processing, eds D. L. Dinsmore, L. K. Fryer, and M. M. Parkinson (New York, NY: Routledge), 259–274. doi: 10.4324/9780429423635-16
Vos, P. G., Troost, J. M. (1989). Ascending and descending melodic intervals: statistical findings and their perceptual relevance. Music Percept. 6, 383–396. doi: 10.2307/40285439
Yayli, D. (2010). A think-aloud study: cognitive and metacognitive reading strategies of ELT department students. Eurasian J. Educ. Res. 38, 234–251.
Keywords: tonality, learning, expectancy, meta-cognition, mixed methods
Citation: Sauvé SA, Satkunarajah P and Zendel BR (2023) Tracking the emergence of a pitch hierarchy using an artificial grammar requires extended exposure. Front. Cognit. 2:1027259. doi: 10.3389/fcogn.2023.1027259
Received: 24 August 2022; Accepted: 08 February 2023;
Published: 02 March 2023.
Edited by:
Barbara Dosher, University of California, Irvine, United StatesReviewed by:
Kaustuv Kanti Ganguli, New York University Abu Dhabi, United Arab EmiratesPaolo Ammirante, Ryerson University, Canada
Copyright © 2023 Sauvé, Satkunarajah and Zendel. This is an open-access article distributed under the terms of the Creative Commons Attribution License (CC BY). The use, distribution or reproduction in other forums is permitted, provided the original author(s) and the copyright owner(s) are credited and that the original publication in this journal is cited, in accordance with accepted academic practice. No use, distribution or reproduction is permitted which does not comply with these terms.
*Correspondence: Sarah A. Sauvé, ssauve@lincoln.ac.uk