- 1Department of Public Administration and Development Management, College of Business and Economics, Wallaga University, Nekemte, Ethiopia
- 2Department of Development Management, College of Finance, Management and Development, Ethiopia Civil Service University, Addis Ababa, Ethiopia
This study looks at how Ethiopia’s East Wallaga Zone’s staple crop yields are affected by climate variability between 1990 and 2022. The main goal is to evaluate the effects of temperature and precipitation variations on the production of important crops, namely wheat and teff, in the highlands, midlands, and lowlands of various agroecological zones.The Ethiopian Meteorological Institute, CHIRPS, and TerraClimate were the sources of the climate data used to provide a thorough picture of the trends in temperature and precipitation during the study period. Significant spatiotemporal changes in the research area’s climate patterns were found through data analysis. To measure these fluctuations, important metrics like precipitation concentration, rainfall anomaly indices, and coefficients of variation were computed. Crop yield data from the Zonal Agricultural Office was also used in the study. A regression model was used to examine the association between climatic conditions and crop yields. With a response rate of 95% and a sample size that contained information from each of the three agroecological zones, strong statistical analysis was guaranteed.An 8.2% coefficient of variation in precipitation is one of the significant findings, indicating subtle but important changes in rainfall patterns, namely in the quantity and timing of wet days. Furthermore, a discernible rise in both minimum and maximum temperatures has occurred, particularly in lowland regions, and this has had an additional impact on crop yield.The research comes to the conclusion that although meteorological conditions have a major influence on crop yields, non-climatic factors including soil fertility, agronomic techniques, and technology improvements also have a major impact. The study suggests a three-pronged strategy to reduce the negative effects of climate change on agriculture: raising fertilizer use, strengthening agronomic practices, and increasing soil fertility. The report also emphasizes how important it is to combine measures for adapting to climate change with initiatives to resolve political unrest and advance sustainable agricultural methods.It is recommended that policymakers give equal weight to measures aimed at mitigating and adapting to climate change in order to enhance agricultural productivity and guarantee food security in the area. In East Wallaga Zone and elsewhere, this strategy is crucial for improving lives and feeding the constantly expanding population.
Introduction
The warming of our planet caused by the release of greenhouse gases (GHGs) is an undeniable reality of modern life. The average global temperature has risen by 1.1°C since the pre-industrial era, largely due to the significant increase in atmospheric CO2 concentration over the past century. Smallholder subsistence farmers are among the groups most severely affected by this climate change (IPCC, 2022a,b; Baffour-ata et al., 2021). They face considerable challenges due to their limited capacity to adapt and their reliance on rain-fed agriculture, which is highly vulnerable to climate change (Bai et al., 2022; IMF, 2022).
Estimates for the African continent indicate that a majority of Sub-Saharan Africa (SSA) is expected to experience reduced precipitation levels and increased variability in rainfall, according to the International Monetary Fund (IMF, 2022). The Intergovernmental Panel on Climate Change (IPCC, 2022a,b) highlights that this region will be particularly adversely affected by climate change, with higher temperatures and less reliable rainfall patterns. Africa’s limited adaptive capacity, combined with the high sensitivity of its socioeconomic systems, amplifies its vulnerability to the impacts of climate change (IPCC, 2022a,b). Projections suggest that the Sahara region could be one of the most vulnerable areas by 2,100, with potential agricultural losses amounting to up to 7% of GDP (Maino and Emrullahu, 2022; UN, 2022). The consequences of climate change are expected to be most severe for those living in fragile and conflict-affected areas of Sub-Saharan Africa (Maino and Emrullahu, 2022).
According to the research findings of Kalele et al. (2021), the adverse impacts of climate change will disproportionately affect smallholder farmers in developing countries. These farmers are particularly vulnerable due to their heavy reliance on natural systems for sustenance, as emphasized by Maino and Emrullahu (2022). In Ethiopia, the existing climate unpredictability poses significant barriers to poverty reduction and sustainable development efforts (Esayas et al., 2019). Ethiopia stands out as one of the countries most susceptible to the negative consequences of climate change, primarily due to its dependence on rain-fed agriculture, limited adaptive capacity, and heavy reliance on natural resources for survival (Asfaw et al., 2019; Simane et al., 2016).
The ongoing changes in global climate present persistent challenges with far-reaching impacts on various aspects of society. One such region that has experienced significant climate fluctuations is the East Wallaga Zone, as noted by Gemechu and Woldetsadik Abshire (2021). This study investigates the intricate patterns of climate variability within this zone, exploring how these trends have notably influenced household assets, particularly in terms of crop production and animal rearing (Hua et al., 2017). Understanding the link between climate shifts and household assets provides valuable insights into the difficulties faced by communities in East Wallaga and the strategies they employ to adapt to this changing environment. This investigation highlights the complex interplay between climate and livelihoods farming households, emphasizing the need for proactive measures to address these dynamic challenges.
The East Wallaga Zone, located in the western part of Ethiopia, is characterized by its rich cultural heritage, diverse ecosystems, and predominantly agricultural economy, as highlighted by Dereje (2023). However, like many regions worldwide, it also grapples with the challenges presented by climate variability and change, as noted by Gemechu and Woldetsadik Abshire (2021). In this context, climate variability refers to the fluctuations in weather patterns and climate conditions over time, including irregular rainfall, temperature extremes, and unpredictable weather events, as outlined by Toma et al. (2022). In recent years, East Wallaga has experienced noticeable and impactful shifts in its climate patterns, as observed from studies conducted on the issue (Gemeda et al., 2023; Gemeda et al., 2021). These changes extend beyond meteorological concerns and significantly affect the lives and livelihoods of the communities in the area.
Of particular concern is the impact of climate variability on household assets, especially in terms of cereal production, as highlighted by Bekuma Abdisa et al. (2022). In East Wallaga, household assets encompass a wide range of resources, including land, livestock, crops, and other tangible assets, as well as intangible assets such as social networks and access to education and healthcare, as discussed by Beltrán-Tolosa et al. (2022) and Toma et al. (2022). These assets form the foundation of livelihoods for many households, playing a crucial role in determining their economic well-being and resilience to shocks, as emphasized (Ellis, 2000; Ellis, 1998; Ellis and Freeman, 2004).
It’s essential to acknowledge the critical importance of grasping the intricate connection between climate variability and the foundational assets of households (Focardi and Fabozzi, 2020). This understanding serves as a fundamental basis for developing strategies and policies to mitigate the adverse impacts of climate change on vulnerable communities. Additionally, it empowers households to take adaptive measures that enhance their resilience in the face of a changing climate (IPCC, 2007). This article aims to delve into the heart of investigating climate variability patterns within the East Wallaga Zone. Specifically, it seeks to shed light on how these patterns affect households, impacting their asset bases and overall well-being, as mentioned by FAO (2016a). By doing so, it contributes valuable knowledge to ongoing efforts focused on promoting sustainable development and resilience in a region where the unpredictable nature of the climate significantly influences daily life (FAO, 2016b) of rural farming households/subsistence farmers.
The study addresses the issue of understanding climate variability trends in the East Wallaga Zone and subsequently examines how these trends affect household asset bases, particularly in terms of crop productivity. It seeks to answer several key questions: What notable patterns and trends in climate variability have emerged in the East Wallaga Zone in recent years? How do these climate variability trends impact crop productivity in the region? Are there discernible correlations between specific climate variables (such as rainfall patterns and temperature fluctuations) and changes in household food crop production? What coping mechanisms and adaptation strategies have households adopted in response to these climate-related challenges?
By addressing these questions, our study aims to provide a comprehensive understanding of the complex relationship between climate variability and household asset dynamics in the East Wallaga Zone. Ultimately, this research will contribute to informed policy decisions and community resilience efforts.
Materials and methods
Description of the study area
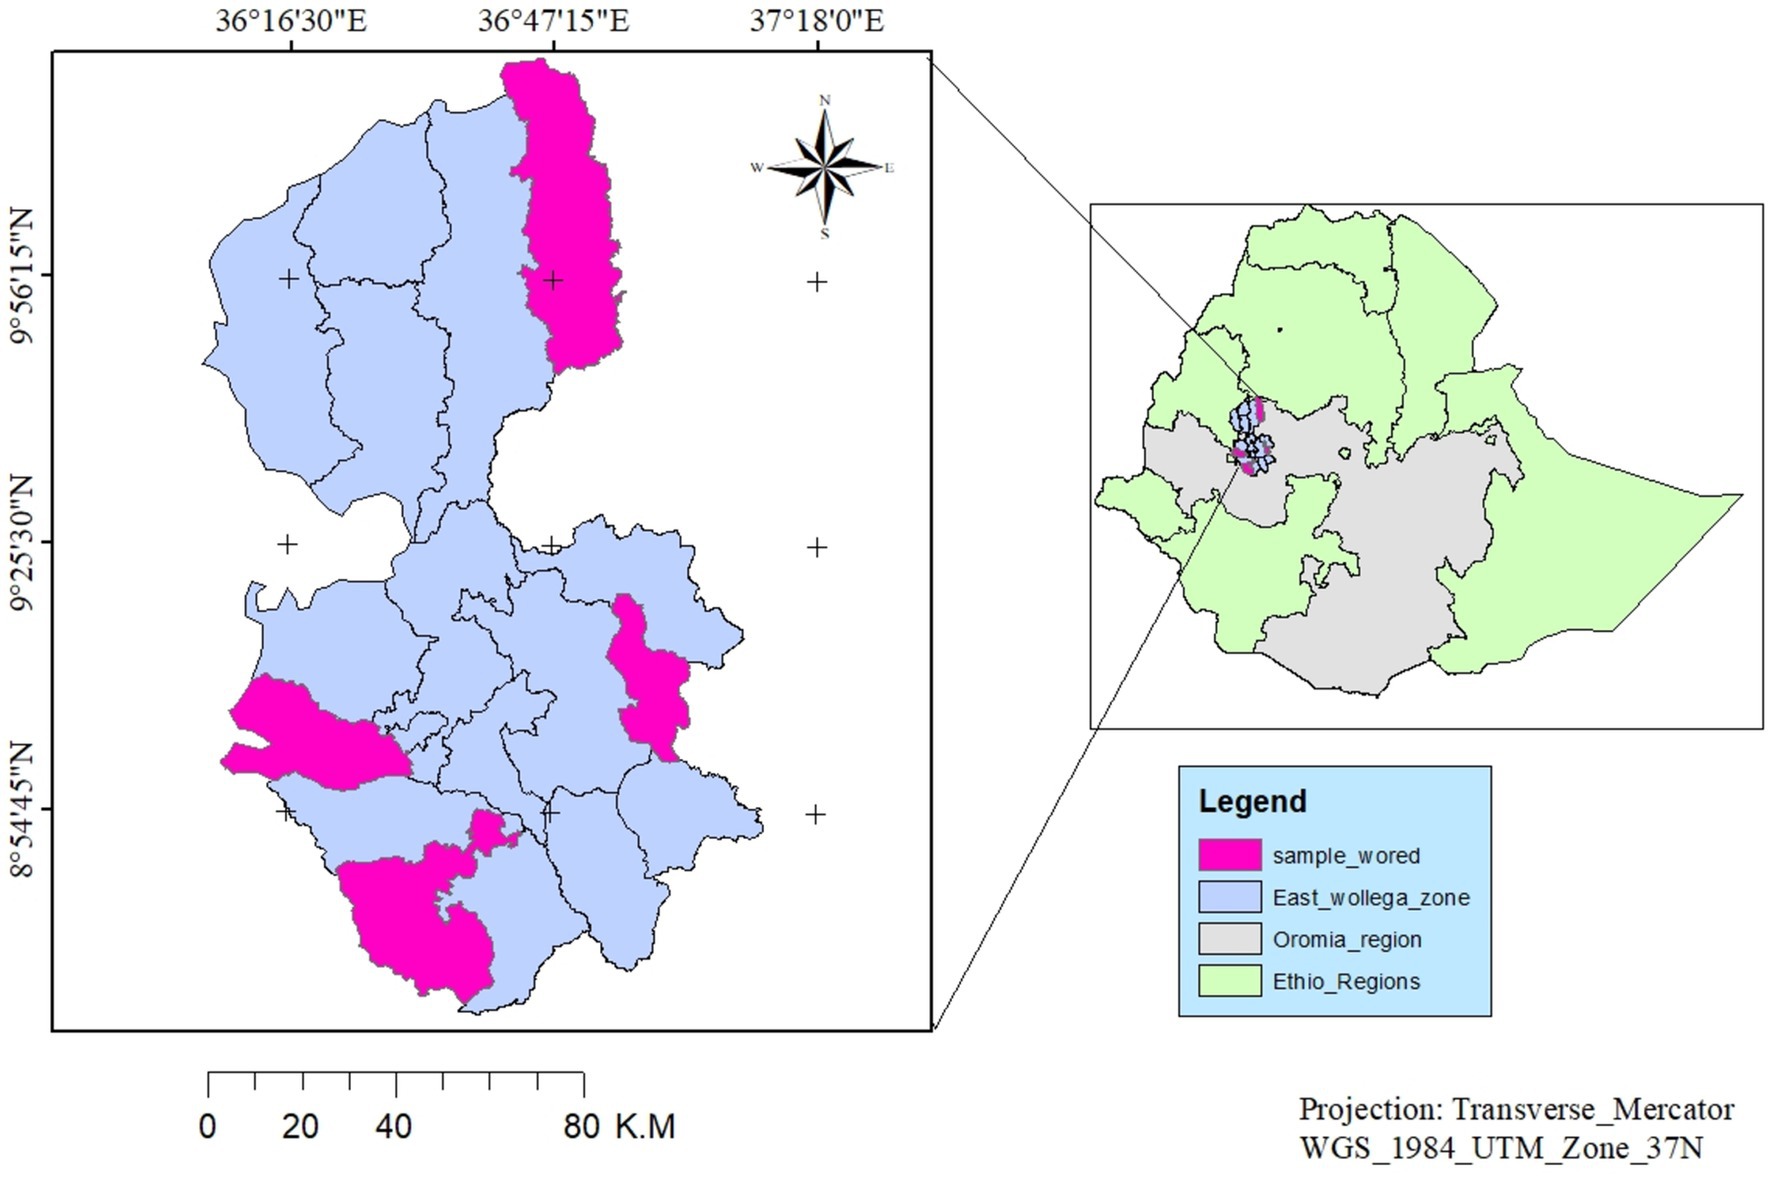
The research was carried out in the East Wollega Zone, situated within the Oromia National Regional State in Western Ethiopia. This zone is one of the 17 administrative Zones in the Oromia National Regional State and comprises 289 rural peasant associations. Positioned approximately 328 kilometers west of Addis Ababa, the capital city of Ethiopia, the East Wollega Zone covers a land area of about 14,102.5 square kilometers, constituting roughly 3.88% of the total area of the Oromia National Regional State, as detailed by Bekuma Abdisa et al. (2022).
Geographically, the East Wollega Zone spans from Northing 8°31′20″N to 10°22′30″N and Easting 36°06′00″E to 37°12′00″E. It shares its borders with the Amhara National Regional State to the North, Jimma Zone to the South, Horo Guduru Wollega and West Shewa Zone to the East, Benishangul Gumuz National Regional State to the North–West, West Wollega Zone to the West, and Buno Bedelle Zone to the South West.
The topography of the studied zone exhibits variations in altitude, ranging from 718 to 3,163 meters above sea level. Predominantly characterized by a low plateau, the area also features isolated mountain ranges, particularly notable in the Jima Arjo district. The climate classification within the zone encompasses three primary types: highland (20.50%), midland (50.90%), and lowland (28.60%). Annual rainfall spans from 1,450 to 2,150 mm, with daily temperatures fluctuating between 15 and 27°C. The peak of rainfall typically occurs during the months from June to September, with the climate exhibiting a pattern of long summer rainfall, short rainy seasons in March to April, and winter dry seasons from December to February (Teka et al., 2022). Notably, the primary rainy season aligns with the typical pattern observed in many highland areas of Ethiopia. According to Dereje and Eshetu (2011), the classification of the agroecology is as 500-1500 m asl is lowland (gammoojjii), 1,500–2,300 m as midland (badda daree) and 2,300–3,200 masl as highland (baddaa) agroecology.
This study concentrates on western Ethiopia, characterized by a unimodal rainfall pattern, presenting challenges for farmers in achieving adequate crop yields to meet both regional and national consumption demands (Gemeda et al., 2021; Arragaw et al., 2020; Teka et al., 2022) The selection of this study location is influenced by the distinctive agricultural context in Oromia, characterized by at least three agro-ecological zones. Specifically, four districts were purposefully chosen from each of the three climate zonation due to their significant role in food crop production within their respective regions and their susceptibility to the impacts of climate change (Gemechu and Woldetsadik Abshire, 2021; Teka et al., 2022). The selected districts, namely Jimma Arjo, Diga, Gobu Sayo, and Kiremu, are detailed in Table 1, while their geographical locations are depicted in Figure 1.

Table 1. Location of the meteorological stations and length of rainfall and temperature data series.
Socio-economic conditions
According to the CSA population projection (CSA, 2023), the total population of East Wallega Zone was 1,847,649, with 918,529 (49.71%) being males and 929,120 (50.28%) females. In 2017, approximately 81.12% of the population lived in rural areas and were directly engaged in agriculture. The zone was home to 195,578 households, comprising 175,173 males and 20,405 females. The crude population density in 2017 was 115.034 persons per square kilometer.
Rapid population growth in the study area has led to significant changes in land use, resulting in the destruction of natural forests for cereal cultivation and local fuel sources (Dereje, 2023; Chimdi, 2014).
The agricultural system of the study area is characterized by mixed agriculture (Arragaw et al., 2020). Crops and livestock are essential sources of income in the area. Grains such as corn, sorghum, teff, millet, wheat, and barley are the main crops grown in the region. Agricultural production is mainly based on rainwater. In 2017, the entire region had 315,752 hectares of arable land, producing 11,733,199 quintals of grain. Various factors, including temperature, length of the growing season, moisture availability, flood hazards, soil degradation, toxicity, and rooting conditions, determine the land’s agricultural potential (Teka et al., 2022).
Livestock production relies on natural grasses and crop residues, following traditional management practices (Tolera, 2019) Agricultural productivity in the region faces challenges such as land degradation, erosion, variable rainfall patterns, small, fragmented land areas, traditional agricultural practices, and limited access to local markets and centers. Furthermore, inadequate and inefficient irrigation systems, lack of emphasis on market systems, inadequate infrastructure, limited financial support, and lack of technical support also hinder the development of agriculture (Teka et al., 2022).
Data source
This research procured daily rainfall, as well as minimum and maximum temperature data, from six meteorological stations through the National Meteorology Agency of Ethiopia (NMA) spanning the years 1990–2022, CHIRPS 4.8 km-daily, Terra climate from Climate engine (refer to Table 1). The reliability of these data sources from climate engine were confirmed that they are both grid and station based and more suitable and authenticated in climate change studies (Abatzoglou et al., 2018; Montoya and Caro-lopera, 2021). Yield data for wheat (Triticum aestivum) and teff (Eragrostis tefZuccagni) were obtained from the agriculture office of the East Wallaga Zone and CSA for the period 1990 to 2022.
Data quality control
A significant challenge associated with utilizing lengthy time-series records of meteorological data is the occurrence of data gaps. Consequently, it was imperative to address these data gaps systematically and ensure quality control to establish dependable, uninterrupted, and consistent reference time series, where disparities are solely attributed to weather and climate fluctuations (2). The technique adopted to generate a serially complete dataset was the normal ratio method as outlined by Vionnet and Whitfield (2020). This method was implemented as follows:
Where,
Pi represents the data at surrounding stations.
Nx denotes the normal monthly data at station x.
Ni stands for the normal monthly data at station i.
m represents the number of surrounding stations.
However, in order to solve the problem of missing values in cases of National Meteorological Institute generated data and the lack of quality and consistent values the researcher opted to use the grid and satellite generated data of CHIRPS1 (Montoya and Caro-lopera, 2021) and Terraclimate2 merging with the national station data. To validate the reliability of the data correlation test was conducted (Abatzoglou et al., 2018; Dioumacor et al., 2023; Hanchane et al., 2023).
Examination of the variability in temperature and rainfall
Several indices were employed to analyze the variability of temperature and rainfall. The Coefficient of Variation (CV) recommended by Asfaw et al. (2017), the Precipitation Concentration Index (PCI) suggested by Gocic and Trajkovic (2013) and the Rainfall Anomaly Index (RAI) introduced by Agnew and Chappell (2000) were utilized to evaluate rainfall variability across the study area. Furthermore, the percentage contribution of seasonal rainfall to the total annual rainfall (CT) was computed for each station (Wagaye and Mulugeta, 2022).
Rainfall analysis involved the utilization of monthly data from all stations to calculate an areal average rainfall for East Wallaga Zone, employing Nicholson’s equation,
where Rj represents the integrated rainfall for year j, Xij denotes the rainfall at station i for year j, and Ij indicates the number of available stations for year j (Nicholson, 1985).
Moreover, the temporal fluctuations in temperature were evaluated through the calculation of the Coefficient of Variation (CV) and standardized temperature anomaly. Diverse temperature metrics, such as average seasonal and yearly maximums, average seasonal and yearly minimums, maximum of the maximums, maximum of the minimums, minimum of the maximums, and minimum of the minimums, were scrutinized.
Additionally, correlation and regression analyses were performed to investigate the connection between climate variables, such as rainfall, minimum and maximum temperature and crop production mainly teff and wheat. The objective of this analysis was to pinpoint the most impactful predictor variables (Wagaye and Mulugeta, 2022). The research focuses on the two dominant food crops teff and wheat, which are the most preferred food crops among the society and currently grown at diversified agroecology.
Trend analysis of climatic variables
In this research, time series analysis was employed to examine the patterns in annual rainfall, mean annual temperature, onset, cessation, length of the rainy season, and the number of dry days spanning the years 1990–2022. A trend test was conducted to assess whether there was a monotonous increase or decrease in rainfall and temperature over time. The non-parametric Mann-Kendall (MK) test was selected for trend analysis, and Sen’s slope estimator was used to quantify the magnitude of observed trends (Baffour-ata et al., 2021; Gemechu and Woldetsadik Abshire, 2021; Arragaw et al., 2020; Belay et al., 2021; Mulugeta et al., 2019) using R studio (Stern et al., 2006). R instat method was also used to calculate onset, cessation, length of rainy days and dry across the stations selected in the zone. It is important to note that the Mann-Kendall trend test assumes the absence of serial correlation or autocorrelation in the time series (Baffour-ata et al., 2021). To enhance the accuracy of our analysis, only the trend component was considered, minimizing the impact of irregularities in the data. Additionally, a continuity correction was applied to address ties identified in the dataset (Baffour-ata et al., 2021).
Variations and trends of staple food crops production in EWZ
The study examines trends and fluctuations in the yield of key food crops in the designated districts. These crops encompass wheat and teff. These selections are crucial as they contribute significantly to fulfilling the dietary needs of the majority of the Ethiopian populace. The coefficient of variation serves as a metric for gauging the variability in staple crop yields. Notably, the observed disparities in crop yields across Sub-Saharan African countries are influenced by a multitude of factors, including climatic and non-climatic elements such as technological advancements, economic conditions, unsustainable agricultural practices, and limited access to essential farming resources like fertilizers and tractors. However, due to data constraints, non-climatic factors were not incorporated into this particular study.
Coefficient of variation
Coefficient of Variations (CV) is used to evaluate the variability of rainfall in the study area along different agro-ecology. A higher value of CV is the indicator of larger variability, and vice versa which is computed as:
Where; CV is the coefficient of variation; σ is standard deviation and μ is the mean precipitation. The degree of variability of rainfall events are assigned as less variable (CV < 20), moderate (20 < CV <30), and high (CV >30) (Dinku et al., 2014; Esayas et al., 2019).
To measure the variability in annual rainfall and temperature across each district, the coefficient of variation was computed. Furthermore, a two-way analysis of variance (ANOVA) was employed to compare the means of onset, cessation, length of rainy days, and the number of dry days across different years and districts. In cases where statistically significant differences were observed, Tukey’s honestly significant difference test was used to identify specific variations.
Trends and fluctuations in the harvest of selected food crops were also examined. The primary food crops in the studied districts include maize, teff, wheat, barley, sorghum, millet, beans, peas, sesame, coffee, fruits, vegetables, and various root crops. However, for this investigation, the focus was on teff, wheat, barley, millet, beans, and peas, as these crops play a vital role in meeting the essential dietary needs of the majority of the East Wollega Zone population. The coefficient of variation was calculated to assess the variability in the yields of these critical food crops. Fluctuations in crop yields across Sub-Saharan African countries are influenced by a combination of climatic and non-climatic factors, including technological advancements, economic considerations, unsustainable agricultural practices, conflicts, and limited access to necessary resources like land and farming inputs (tractors, fertilizers, selected seeds, insecticides, etc.). However, due to data constraints, non-climatic factors were not considered in this specific study.
Investigating the impact of climate variables on the harvests of key staple crops
A multiple regression model was employed to assess the influence of climate variables on the yields of selected staple crops during a 23-year span (2000–2022). This analytical approach has been widely utilized in studying the impact of climate variability on food production (Baffour-ata et al., 2021). The correlation coefficient (r) was employed to indicate the sensitivity of selected staple crop yields to climate variability. The significance threshold for this study was established at 0.05. The model is represented as follows:
where Y is the response variable representing the crop yield; β0 is the y-intercept or constant of the model; β1 is the coefficient of Xi (mean annual temperature in degrees Celsius); Xi is the mean annual temperature; β2 is the coefficient of Xii (annual rainfall in millimeters); Xii is the annual rainfall; β3 is the coefficient of Xiii (rainfall onset in days); Xiii is the rainfall onset; 4β4 is the coefficient of Xiv (cessation in days); Xiv is the cessation; β5 is the coefficient of Xv (number of dry days); Xv is the number of dry days; and ε is the random error or error factor. Total annual rainfall, mean annual temperature, onset, cessation, and the number of dry days for all districts were computed by aggregating data from the four districts. The arithmetic mean method, commonly employed by researchers (Bekuma Abdisa et al., 2022), was chosen for its accuracy, given the uniformly distributed pattern of meteorological stations. Additionally, temperature values under consideration exhibited minimal variation. This method is expressed as:
Where,
Px = average climate data over the districts for a given time period,
Pi are the climate data in a given time period at the four districts 1, 2, 3 … n, respectively, within East Wallaga Zone.
Likewise, the collective average yield of each food crop was determined by combining the average yield across all districts. Hence, the D’Agostino-Pearson Omnibus normality test is used to measures of skewness and kurtosis to form an omnibus test statistic.
Results and discussion
Average climatic variability in East Wallaga Zone (1990–2022)
Spatio-temporal variability of rainfall
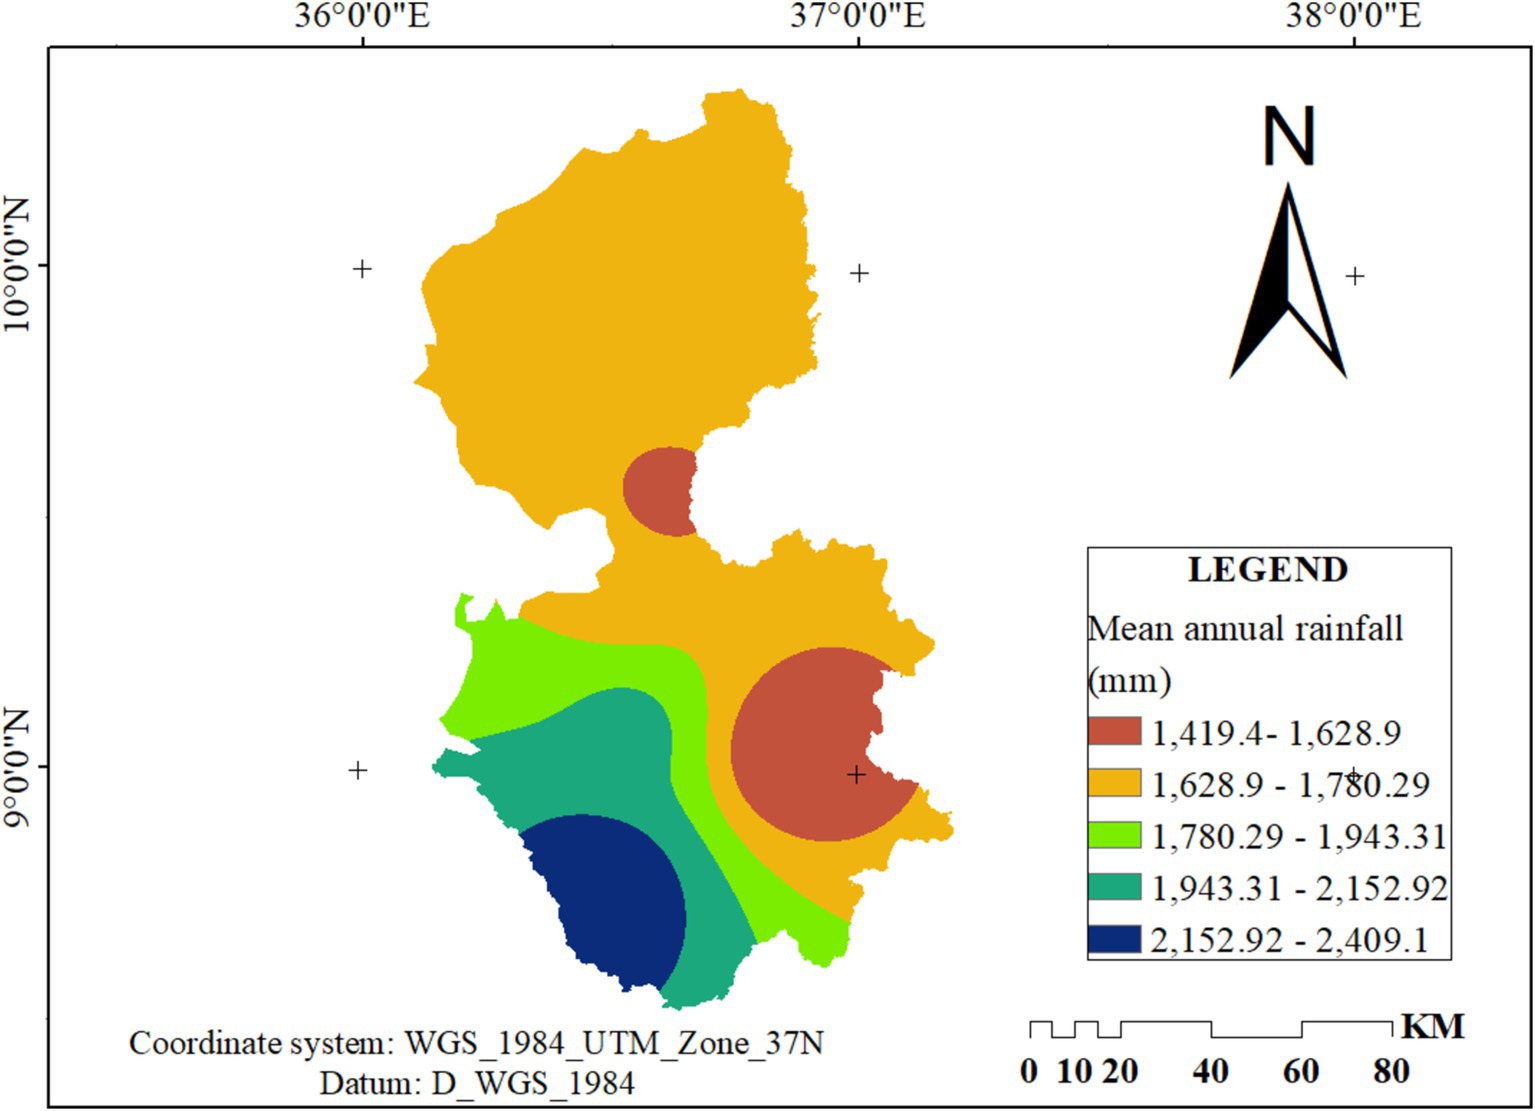
East Wallaga Zone exhibits three distinct agro ecological zones, namely highland, midland, and lowland, each offering unique climatic conditions. The highland region, located in the southern part of the zone, is characterized by lower temperatures and relatively abundant rainfall. Despite being predominantly unimodal, the area experiences notable variability in both the quantity and frequency of rainfall. The accompanying map provides a comprehensive illustration of the precipitation patterns within EWZ (Figure 2).
With a coefficient of variation (CV) of 8.2%, which indicates modest variance, the daily precipitation data taken from the CHIRPS data center clearly shows the zone’s rainfall fluctuation. Although the p-value is insignificant and indicates that there is no statistically significant trend or directional change in rainfall over time, the positive Sen’s slope points to a systematic rise in rainfall.
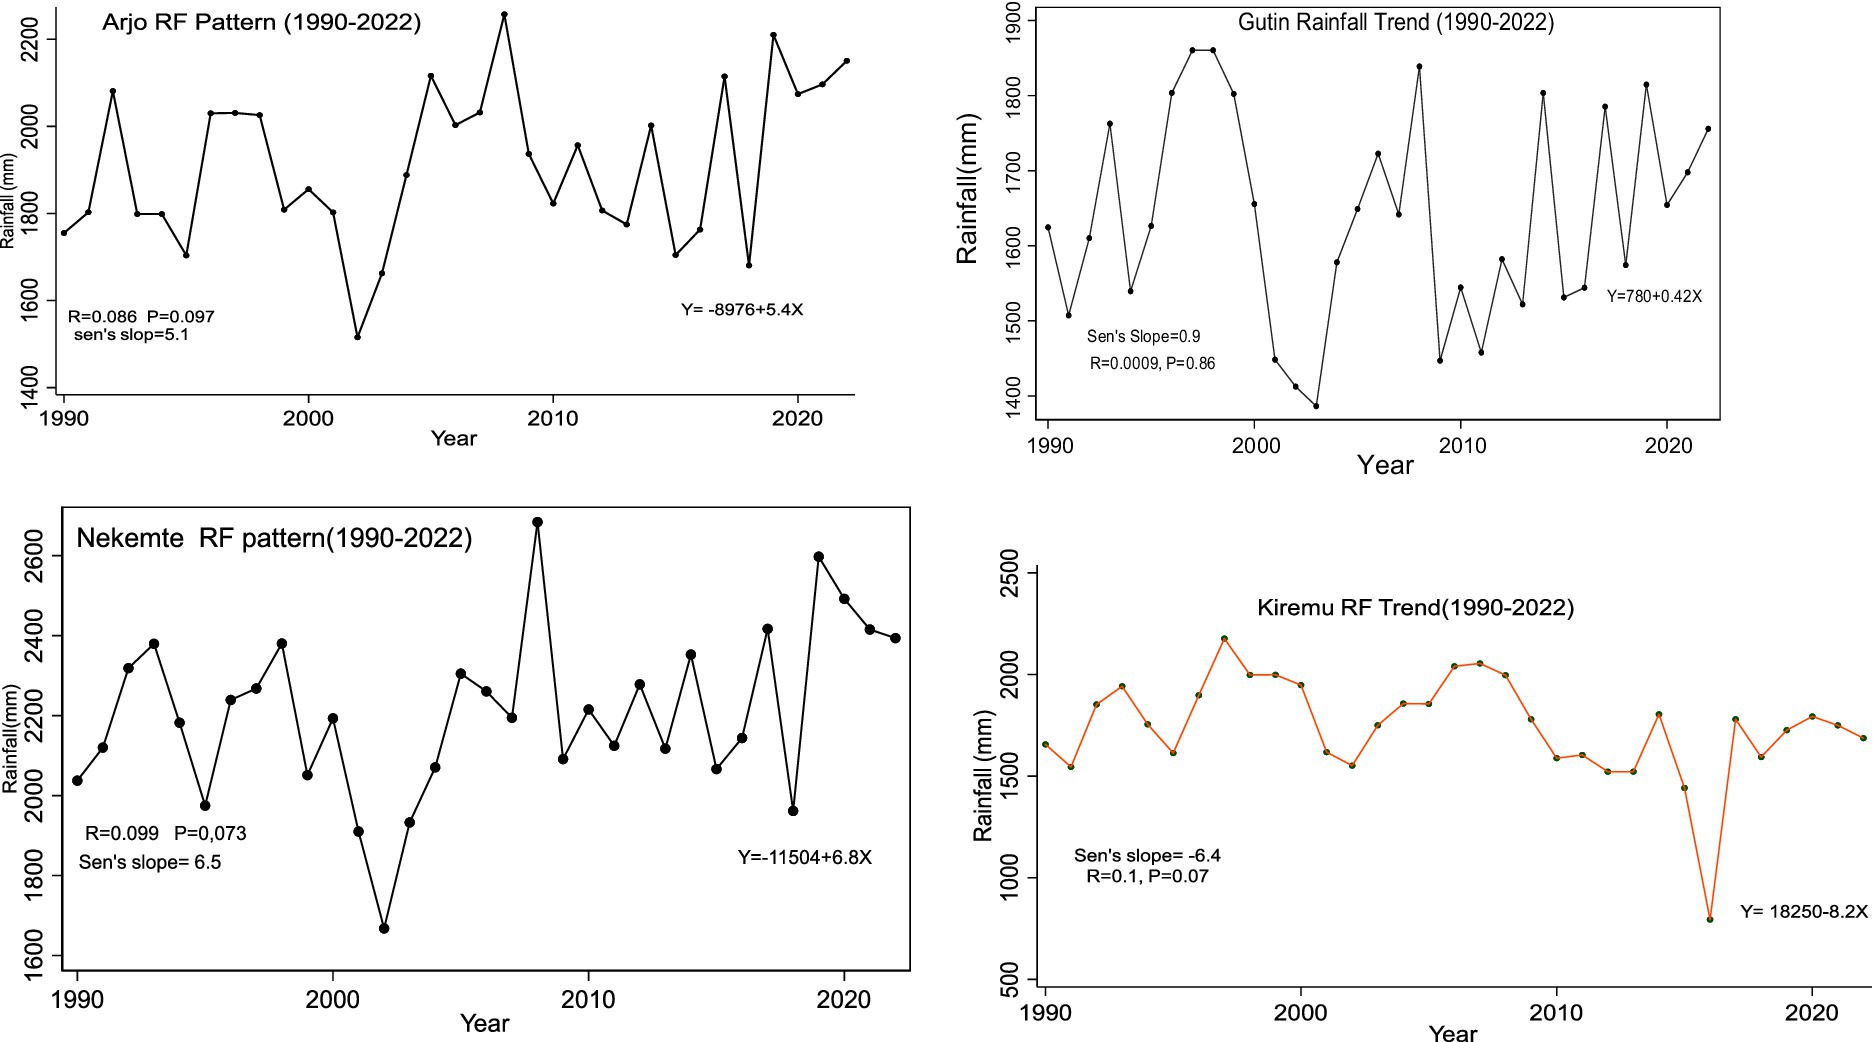
Other than the spatial variation, trend analysis based on investigation of rainfall data at the stations (Arjo, Nekemte, Sibu Sire, Kiremu, and Gutin) have demonstrated significant shifts in the variability of rainfall over time. However, trend analysis based on stations have demonstrated significant shifts in the variability of rainfall. The rainfall pattern at Arjo station, which is representative of the highland agroecology, was found to be dropping by the Mann-Kendall test. In a similar vein, Nekemte, the zonal capital and midland area, showed declining precipitation levels over the study period.
Figure 3 illustrates how the rainfall patterns in the study districts changed between 1990 and 2022. During the 1990–2022 research period, Sen’s slope negative values for the Arjo and Nekemte stations showed a decrease in annual rainfall; however, these trends were not statistically significant (p > 0.05).
Conversely, the Sibu Sire and Gutin stations’ positive Sen’s slope values indicate a marginal rise in annual precipitation. The lowland district, represented by the Gutin meteorological station, had the greatest variation in rainfall (18.9%), closely followed by the midland district of Nekemte station (15.92%). The midland area, represented by the Sibu Sire station, recorded the lowest rainfall variability (11.49%) during the review period (Table 2).
Rainfall onset, cessation, length of rainy season and number of dry days
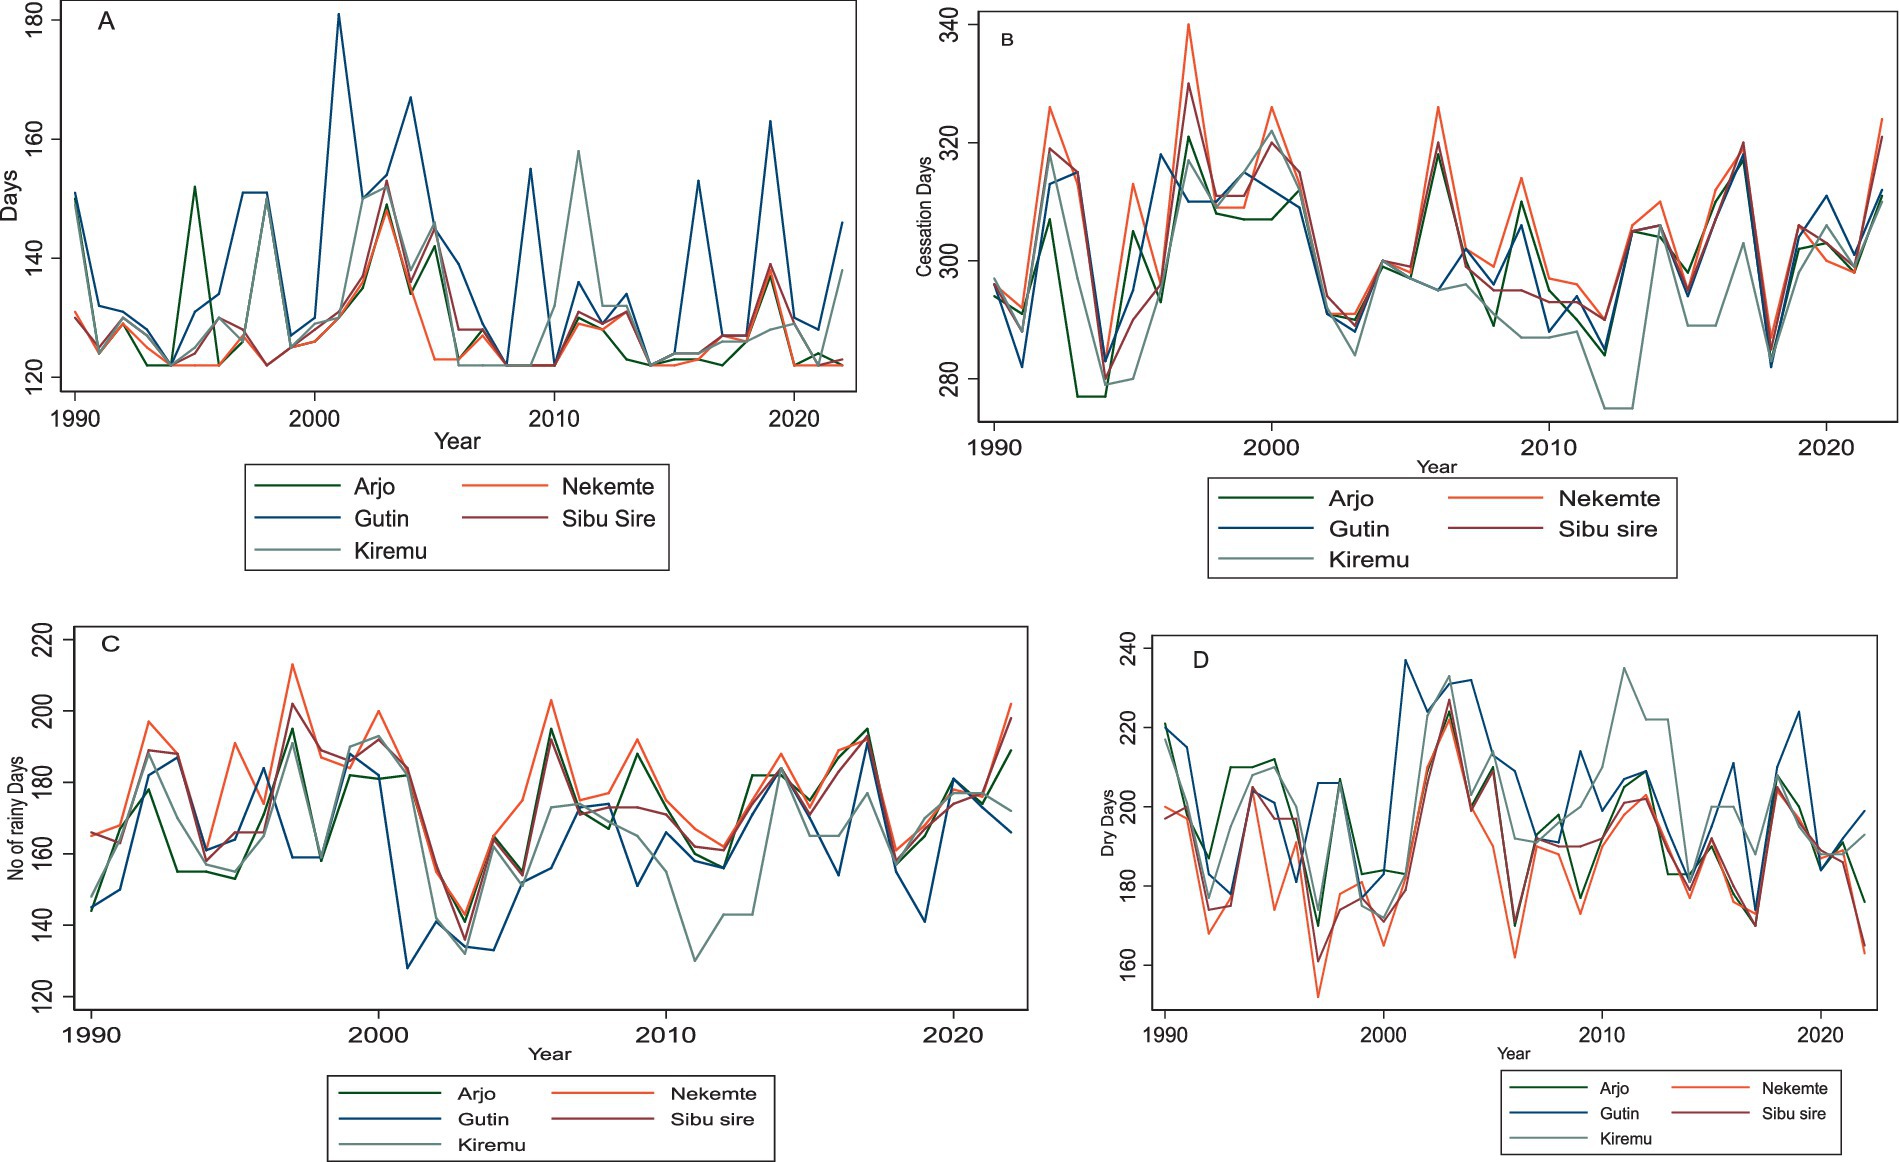
Significant annual variations were observed in the length, onset, and cessation, with coefficients of variation of 7.1, 7.5, 7.1, 7.6, and 7.8% in Arjo, Nekemte, Gutin, Sibu Sire, and Kiremu, respectively. The coefficient of variation statistics show that Nekemte station (7.5%) and midland Kiremu (7.8%) have the highest levels of variability. With a coefficient of variation (CV) of 7.1%, the lowland ecosystem of Gutin exhibits the least change in the commencement of rainfall. The districts all had varying times of the earliest beginning of rainfall on May 1, which was the 122th day. The 122th day of May marks the start of rainfall in the Arjo district, which exemplifies highland agroecology, in 1993, 1994, 2009, and 2010 and 2014. In this district, the lateset onset happened on June 16, 1990, which was day 168th day from January 1st. Conversely, there was a great deal of variation in the timing of the onset of rainfall in the midland Kiremu district; on average, the onset period fell on the 131st day of January. The average onset period in the Gutin area, which is representative of the lowlands in the basins of the Dhidhessa and Anger Rivers in the East Wallaga Zone, was 130th day, or approximately May 9. The livelihoods of the rural populations in these areas, as well as agricultural planning, are greatly impacted by these fluctuations in the onset of rainfall. Farmers that depend on consistent rainfall patterns for crop planting and harvesting have difficulties due to the significant fluctuation, particularly in the midland and highland regions.
The cessation period of the overall East Wallaga Zone also varies. Cessation of rainfall had significant impacts on the productivity of crops in unpredictable weather condition. The early cessation of rainfall cause the low productivity of some crops grown in the latter periods of the growing season and the late cessation also had losing of the ripen crops in many ways. In this regard, the Arjo district cessation periods had variation. The early cessation was on 14 October in 1993 and 1994. The late cessation was observed in 336th day (December 1) in 1997. The earliest cessation of rainfall occurred in Kiremu district on day 280 (6th October) in 1995, while the latest cessation occurred on the 322th day which was on (17 November) in 2000. The lowland district had variable cessation period and earliest period was in 1991 on 16 October. Generally speaking, the variability of onset was 132.8, 135.3, 130.2, 134.4, and 131.3 days from January first for Arjo, Nekemte, Gutin Sibu Sire and Kiremu, respectively. Conversely, it was 310.9, 320.5, 315, 307.2, and 295 days of cessation period for Arjo, Nekemte, Gutin, Sibu Sire and Kiremu stations, respectively (Figure 4).
Precipitation concentration index
As stated by Salameh (2024) one of the factors utilized to look into drought and flooding in the area under study is the Precipitation Concentration Index (PCI), which is strictly determined based on the time series. Planning for agriculture and water resource management can be greatly impacted by the temporal distribution of precipitation, which is indicated by the PCI, an important indicator.
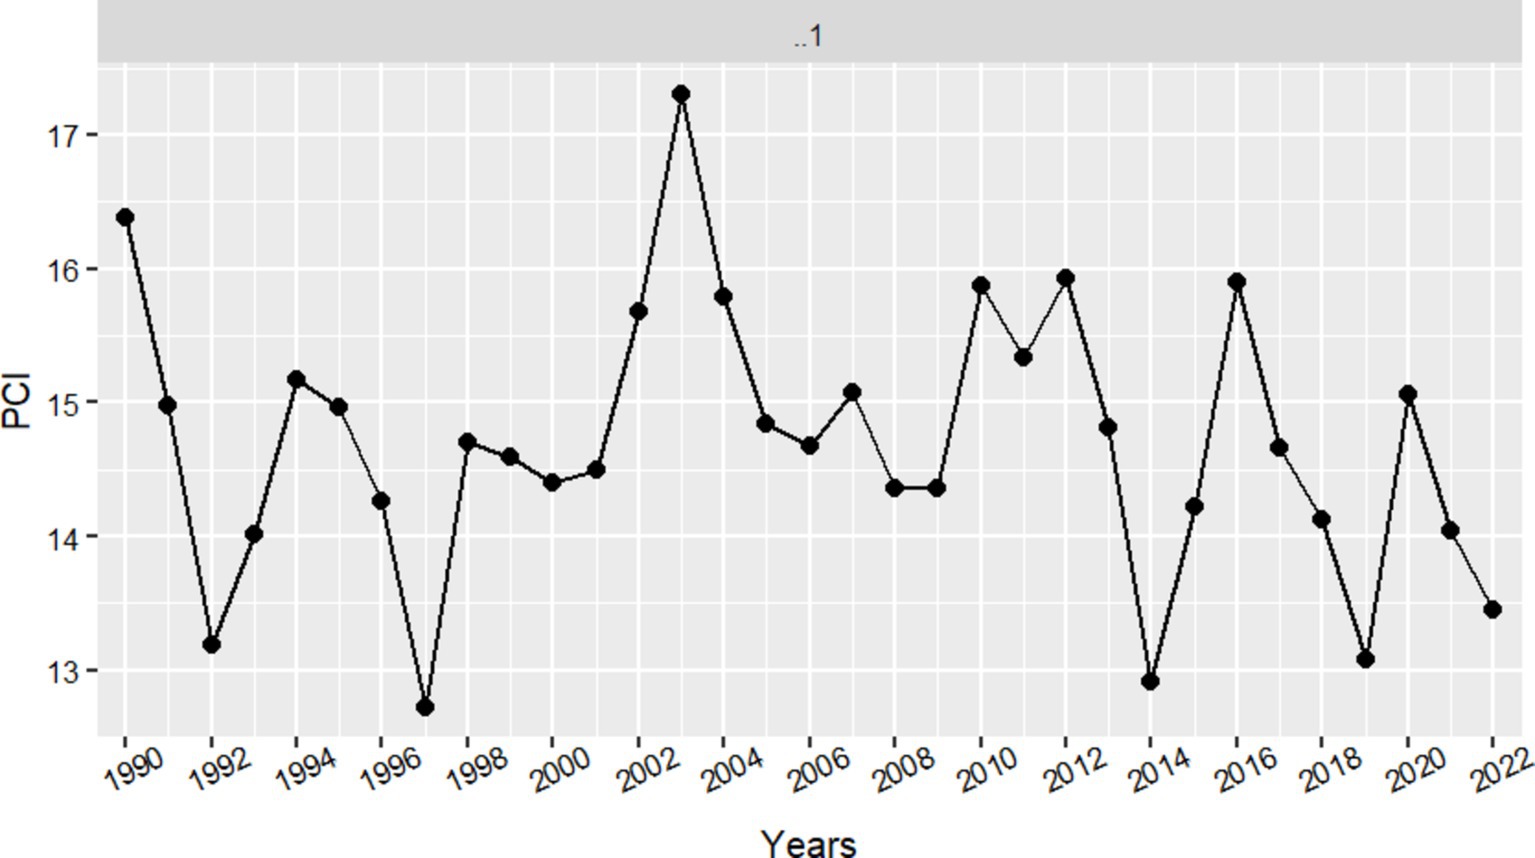
A monthly precipitation distribution that is uniform (low precipitation concentration) is indicated by a PCI of 10 or less, whereas a distribution that is moderate is indicated by a PCI between 10 and 15. Uneven distribution is indicated by a PCI of 15–20. The PCI for the East Wallaga Zone (EWZ) varies from 12.09 to 17.3. This shows that the distribution of precipitation in the area is moderate to erratic, indicating significant variability and prediction difficulty.
Given that steady water availability is essential for crop growth and productivity, this precipitation fluctuation may present difficulties for agricultural operations.
Existing theories state that because water availability is unpredictable, locations with high PCI values frequently confront considerable issues in agriculture and water management. These areas are susceptible to more frequent floods and droughts, which can have an impact on rural inhabitants’ means of subsistence. Given the large fluctuation in PCI for EWZ, it is likely that farmers and managers of water resources need to implement adaptive measures to deal with the erratic water supply. This can entail the application of crop cultivars resistant to drought, enhanced irrigation techniques, and effective water storage mechanisms (Figure 5).
Rainfall Anomality Index (RAI)
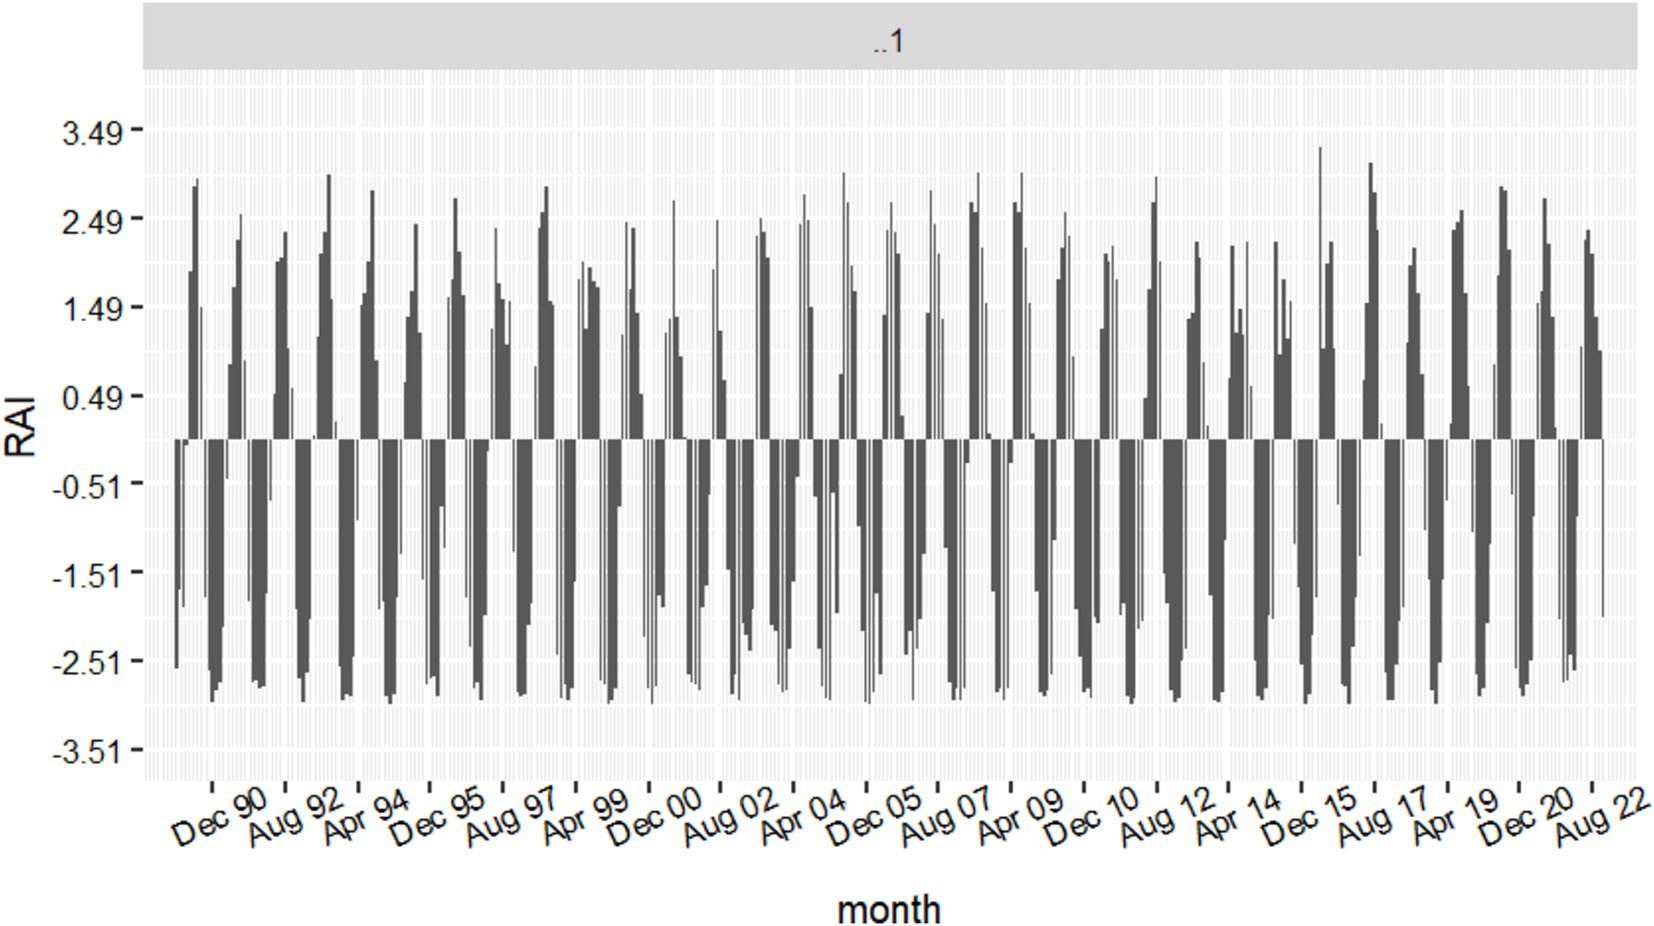
According to Aryal et al. (2022), Rainfall Anomaly Index is used to measure the deviation of observed rainfall from the long-term average or normal rainfall. It is an important tool in climatology and hydrology for assessing droughts, excessive rainfall, and other precipitation related anomalies. It is mostly used for drought and flood monitoring, climate variability and particularly for agricultural planning. Accordingly, EWZ RAI experienced many RAI negative results that is the clear indicators for the water shortage in the zone (Figure 6). The negative results in RAI shows shortage of rainfall categorically in months and days of the year. The result also revealed that, despite the fact that the western Ethiopia receives excessive amount of rainfall there is the possibility of the occurrence of drought which threatens the agricultural production.
Temperature trends of East Wallaga Zone (1990–2022)
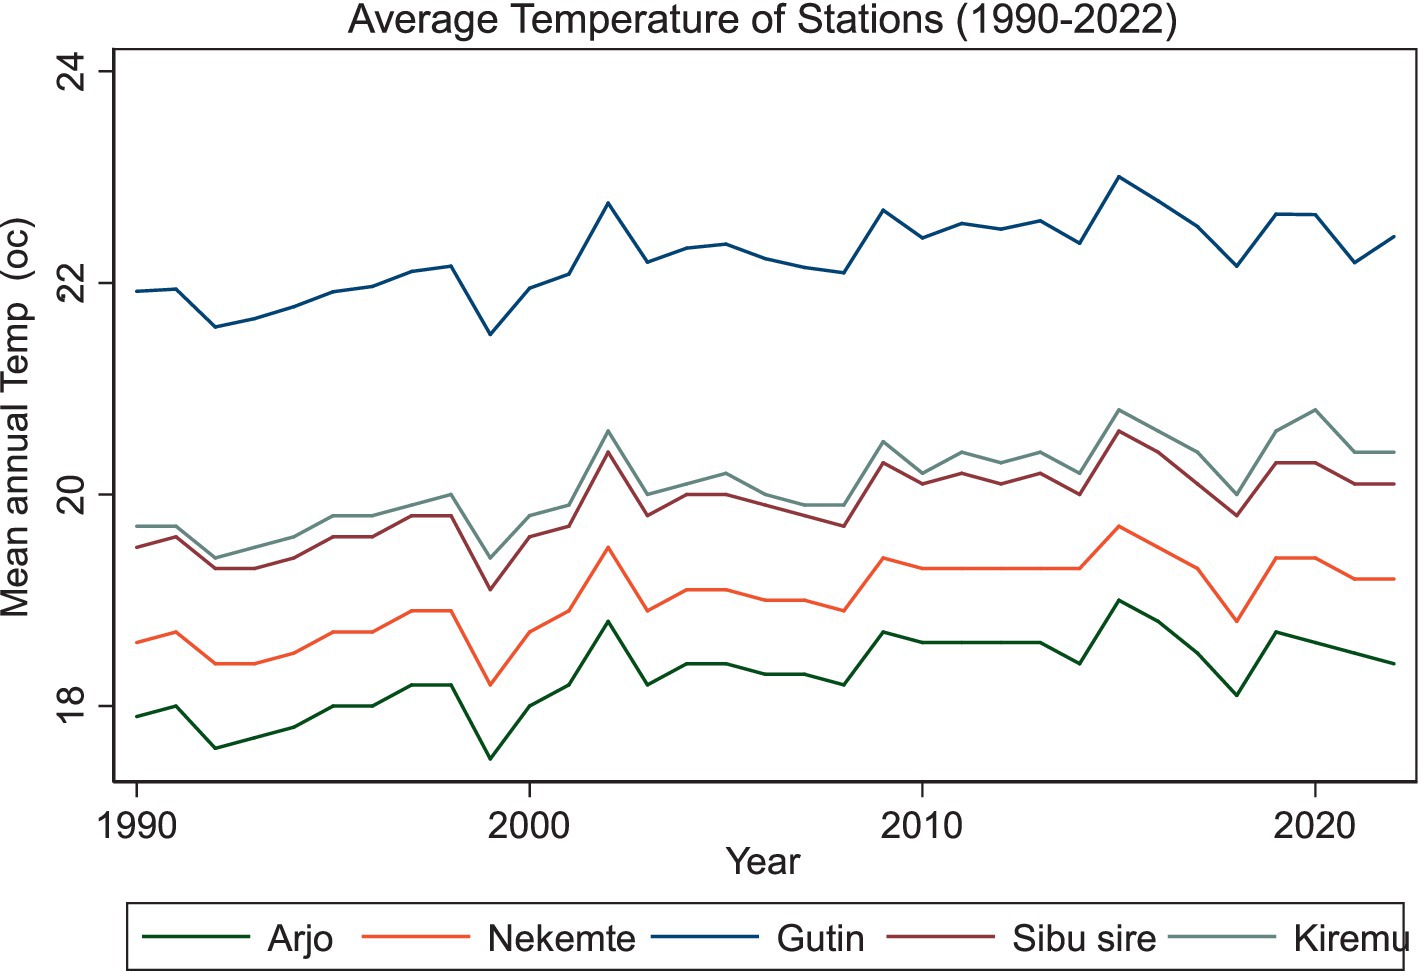
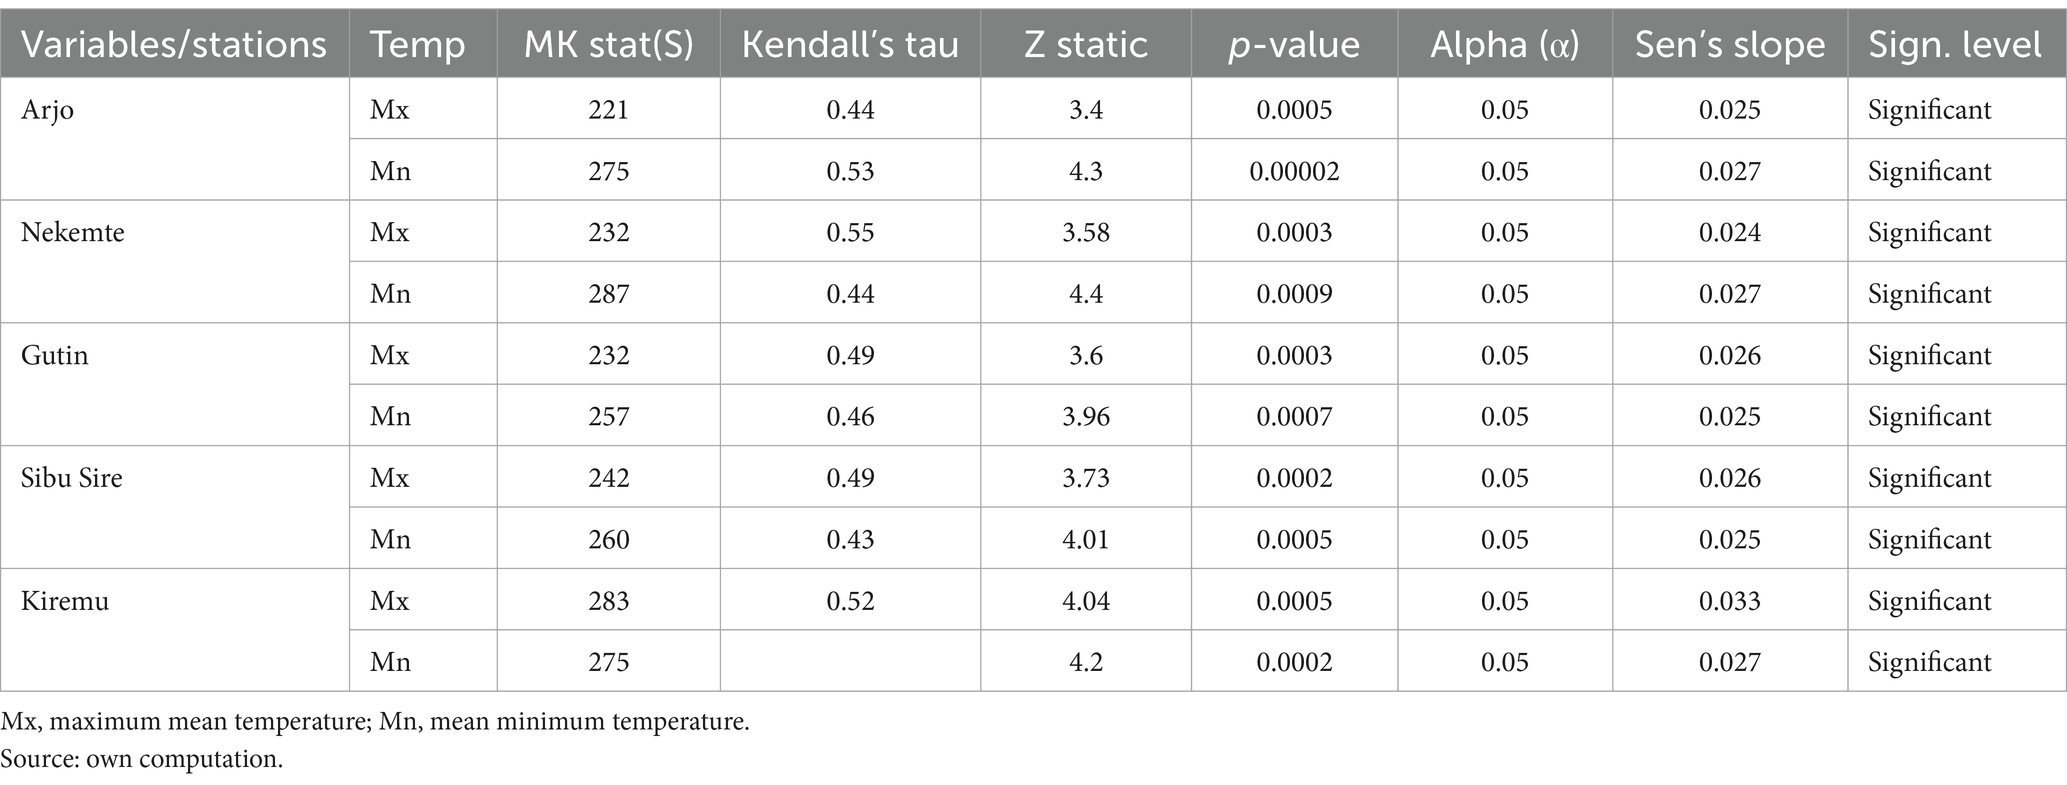
The Mann-Kendall trend test revealed that there is significant temperature rise in East Wallaga Zone. The maximum temperature have shown the positive trend with significant p-value of (0.0002) with positive Sen’s slope (0.03). This implies that there is temperature increase trend in the study area. A less rise in temperature throughout the study period which is based on zonal average temperature data of the available stations and satellite station based data generated by climate engine of Terraclimate, 2024. On the other hand depending on the data from the stations (Figure 7), there was variability and rise of temperature across the five stations in four districts selected in the zone.
Accordingly, Arjo which is typical high land climate showed slight increasing of temperature since Sen’s slope is positive. In the same way all the weather stations representing the surrounding districts had positive Sen’s slope. The lowland agroecology represented by Gutin stations had shown higher value of Sen’s Slope. This means that the rising rate of temperature in the zone is higher in the lower altitude than the midland and highland agro-ecologic zone. Generally speaking there is increasing of temperature in all the districts of East Wallaga Zone. The coefficient of variations for the major stations selected of Arjo, Nekemte, Sibu Sire, Gutin and Kiremu were 5.9, 7.94%. 6.32, 9.48, and 6.76%, respectively. In this regard the highest variation was observed in lowland Gutin and followed by Nekemte station. The low variation was observed in the highland Arjo area (Table 3).
Throughout the course of the investigation, the East Wallaga Zone’s (EWZ) temperature conditions displayed notable trends. These results demonstrate the region’s complicated climate patterns, which vary not only between highland, midland, and lowland regions but also within them.
The temperature conditions in East Wallaga’s agroecological zones varies greatly across the many types of landforms. With its highland climate, the Arjo area saw an average temperature of 18.3°C over the research period. 2015 saw the highest maximum temperature of 26°C, while 1992 saw the lowest temperature of 24.2°C. On the other hand, in 1999, the lowest temperature ever measured was 10.1°C. This district’s temperature trend has been slightly rising, as shown by a positive Mann-Kendall trend value and a Sen’s slope of 0.03. The literature supports the idea that this highland region has experienced a steady rise in temperature over time.
The midland zones Kiremu, Nekemte, and Sibu Sire also showed discernible variations in temperature. With a Sen’s Slope of 0.04 and a positive Mann-Kendall test result, Nekemte, the zonal capital, showed a trend toward rising temperatures. In a same vein, Sibu Sire’s Sen’s Slope of 0.026 indicated a rising trend. Similar variations were observed in the minimum and maximum temperatures in the Kiremu district.
As seen globally in this century, the rainfall trend in the East Wallaga Zone (EWZ) has become increasingly variable and unpredictable, with a slight decline in both amount and frequency. Similarly, the temperature in this area has shown a continuous but slight increase across the districts of EWZ (IPCC, 2022a,b).
Trends of wheat and teff yields in EWZ
The East Wallaga Zone’s agricultural output has been steadily rising over time, according to trends. This increase is probably attributable to the implementation of different production-enhancing agriculture packages. The goal of these packages is to ease food shortages in accordance with the United Nations Sustainable Development Goal (SDG) of ending hunger. They comprise contemporary farming techniques, fertilizers, and better seeds.
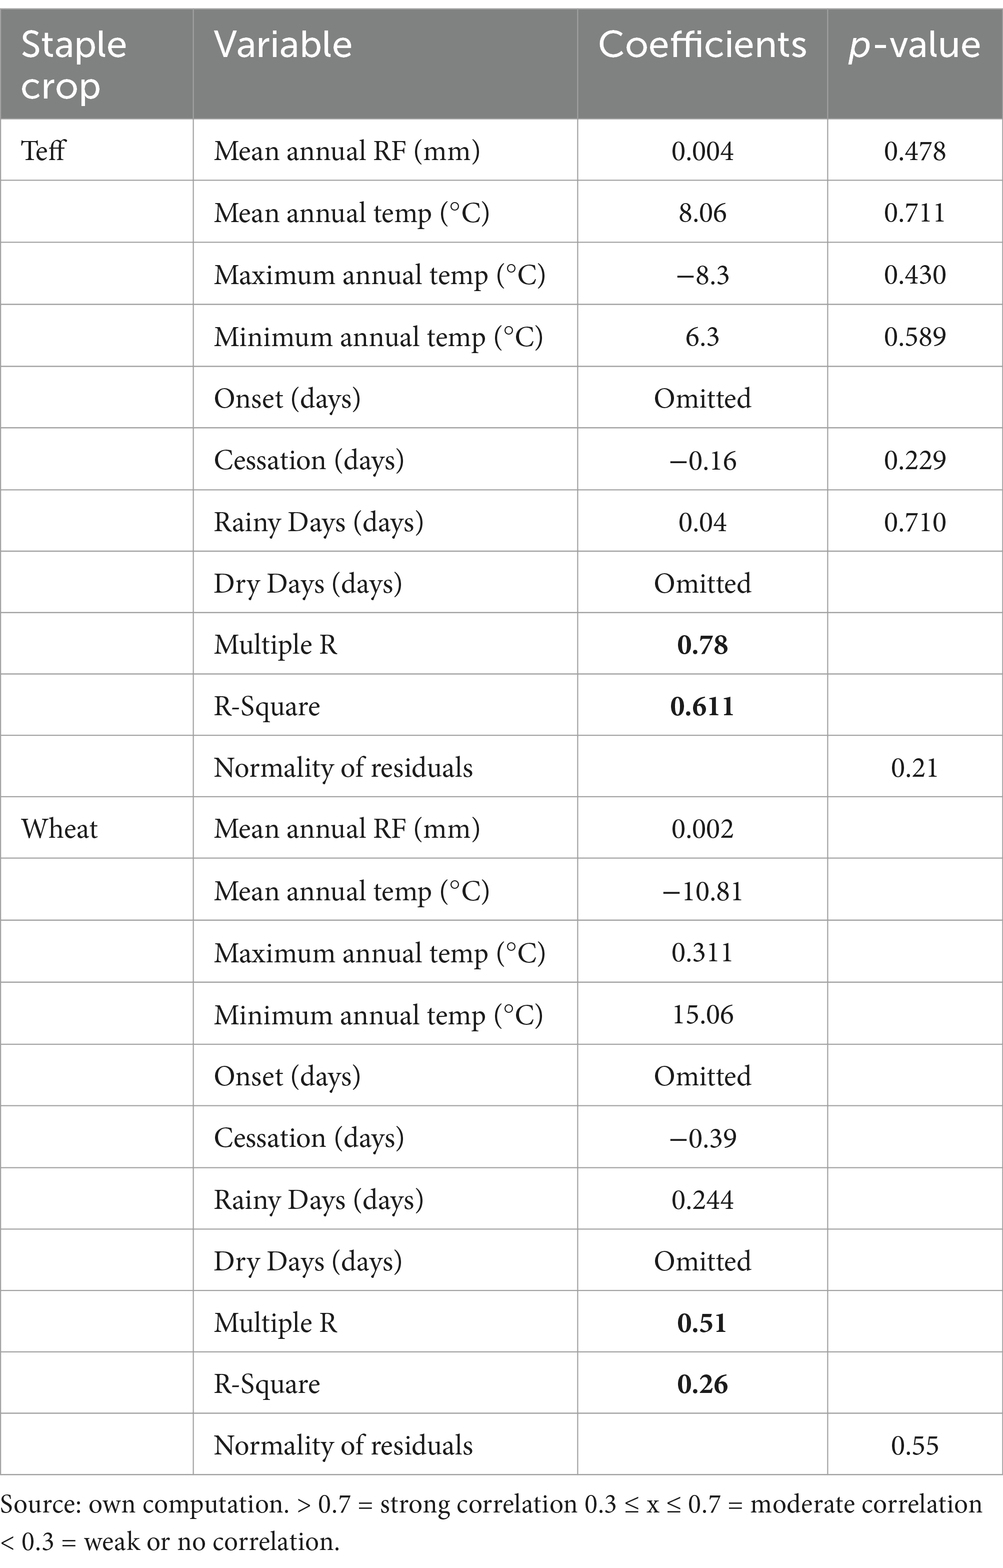
Even with these advancements, the zone’s food security problem persists. Despite some slight increases in output, the area is still a long way from having food security. Over the previous few decades, the two main crops in the region, teff and wheat, have had coefficients of variation (C.V.) of 0.32 and 0.31, respectively. Crop yield fluctuation suggests that levels of production are not constant. Impacts of rainfall, minimum temperature and maximum temperature on productivity of teff and wheat had been statistically learn. Crop yield unpredictability is a sign that the zone’s production levels are unstable and unable to meet the needs of its fast expanding population.
The discrepancy between population growth and production inconsistency coupled with unpredictable weather condition indicates that the region’s agricultural productivity may not be reliable for the domestic consumption as well as commercial items. It draws attention to the necessity of more substantial plans and ongoing funding for agricultural development in order to boost total production and stabilize yields. In East Wallaga Zone, addressing these problems is essential to advancing toward food security and SDG fulfillment (Table 4).
The results of the regression analysis indicated that the yields of teff and wheat were not significantly affected by the mean annual rainfall (R = 0.004 and 0.002) for teff and wheat, respectively. This may be because the fluctuation in crop output can be explained by other variables not taken into account by the model, such as soil fertility, soil type, improved farming techniques and other technological inputs.
These results are consistent with a prior study conducted in Ghana by Baffour-ata et al. (2021), which found that the output of grain crops in northern Ghana, was not significantly impacted by climatic variables. Rather, non-climatic elements such as fertilizer application and irrigation were essential for the production of grain crops. In a similar vein, Batho et al. (2019) discovered that non-climatic variables also had an impact on the yields of staple food crops. Similar trends were noted by Bekuma Abdisa et al. (2022) in Ethiopia, who came to the conclusion that differences in the yields of particular food crops were caused by factors such as soil fertility, sufficient water availability, selected seeds and farm management techniques.
The results show that agricultural methods and soil fertility are two examples of non-climatic factors that can impact crop output variability in the study area (Baffour-ata et al., 2021; Chimdi, 2014). Teff productivity was positively significantly impacted by mean annual temperature, however wheat productivity was decreased by 10.81 units for every unit rise in temperature. This indicates that wheat is more sensitive to temperature changes than teff crops. The yields of wheat and teff per hectare were closely correlated with the minimum yearly temperature. As a result, the yields of wheat and teff increased by 6.3 and 15.06 unit, respectively, with a one unit minimum temperature increase.
Wheat was negatively impacted by the maximum temperature and cessation days, while wheat yields in the Eastern White Zone were similarly negatively impacted by the mean annual temperature and stoppage days. The quantity of rainy days had a marginally favorable effect on the yield of the two main basic crops in the same manner (Adu-Boahen et al., 2019; Asravor, 2018).
Crop yields have also been found to be influenced by improvements in agronomic and farm management practices, such as the use of fertilizers, conservation agriculture methods, enhanced crop residue management, planting improved varieties, and guaranteeing access to irrigation and farm inputs. One important non-climatic component in reducing the effects of climate pressures is improved soil fertility, which can be achieved through conventional soil conservation techniques like mulching and the application of organic manure (Baffour-Ata et al., 2021).
Perceptions of rural households on climate change
Rural communities in sub-Saharan Africa are becoming more conscious of the effects of climate change since it directly affects their means of subsistence, especially agriculture. Many believe that the unpredictable rainfall patterns, protracted droughts, and increased frequency of extreme weather events brought about by climate change pose a serious threat. Reduced agricultural production, food insecurity, and income loss are the results of these changes. Rural populations’ knowledge of climate variability reflects a combination of traditional and scientific ideas, with some attributing supernatural origins or divine intent to these swings, while others interpret them as the product of broader environmental changes (Muriuki et al., 2023).
Ethiopian rural communities also view climate change as a serious concern, given the nation’s heavy reliance on rain-fed agriculture. Farmers in Ethiopia frequently report higher temperatures, more variable rainfall, and shorter rainy seasons. Due to the negative effects of these changes on livestock and crop harvests, there is now more food insecurity and financial hardship (Mekonnen et al., 2021). Many households have responded by implementing coping mechanisms including shifting planting dates, expanding their agricultural diversification, or moving to cities. Though understanding of climate change varies, some rural populations lack the means and information necessary to fully comprehend and prepare for these changes.
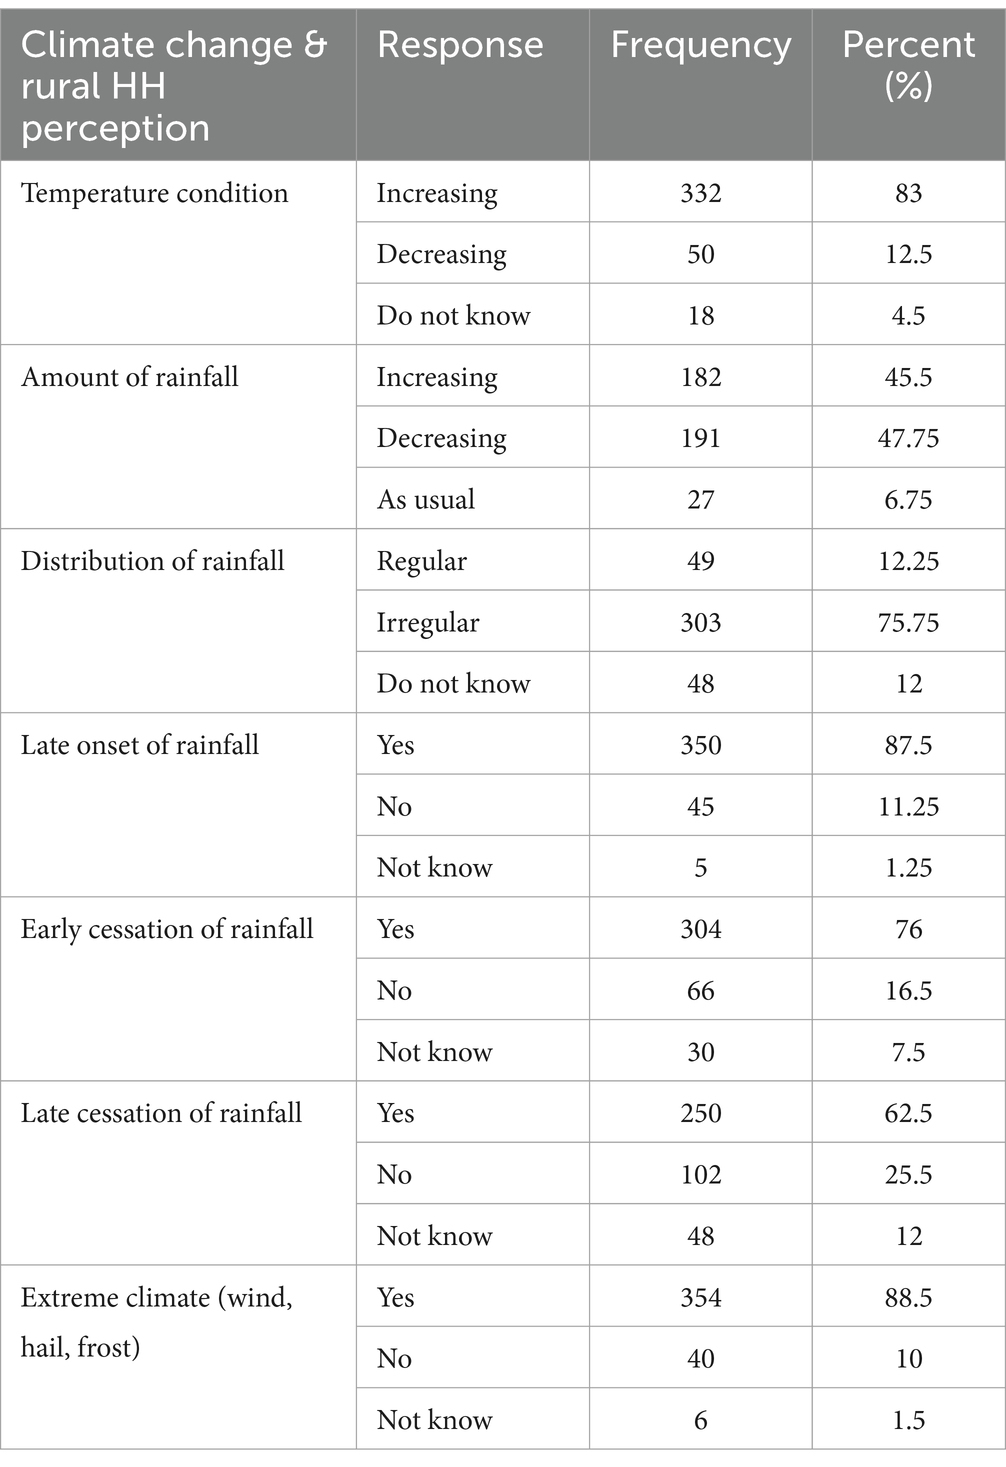
Rural households in Ethiopia’s East Wallaga Zone have noticed notable changes in the local climate in recent years. Many interpret these changes in terms of decreased agricultural productivity, which they correlate with changes in rainfall patterns and an increase in the frequency of droughts. The group is extremely vulnerable to even little changes in the climate since they depend on traditional farming methods and local expertise. Despite this, there is a growing recognition that climate change is a global phenomenon, in part because of initiatives from NGOs and the government to spread knowledge and encourage adaptable practices. Unfortunately, the successful application of adaptation measures is hampered by resource restrictions, restricted access to modern agricultural inputs, and continuing socio-economic issues (Tolera, 2023), leaving many households exposed to the ongoing effects of climate change (Table 5).
The data reveals a strong awareness among rural households regarding the impacts of climate change, particularly concerning temperature, rainfall patterns, and extreme weather conditions. A significant majority (83%) of respondents perceive an increase in temperature, aligning with global warming trends, while a smaller portion (12.5%) note a decrease, suggesting localized cooling perceptions. When it comes to rainfall, opinions are more divided: about 45.5% of households report an increase, whereas 47.75% perceive a decrease, indicating mixed experiences with precipitation changes. Only a small minority (6.75%) believe rainfall has remained stable (Gemeda et al., 2023).
A crucial concern is the irregular distribution of rainfall, reported by 75.75% of respondents, which poses challenges for agricultural planning and crop yields. Most households (87.5%) also observe a late onset of rainfall, with 76% noting early cessation, leading to shorter rainy seasons that could negatively impact farming activities. Additionally, 62.5% report late cessation of rainfall, potentially causing prolonged wet periods and further complicating agricultural schedules (Gemeda et al., 2021).
The experience of extreme weather events, such as wind, hail, or frost, is reported by 88.5% of respondents, highlighting the increased volatility and severity of climate conditions faced by these communities. The data underscores the critical challenges posed by climate change to rural livelihoods, emphasizing the need for adaptive strategies and policy interventions to support these vulnerable populations (Bekuma Abdisa et al., 2022).
Source of information for climate change
For rural households, climate information is vital since it is a vital tool for controlling agricultural operations, getting ready for extreme weather, and maintaining livelihoods. These households typically get this information from a range of sources. Elders and community leaders, who have accumulated years of experience observing and interpreting seasonal changes, weather patterns, and natural signs, are important sources of traditional knowledge. Furthermore, local data are frequently utilized to forecast climate conditions, such as alterations in plant and animal behavior.
Another important source of information on the climate is the government and meteorological services. Communities are assisted in anticipating and preparing for impending weather events, such as storms or droughts, by weather predictions that are distributed through radio, television, and mobile phone notifications. Agricultural extension services also play a crucial role by offering advice on adapting farming practices to changing climate conditions, including recommendations on crop varieties, planting schedules, and water management.
Non-governmental organizations (NGOs) and community-based organizations (CBOs) contribute by conducting training sessions and workshops that educate rural households on climate change and adaptation strategies. These organizations often distribute climate-resilient seeds and other resources, and run awareness campaigns using various media. In areas with mobile coverage, digital platforms such as mobile apps and SMS services provide timely, location-specific climate information, helping farmers make informed decisions. Social media and online forums also serve as platforms for sharing experiences and information related to climate change.
In rural areas, local radio stations play a crucial role by providing daily weather updates and agricultural advice in the local tongues, so facilitating widespread accessibility to information. Public announcements made over loudspeakers or at events are utilized in some areas to disseminate important climate information.
It is impossible to exaggerate the significance of climate data. By empowering farmers to make knowledgeable decisions on planting and harvesting, it increases agricultural productivity. Additionally, by issuing early warnings for extreme weather events, it aids in risk management and disaster preparedness. Understanding the climate also helps farmers maintain their way of life by enabling them to adjust to changing circumstances and lower their chance of experiencing food insecurity and poverty.
Additionally, it encourages the adoption of sustainable practices, which are essential for long-term environmental sustainability. These practices include switching to crops that are robust to climate change and saving water and soil. Lastly, having access to trustworthy climate information strengthens rural populations’ ability to adapt to changing climate conditions by building resilience.
Conclusion
This study clarifies the complex patterns of climate variability in Ethiopia’s East Wallaga Zone and how they affect household staple crop yield. The results demonstrate how climate change, which is marked by erratic rainfall patterns, severe temperatures, and unpredictability in weather patterns, has significantly impacted the subsistence farming practices of smallholders in the area. These farmers are among the most vulnerable to these changes because of their limited ability to adapt and reliance on natural resources. They primarily practice rain-fed agriculture.
The study shows that cereal production, a vital household resource in East Wallaga, has been severely disrupted by the growing variability in climate patterns. Sustainable development initiatives are hampered because poverty is made worse by the region’s low socioeconomic resilience and declining crop output.
The study also finds observable relationships between variations in family food crop production and particular climate variables, such as temperature swings and rainfall patterns.
Households have implemented a range of adaptation techniques to address these issues, such as diversifying crop varieties, adopting soil conservation practices, and looking for alternate sources of income. These steps, meanwhile, frequently fall short of completely reducing the negative effects of climate variability.
The study emphasizes how urgently comprehensive policy initiatives targeted at improving smallholder farmers’ ability for adaptation are needed. This entails enhancing social safety nets, developing agricultural methods that are climate resilient, and improving access to climate information. Building long-term resilience against the effects of climate change also requires supporting sustainable land management techniques and encouraging community-based initiatives.
In conclusion, creating successful plans to assist vulnerable people in the East Wallaga Zone requires an awareness of the intricate interactions that exist between household assets and climate unpredictability. This study offers insightful information that can support sustainable development and guide policy decisions, eventually assisting households in adjusting to the ever-changing problems brought about by climate change.
Data availability statement
The raw data supporting the conclusions of this article will be made available by the authors, without undue reservation.
Ethics statement
Written informed consent was obtained from the individual(s) for the publication of any potentially identifiable images or data included in this article.
Author contributions
DK: Conceptualization, Data curation, Formal analysis, Funding acquisition, Investigation, Methodology, Project administration, Resources, Software, Supervision, Validation, Visualization, Writing – original draft, Writing – review & editing. AT: Supervision, Validation, Writing – review & editing. DT: Supervision, Writing – review & editing.
Funding
The author(s) declare that no financial support was received for the research, authorship, and/or publication of this article.
Conflict of interest
The authors declare that the research was conducted in the absence of any commercial or financial relationships that could be construed as a potential conflict of interest.
Publisher’s note
All claims expressed in this article are solely those of the authors and do not necessarily represent those of their affiliated organizations, or those of the publisher, the editors and the reviewers. Any product that may be evaluated in this article, or claim that may be made by its manufacturer, is not guaranteed or endorsed by the publisher.
Abbreviations
CHIRPS, Climate Hazards Group Infra-Red Precipitation with Station data; CV, Coefficient of Variation; EWZ, East Wallaga Zone; GHGs, Green House Gases; IFPRI, International Food Policy Research Institute; IMF, International Monetary Fund; IPCC, Inter Governmental Panel on Climate Change; MK, Mann-Kendall; PCI, Precipitation Concentration Index; RAI, Rainfall Anomaly Index; UN, United Nations.
Footnotes
References
Abatzoglou, J. T., Dobrowski, S. Z., Parks, S. A., and Hegewisch, K. C. (2018). Terra climate, a high-resolution global dataset of monthly climate and climatic water balance from 1958-2015. Sci Data 5, 1–12. doi: 10.1038/sdata.2017.191
Adu-Boahen, K, Dadson, I, and Halidu, MA. (2019). Climatic variability and food crop production in the Bawku West District of the upper east region of Ghana. Ghana J Geograph. 11: 103–123.
Arragaw, A., Bewket, W., and Assen, M. (2020). Spatiotemporal variability and trends in rainfall and temperature in Alwero watershed, western Ethiopia. Environ. Syst. Res. 9, 2–6. doi: 10.1186/s40068-020-00184-3
Aryal, A., Maharjan, M., Talchabhadel, R., and Thapa, B. R. (2022). Characterizing meteorological droughts in Nepal: a comparative analysis of standardized precipitation index and rainfall anomaly index. Earth 3, 409–432. doi: 10.3390/earth3010025
Asfaw, A., Bantider, A., Simane, B., and Hassen, A. (2019). Smallholder farmers’ livelihood vulnerability to climate change-induced hazards: agroecology-based comparative analysis in northcentral Ethiopia (Woleka sub-basin). Heliyon 7:e06761. doi: 10.1016/j.heliyon.2021.e06761
Asfaw, A., Simane, B., Hassen, A., and Bantider, A. (2017). Variability and time series trend analysis of rainfall and temperature in northcentral Ethiopia: a case study in Woleka sub-basin. Weather Clim. Extrem. 19, 29–41. doi: 10.1016/j.wace.2017.12.002
Asravor, R. K. (2018). Livelihood diversification strategies to climate change among smallholder farmers in northern Ghana. J. Int. Dev. 30, 1318–1338. doi: 10.1002/jid.3330
Baffour-Ata, F, Antwi-agyei, P, Nkiaka, E, Dougill, AJ, Anning, AK, and Oppong, S. (2021). Effect of climate variability on yields of selected staple food crops in northern Ghana. J Agricul Food Res.
Bai, D., Ye, L., Yang, Z., and Wang, G. (2022). Impact of climate change on agricultural productivity: a combination of spatial Durbin model and entropy approaches. Intern J Clim Chnage Strateg Managem Emerald Pub. 16, 26–48.
Batho, P., Shaban, N., and Mwakaje, A. (2019). Impacts of rainfall and temperature variation on maize (Zea mays L.) yields: a case study of Mbeya region, Tanzania. Archiv. Agricul Environ Sci. 4, 177–184.
Bekuma Abdisa, T., Mamo Diga, G., and Regassa Tolessa, A. (2022). Impact of climate variability on rain-fed maize and sorghum yield among smallholder farmers. Cogent Food Agric. 8, 2–5. doi: 10.1080/23311932.2022.2057656
Belay, A., Demissie, T., Recha, J. W., Oludhe, C., Osano, P. M., Olaka, L. A., et al. (2021). Analysis of climate variability and trends in southern Ethiopia. Climate 9, 3–8. doi: 10.3390/cli9060096
Beltrán-Tolosa, L. M., Cruz-Garcia, G. S., Ocampo, J., Pradhan, P., and Quintero, M. (2022). Rural livelihood diversification is associated with lower vulnerability to climate change in the Andean-Amazon foothills. PLoS Clim. 1:e0000051. doi: 10.1371/journal.pclm.0000051
Chimdi, A. (2014). Assessment of the severity of acid saturations on soils collected from cultivated lands of East Wollega zone, Ethiopia. Sci. Technol. Arts Res. J. 3, 42–48. doi: 10.4314/star.v3i4.6
Dereje, H. (2023). Intensification of agriculture and the battle for land in the Angar-Didessa valley. Western 4, 14–25. doi: 10.31098/issues.v4i1.2124
Dereje, G, and Eshetu, A. (2011). Crops and agro-ecological zones of Ethiopia. p. 47. Available at: http://www.google.dk/url?sa=t&rct=j&q=&esrc=s&source=web&cd=1&ved=0CDQQFjAA&url=http://prrp-ethiopia.org/index.php/component/phocadownload/category/1-public-documents?download=51:crops-and-agro-ecological-zones-total-dereje-gorfu&ei=X91jUbLDFYH27AbBtYGgCg
Dinku, T., Hailemariam, K., Maidment, R., Tarnavsky, E., and Connor, S. (2014). Combined use of satellite estimates and rain gauge observations to generate high-quality historical rainfall time series over Ethiopia. Int. J. Climatol. 34, 2489–2504. doi: 10.1002/joc.3855
Dioumacor, Faye, Kaly, François, Dieng*, Abdou Lahat, and Wane, DahirouCheikh Modou Noreyni FALL ATG*Posted. (2023). Prediction of the onset and offset of the rainy season in Senegal prediction of the onset and offset of the rainy season in Senegal using Kohonen self-organizing maps. Preprint version.
Ellis, F. (1998). Household strategies and rural livelihood diversification. J. Dev. Stud. 35, 1–38. doi: 10.1080/00220389808422553
Ellis, F. (2000). The determinants of rural livelihood diversification in developing countries. Inst. Dev. Stud. 51, 289–302. doi: 10.1111/j.1477-9552.2000.tb01229.x
Ellis, F., and Freeman, H. A. (2004). Rural livelihoods and poverty reduction strategies in four African countries. J. Dev. Stud. 40, 1–30. doi: 10.1080/00220380410001673175
Esayas, B., Simane, B., Teferi, E., Ongoma, V., and Tefera, N. (2019). Climate variability and farmers’ perception in southern Ethiopia. Adv. Meteorol. 2019, 1–19. doi: 10.1155/2019/7341465
FAO (2016a). Diversification under climate variability as part of a CSA strategy in rural Zambia. J. Dev. Stud. 54, 457–480.
FAO. (2016b). Climate change and food security: risks and responses. Food and agriculture Organization of the United Nations. Available at: http://www.fao.org/3/a-i5188e.pdf
Focardi, S. M., and Fabozzi, F. J. (2020). Climate change and asset management. J. Portf. Manag. 46, 95–107. doi: 10.3905/jpm.2020.46.3.095
Gemechu, Y., and Woldetsadik Abshire, M. (2021). Spatio-temporal variability and trends in rainfall and temperature in anger watershed, southwestern Ethiopia. J. Appl. Geospatial. Inf. 5, 462–472. doi: 10.30871/jagi.v5i1.2825
Gemeda, D. O., Korecha, D., and Garedew, W. (2021). Evidences of climate change presences in the wettest parts of Southwest Ethiopia. Heliyon 7:e08009. doi: 10.1016/j.heliyon.2021.e08009
Gemeda, D. O., Korecha, D., and Garedew, W. (2023). Climate change perception and vulnerability assessment of the farming communities in the southwest parts of Ethiopia. Climate 11, 1–19. doi: 10.3390/cli11090183
Gocic, M., and Trajkovic, S. (2013). Analysis of changes in meteorological variables using Mann-Kendall and Sen’s slope estimator statistical tests in Serbia. Glob Planet Change 100, 172–182. doi: 10.1016/j.gloplacha.2012.10.014
Hanchane, M., Kessabi, R., Krakauer, N. Y., Sadiki, A., El Kassioui, J., and Aboubi, I. (2023). Performance evaluation of Terra climate monthly rainfall data after Bias correction in the Fes-Meknes region (Morocco). Climate 11, 1–8. doi: 10.3390/cli11060120
Hua, X., Yan, J., and Zhang, Y. (2017). Evaluating the role of livelihood assets in suitable livelihood strategies: protocol for anti-poverty policy in the eastern Tibetan. Ecol. Indic. 78, 62–74. doi: 10.1016/j.ecolind.2017.03.009
IMF. (2022). Climate change and chronic food insecurity in sub-Saharan Africa. African and research departments.
IPCC (2022a). Poverty, livelihoods and sustainable development. Climate change 2022: impacts, adaptation and vulnerability. Contribution of Working Group II to the Sixth Assessment Report of the Intergovernmental Panel on Climate Change, 1171–1274. doi: 10.1017/9781009325844.010
IPCC (2022b). Summary for policymakers: climate change 2022_ impacts, adaptation and Vulnerability_working group II contribution to the sixth assessment report of the Intergovernamental panel on climate change. Working group II contribution to the sixth assessment report of the Intergovernamental panel on climate change. Cambridge University press. 37.
Kalele, D. N., Ogara, W. O., Oludhe, C., and Onono, J. O. (2021). Climate change impacts and relevance of smallholder farmers’ response in arid and semi-arid lands in Kenya. Sci. African 12:e00814. doi: 10.1016/j.sciaf.2021.e00814
Maino, R., and Emrullahu, D. (2022). Climate change in Sub-Saharan Africa’s fragile. IMF Work Pap. 2022:1. doi: 10.5089/9798400204869.001
Mekonnen, A., Tessema, A., Ganewo, Z., and Haile, A. (2021). Climate change impacts on household food security and farmers adaptation strategies. J. Agric. Food Res. 6:100197. doi: 10.1016/j.jafr.2021.100197
Montoya, D, and Caro-lopera, FJ. (2021). Validation of the accuracy of the CHIRPS precipitation dataset at representing climate variability in a tropical mountainous region of South America. Physics and Chemistry of the earth.
Mulugeta, S., Fedler, C., and Ayana, M. (2019). Analysis of long-term trends of annual and seasonal rainfall in the Awash River basin, Ethiopia. Water 11. doi: 10.3390/w11071498
Muriuki, J., Hudson, D., and Fuad, S. (2023). The impact of conflict on food security: evidence from household data in Ethiopia and Malawi. Agric. Food Secur. 12, 1–20. doi: 10.1186/s40066-023-00447-z
Nicholson, S. E. (1985). Sub-Saharan Rainfall 1981-84. J. Clim. Appl. Meteorol. 24, 1388–1391. doi: 10.1175/1520-0450(1985)024<1388:SSR>2.0.CO;2
Salameh, A. A. M. (2024). Using the precipitation concentration index for characterizing the rainfall distribution in the Levant. J. Water Clim. Chang. 15, 1945–1960. doi: 10.2166/wcc.2024.037
Simane, B., Zaitchik, B. F., and Foltz, J. D. (2016). Agroecosystem specific climate vulnerability analysis: application of the livelihood vulnerability index to a tropical highland region. Mitig. Adapt. Strateg. Glob. Chang. 21, 39–65. doi: 10.1007/s11027-014-9568-1
Stern, R, Rijks, D, Dale, I, and Knock, J. (2006). INSTAT climatic guide. Stat Serv Centre, Univ Reading, UK. Available at: http://www.reading.ac.uk/SSC/media/ICRAF_2007-11-15/InStat/docs/climatic.pdf
Teka, B., Mamo, G., and Regassa, A. (2022). Variability and trends of climate in east Wollega zone, Western Ethiopia. IOP Conf. Ser. Earth Environ. Sci. 1016, 3–5.
Tolera, D. (2019). Food security and livelihood strategies of rural farm households with focus on female-headed households in Sasiga District, East Wollega Zone, PhD Dissertation addis ababa university Ethiopia, 273.
Tolera, M. (2023). The effects of violent civil conflicts on household security and government responses in East Wallaga zone, Oromia regional state. World J. Educ. Human. 5:p106. doi: 10.22158/wjeh.v5n3p106
Toma, T., Tolossa, D., and Uncha, A. (2022). Geography and sustainability impacts of livelihood assets on livelihood security in drought-prone Gamo lowlands of Southwest Ethiopia. Geogr Sustain. 3, 58–67. doi: 10.1016/j.geosus.2022.02.002
Vionnet, V., and Whitfield, P. H. (2020). Dataset for North America from 1979 to 2018. 3735534 (Earth System Science Data May), 1–39.
Keywords: CHIRPS, Precipitation Concentration Index, Rainfall Anomaly Index, regression, staple food crops
Citation: Kumsa DC, Tesso A and Tolera D (2024) Deciphering climate variability trends: unveiling the impact on household staple crop productivity in East Wallaga Zone, Ethiopia. Front. Clim. 6:1490248. doi: 10.3389/fclim.2024.1490248
Edited by:
Jose Antonio Rodriguez Martin, Instituto Nacional de Investigación y Tecnología Agroalimentaria (INIA), SpainReviewed by:
Manob Das, Ramananda College, IndiaSrikantha Herath, University of Peradeniya, Sri Lanka
Copyright © 2024 Kumsa, Tesso and Tolera. This is an open-access article distributed under the terms of the Creative Commons Attribution License (CC BY). The use, distribution or reproduction in other forums is permitted, provided the original author(s) and the copyright owner(s) are credited and that the original publication in this journal is cited, in accordance with accepted academic practice. No use, distribution or reproduction is permitted which does not comply with these terms.
*Correspondence: Dereje Chimdessa Kumsa, ZGVyZWplY2hpbWRlc3NhMTU2QGdtYWlsLmNvbQ==
 Dereje Chimdessa Kumsa
 Admassu Tesso2