 Aimie Moulin
 Lorenzo Mentaschi
 Emanuela Clementi
 Giorgia Verri
 Paola Mercogliano
95% of researchers rate our articles as excellent or good
Learn more about the work of our research integrity team to safeguard the quality of each article we publish.
Find out more
ORIGINAL RESEARCH article
Front. Clim. , 17 July 2024
Sec. Predictions and Projections
Volume 6 - 2024 | https://doi.org/10.3389/fclim.2024.1409237
This article is part of the Research Topic Coastal Climate Monitoring and Downscaling for Adaptation Planning in the Adriatic Sea View all 12 articles
Assessing the impact of climate change on wave conditions, including average and extreme waves, is vital for numerous marine-related activities, industries, coastal vulnerability, and marine habitats. Previous research, primarily on a large scale, has investigated this topic, but its relevance for marginal basins like the Adriatic Sea is limited due to the low resolution of the wave models used and atmospheric forcing. To contribute to filling in the gap, here we implemented a high-resolution model (about 2 km) for the period 1992–2050. The future wave climate is simulated for the RCP8.5 emission scenario. This model, developed within the AdriaClim project, comprises, among others, a high-resolution atmospheric downscaling, a circulation Limited Area Model and a spectral wave model. A comparison of our simulation's results with Copernicus Marine Service wave reanalysis on the historical baseline, confirms its accuracy in reproducing both average wave parameters and 95th percentile values, as well as the seasonal cycle, showing the AdriaClim model's suitability as a source to predict future wave climates in the Adriatic Sea. The projected changes suggest a slight increase in average significant wave height and mean wave period, and a more significant decrease at the 95th percentile, with a relevant variability by location and season, partially aligning with previous studies. This study highlights the potential effect of local climate change in coastal areas and the importance of developing long-term simulation with a downscaled modeling system for regional areas.
The Adriatic Sea is an elongated, semi-enclosed basin located in the Central North area of the Mediterranean Sea. It is connected to the Mediterranean Sea through the Otranto Strait at its Southeast boundary. The Adriatic Sea extends mostly from the Northwest to Southeast direction, from the shallow Gulf of Venice with a mild bottom to the Strait of Otranto, where the bathymetry is strongly marked with maximum water depths of up to 1,200 m (Figure 1).
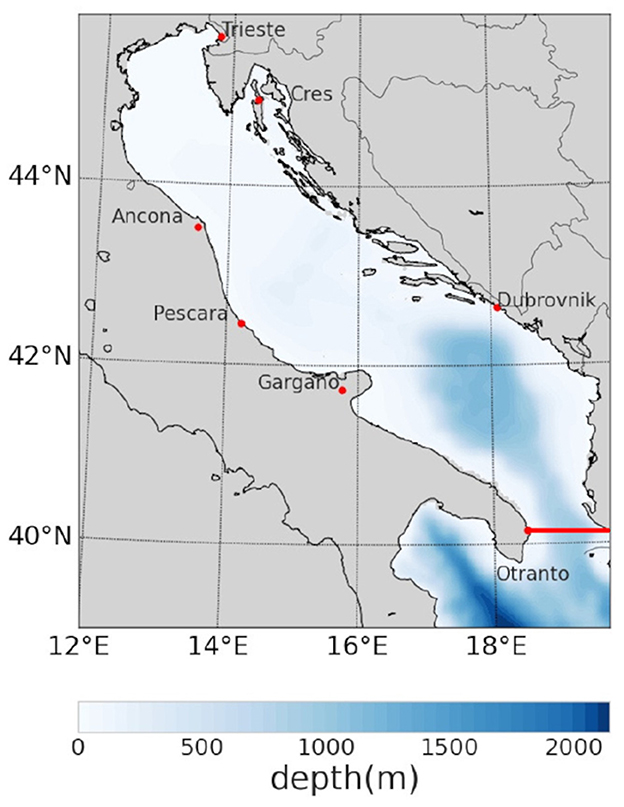
Figure 1. Wave model domain and bathymetry. The red line delimits the Adriatic area we are considering for the analysis in this paper.
The Adriatic Sea represents an important source of food, ecosystem services, and economic activities for the surrounding countries in the region (e.g., oil and gas, fishing, aquaculture, shipping, tourism, and offshore wind energy). This region is both a popular location for maritime tourism and a place with a high number of offshore and coastal industrial activities. In the last decade, the exploitation of various types of marine resources has increased. The area has recently gained greater strategic significance and is considered a site for massive Liquefied Natural Gas and oil terminals. The first offshore Gravity Based Structure was constructed in 2008 in the Northern Adriatic (Malacic et al., 2008).
While aiming to achieve quality, safe, and sustainable exploitation in all economic sectors that are dependent on sea resources, it is necessary to have a deep understanding of its local climate. The Mediterranean Sea represents one of the most exposed zones in the world to the impacts of global warming and is characterized as a hotspot of climate change in the 2022 IPCC (Ali et al., 2022). According to PNACC (2023) issued in 2017, following the Representative Concentration Pathway scenario RCP 8.5 (Van Vuuren et al., 2011) the Adriatic Sea will not be spared, and it is supposed to experience major climate changes. Some studies point out an increase in sea surface temperature of about 1.5 Celsius degrees, an increase in sea level up to 7cm leading to coastal erosion, and an expected increase in salinity by the year 2050 (Calafat et al., 2022; Parras-Berrocal et al., 2023). Regional future climate projections in this area are considered to be of the utmost importance. The AdriaClim project (https://www.italy-croatia.eu/web/adriaclim) has been launched in order to address climate change threats at local scales by developing a sub-regional to local climate downscaling strategy that provides a comprehensive representation of the local water cycle (Giorgia et al., 2024) and may serve site-specific adaptation plans. The present study is part of this project, and it focuses on the wave climate change.
Changes in the atmospheric circulation caused by global warming may lead to significant modifications in wave dynamics, thereby triggering possibly serious sea disasters. At the same time, wind waves are a fundamental element in the air-sea interaction that modulates the overall large-scale behavior and highly contributes to the modulation of the exchanges at the atmosphere-ocean interface (Cavaleri et al., 2012). The wind waves and the associated processes like the breaking wave play important roles in local and global climate change by affecting the near-surface turbulence and the fluxes of momentum (Ayet et al., 2020), heat, and gases (Blomquist et al., 2017; Deike and Melville, 2018) through the air-sea boundary. Given their significant environmental, geophysical, and socioeconomic impacts, the assessment of the wave state and its spatio-temporal variability in the context of regional climate change is of crucial importance. One challenge consists in understanding the variability of the wave characteristics (i.e., averages, and extremes) at a very high resolution and over multiple time scales (seasonal, annual, and decadal). It is key to assist decision-makers with climate adaptation and mitigation strategies to reduce the impact of climate change on the local economy and environment.
Due to its location enclosed by mountains, the Adriatic Sea experiences a specific wind-wave climate. It is mainly exposed to two different regional winds, the so-called Bora and Sirocco (Cavaleri et al., 1997a,b). The first one, is a North-easterly wind that blows on the North Adriatic coast, producing jets over the sea after interacting with the local orography (the Dinaric Alps in Croatia). The Bora is most common during the winter and can suddenly attain very high speeds (up to 30 m/s). Because of the narrow width of the Adriatic Sea, the derived waves are fetch-limited and usually not very large (Signell et al., 2005). The second one is a Southerly wind that typically occurs during the spring-autumn period of the year. Even if it is generally less intense than Bora, Sirocco wind is channeled into the Adriatic basin. It can generate high waves in the Adriatic and contributes to the intense storm surges that take place in the Venice lagoon (Cavaleri et al., 2019). Sirocco is also often associated with coastal flooding in the entire basin (Medugorac et al., 2015). Indeed, because of its direction, Sirocco is less fetch-limited than Bora and is therefore characterized by progressive growth of the wave along the Adriatic Sea (Signell et al., 2005). Outside those orographic winds, the Adriatic Sea is also frequently exposed to cyclonic activities and medicane (Bignami et al., 2007; Lionello et al., 2012) and can generate high waves.
In the past decades, statistical analyses of waves in the Adriatic Sea have mostly been based on gathered satellite observations and occasional buoy measurements. The development of numerical models allows for filling in the gaps in existing observations and provides an overview of the future climate over the region. Many studies (Young et al., 2011; Hemer et al., 2013; Mentaschi et al., 2017) have been done on the present and future changes of wave climate and their consequences; however, they lack the spatial resolution, and suitable atmospheric forcing field, for a comprehensive analysis at a regional scale.
The IPCC et al. (2021) mentioned that currently the confidence in the projected changes in winds and waves in the Mediterranean Sea is limited by the quality of climate models (Calafat and et al., 2014; Androulidakis et al., 2015; Vousdoukas et al., 2017). Pullen et al. (2003) and Signell et al. (2005) have highlighted the relevance of using high-spatial-resolution wind inputs to correctly reproduce the circulation patterns in the Adriatic Sea, especially those generated by transient wind. This would also apply to wave models, as their qualities fully depend on the wind forcing quality. Other studies (Bricheno et al., 2013; Menendez et al., 2014) showed that improved accuracy is achieved in the circulation and wave dynamics, owing to the regional downscaling (higher spatial resolution) of wind forcing. In fact, wind speed changes are not only caused by changes in large-scale pressure conditions and models with high resolution are needed to accurately reproduce highly variable wind in regional areas with complex orography and geography, like the Mediterranean and Adriatic Seas. At the same time, a lack of resolution in the representation of the complex orographic and bathymetric features in basins like the Adriatic Sea can lead to larger errors in the wave modeling (Ardhuin et al., 2007; Mentaschi et al., 2015; Clementi et al., 2017).
Although some numerical studies (Lionello and Sanna, 2005; Lionello et al., 2008; Pomaro et al., 2017; Katalinić and Parunov, 2018; Caloiero and Aristodemo, 2021) assessed the trend behavior in the regional Mediterranean Sea and the Adriatic sub-basins, these analyses are performed only for the historical period and at a low resolution. Future projection scenario systems are necessary to face adverse climate change impacts. Few studies (Benetazzo et al., 2012; Bonaldo et al., 2017, 2020; De Leo et al., 2021) have performed simulations on the future wave climate up to the end of the 21st century, for different scenarios in the Adriatic Sea. They mainly show a weak wave climate change with an average slight decrease in the wave conditions. Positive trends are scattered over isolated spots. It is worthwhile noting that these studies are done over a long period of time and focus on the inter-annual variability and do not take into account the intra-annual variability, which is quite pronounced in the Adriatic Sea. Moreover, a 1–2 km resolution is required to solve the mesoscale processes of the Adriatic Sea through all seasons and across its sub-basins, as well as to capture the air-sea interactions occurring at these scales and the water exchange through the Otranto Strait.
Current studies on climate changes are relatively low resolution (>8 km) for both waves and atmospheric forcing. As detailed previously, higher resolution in wind forcing and waves is necessary in a small basin such as the Adriatic Sea. To contribute to filling the gap, a high-resolution AdriaClim limited area multimodel (LAM) is developed in order to draw conclusions on the potential effects of the wind speed changes on the significant wave height and mean wave period trend. This paper is organized as follows. First, a description of the AdriaClim ocean-atmosphere system is provided, as well as details about the implementation of the regional wave model and the statistical indicators. In order to assess the reliability of the simulation, we compare a 20-year historical window from the ADRIACLIM regional wave climate model to the wave reanalysis from the Copernicus Marine Service (Copernicus Marine Service, 2023). We provide an overview of the historical wind-wave characteristics in the Adriatic Sea. Then, analyses in the projection period simulation are provided to assess spatial and seasonal trends in the Adriatic Sea. Finally, some conclusions are drawn, and suggestions for future studies are discussed.
A LAM is specifically designed within the AdriaClim project, to address mesoscale processes in the Adriatic Sea. It is composed of six earth modeling components: the atmosphere (WRF), the land surface (NOAH), the hydrology (WRFHydro), the hydrodynamics (NEMO), the waves (WW3) and the biogeochemistry (BFM). The climate downscaling process utilizes the Regional Climate Model provided by the Med-CORDEX coordinated initiative (Ruti et al., 2016), specifically the LMDz-NEMOMED system (L'Heveder et al., 2013), as forcing (initial and boundary conditions). The RCP 8.5 scenario considered the most extreme in the IPCC report (Van Vuuren et al., 2011), is selected as the greenhouse gases pathway for the future period.
The LAM components are coupled in a one-way mode. The atmosphere covers a domain over the Central Mediterranean Sea with a 6km horizontal resolution, and the output fields are 6 hourly. The atmospheric WRF near surface fields are bias corrected to force the marine and wave components in a more trustworthy way. The hydrodynamics component covers a smaller area over the Adriatic Sea, with around 2km horizontal resolution (Figure 1). The hydrodynamics output fields are 3 hourly at the sea surface and daily over the water column.
All details regarding the model sensitivity and the evaluation of the preprocessing, running, and post-processing phases of the climate downscaling are documented in the AdriaClim Project database. Further analysis of the AdriaClim LAM performance, as well as the assessment of past and future climates in the Adriatic region, with a focus on the air-land-sea components, can be found in Fedele et al. (2024), Giorgia et al. (2024), and Mentaschi et al. (2024).
A regional configuration of the third-generation spectral wave model WaveWatch III (hereinafter WW3) version 6.07 is implemented over the Adriatic Sea. It covers the domain from 39 to 45.87 degrees North and from 12 to 20.98 degrees West (Figure 1), as the hydrodynamic component. For this study, the model has a high horizontal resolution of 1/48°.
The wave model uses 36 equally distributed directional bins (10° directional resolution) and 30 frequency bins ranging from 0.05Hz (corresponding to a period of 20s) to 0.79Hz (corresponding to a period of about 1.25s). The global time step of the model is 180s in order to respect the Courant Friedrichs Lewy (CFL) stability criterion. The Southern boundary is closed, so swells coming from the Ionian Sea are not entering the domain. This assumption has already been used in various studies focusing on the Adriatic Sea wave dynamics, as for example Benetazzo et al. (2012). To minimize the impact of the closed boundary, we extend the domain Southward into the Ionian Sea. However, only the area North of the Otranto Strait is considered for the following analysis.
To propagate waves, WW3 solves the random-phase spectral action density balance equation for wave number direction spectra (Tolman, 1991; WW3DG, 2019). In the present application, WW3 is implemented using the third-order Ultimate Quickest propagation scheme (PR3 + UQ) with the Garden Sprinkler correction. This configuration uses WAM cycle 4 (ST3) which is based on the wave growth theory of Miles (1957) and modified by Gunther and Hasselmann (1993). Wind input and dissipation terms are based on Janssen's quasi-linear theory of wind-wave generation (Janssen, 1989, 1991): the surface waves extract momentum from the airflow, and therefore the stress in the surface layer depends on both wind speed and wave-induced stress. Non-linear wave-wave interaction is modeled using the Discrete Interaction Approximation (DIA, Hasselmann and Hasselmann, 1985). The wave model also incorporates the surface breaking parameterization (DB1) proposed by Battjes and Janssen (1978) and the JONSWAP bottom friction formulation (BT1; Hasselmann et al., 1973) to represent shallow water wave energy dissipation.
The bottom topography and coastlines are the same as used in the NEMO simulations (Giorgia et al., 2024).
WW3 is forced with the 10-m horizontal wind components provided every 6 h by the AdriaClim WRF model. Simulations are performed using the daily ocean currents components at 1/48 horizontal degree resolution from NEMO. These fields are described in the previous section.
Two time slices, 1992–2011 and 2031–2050, have been extracted from the AdriaClim climate simulations to evaluate past and future climate. As mentioned previously, the part of the domain South of Otranto (40° 13'6.00 N 18° 55'19.19 E) is not considered in this study (Figure 1).
The integrated wave parameters, such as the significant wave height (Hs) and the mean wave period (Tm) are saved for every grid point at a 3-hourly rate, along with other variables, over the whole Adriatic Sea. The projection simulation provides, for the first time, a high-resolution wave future climate dataset for the entire Adriatic Sea. In the following, typical and extreme sea-state conditions are respectively assessed using statistical parameters, including the mean, the monthly 95th percentile (P95m), and the annual 95th percentile (P95y) for Hs and Tm. The associated standard deviation is calculated in order to evaluate the amount of variation that the selected variable is expected to have in relation to its mean or 95th percentile.
The annual, mean and 95th percentile, are computed using the annual empirical distribution of the selected quantities, at each grid point, for each year. Full-period statistics are then computed by averaging these statistics over all years within the historical or projection period.
The monthly mean and 95th percentiles and their associated standard deviation are computed using the monthly empirical distribution of the selected quantities, at each grid point, for each year. This process results in a 2D field for each statistical indicator, for each month and each year. Monthly statistics are subsequently averaged for each month of the year over the 20-year period. Additionally, seasonal statistics are computed for the summer and winter periods, using the average December January February (DJF) and June July August (JJA), respectively.
In this study, the trends are evaluated using the Mann-Kendall Test (Mann, 1945; Kendall, 1955) and the magnitude of the linear trend is quantified through the Theil–Sen's (Sen, 1968; Theil, 1992) slope estimator. This method is commonly employed to quantify the significance of trends in meteorological time series (Subash et al., 2011; Tabari et al., 2011; Duhan and Pandey, 2013) and wave climate change (De Leo et al., 2020; De Leo et al., 2021; Caloiero and Aristodemo, 2021).
The Mann-Kendall Test is a non-parametric statistical test used to determine whether a time series has a monotonic upward or downward trend. One advantage of the Mann-Kendall test over linear regression for trend analysis is its ability to detect trends even in the presence of non-linear relationships or outliers, making it more robust and applicable to climatological dataset. It analyzes the sign of the difference between later-measured value and all earlier-measured values. The statistic test, denoted S, is then computed as the sum of the integer following the Equation (1):
where, n is the number of data points in the time series, xi and xj are the values of the time series at time points i and j, respectively. When S is a large positive number, later-measured values tend to be larger than earlier values and an upward trend is indicated. When S is a large negative number, later values tend to be smaller than earlier values and a downward trend is indicated. When the absolute value of S is small, no trend is indicated. Once S is calculated, Kendall's Tau (τ) can be obtained by dividing S by the number of possible pairs of data points as defined in Equation (2):
Kendall's Tau ranges from –1 to 1, and is analogous to the correlation coefficient in regression analysis. τ = 1 indicates a perfect increasing monotonic trend, τ = 1 indicates a perfect decreasing monotonic trend, τ = 0 indicates no monotonic trend (i.e., randomness). The statistical significance level (p-value) of the Kendall's Tau trend is assessed assuming the null hypothesis (no trend) is true. If the p-value is below a chosen significance level (here 0.1), the trend is considered statistically significant. Here, the computation is performed through the Python package provided by Hussain and Mahmud (2019). For the annual trend, the Seasonal Mann-Kendall test is used to remove the effect of seasonality. If a significant trend is found, the rate of change is calculated using the Theil-Sen's slope estimator which provide a reliable estimate of the trend even in the presence of noisy data unlike ordinary least squares regression. It is particularly useful when dealing with climatological data where outliers and non-linear relationships may be present. The formula for calculating Theil-Sen's slope involves calculating the median of the slopes of all possible pairs of points in the data set (Equation (3)).
The first part of this study assesses the ADRIACLIM wave climate high-resolution model reliability in reproducing realistic climatologies on the baseline.
In order to evaluate the quality of the ADRIACLIM wave climate model, historical outputs of significant wave height (Hs) and mean wave period (Tm) are compared with the wave reanalysis product of the Mediterranean Sea (Copernicus Marine Service, 2023) from the E.U. Copernicus Marine Service over the period 1993–2011.
The reanalysis dataset is composed of hourly wave fields at 1/24° horizontal resolution. The modeling system is based on the WAM 4.6.2 wave model which resolves the prognostic part of the wave spectrum with 24 directional and 32 logarithmically distributed frequency bins. This system includes an optimal interpolation assimilation scheme that ingests significant wave height along-track satellite observations. Additionally, it is forced with daily averaged currents from the Copernicus Physical Reanalysis Mediterranean Sea Product (Escudier et al., 2021) and with 1-h, 0.25° horizontal-resolution ERA5 reanalysis 10m-above sea-surface winds from ECMWF. Nowadays, this product is considered as the best reference for the region.
The first analysis examines the spatially averaged statistics for the full historical period. The mean values for Hs and Tm from the ADRIACLIM wave model are similar to those from the reanalysis dataset. Indeed, Hs=0.62 m and Tm=3.5s for the ADRIACLIM wave model, whereas Hs=0.61 m and Tm=3.7s for the Copernicus reanalysis product. The time-averaged P95y for the ADRIACLIM wave dataset is Hs=1.55 m which is comparable to the Hs=1.54 m of the Copernicus Marine System dataset, whereas the ADRIACLIM Tm=5s is lower than the Tm=5.6s in the Copernicus Marine System dataset.
Figure 2 shows the monthly mean (circles) and P95m (triangle) of Hs and Tm (Figures 2A, B) computed for ADRIACLIM wave model (dark) and WAVEREA (red) and averaged over the entire Adriatic Sea and the full period. As expected, both datasets exhibit variability in waves throughout the year, with higher and longer waves occurring in winter compared to summer. Even though the mean and P95m of Hs are slightly underestimated during Autumn, the ADRIACLIM wave model accurately reproduces the Hs annual variability. Both the mean and the P95m show a maximum of Hs for months between December and March. In the ADRIACLIM wave model, the mean Hs reaches a maximum of around 0.81 m in winter and a minimum of 0.40 m in summer. The inter-annual variability is much higher in winter than in summer and is higher for the P95m than for the average values. The amplitude of the annual cycle is more pronounced for the P95m, ranging from 0.88 m in summer to over twice that value (1.9 m) in winter. The underestimation of Hs in Autumn is attributed to an underestimation of the wave generated by Sirocco due to the closed boundary. This underestimation has also been observed at the ISMAR-CNR location in Benetazzo et al. (2012), which also has a closed boundary at Otranto. Concerning Tm (Figure 2B), an annual cycle is also observed for both the mean and the P95m. As for Hs, the smallest values are found during summer, and the longest periods occur in winter. The monthly mean and maxima are comprised between 3 and 6.2s indicating young wind-sea conditions. Tm values from the ADRIACLIM wave model capture the annual cycle well, even if the period is underestimated for all months for the 95th percentile and all months except summer for the mean. It is a consequence of the closed boundary, which leads to neglecting the swell entering from the South. It is worth noting that the differences in the monthly mean are less than 0.4s, which is relatively low. Overall, these results are consistent with Farkas et al. (2016) who concluded, using the World Waves Atlas, that the most likely sea state in the Adriatic is described by a significant wave height between 0.5 and 1m and a peak period between 3 and 4s.
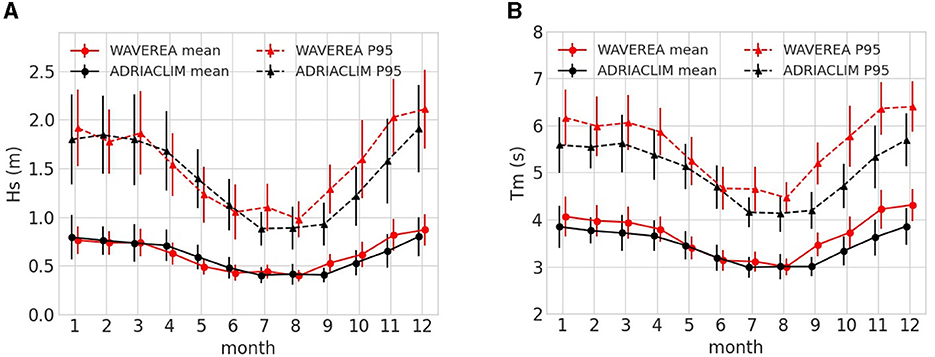
Figure 2. Monthly mean and 95th percentile of the significant wave height (A) and the mean period (B) for the Copernicus Marine Service dataset (red) and the ADRIACLIM model output (dark). The averaging is over the whole Adriatic domain and full temporal period. The vertical lines represent the standard deviation. For graphic purposes, WAVEREA and ADRIACLIM wave model results are slightly horizontally shifted.
Figure 3 shows the spatial distribution of the Hs historical mean and P95y from ADRIACLIM wave model (Figure 3A) and WAVEREA (Figure 3B). Noticed that the color bars are set differently for the mean and the 95th percentile to provide a better representation. However, the two simulations have some little differences, the historical wave spatial patterns for mean and extreme conditions are well reproduced by the ADRIACLIM wave model. Due to the swell coming from the Mediterranean Sea, a more elongated pattern is observed, in the South, in WAVEREA. In both models, the mean sea state remains below 0.85 m across the entire domain. The extreme significant wave heights reach up to 2.34 m close to the Otranto Strait and progressively decrease toward the Northwest of the Adriatic Sea, following the bathymetric pattern (Figure 1).
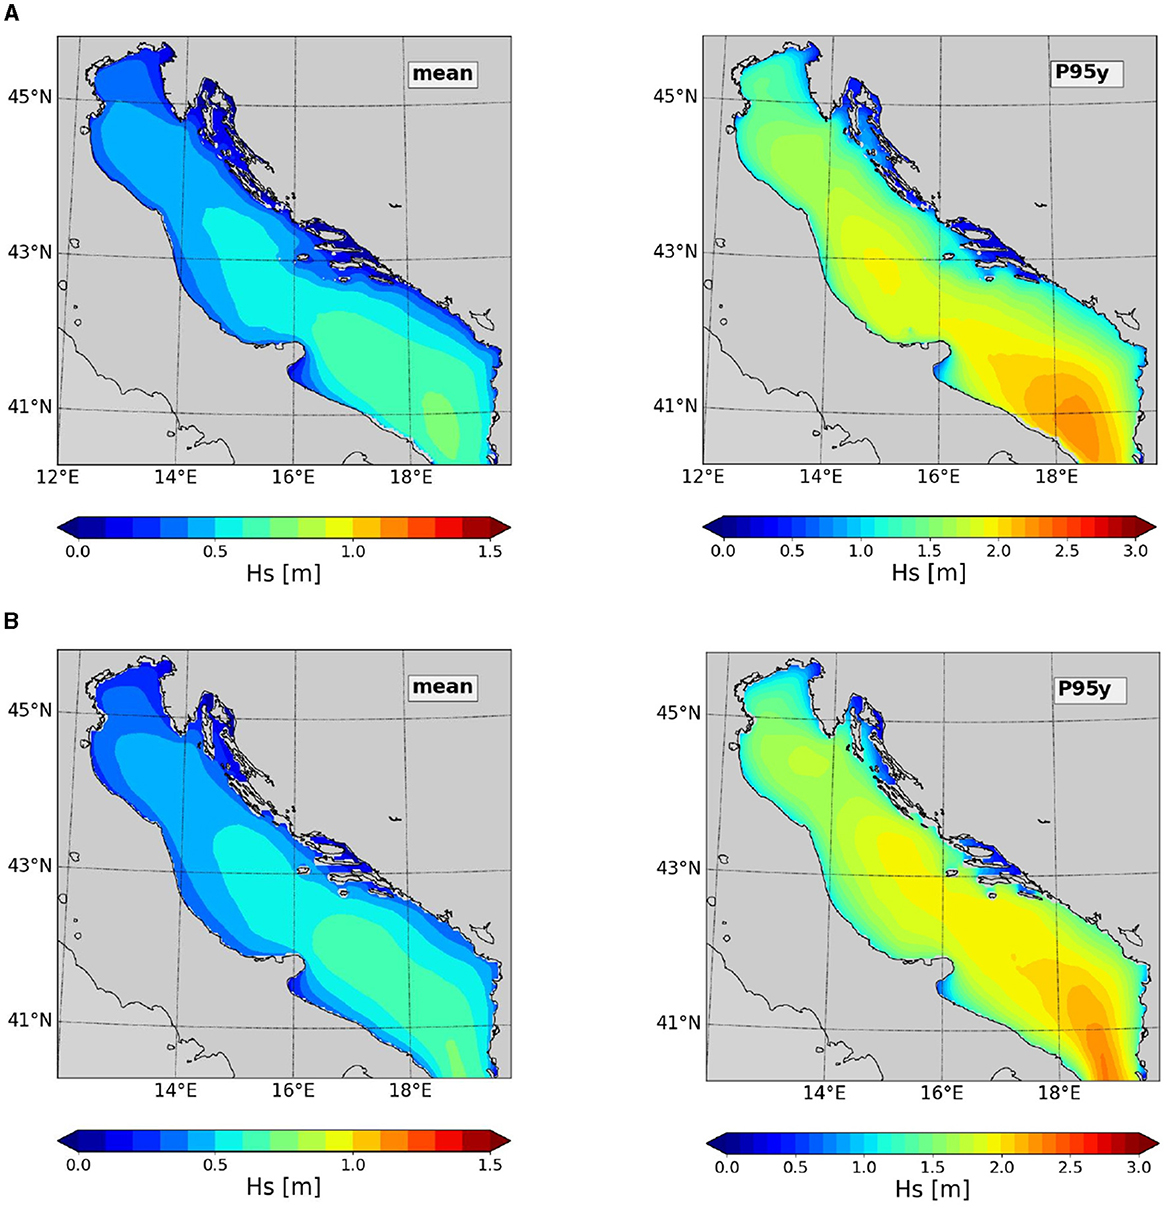
Figure 3. Historical climatology of the mean and annual 95th percentile of Hs(m) from (A) ADRIACLIM wave and (B) WAVEREA models. Colorbars are different for the mean and the 95th percentile.
For the following, the source of intrinsic intra-annual variability due to seasonality is removed by taking separately into account the different seasons, as done for instance by Morales-Márquez et al. (2020) and Barbariol et al. (2021). The results of this paper (climatology and future climate change), focus on the two most representative seasons, which are winter and summer. As seen previously, the winter is characterized by higher waves with larger periods. It is also the season of Bora events in the Northern region. Summer, from June to August, is characterized by a weak wave signal associated with low wind conditions. The spring and autumn seasons are characterized by intermediate conditions.
Figure 4 illustrates the seasonal climatology of the mean Hs and Tm from ADRIACLIM wave model (Figure 4A) and WAVEREA (Figure 4B) for winter (DJF) and summer (JJA). Some differences are observed, mainly in the South, due to an underestimation of the swell coming from the Ionian Sea in the ADRIACLIM simulations. Nonetheless, the ADRIACLIM wave climate model is able to reproduce on average the spatial patterns of the different seasons. Both in summer and winter, the highest averages of Hs and Tm are observed in the Southern extremity. Conversely, the lowest values of the mean Hs and Tm are observed along the Eastern coast from Croatia to the Gulf of Trieste and in the bay South of the Gargano peninsula. Differences between ADRIACLIM and WAVEREA are lower than 0.12 m during both seasons. During winter, the Hs mean grows up to 1.23 m, whereas waves remain relatively low throughout the domain during summer (below 0.65 m). For the mean Tm, the longest values are observed along the Southeast side, beyond 18 degrees East. Values are decreasing Northward and Eastward. As for the mean Hs, the shortest periods are located between the Croatian coast and the Gulf of Trieste. In the ADRIACLIM wave model, the mean Tm never exceeds 4.5s, while it reaches up to 5.2s in the reanalysis product at the Southern extremity in winter. During summer, the averages of Tm in both datasets do not become longer than 3.7s. Differences between the ADRIACLIM wave model and WAVEREA are usually lower than 0.5s unless for a small area in the extreme Southeast, where differences become around 1s. In winter, the Southern region is exposed to already-formed waves entering from the Mediterranean through the Otranto Strait. As expected, due to the closed boundary, the ADRIACLIM wave model underestimates the mean Hs and Tm model underestimates the mean Hs and Tm. Small differences with respect to WAVEREA in coastal and Northern areas are observed and can be attributed to the better representation of regional winds by the ADRIACLIM wave model.
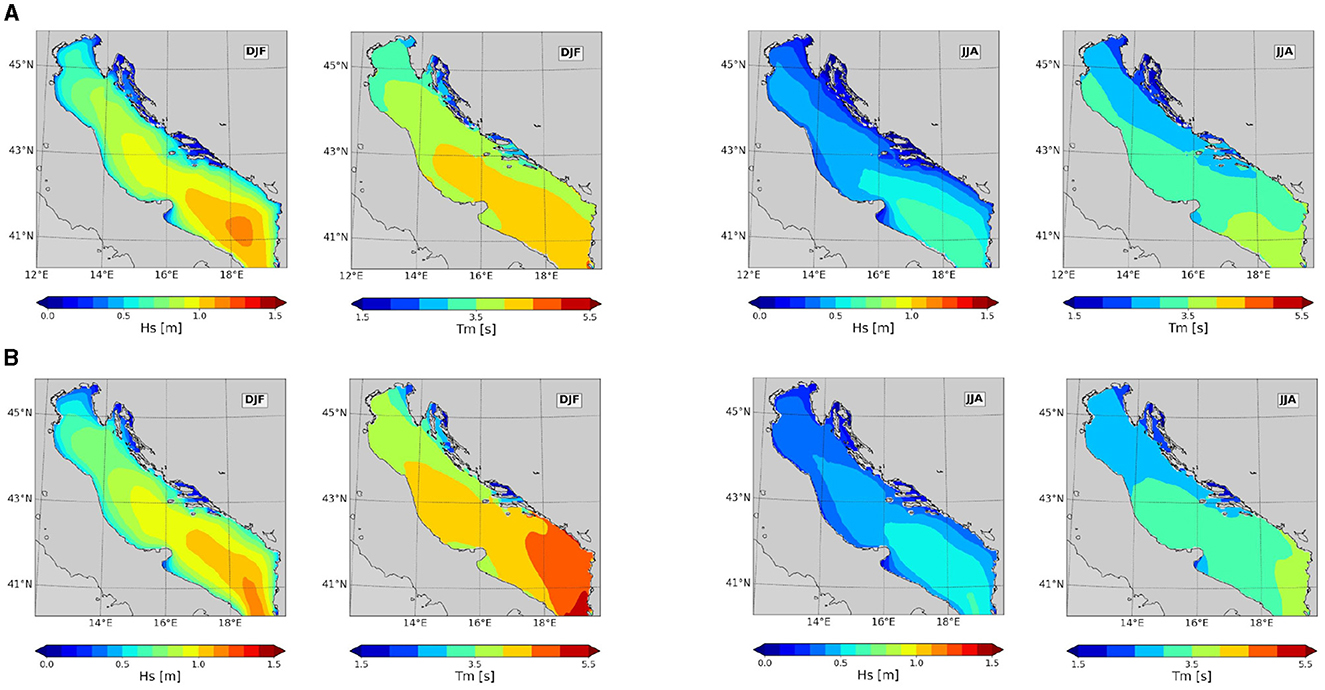
Figure 4. Historical seasonal climatology of the mean of Hs(m) and Tm(s) from (A) ADRIACLIM wave and (B) WAVEREA models.
When looking at the extremes (Figure 5), as expected values are higher with respect to the climatology, and the spatial patterns for Hs and Tm slightly differ from the average fields. The highest values are still in the Southern part, but some structures of extreme events appear near 43 degrees North in winter and around 44.5 degrees North in summer. These extreme conditions can be attributed to the Bora winds and have already been identified by Barbariol et al. (2021). The extreme values in ADRIACLIM wave model are slightly displaced toward the Southwest in comparison to WAVEREA. It can be attributed to differences in the swell and a more accurate representation of the Bora jets in the ADRIACLIM wave system. The highest Hs is observed in winter in the South and is up to 2.64m in ADRIACLIM wave model and up to 2.72 m in WAVEREA, as a consequence of the South wind and Mediterranean storms. The 95th percentile of Hs is usually about two to three times the mean condition, and up to four times greater in the Northern part and during the summer. Concerning Tm, the 95th percentile statistic puts longer waves as the swell in the spotlight and emphasizes that swell is not overcoming in the ADRIACLIM wave simulation. The largest underestimations are right beyond the Southern boundary on the Eastern side. The signal propagates northward, and differences are observed in all the basin, but in the central Adriatic Sea, differences are less than half a second. The lowest differences are observed in the North and during the summer. Differences can be noticed close to the coast and around Croatian islands; they can again be explained by the higher resolution of the ADRIACLIM wave model and the forcing winds.
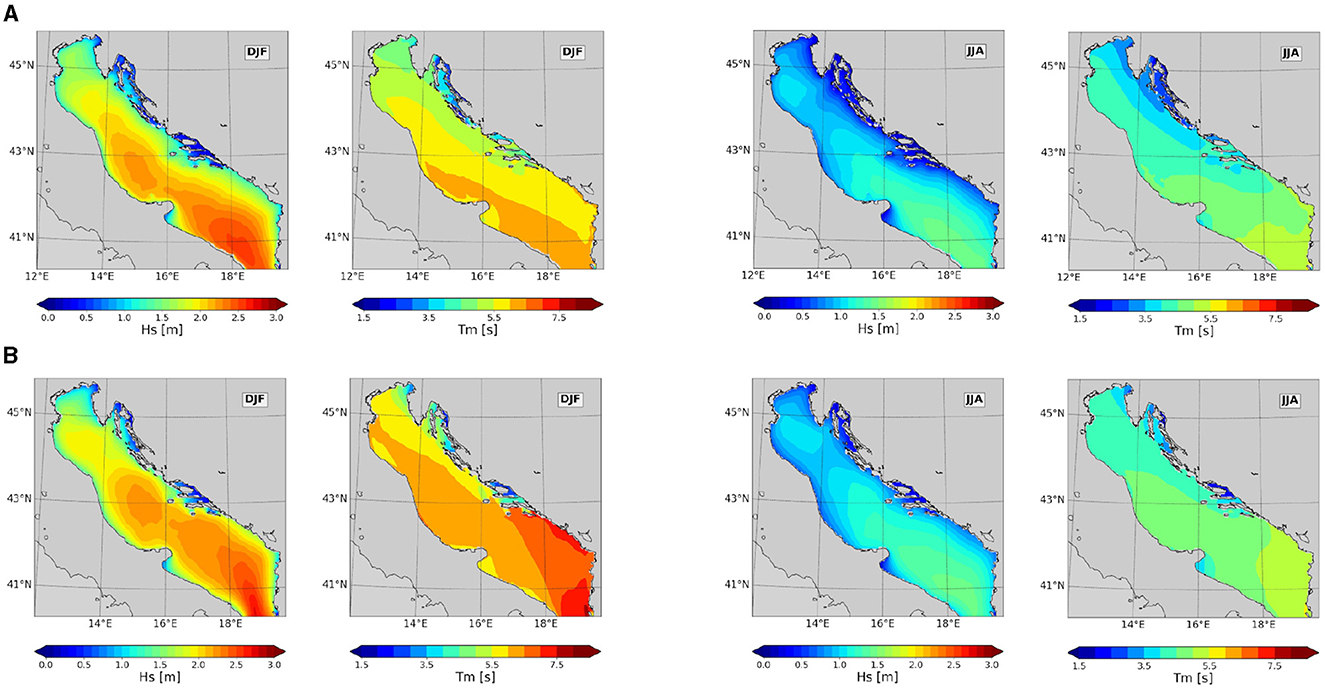
Figure 5. Historical seasonal climatology of the 95th percentile of Hs(m) and Tm(s) from (A) ADRIACLIM wave and (B) WAVEREA models.
Altogether, these results point out the ability of the ADRIACLIM wave climate model to reasonably reproduce the annual cycle features and the seasonal spatial patterns of Hs and Tm for both mean and extreme wave conditions. The ADRIACLIM wave model has proved its ability to reproduce past reconstruction on a monthly climatological and seasonal scale, thus serving as a reliable source to derive future wave climates and to assess the general trends and changes of the average conditions in the Adriatic Sea.
This subsection focuses on the assessment of the wave climate change between the historical and midterm projection periods.
As for the historical period, we calculate the spatially averaged statistics over the full projection period. The Hs values from the projection period are almost identical to the values from the historical period (< 2% differences), with a very slight increase of Hs in mean and extreme conditions. Indeed, the Hs mean is equal to 62 cm instead of 61 cm (Figure 6) and the P95y is 1.56 m instead of 1.55 m. Concerning the mean wave period, the values are the same, i.e., 3.5s for the mean and 5s for the 95th percentiles.
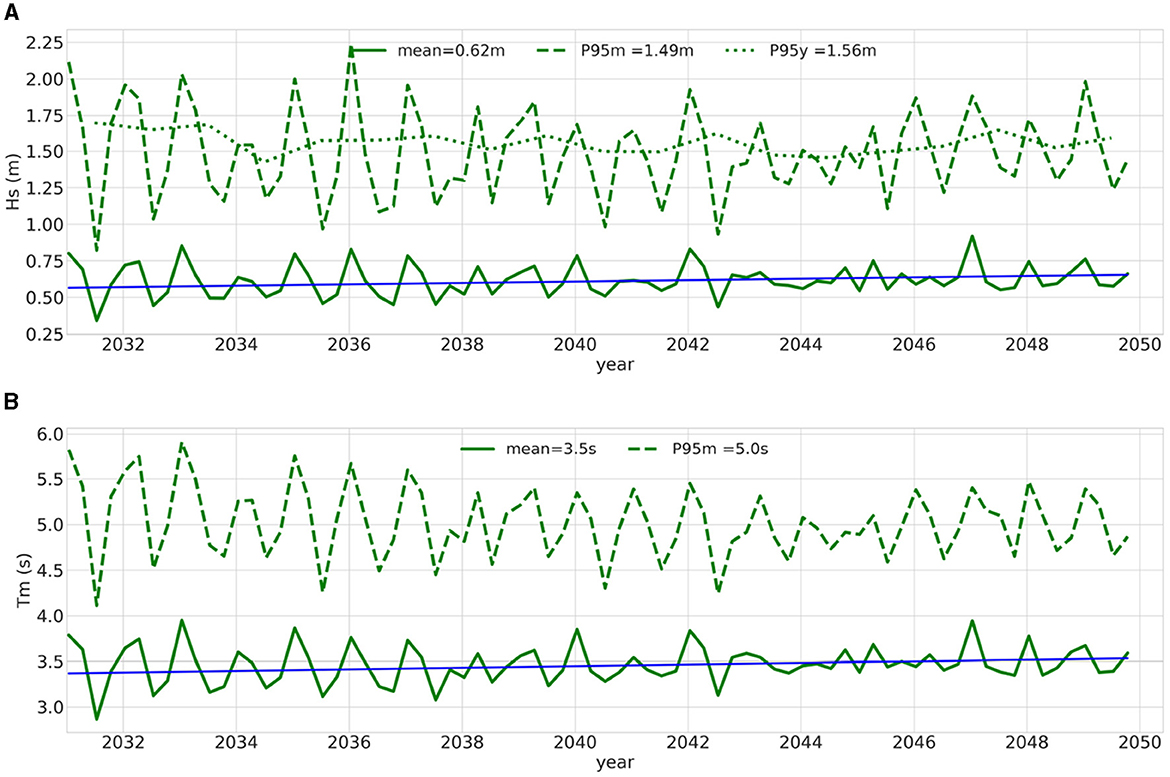
Figure 6. Hs (A) and Tm (B) 20-year projection period time-series integrated over the Adriatic Sea for the seasonal mean (full line), the seasonal 95th percentile (dash lines) and the annual 95th percentile (dot line). The blue line represents the significant trends.
Even if the full period average is the same, the monthly climatologies reveal differences in representing the annual cycle (Figure 7). Hs and Tm monthly climatologies for the projection period have a similar pattern to those from the historical period, characterized by lower wave conditions in summer and higher and longer waves in winter, albeit less pronounced. Indeed, from May to October, both Hs and Tm are higher, whereas the remaining months show lower values for both mean and 95th percentile compared to the historical period.
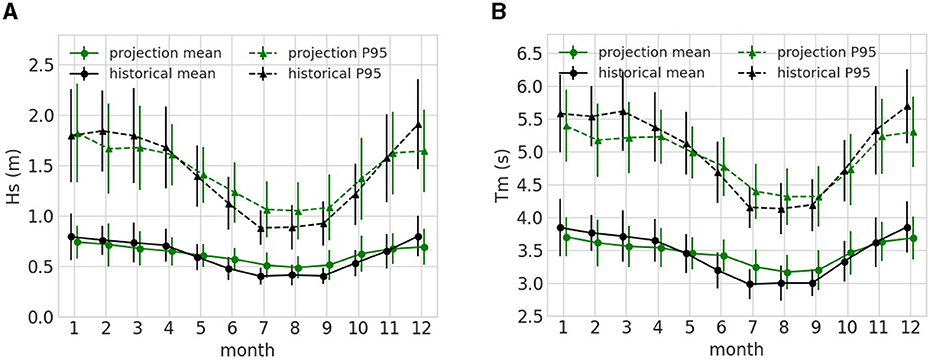
Figure 7. Monthly mean and 95th percentile of the significant wave height (A) and the mean period (B) averaged for the historical (dark) and projection (green) period. The averaging is over the whole Adriatic domain and full temporal period. The vertical lines represent the standard deviation. For graphic purposes, the data are slightly horizontally shifted.
The reduction of the mean Hs in winter is observed in past studies using a different future scenario, Benetazzo et al. (2012) even if the authors find that changes lie in the inter-annual variability of the wave values. The correlation between waves and local wind fields is very high in semi-enclosed basins, such as the Adriatic Sea. As expected, variations in the monthly wave conditions are directly related to the local wind changes, which present a decrease in speed in winter and an increase in summer (Figure 8).
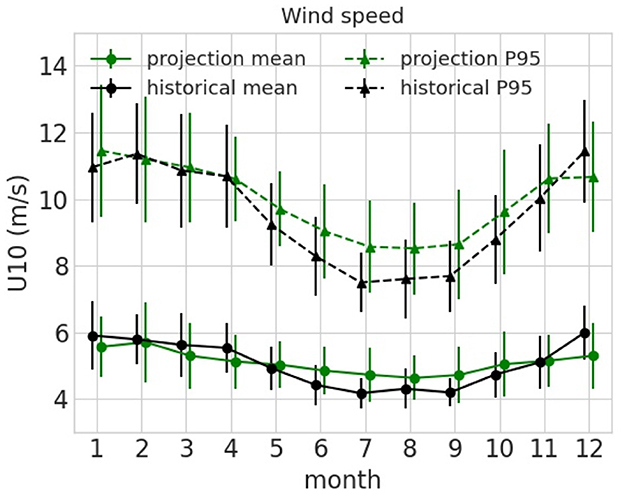
Figure 8. Monthly mean and 95th percentile of the wind speed, averaged for the historical (dark) and projection (green) period. The vertical lines represent the standard deviation. For graphic purposes, the data are slightly horizontally shifted.
The following part focuses on the spatial variability of the wave climate in future projections. Figure 9A depicts the spatial differences in the 20-year average of the midterm projection and the historical period for Hs and Tm. Hs and Tm differences are small in the open sea. However, the projection indicates higher and longer waves on the Western side, whereas the Northern and Eastern sides predominantly exhibit lower and shorter waves compared to the historical period. This study partially agrees with Benetazzo et al. (2012), Bonaldo et al. (2017, 2020), and De Leo et al. (2021) who also reported small differences (lower than 10%). However, our study reveals projection values of mean Hs higher or lower of up to 20% to 25% as we get closer to the coast, which are probably not observed in the other studies because of the lower spatial resolution. An interesting feature of the ADRIACLIM wave model concerns the areas close to the Croatian islands, which show on average higher waves of about 5 to 10%. Regarding Tm, the largest negative differences are located in the Gulf of Trieste and before Cres Island, with a decrease period of about 10%. The largest increase of about 5% is found around the Gargano peninsula. Figure 9B shows the spatial differences between the P95y averaged for the 20-year midterm projection and the historical period only for Hs. Results are similar to the mean, even if the 95th percentile shows a slightly higher reduction on the Eastern side, up to 30% close to the coast. The increase in the 95th percentile is lower than for the mean condition, even if the North-West and the Croatian island area show a higher increase of Hs of about 15%. The increase in wave height and wave period in the western part can be explained by the intensification of winds in summer, as well as by Sirocco and intense winds near the western coast (Figure 10). In contrast, the decrease in the eastern part can be attributed to the reduction of winds in winter and possibly to a slight change in wind direction (Lionello and Scarascia, 2018).
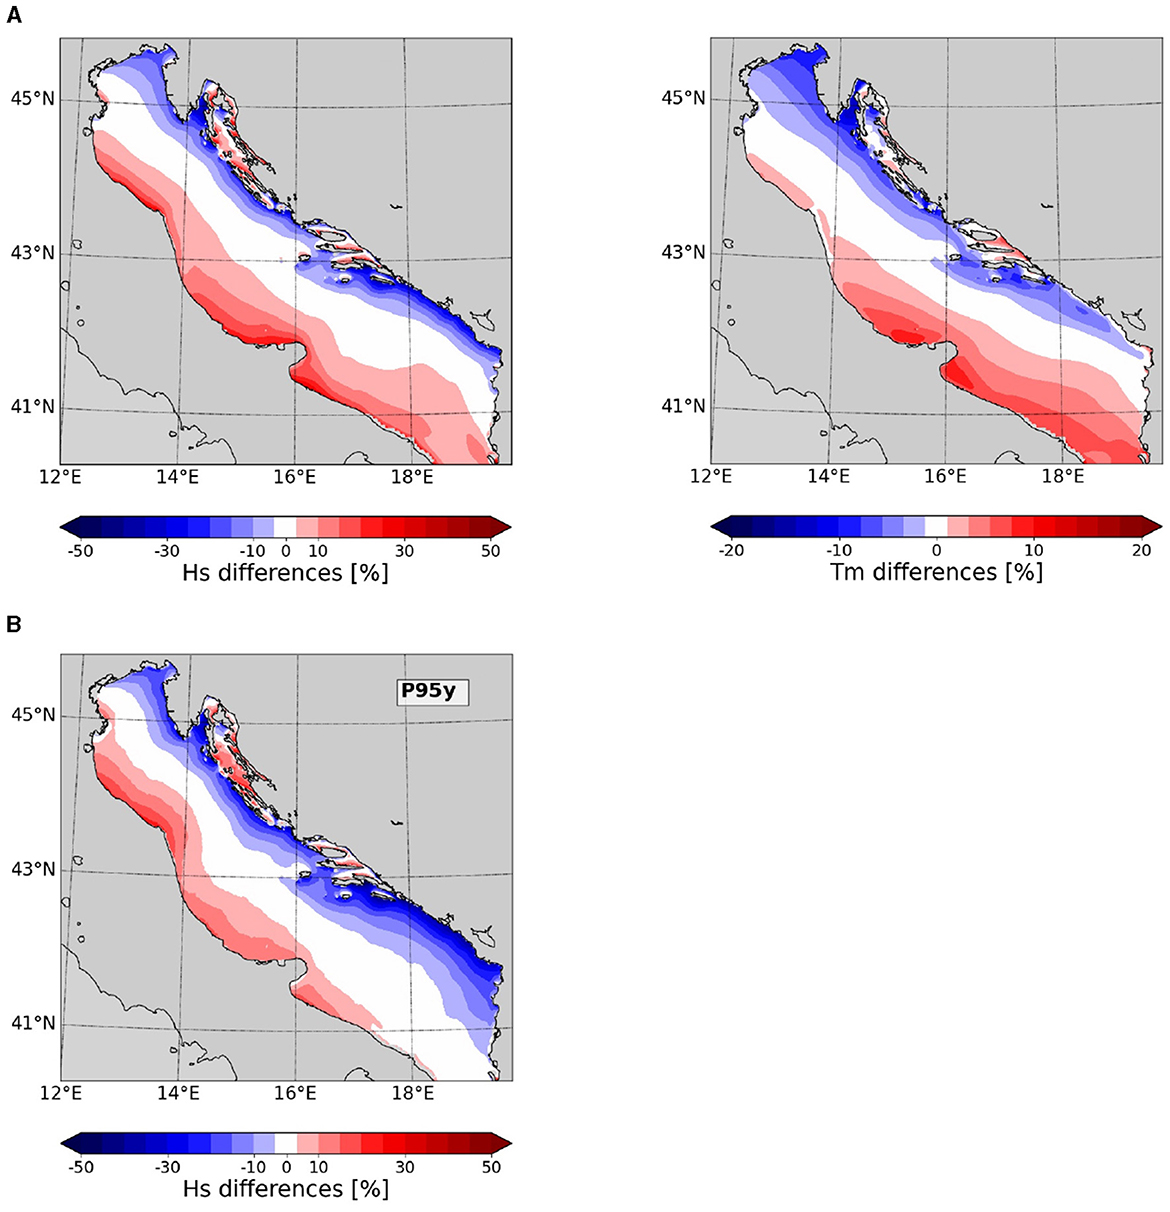
Figure 9. Percentage differences between the projection (2031–2050) and historical (1992–2011) period for (A) the mean and (B) the 95th percentile on an annual basis for Hs and Tm.
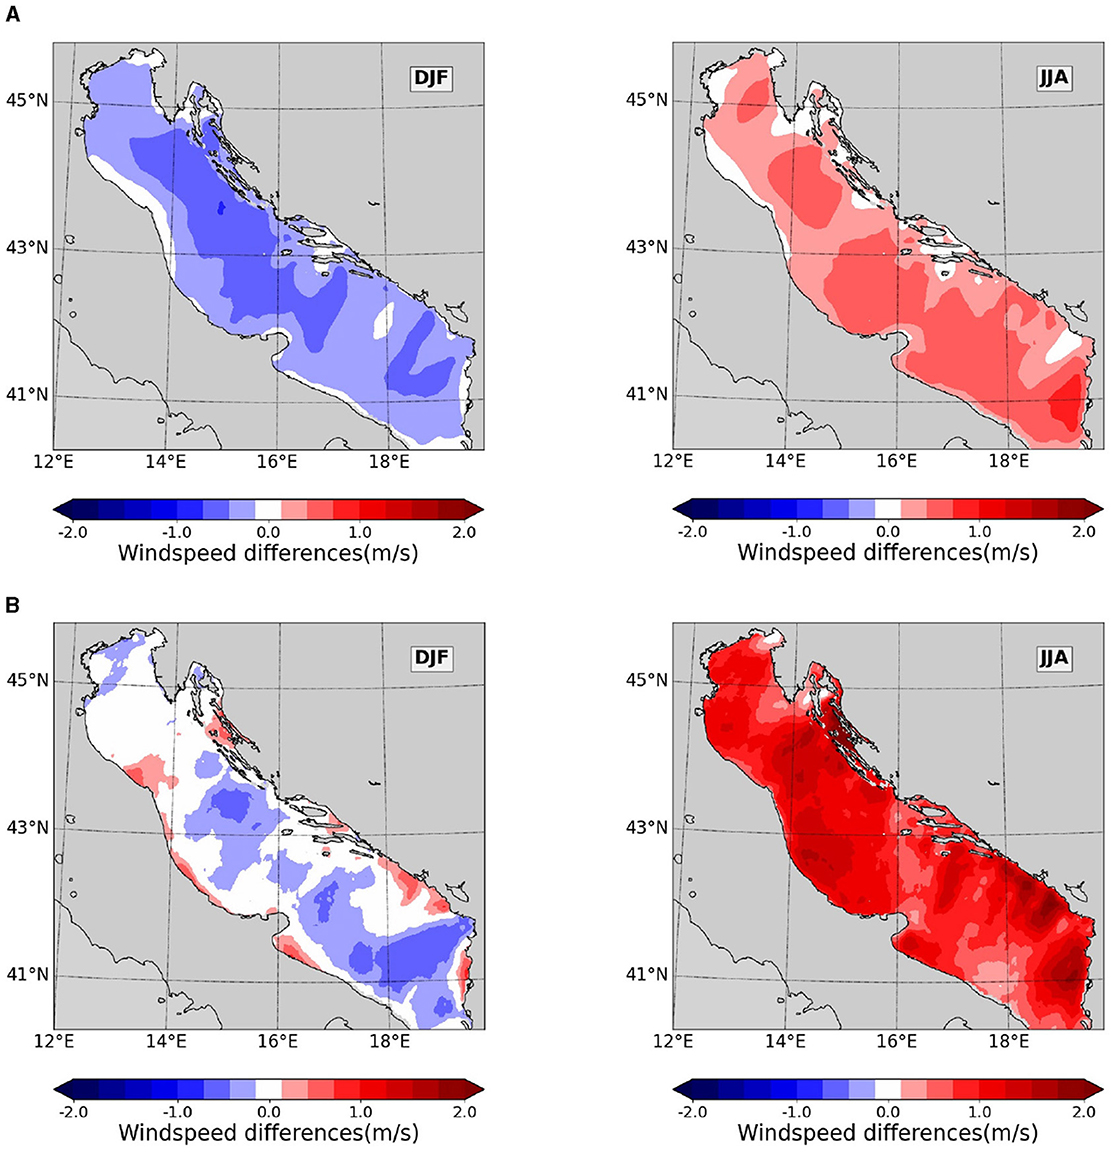
Figure 10. Seasonal windspeed differences between the historical and projection period for the (A) mean and (B) 95th percentile.
As previously demonstrated, the Adriatic Sea exhibits a strong seasonal cycle. Therefore, to provide a more precise assessment of wave climate change, it is worth more than imperative to conduct an analysis of the spatial variability, taking into account the seasonal cycle. Figures 11, 12 summarize the spatial differences in the mean and P95m of Hs (Figure 11) and Tm (Figure 12) between the projection and the historical periods, focusing on the winter and summer seasons.
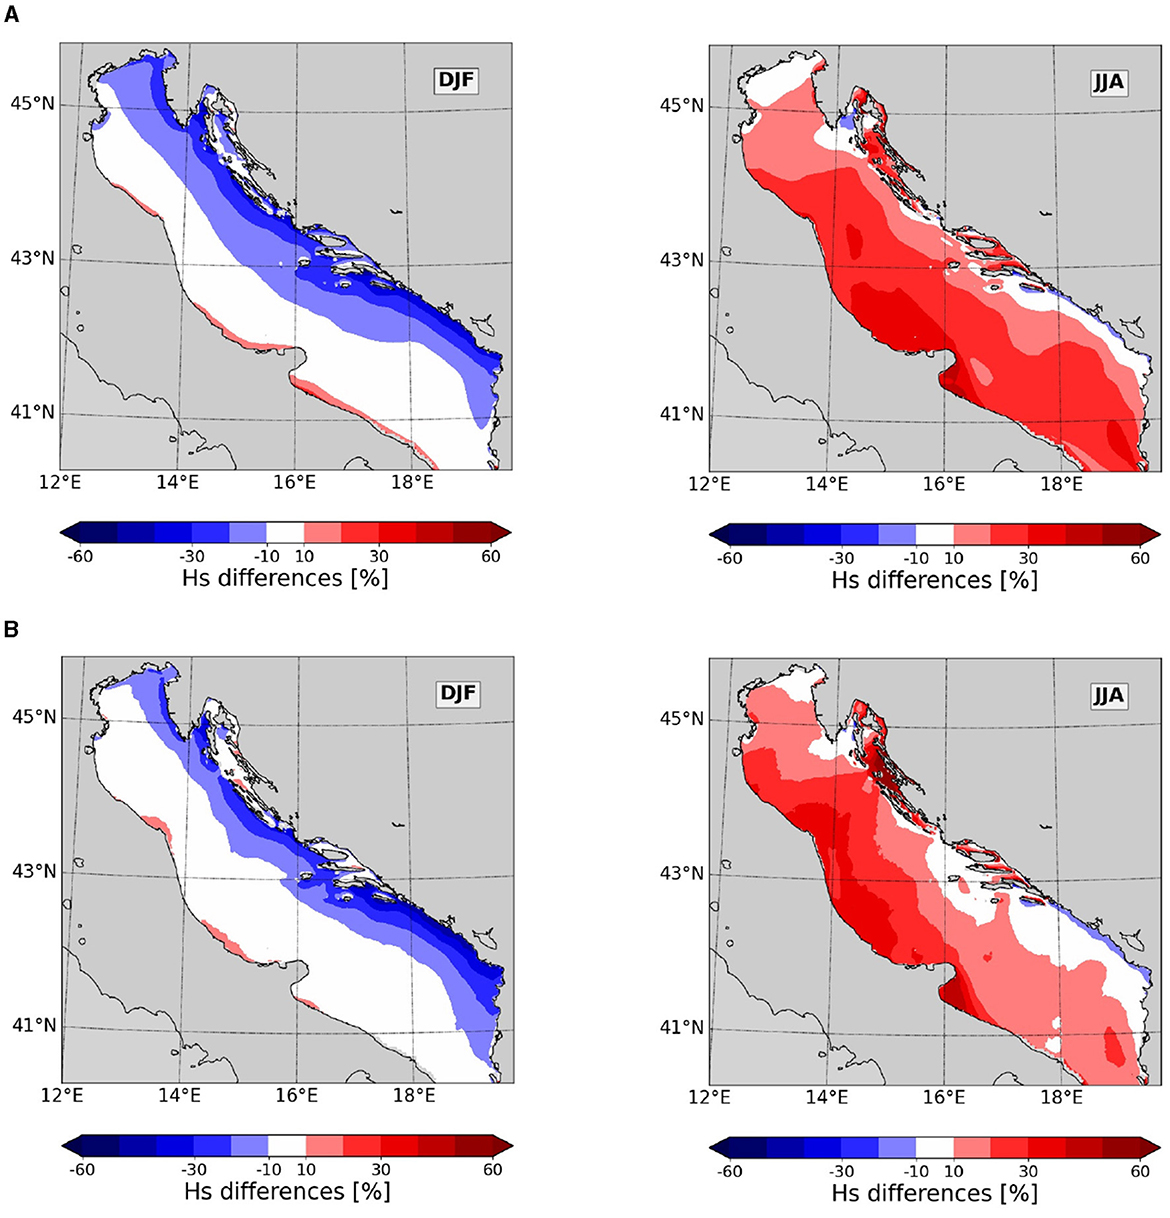
Figure 11. Seasonal differences between projection (2031–2050) and historical (1992–2011) ranges for (A) Hs mean (%), (B) Hs 95th percentile (%).
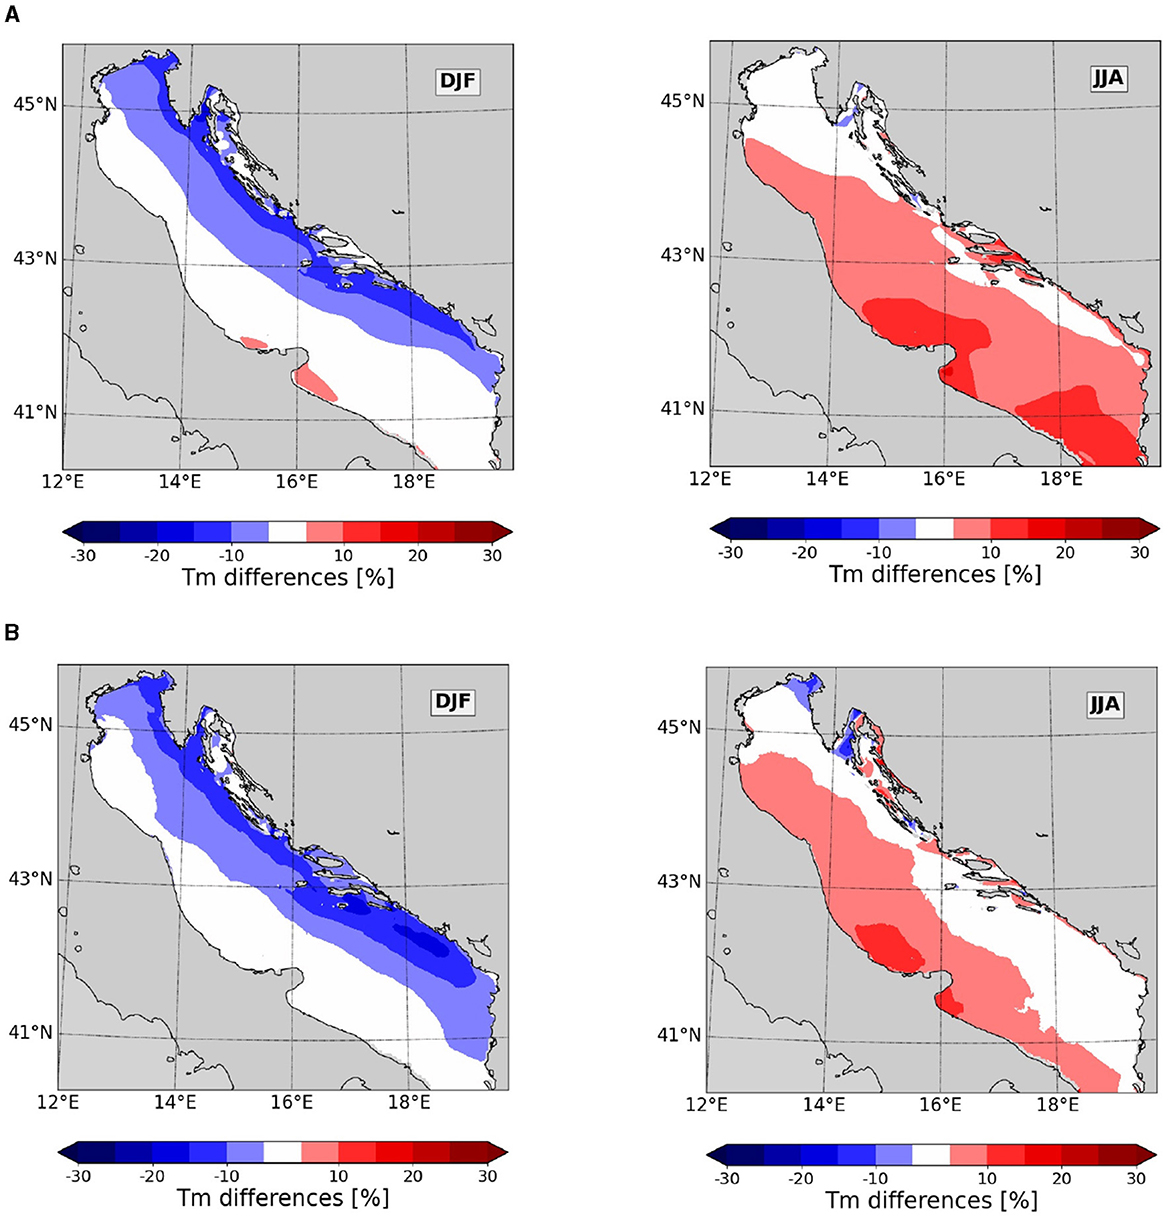
Figure 12. Seasonal change between projection (2031–2050) and historical (1992–2011) ranges for (A) Tm mean (%), (B) Tm 95th percentile (%).
In winter, the average of both the mean and P95m of Hs are lower on the Eastern side, with a higher reduction getting closer to the coast. The highest reduction, up to 35%, is found along the Southeastern coast of Montenegro and South Croatia. The P95m values are less impacted than the mean value going Northward, whereas they show a larger decrease in the South, directly related to a decrease in extreme wind conditions in that area (Figure 10). The open sea on the Western side has experienced almost not changed. Only specific areas on the coast are impacted, with both mean and 95th percentile Hs values approximately 5% to 10% larger over the projection period.
In summer, both the mean and 95th percentile of Hs increase across almost the entire domain for the 2031–2050 period. The increase is less pronounced in the Northern part, where it is on average of 0 to 15%. The average and P95 are not changing in the Gulf of Trieste. Between 14 and 16 degrees East, the mean and 95th percentile of Hs exhibit a notable increase of about 30% to 45%, with the exception of the surrounding area of Cres Island, where it is 10% lower. Additionally, a reduction of Hs is observed for both statistical parameters along the Montenegro and South Croatian coasts.
Concerning Tm (Figure 12), during winter, it decreases on the Eastern side by about 5 to 15%. Only the coastal areas South and North of the Gargano peninsula experience a 5% to 10% increase in the mean period. Conversely, in summer, the periods increase across most of the Adriatic Sea by about 5% to 15% getting higher close to the Western coast, except in the Northern part and some areas on the Eastern coast.
Although not depicted here, the spring Hs and Tm averages exhibit a pattern similar to winter, with a slightly lower decrease and a less extended decrease from the East to the middle region. Autumn is having an increase similar to summer, even if it is less pronounced and more concentrated in the Western part. The Eastern coast has a larger decrease of about 20% extending further than observed in summer. In SON, we find an increase in the period in the Western part and a decrease in the Northern part.
In conclusion, without focusing on the inter-seasonal variability, changes in the wave climate are low and mostly concentrated in coastal areas, as suggested by other studies (Bonaldo et al., 2017, 2020). These features may be observed with the ADRIACLIM wave model thanks to its high resolution, allowing better representation of the regional winds and coastal areas. It is not expected that climate change disrupts the annual cycle, however, this study suggests a possible decrease in seasonality directly related to the local wind speed. The winter period presents an overall decrease in wind and waves except in some specific coastal areas, which is considered the most probable scenario. As mentioned by Belusić Vozila et al. (2018), the Med-CORDEX ensemble has a wide spread between RCM simulations during the JJA season. Despite some discrepancies in summer wind speed compared to other studies, this paper highlights the potential effects of a scenario with a larger increase of Bora jets and Sirocco.
This subsection aims to determine if there is any significant linear trend in the typical and extreme sea state climate over 2031–2050, due to climate change or if the differences are due to inter-annual variability.
The significant trends obtained using the Mann-Kendall method for the 20-year time series are illustrated in Figure 6. The mean Hs presents a significant increasing trend of 0.44 cm/yr (light green line), whereas the P95m and P95y trends do not reach the 90% confidence interval. Similarly, Tm shows a significant increase in the mean of about 0.12s by 10 years and no significant trend for P95m. The lack of trend for Hs and Tm 95th percentiles indicates that the data are too dispersed to compute a reliable linear trend, maybe due to high inter-seasonality.
Maps of the Hs trend based on annual statistics are shown in the first column of the Figure 13 (mean_y and P95y). The hatched areas indicate a monotonic trend surpassing the significant level of confidence set to 90%. The trend for the Hs mean is mostly positive, with a higher increase up to 1.3 cm/yr close to the Italian coast. In the North and East, the Hs mean trend is slightly negative or not changing. On the contrary, extreme Hs values are expected to decrease except in coastal and offshore areas on the Italian side and around Cres island, where the positive trend is up to 1.5 cm/yr. The significant decrease trend can reach –2 cm/yr close to the Southeastern coast.
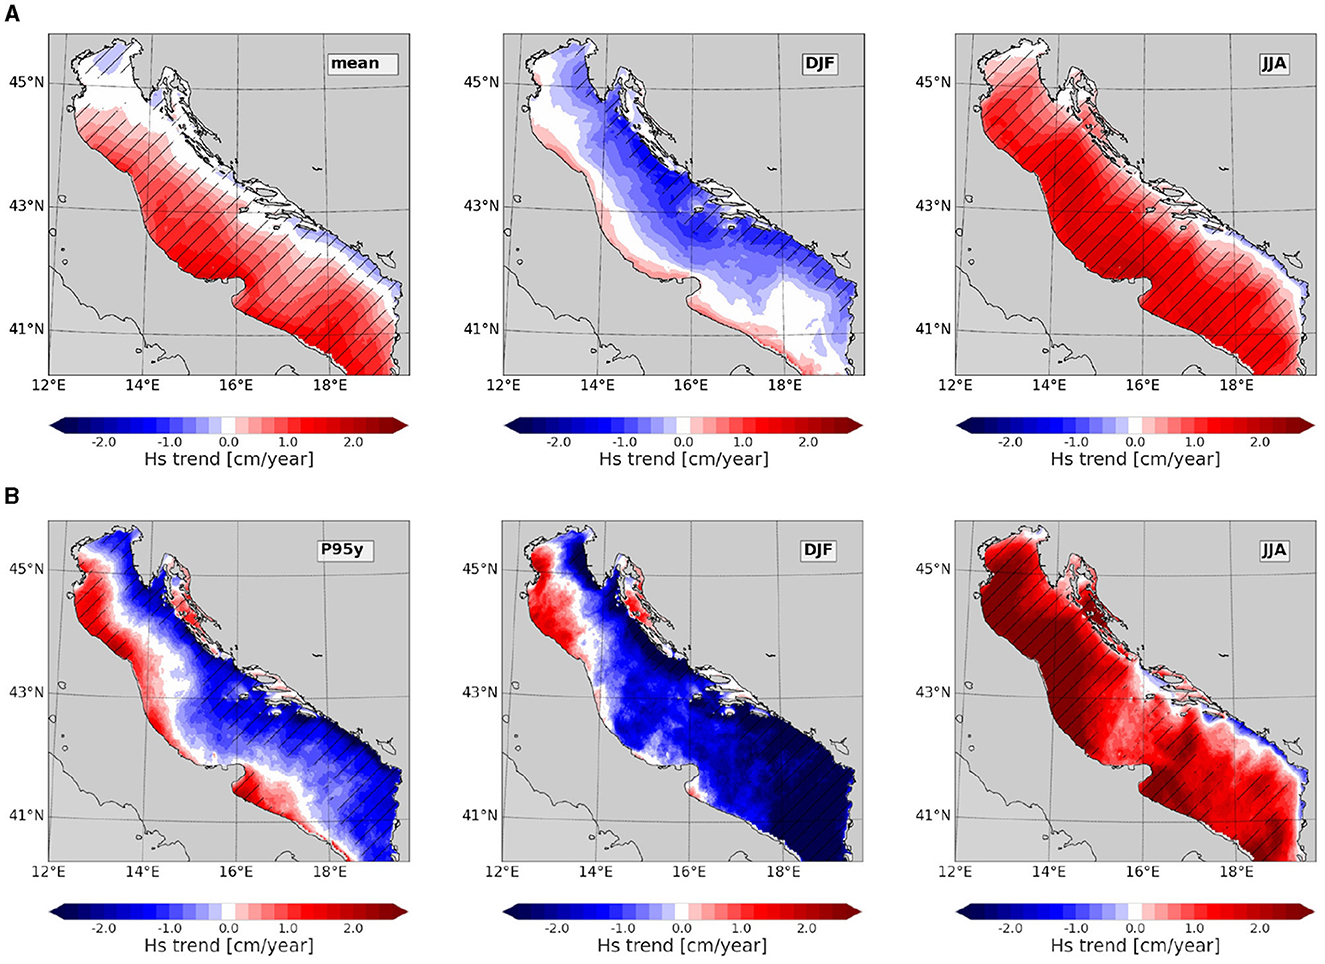
Figure 13. Annual and Seasonal Hs mean (A) and 95th percentile (B) trends for the period 2031–2050. The significant trend areas are represented by hatching.
The following part focuses on the spatial distribution of the seasonal trend during winter and summer. Results related to the Hs statistics are presented in Figure 13 while results related to the Tm statistics are presented in Figure 14.
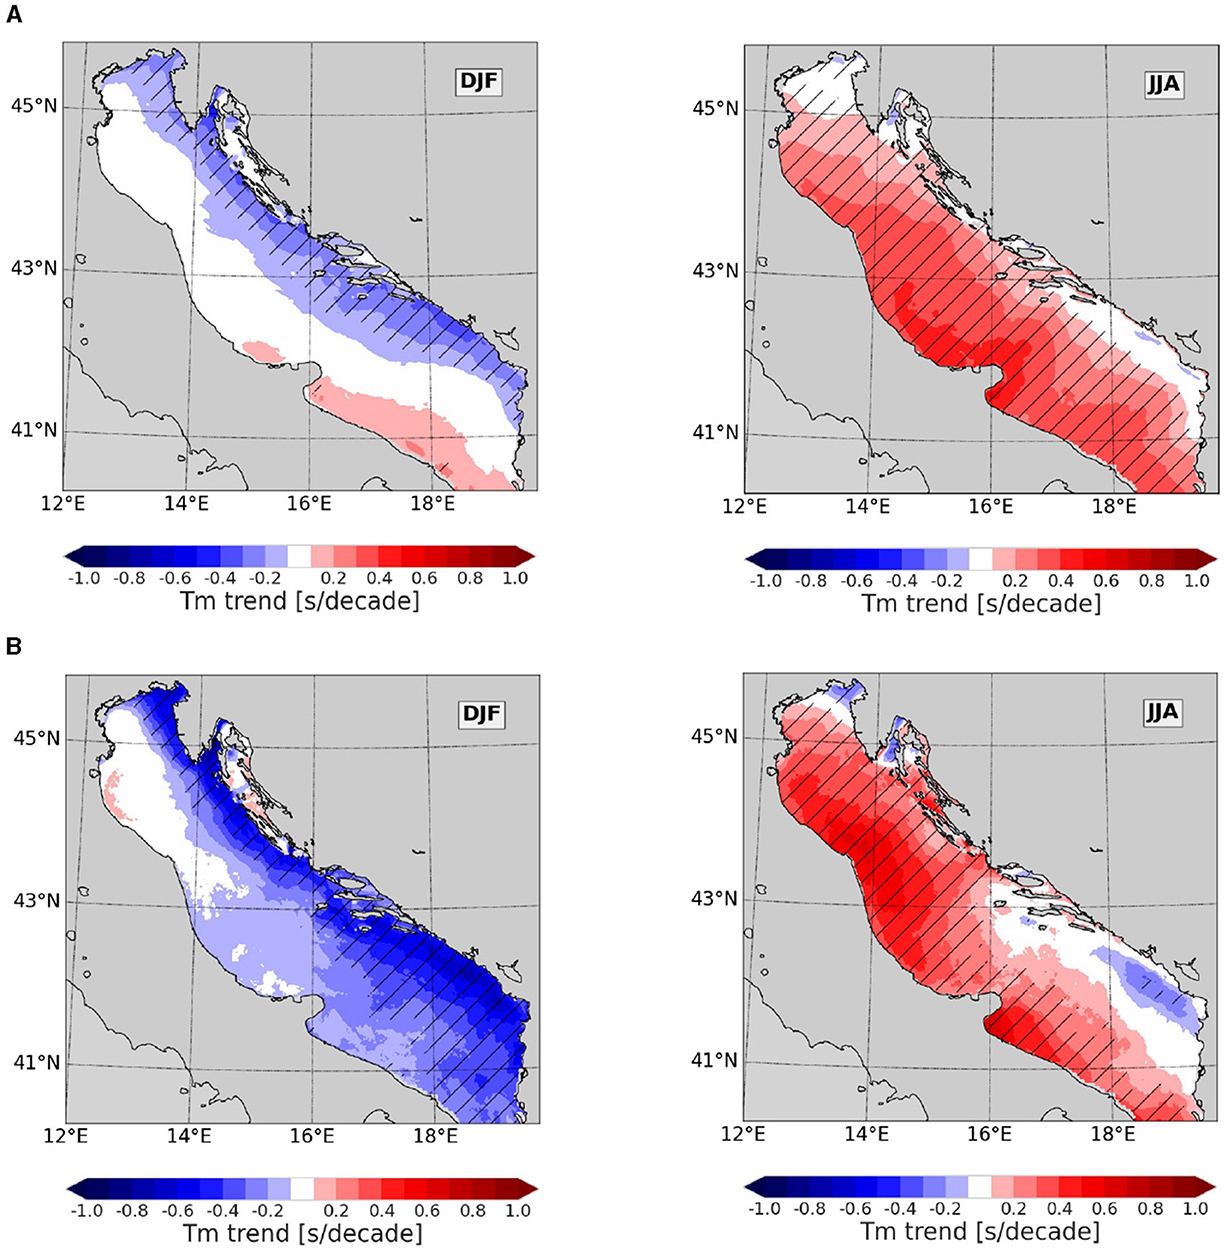
Figure 14. Seasonal Tm mean (A) and 95th percentile (B) trends for the period 2031–2050. The significant trend areas are represented by hatching.
Foremost, it can be noticed that the extreme presents the same pattern as the mean condition, but the Figure 13 reveals that trends increase with the order (mean, P95) of the annual statistics.
During winter, the significant trend area is concentrated on the East side. The significant trend for the mean condition is negative and getting larger close to the coast, with values ranging from –0.4 to –0.8cm/yr for Hs and –0.2 to –0.4s/decade for Tm. The trend in the central regions is generally not relevant and is usually associated with lower values. Decreases of P95 of more than 2.8 cm/year and 0.7s/decade are detected along the Eastern coastal area and the South. The negative trends of Hs and Tm are associated with an overall decrease in mean wind speed over the Adriatic Sea (Figure 10). This is in agreement with the ensemble median from Med-CORDEX which shows a decrease in wind speed over the open sea during winter, and with findings by Belusić et al. (2004) and Belusić Vozila et al. (2018) who reported an overall reduction of the mean wind speed during Sirocco events. As Pasićko et al. (2012) we find an increase in wind speed in coastal and neighboring areas of Croatia, leading to positive P95m trends in Hs also if it is not significant. Non-significant positive values are sporadically found along the Western coast and can be related to a local increase in P95m wind speed close to the coast.
During summer, the significant trend for Hs and Tm predominantly highlights positive trends. Indeed, approximately 96% and 91% of the respectively Hs and Tm grid points show a positive trend in the mean condition. Small areas, such as the Gulf of Trieste, Cres island, and the Montenegro coast, show a negative trend around –0.4 cm/yr and –0.3s/decade in the summer P95m. The mean Hs positive trend in the range of 1.2 to 1.6 cm/year and 0.3 to 0.4 s/decade is rather homogeneous over the domain. The P95m positive trends oscillate between 0.8 and 2.8 cm/year for Hs and are around 0.7 s/decade for Tm. The largest magnitudes are observed in the Bora jets areas. This increasing trend in summer is also found by Caloiero and Aristodemo (2021) but is controversial with other studies like De Leo et al. (2021). Such variations in the ADRIACLIM wave results are correlated with an increase in wind speed in the Adriatic Sea and the region South of Otranto, in the system (Figure 10). This partially aligns with the Med-CORDEX ensemble, which observed a sporadic increase in wind over the sea in the region of Bora jets but usually a decrease in extreme wind speed everywhere in summer by the end of the 21st century.
In conclusion, when taking into account the full period and domain, almost no trend is found in the mean statistical parameter because of the high spatial and seasonal variability. Even if the ADRIACLIM wave system might overestimate wind speed during the summer in the future scenario leading to an exaggerated increase in the full period averaged, it underscores the importance of downscaled models to resolve the offshore and coastal areas. Indeed, seasonal analyses reveal that coastal areas are the most impacted, both in summer and winter, by wave climate change due to changes in the regional winds.
In this study, a high-resolution ADRIACLIM wave climate model is developed and used to analyze possible changes projected for the 2031–2050 period under the RCP 8.5 emission scenario. A spatial analysis on the seasonal scale is performed, as well as an analysis of wave parameter trends through the Theil-Sen slope estimator and the Mann-Kendall test. To ensure the simulations provide reliable results, a comparison between the AdriaClim results for the historical range and the Mediterranean Wave Reanalysis from Copernicus Marine Service for the overlapping period is done first.
Despite the lack of a quantitative evaluation of the uncertainty due to the use of a single Med-CORDEX Regional Climate Model and only one climate scenario, our results provide insight into the potential extent of the seasonal and spatial variation in response to local climate change. This study is scientifically relevant, as there are few studies considering the Adriatic Sea at such a resolution and with such a comprehensive modeling chain. Nevertheless, the consideration of multiple RCMs and climate scenarios would be necessary to provide a better basis for assessing uncertainties and future spatio-temporal trends.
As a result of this investigation, the ADRIACLIM wave climate model demonstrates its capability to reproduce past reconstructions of the mean and 95th percentile of the significant wave height and mean wave period, considering the seasonal scale. Our results align with previous studies regarding the small effect of climate change on wind-generated waves over the next 30 years, with variations usually lower than 10% (Lionello and Sanna, 2005; Benetazzo et al., 2012; Lionello et al., 2012). However, the differences between the present and future projections are small and comparable to the uncertainty of future scenarios, results emphasize the importance of considering the seasonal cycle and spatial variability when dealing with wave climate change in the Adriatic Sea. As anticipated, the variations are not uniformly observed throughout the basin with coastal regions being the most affected. This emphasized the importance of downscaled systems to provide the best scenarios to decision-makers. It is shown that some regions, mainly in the western Adriatic coastal area, might experience an increase in the severity of the sea state, as already indicated by Bonaldo et al. (2020).
Our results point out a decrease in the extremes, except in specific areas. This partially agrees with other studies about the decrease of waves in the basin (Lionello and Sanna, 2005; Benetazzo et al., 2012; Lionello et al., 2012; Bonaldo et al., 2020). The discrepancy with other study in summer, can be attributed to the RCM model and the most extreme scenario used. Belusić Vozila et al. (2018) using a Med-CORDEX ensemble, highlighted the larger spread between RCM simulations during the JJA season compared to that during the DJF season. Our wave results are likely driven by changes in wind seasonality and variability, as also found by Tojčić et al. (2024). Climate change may modify the frequency, intensity, and direction of key wind patterns such as the Bora and Sirocco, which are crucial for wave generation in the Adriatic Sea. In winter, our results tend to confirm an evolution toward a decrease in waves in the basin which is associated with a reduction in wind speed. This reduction could be attributed to a decrease in the frequency or intensity of strong winter winds, such as the Bora, which typically generate significant wave heights in the region during this period. In summer, our results show an increase in waves, even stronger on the eastern coast, associated with an increase of summer winds across almost the entire domain that could be due to an intensification or more frequent Bora jets and Sirocco.
This study highlights the possibility of a reduction in the wind annual cycle under an extreme emission scenario. This is an important scenario to take into consideration, as it could also impact the wave-induced vertical mixing and the Adriatic circulation and upwelling. Future changes in the near-surface atmosphere may play a major role in the Adriatic circulation. For example, Giorgia et al. (2024) showed that river release projection affects the local density stratification of the Northern Adriatic Sea.
To obtain more reliable information on future changes and to quantify the inter-model variability, it would be pertinent to assess the consistency of the projected changes across an ensemble of downscaled systems. As mentioned by Giorgia et al. (2024), the creation of a reliable Med-CORDEX ensemble is still ongoing, as most datasets produced within Med-CORDEX and other regional climate downscaling initiatives are only partially stored and thus not suitable for further local downscaling.
Publicly available datasets were analyzed in this study. This data can be found here: AdriaClim Project repository on ERDDAP Server: https://erddap-adriaclim.cmcc-opa.eu/erddap/index.html.
AM: Conceptualization, Software, Data curation, Formal analysis, Investigation, Methodology, Validation, Visualization, Writing – original draft. LM: Supervision, Conceptualization, Formal analysis, Methodology, Validation, Visualization, Writing – review & editing. EC: Supervision, Conceptualization, Software, Formal analysis, Methodology, Validation, Visualization, Writing – review & editing. GV: Supervision, Funding acquisition, Validation, Writing – review & editing. PM: Supervision, Validation, Writing – review & editing.
The author(s) declare financial support was received for the research, authorship, and/or publication of this article. This work has received funding from the AdriaClim project, Italy (Climate change information, monitoring and management tools for adaptation strategies in Adriatic coastal areas; project ID 10252001).
The authors acknowledge Nadia Pinardi for fruitful discussions on the topic.
The authors declare that the research was conducted in the absence of any commercial or financial relationships that could be construed as a potential conflict of interest.
All claims expressed in this article are solely those of the authors and do not necessarily represent those of their affiliated organizations, or those of the publisher, the editors and the reviewers. Any product that may be evaluated in this article, or claim that may be made by its manufacturer, is not guaranteed or endorsed by the publisher.
LAM, Limited Area Model; RCP, Representative Concentration Pathway; JJA, June-July-August; DJF, December-January-February; Hs, Significant Wave Height; Tm, Mean wave period; P95m, Monthly 95th percentile; P95y, Annual 95th percentile.
Ali, E., Cramer, W., Carnicer, J., Georgopoulou, E., Hilmi, N., Le Cozannet, G., et al. (2022). “IPCC 2022: Cross-chapter paper 4: Mediterranean region,” in Climate change 2022: Impacts, adaptation and vulnerability. contribution of working group ii to the sixth assessment report of the intergovernmental panel on climate change (Cambridge University Press).
Androulidakis, Y. S., Kombiadou, K. D., Makris, C. V., Baltikas, V. N., and Krestenitis, Y. N. (2015). Storm surges in the mediterranean sea: Variability and trends under future climatic conditions. Dyn. Atmosph. Oceans 71, 56–82. doi: 10.1016/j.dynatmoce.2015.06.001
Ardhuin, F., Bertotti, L., Bidlot, J.-R., Cavaleri, L., Filipetto, V., Lefevre, J.-M., et al. (2007). Comparison of wind and wave measurements and models in the western mediterranean sea. Ocean Eng. 34, 526–541. doi: 10.1016/j.oceaneng.2006.02.008
Ayet, A., Bertrand, C., Redelsperger, J., Lapeyre, G., and Maria, L. (2020). On the impact of long wind-waves on near-surface turbulence and momentum fluxes. Boundary-layer Meteorol. 174, 465–491. doi: 10.1007/s10546-019-00492-x
Barbariol, F., Davison, S., Marcello Falcieri, F., Ferretti, R., Ricchi, A., Sclavo, M., et al. (2021). Wind waves in the mediterranean sea: an era5 reanalysis wind-based climatology. Front. Mar. Sci. 8:760614. doi: 10.3389/fmars.2021.760614
Battjes, J. A., and Janssen, J. P. F. M. (1978). “Energy loss and set-up due to breaking of random waves,” in Coastal Engineering Proceeding, 569–587. doi: 10.1061/9780872621909.034
Belusić Vozila, A., Güttler, I., Ahrens, B., Obermann-Hellhund, A., and Telisman Prtenjak, M. (2018). Wind over the adriatic region in cordex climate change scenarios. J. Geophys. Res. 124, 110–130. doi: 10.1029/2018JD028552
Belusić, D., Pasarić, M., and Orlić, M. (2004). Quasi-periodic bora gusts related to the structure of the troposphere. Q. J. R. Meteorol. Soc. 130, 1103–1121. doi: 10.1256/qj.03.53
Benetazzo, A., Fedele, F., Carniel, S., Ricchi, A., Bucchignani, E., and Sclavo, M. (2012). Wave climate of the Adriatic Sea: a future scenario simulation. Nat. Haz. Earth Syst. Sci. 12, 2065–2076. doi: 10.5194/nhess-12-2065-2012
Bignami, F., Sciarra, R., Carniel, S., and Santoleri, R. (2007). Variability of the Adriatic Sea coastal turbid waters from seawifs imagery. J. Geophys. Res. 112:3518. doi: 10.1029/2006JC003518
Blomquist, B. W., Brumer, S. E., Fairall, C. W., Huebert, B. J., Zappa, C. J., Brooks, I. M., et al. (2017). Wind speed and sea state dependencies of air-sea gas transfer: results from the high wind speed gas exchange study (hiwings). J. Geophys. Res. 122, 8034–8062. doi: 10.1002/2017JC013181
Bonaldo, D., Bucchignani, E., Pomaro, A., Ricchi, A., Sclavo, M., and Carniel, S. (2020). Wind waves in the Adriatic Sea under a severe climate change scenario and implications for the coasts. Int. J. Climatol. 40, 5389–5406. doi: 10.1002/joc.6524
Bonaldo, D., Bucchignani, E., Ricchi, A., and Carniel, S. (2017). Wind storminess in the Adriatic Sea in a climate change scenario. ACTA ADRIATICA 58, 195–208. doi: 10.32582/aa.58.2.1
Bricheno, L. M., Soret, A., Wolf, J., Jorba, O., and Baldasano, J. M. (2013). Effect of high-resolution meteorological forcing on nearshore wave and current model performance. J. Atmosp. Oceanic Technol. 30, 1021–1037. doi: 10.1175/JTECH-D-12-00087.1
Calafat, F. M., Avgoustoglou, E., Jordá, G., Flocas, H., Zodiatis, G., Tsimplis, M. N., et al. (2014). The ability of a barotropic model to simulate sea level extremes of meteorological origin in the mediterranean sea, including those caused by explosive cyclones. J. Geophys. Res. 119, 7840–7853. doi: 10.1002/2014JC010360
Calafat, F. M., Frederikse, T., and Horsburgh, K. (2022). The sources of sea-level changes in the mediterranean sea since 1960. J. Geophys. Res. 127:e2022JC019061. doi: 10.1029/2022JC019061
Caloiero, T., and Aristodemo, F. (2021). Trend detection of wave parameters along the italian seas. Water 13:1634. doi: 10.3390/w13121634
Cavaleri, L., Bajo, M., Barbariol, F., Bastianini, M., Benetazzo, A., Bertotti, L., et al. (2019). The october 29, 2018 storm in northern italyan exceptional event and its modeling. Prog. Oceanogr. 178:102178. doi: 10.1016/j.pocean.2019.102178
Cavaleri, L., Bertotti, L., and Tescaro, N. (1997a). The modelled wind climatology of the Adriatic Sea. Theor. Appl. Climatol. 56, 231–254. doi: 10.1007/BF00866430
Cavaleri, L., Curiotto, S., Mazzoldi, A., and Pavanati, M. (1997b). Long term directional wave recording in the northern Adriatic Sea. Il Nuovo Cimento C 20, 103–110.
Cavaleri, L., Fox-Kemper, B., and Hemer, M. (2012). Wind waves in the coupled climate system. Bull. Am. Meteorol. Soc. 93, 1651–1661. doi: 10.1175/BAMS-D-11-00170.1
Clementi, E., Oddo, P., Drudi, M., Pinardi, N., Korres, G., and Grandi, A. (2017). Coupling hydrodynamic and wave models: first step and sensitivity experiments in the mediterranean sea. Ocean Dyn. 67, 1293–1312. doi: 10.1007/s10236-017-1087-7
Copernicus Marine Service, U. E. (2023). Mediterranean sea waves reanalysis. Availlable online at: https://doi.org/10.25423/cmcc/medsea_multiyear_wav_006_012 (accessed October 10, 2023).
De Leo, F., Besio, G., and Mentaschi, L. (2021). Trends and variability of ocean waves under rcp8.5 emission scenario in the mediterranean sea. Ocean Dyn. 71, 97–117. doi: 10.1007/s10236-020-01419-8
De Leo, F., De Leo, A., Besio, G., and Briganti, R. (2020). Detection and quantification of trends in time series of significant wave heights: An application in the mediterranean sea. Ocean Eng. 202:107155. doi: 10.1016/j.oceaneng.2020.107155
Deike, L., and Melville, W. K. (2018). Gas transfer by breaking waves. Geophys. Res. Lett. 45, 10,482–10,492. doi: 10.1029/2018GL078758
Duhan, D., and Pandey, A. (2013). Statistical analysis of long term spatial and temporal trends of precipitation during 1901–2002 at madhya pradesh, india. Atmosph. Res. 122, 136–149. doi: 10.1016/j.atmosres.2012.10.010
Escudier, R., Clementi, E., Cipollone, A., Pistoia, J., Drudi, M., Grandi, A., et al. (2021). A high resolution reanalysis for the mediterranean sea. Front. Earth Sci. 9:702285. doi: 10.3389/feart.2021.702285
Farkas, A., Parunov, J., and Katalinić, M. (2016). Wave statistics for the middle Adriatic Sea. J. Maritime Transport. Sci. 52, 33–47. doi: 10.18048/2016.52.02
Fedele, G., Manco, I., Barbato, G., Verri, G., and Mercogliano, P. (2024). Evaluation of tailored atmospheric indicators in the adriatic coastal areas: a multi-hazards approach for a better awareness of the current and future climate. Front. Clim. 6:1404699. doi: 10.3389/fclim.2024.1404699
Hasselmann, K., Barnett, T. P., Bouws, E., Carlson, H., Cartwright, D. E., Enke, K., et al. (1973). Measurements of wind-wave growth and swell decay during the Joint North Sea Wave Project. DHZ 8, 1–95.
Hasselmann, S., and Hasselmann, K. (1985). Computation and parameterizations of the nonlinear energy transfer in a gravity-wave spectrum. Part I: a new method for efficient computations of the exact nonlinear transfer. JPO 15, 1369–1377. doi: 10.1175/1520-0485(1985)015<1369:CAPOTN>2.0.CO;2
Hemer, M. A., Fan, Y., Mori, N., Semedo, A., and Wang, X. L. (2013). Projected changes in wave climate from a multi-model ensemble. Nat. Clim Change 3, 471–476. doi: 10.1038/nclimate1791
Hussain, M. M., and Mahmud, I. (2019). pyMannKendall: a python package for non-parametric mann kendall family of trend tests. J. Open Source Softw. 4:1556. doi: 10.21105/joss.01556
IPCC, Masson-Delmotte, V., Zhai, P., Pirani, A., Connors, S., Péan, C., et al. (2021). “Ipcc 2021, climate change 2021: The physical science basis,” in Contribution of working group i to the sixth assessment report of the intergovernmental panel on climate change (Cambridge University Press).
Janssen, P. A. E. M. (1989). Wave-induced stress and the drag of air flow over sea waves. JPO 19, 745–754. doi: 10.1175/1520-0485(1989)019<0745:WISATD>2.0.CO;2
Janssen, P. A. E. M. (1991). Quasi-linear theory of wind wave generation applied to wave forecasting. JPO 21, 1631–1642. doi: 10.1175/1520-0485(1991)021<1631:QLTOWW>2.0.CO;2
Katalinić, M., and Parunov, J. (2018). Wave statistics in the Adriatic Sea based on 24 years of satellite measurements. Ocean Eng. 158, 378–388. doi: 10.1016/j.oceaneng.2018.04.009
L'Heveder, B., Li, L., Sevault, F., and Somot, S. (2013). Interannual variability of deep convection in the northwestern mediterranean simulated with a coupled aorcm. Clim. Dyn. 41, 937–960. doi: 10.1007/s00382-012-1527-5
Lionello, P., Cavaleri, L., Nissen, K., Pino, C., Raicich, F., and Ulbrich, U. (2012). Severe marine storms in the northern adriatic: characteristics and trends. Phys. Chem. Earth Parts A/B/C 40, 93–105. doi: 10.1016/j.pce.2010.10.002
Lionello, P., Cogo, S., Galati, M., and Sanna, A. (2008). The mediterranean surface wave climate inferred from future scenario simulations. Global Planet. Change 63, 152–162. doi: 10.1016/j.gloplacha.2008.03.004
Lionello, P., and Sanna, A. (2005). Mediterranean wave climate variability and its links with NAO and Indian Monsoon. Clim. Dyn. 25, 611–623. doi: 10.1007/s00382-005-0025-4
Lionello, P., and Scarascia, L. (2018). The relation between climate change in the mediterranean region and global warming. Reg. Environ. Change 18, 1481–1493. doi: 10.1007/s10113-018-1290-1
Malacic, V., Faganeli, J., and Malej, A. (2008). “Environmental impact of lng terminals in the gulf of trieste (Northern Adriatic),” in Integration of Information for Environmental Security, 361–381. doi: 10.1007/978-1-4020-6575-0_25
Mann, H. B. (1945). Nonparametric tests against trend. Econometr. Soc. 13, 245–259. doi: 10.2307/1907187
Medugorac, I., Pasarić, M., and Orlić, M. (2015). Severe flooding along the eastern adriatic coast: the case of 1 december 2008. Ocean Dyn. 65, 817–830. doi: 10.1007/s10236-015-0835-9
Menendez, M. D. C. R., García-Díez, M., Fita, L., Fernández, J., Méndez, F. J., and Gutiérrez, J. M. (2014). High-resolution sea wind hindcasts over the mediterranean area. Clim. Dyn. 42, 1857–1872. doi: 10.1007/s00382-013-1912-8
Mentaschi, L., Giovanni, B., Federico, C., and Mazzino, A. (2015). Performance evaluation of wavewatchiii in the mediterranean sea. Ocean Modelling 90, 82–94. doi: 10.1016/j.ocemod.2015.04.003
Mentaschi, L., Lovato, T., Butenschön, M., Alessandri, J., Aragão, L., Verri, G., et al. (2024). Projected climate oligotrophication of the adriatic marine ecosystems. Front. Clim. 6:1338374. doi: 10.3389/fclim.2024.1338374
Mentaschi, L., Vousdoukas, M. I., Voukouvalas, E., Dosio, A., and Feyen, L. (2017). Global changes of extreme coastal wave energy fluxes triggered by intensified teleconnection patterns. Geophys. Res. Lett. 44, 2416–2426. doi: 10.1002/2016GL072488
Miles, J. W. (1957). On the generation of surface waves by shear flows. JFM 3, 185–204. doi: 10.1017/S0022112057000567
Morales-Márquez, V., Orfila, A., Simarro, G., and Marcos, M. (2020). Extreme waves and climatic patterns of variability in the eastern north atlantic and mediterranean basins. Ocean Science 16, 1385–1398. doi: 10.5194/os-16-1385-2020
Parras-Berrocal, I. M., Vázquez, R., Cabos, W., Sein, D. V., Álvarez, O., Bruno, M., et al. (2023). Dense water formation in the eastern mediterranean under a global warming scenario. Ocean Sci. 19, 941–952. doi: 10.5194/os-19-941-2023
Pasićko, R., Branković, C., and Simić, Z. (2012). Assessment of climate change impacts on energy generation from renewable sources in croatia. Renew. Energy 46, 224–231. doi: 10.1016/j.renene.2012.03.029
PNACC (2023). Piano nazionale di adattamento ai cambiamenti climatici. Piano Nazionale di Adattamento ai Cambiamenti Climatici.
Pomaro, A., Cavaleri, L., and Lionello, P. (2017). Climatology and trends of the Adriatic Sea wind waves: analysis of a 37-year-long instrumental data set. Int. J. Climatol. 37, 4237–4250. doi: 10.1002/joc.5066
Pullen, J., Doyle, J. D., Hodur, R., Ogston, A., Book, J. W., Perkins, H., et al. (2003). Coupled ocean-atmosphere nested modeling of the Adriatic Sea during winter and spring 2001. J. Geophys. Res. 108:1780. doi: 10.1029/2003JC001780
Ruti, P., Somot, S., Giorgi, F., Dubois, C., Flaounas, E., Obermann, A., et al. (2016). Med-cordex initiative for mediterranean climate studies. Bull. Am. Meteorol. Soc. 97, 1187–1208. doi: 10.1175/BAMS-D-14-00176.1
Sen, P. K. (1968). Estimates of the regression coefficient based on kendall's tau. J. Am. Stat. Assoc. 63, 1379–1389. doi: 10.1080/01621459.1968.10480934
Signell, R. P., Carniel, S., Cavaleri, L., Chiggiato, J., Doyle, J., Pullen, J., et al. (2005). Assessment of wind quality for oceanographic modeling in semi-enclosed basins. J. Mar. Syst. 53, 217–233. doi: 10.1016/j.jmarsys.2004.03.006
Subash, N., Singh, S., and Priya, N. (2011). Variability of rainfall and effective onset and length of the monsoon season over a sub-humid climatic environment. Atmosphere. Res. 99, 479–487. doi: 10.1016/j.atmosres.2010.11.020
Tabari, H., Marofi, S., Aeini, A., Talaee, P. H., and Mohammadi, K. (2011). Trend analysis of reference evapotranspiration in the western half of iran. Agric. Forest Meteorol. 151, 128–136. doi: 10.1016/j.agrformet.2010.09.009
Theil, H. (1992). “A rank-invariant method of linear and polynomial regression analysis,” in Henri Theil's contributions to economics and econometrics: Econometric theory and methodology (Dordrecht: Springer Netherlands). doi: 10.1007/978-94-011-2546-8_20
Tojčić, I., Denamiel, C., and Vilibic, I. (2024). Kilometer-scale trends, variability, and extremes of the adriatic far-future climate (rcp 8.5, 2070–2100). Front. Mar. Sci. 11:1329020. doi: 10.3389/fmars.2024.1329020
Tolman, H. (1991). A third-generation model for wind waves on slowly varying, unsteady, and inhomogeneous depths and currents. J. Phys. Oceanogr. 21, 782–797. doi: 10.1175/1520-0485(1991)021<0782:ATGMFW>2.0.CO;2
Van Vuuren, D. P., Edmonds, J., Kainuma, M., Riahi, K., Thomson, A., Hibbard, K., et al. (2011). The representative concentration pathways: an overview. Clim. Change 109, 5–13. doi: 10.1007/s10584-011-0148-z
Verri, G., Furnari, L., Gunduz, M., Senatore, A., Santos da Costa, V., De Lorenzis, A., et al. (2024). Climate projections of the Adriatic Sea: role of river release. Front. Clim. 6:1368413. doi: 10.3389/fclim.2024.1368413
Vousdoukas, M. I., Mentaschi, L., Voukouvalas, E., Verlaan, M., and Feyen, L. (2017). Extreme sea levels on the rise along europe's coasts. Earth's Future 5, 304–323. doi: 10.1002/2016EF000505
WW3DG, W. I. R. D. G. (2019). User manual and system documentation of WAVEWATCH III R version 6.07. College Park, MD, USA: NOAA/NWS/NCEP/MMAB.
Keywords: wave projection, downscaling, RCP 8.5, WaveWatchIII, Adriatic Sea
Citation: Moulin A, Mentaschi L, Clementi E, Verri G and Mercogliano P (2024) Projections of the Adriatic wave conditions under climate changes. Front. Clim. 6:1409237. doi: 10.3389/fclim.2024.1409237
Received: 29 March 2024; Accepted: 27 June 2024;
Published: 17 July 2024.
Edited by:
Andrea Valentini, Regional Agency for Prevention, Environment and Energy of Emilia-Romagna (ARPAE), ItalyReviewed by:
Nikolas Martzikos, Università Mediterranea di Reggio Calabria, ItalyCopyright © 2024 Moulin, Mentaschi, Clementi, Verri and Mercogliano. This is an open-access article distributed under the terms of the Creative Commons Attribution License (CC BY). The use, distribution or reproduction in other forums is permitted, provided the original author(s) and the copyright owner(s) are credited and that the original publication in this journal is cited, in accordance with accepted academic practice. No use, distribution or reproduction is permitted which does not comply with these terms.
*Correspondence: Aimie Moulin, YWltaWUubW91bGluQGNtY2MuaXQ=
Disclaimer: All claims expressed in this article are solely those of the authors and do not necessarily represent those of their affiliated organizations, or those of the publisher, the editors and the reviewers. Any product that may be evaluated in this article or claim that may be made by its manufacturer is not guaranteed or endorsed by the publisher.
Research integrity at Frontiers
Learn more about the work of our research integrity team to safeguard the quality of each article we publish.