
94% of researchers rate our articles as excellent or good
Learn more about the work of our research integrity team to safeguard the quality of each article we publish.
Find out more
ORIGINAL RESEARCH article
Front. Clim., 27 March 2024
Sec. Climate and Decision Making
Volume 6 - 2024 | https://doi.org/10.3389/fclim.2024.1355446
This article is part of the Research TopicClimate Strategies and Deep UncertaintyView all 11 articles
 A. E. F. Allison1*
 J. H. Lawrence2,3
 S. A. Stephens1
 J. H. Kwakkel4
 S. K. Singh1
 P. Blackett1A. Stroombergen5
Infrastructure in low-lying coastal areas faces challenges from climate change, sea level rise, and the impact of compound hazards. Dynamic adaptive pathways planning (DAPP) is increasingly being applied as a way of planning under deep uncertainty. Stress testing for robustness is an integral part of DAPP which provides decision-makers with confidence. We outline a seven-step approach—combining scoping workshops, systems mapping, DAPP, exploratory modelling, robust decision-making, real options analysis and validation workshops—to support decision-making for infrastructure in low-lying coastal areas. We apply the seven steps to two wastewater treatment plant (WWTP) case studies in New Zealand to quantify indicators, signals, triggers and adaptation thresholds within DAPP plans and to identify adaptation pathways that are robust against future uncertainty. Case study one focuses on the implementation of an existing DAPP at Helensville WWTP. Our modelling enabled the challenge of quantifying indicators for adaptation thresholds and triggers to be overcome. We show that an adaptation threshold occurs at 31 cm of RSLR, the trigger point is sufficient lead time to enable relocation, and the indicator is the rate of observed RSLR. Case study one demonstrates in a quantitative way how an existing DAPP can be functionally implemented by a water management agency. Modelling for case study two, the Seaview WWTP, showed that 26 cm and 56 cm of RSLR are key thresholds. Nuisance flooding may occur after 26 cm of RSLR, which could happen as early as 2040 under a high emissions scenario. Inundation of plant assets may occur after 56 cm of RSLR, which could occur as early as 2060. Modelling showed that implementing changes to plant layout would allow the plant to remain on site for its design life (until 2080). Five adaptation archetypes were developed—sequences of adaptive actions that achieve the performance objective of continuing levels of service and avoid inundation of WWTPs. The seven-step approach is a way to stress-test a DAPP, to quantify signals, triggers and adaptation thresholds and to simulate implementation of a DAPP under a range of scenarios. This can facilitate more robust decision-making for wastewater infrastructure assets under future uncertainty.
Infrastructure throughout the world faces challenges from multiple interacting hazards in low-lying coastal areas. With 65% of New Zealanders living within 5 km of the coast (Ministry for the Environment and Statistics New Zealand, 2019), much of our infrastructure is susceptible to compound coastal hazards. Wastewater treatment systems face specific challenges in such locations where they are gravity-fed. Increasing influent volumes over time, and ongoing requirements to meet agreed levels of service and performance standards without failure, has consequences that imperil human and environmental health and wellbeing (Hughes et al., 2020).
Climate change impacts in low-lying coastal areas are worsening in severity and increasingly affecting wider areas (Cooley et al., 2021; Lawrence and Bell, 2022). Different coastal hazards often occur concurrently and interact to produce compound impacts. For example, storms bring heavy rainfall events and drive high river flows that interact with elevated coastal storm surge (Wahl et al., 2015). Heavy rainfall in urban areas creates higher levels of runoff than in rural areas due to the influence of impervious surfaces (Strombach et al., 2019). Yet there is uncertainty around the timing, frequency and magnitude of coastal hazard impacts now and particularly in the future. Infrastructure providers (e.g., water supply, storm water, wastewater, electricity, gas, etc.) need to service and adapt systems in the face of this uncertainty while constraining costs and avoiding unnecessary expenditure through adapting too early or too late. The Department of Internal Affairs, Local Government Act (2002) requires local authorities to outline a plan to manage their infrastructure assets, including the need for replacement, renewal, changes in levels of service, and resilience to hazards.
In this study we outline learnings from applying a set of methods that can address the impacts of multiple compound hazards on infrastructure at or near the coast and that give infrastructure providers the tools to grapple with the risks and uncertainties. The approach presented can assess the lifetime and efficacy of adaptive actions. This provides greater flexibility to decision-makers to implement new adaptive actions as new triggers are reached ahead of infrastructure performance loss as damaging thresholds are approached (Kool et al., 2020). Adaptive actions need ongoing flexibility built in, with the ability to move between different adaptive actions while simultaneously implementing a range of actions to address different pressures.
Traditional optimization approaches are designed to find the best performing suite of actions under a single scenario and are not suitable to identify robust adaptation actions that perform well under an array of deeply uncertain futures (Ben-Haim, 2019; Maynard et al., 2021; Allison et al., 2022). For example, the ‘Master Planning’ approach widely used in New Zealand wastewater infrastructure management has been found lacking when planning the life of an asset, and when considering multiple future scenarios (i.e., deep uncertainty) (Maynard et al., 2021). Many types of low-lying infrastructure are known to be susceptible to failure under increments of sea-level rise of less than half a metre (e.g., Hummel et al., 2018; Kool et al., 2020; Allison et al., 2023). Failure of infrastructure to meet performance and operational objectives has wide-ranging impacts on society, affecting health, economics, and recreational amenity alongside governance and institutional implications (Hughes et al., 2020; Lawrence et al., 2020; Allison et al., 2022).
Decision-making under deep uncertainty (DMDU) tools are designed to inform decision makers in situations where the external context of the system, the system form/function/boundaries, and the outcomes of interest are unknown or disputed (Walker et al., 2001, 2003; Marchau et al., 2019). DMDU is based around exploratory modelling (Marchau et al., 2019)—using computational experiments to explore a range of scenarios and model structures and options (Bankes, 1993). Exploratory modelling uses simple models of complex systems where there are irreducible uncertainties, using computational scenario modelling (Kwakkel, 2017) to improve decision-maker understanding of characteristics of complex systems such as viral spread (e.g., Auping et al., 2016). However, DMDU tools can also be applied in more complex models where compound climate change hazards are comparatively well resolved and the futures of specific parts of infrastructure systems are of concern.
DMDU tools are increasingly being applied in decision-support to improve adaptation under an array of possible climate futures (Kwakkel et al., 2016). Two DMDU tools—dynamic adaptive pathways planning (DAPP) and robust decision-making (RDM)—can be used to analyse a range of adaptation options that allows society to avoid lock-in of maladaptive investments, while ensuring that adaptive actions taken are ‘robust’ (i.e., perform across a broad range of plausible and implausible climate and socio-economic futures). A third approach—system mapping—is widely used for developing a common understanding between researchers and stakeholders of the system of interest and identifying critical connections within the system (Craddock-Henry et al., 2020). System mapping (also known as system diagramming) is one of many systems theory tools within the field of system dynamics (Connolly, 2022); unlike system dynamics modelling, system maps are conceptual guides and do not produce quantitative insights. However, system dynamics models which generate causal system diagrams have previously been used in conjunction with RDM and adaptive policymaking (Hamarat et al., 2013, 2014). Here we build on this knowledge by combining system mapping with DAPP and RDM.
We sequentially apply system mapping, DAPP and RDM to identify adaptation thresholds for infrastructure in two low-lying coastal areas and to identify pathways that are robust against future uncertainty. We define an adaptation threshold as a situation where current strategies no longer meet performance and operational objectives—Box 1 defines terminology used in this paper. We use scoping workshops, system mapping, DAPP, exploratory modelling, RDM, real options analysis (ROA) and validation workshops (e.g., Allison et al., 2022) to two New Zealand case studies—a wastewater treatment plant (WWTP) and parts of a waste water system (a WWTP, trunk sewer and pipeline)—to demonstrate how these methods can be applied in combination to infrastructure adaptation as decision-support tools. DAPP, RDM and exploratory modelling have previously been found to be complementary approaches (Kwakkel et al., 2016). We build on that knowledge, by working with infrastructure providers and incorporating workshops, system mapping, and ROA into the suite of methods. DAPP is a key approach in New Zealand guidance for managing coastal hazards and climate change (Ministry for the Environment, 2017). Subsequently, DAPPs are being widely developed for planning under deep uncertainty and the long ‘at least 100 years’ planning timeframe required in national direction (Ministry for the Environment, 2017).
Implementing DAPPs has been challenging due to conflicts between planning rules and strategic imperatives (Lawrence, 2023), and because developing indicators, signals, triggers and adaptation thresholds requires mediation of community and stakeholder interests and values (Ministry for the Environment, 2017). Through these two case studies, we show that the combined methods, used in sequence, can enable decision makers to set signals, triggers and adaptation thresholds while accounting for competing interests, values and needs, to stress-test potential adaptive actions, understand the lifetime and efficacy of proposed adaptive actions, the conditions under which they fail to meet objectives, and to understand which combinations or sequences of adaptive actions are the most robust. We demonstrate that this approach offers a sound platform for making robust adaptation decisions over planning timeframes of at least 100 years.
BOX 1. Terminology.
Adaptation thresholds are critical points of failure to be avoided—equivalent to an Adaptation Tipping Point (Haasnoot et al., 2013). For example, overtopping or breach of a seawall.
Adaptive actions are those that avoid an adaptation threshold; in this application they are engineering actions.
Triggers are the decision point at which the efficacy of current and future actions are reviewed, and new adaptive actions or pathways chosen and implemented in order to avoid an adaptation threshold.
Indicators are elements that are monitored to warn that a trigger is approaching. For example, nuisance flooding.
Lead times are the time it takes to plan, consent and implement an adaptive action.
Lifetimes are how long the action will perform to meet the objectives under different conditions.
We apply RDM in a novel way—combining workshops, system mapping, DAPP, exploratory modelling, RDM and ROA to assess and stress-test adaptation plans for specific wastewater infrastructure assets. System mapping ensures the broader system within which the infrastructure sits, is well-understood. The uncertainty explored via modelling arises from the frequency and magnitude of hazard impacts under a range of climate change scenarios and influent volume change scenarios rather than incomplete understanding of the wider system of interest. We use exploratory modelling to investigate the viability and lifetime of actions within the alternative adaptive pathways and how the different pathways play out under different scenarios. We use an RDM framework to interrogate model outputs and refine model scope, in an iterative process that culminates in the identification of one or more robust pathways for each WWTP. This paper provides an exemplar for applying workshops, system mapping, DAPP, exploratory modelling RDM, and ROA to inform adaptation of two wastewater systems in New Zealand, and which can then be applied to other wastewater systems. As part of this contribution, we develop archetypes of adaptation pathways—sequences of adaptive actions that achieve the performance objective of continuing levels of service and that avoid inundation of WWTPs—that could be considered as a starting point to scope adaptation strategies in other wastewater systems.
We set out to test a conceptual framework developed for assessing infrastructure options for adapting to climate change stressors. The method was developed and tested through two case studies to demonstrate how the seven steps in the concept routine can be undertaken together to assess climate change driven compound hazards, identify triggers, thresholds and adaptive actions with lead-times and lifetimes, and stress-test adaptation archetypes against climate and socio-economic future scenarios. The seven steps—scoping workshops, system mapping, DAPP, exploratory modelling, RDM, ROA and validation workshops—were used in a sequence, enabling a full analysis of each component of the infrastructure and the infrastructure system as-a-whole.
We used scoping workshops to understand the issues that the systems faced. System mapping was used with the infrastructure providers, to develop a common understanding of the system, including its internal components, external drivers, potential adaptive actions and outcomes of interest. System mapping allowed us to map critical connections in the systems, and to look across the entire chain of cause and effect and reduce the element of surprise that can arise from modelling an insufficiently understood system. An existing DAPP plan was used for case study one. For case study two, a DAPP plan was developed to provide a range of adaptive actions that could be used to avoid adaptation thresholds for different parts of the infrastructure—trunk network, WWTP, outfall pipeline. We used exploratory modelling to investigate the potential for adaptation plans to achieve objectives set by the water agencies in their levels of service under a range of climate change and influent volume scenarios, and how adaptation plans perform under different scenarios, applying an RDM framework to interrogate model outputs and stress-test adaptive actions in an iterative process. We applied RDM to quantify the location (in time and space) of adaptation thresholds for the infrastructure, and ROA to analyse the economic cost of action and inaction for each set of adaptive actions. Validation workshops with water service practitioners, asset managers, and water service executives were used to identify whether identified sets of adaptive actions were feasible to implement, taking into account practicality and cost of implementation. The workshop outputs were then used to show those actions that are feasible to implement and can then be developed into options for decision makers.
Seven steps were followed that allowed a holistic analysis of the infrastructure adaptation options and pathways out to at least 100 years tested for robustness against several plausible futures. The resulting shared system understanding was facilitated via the development of system maps and stress-testing a DAPP, alongside an RDM and ROA assessment of model outputs giving a quantitative element to the DAPP process. It shows which actions are suitable under different circumstances, and which fail to meet performance and operational objectives and under what conditions.
We applied the seven steps to the two case studies to demonstrate the value of using the seven-step concept routine; the two case studies are the Helensville WWTP and Seaview WWTP (Figure 1). Both case studies are wastewater treatment plants situated on low-lying coastal plains exposed to riverine and coastal processes. They are each less than 3 m above present-day mean sea-level and face considerable short, medium and long-term planning challenges, with the risk of compound coastal hazards with increasing and ongoing climate change impacts affecting the sustainability of service delivery. The case study wastewater plants each currently provide the only available wastewater services for their communities. Increasing population in the two catchments is increasing inflow to the plants and the plant operators face considerable uncertainty around how and when to adapt the plants, trunk networks and outfalls to maintain services under cost constraints and the risk of the assets becoming locked into place.
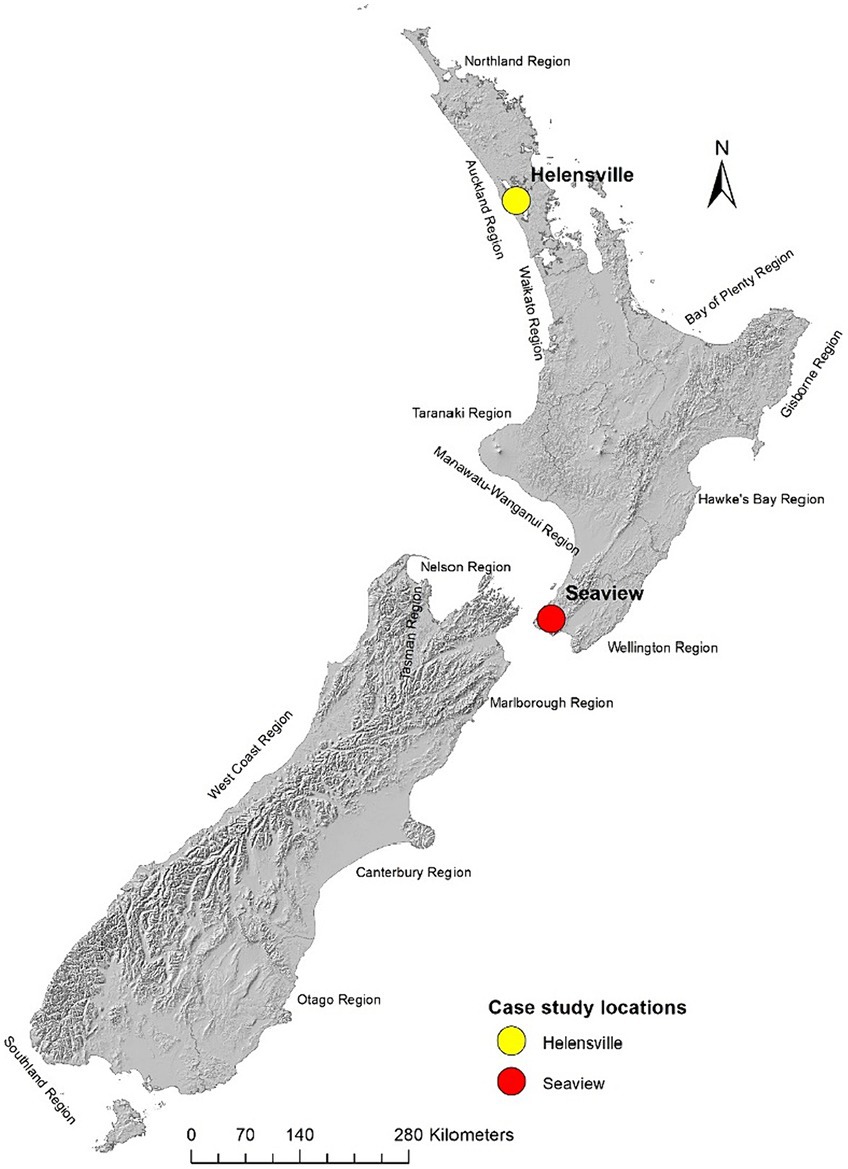
Figure 1. Case study locations within New Zealand.
The application meets the three key criteria for choosing DMDU approaches over traditional optimization approaches (Dewar, 2006; Marchau et al., 2019): that the contextual uncertainties (climate and influent volume changes) are deep, that the set of policies (adaptation options) has many degrees of freedom, and system complexity (the range of outcomes of interest) is high.
For Helensville WWTP we stress-tested an action within an existing DAPP plan against a range of influent scenarios and identified how long the WWTP was viable on site for, in relation to relative sea-level rise (RSLR).
For Seaview WWTP we worked with the case study partner to develop a proof-of-concept DAPP plan and tested it in a model using an RDM framework to identify robust sequences of adaptive actions. We used ROA to ensure that costs incurred under any adaptive pathway are quantified and tradeoffs made explicit.
Sections 3 and 4 of this paper provide overviews of each case study site and our application of the methods to their adaptation strategies. Section 5 brings knowledge generated in the case studies together to demonstrate the value of using these seven steps in sequence and provides suggestions for further development of the approach.
Case study one is the Helensville wastewater treatment plant (WWTP) located in rural northwest Auckland, New Zealand. It is located on a loop of the Kaipara River (Figure 2). The plant is very low-lying—with pond surfaces between 3.41 m—3.94 m above mean sea-level, is immediately adjacent to a tidal river and is susceptible to several coastal and fluvial hazards, predominantly high river flows, tides and sea-level rise.
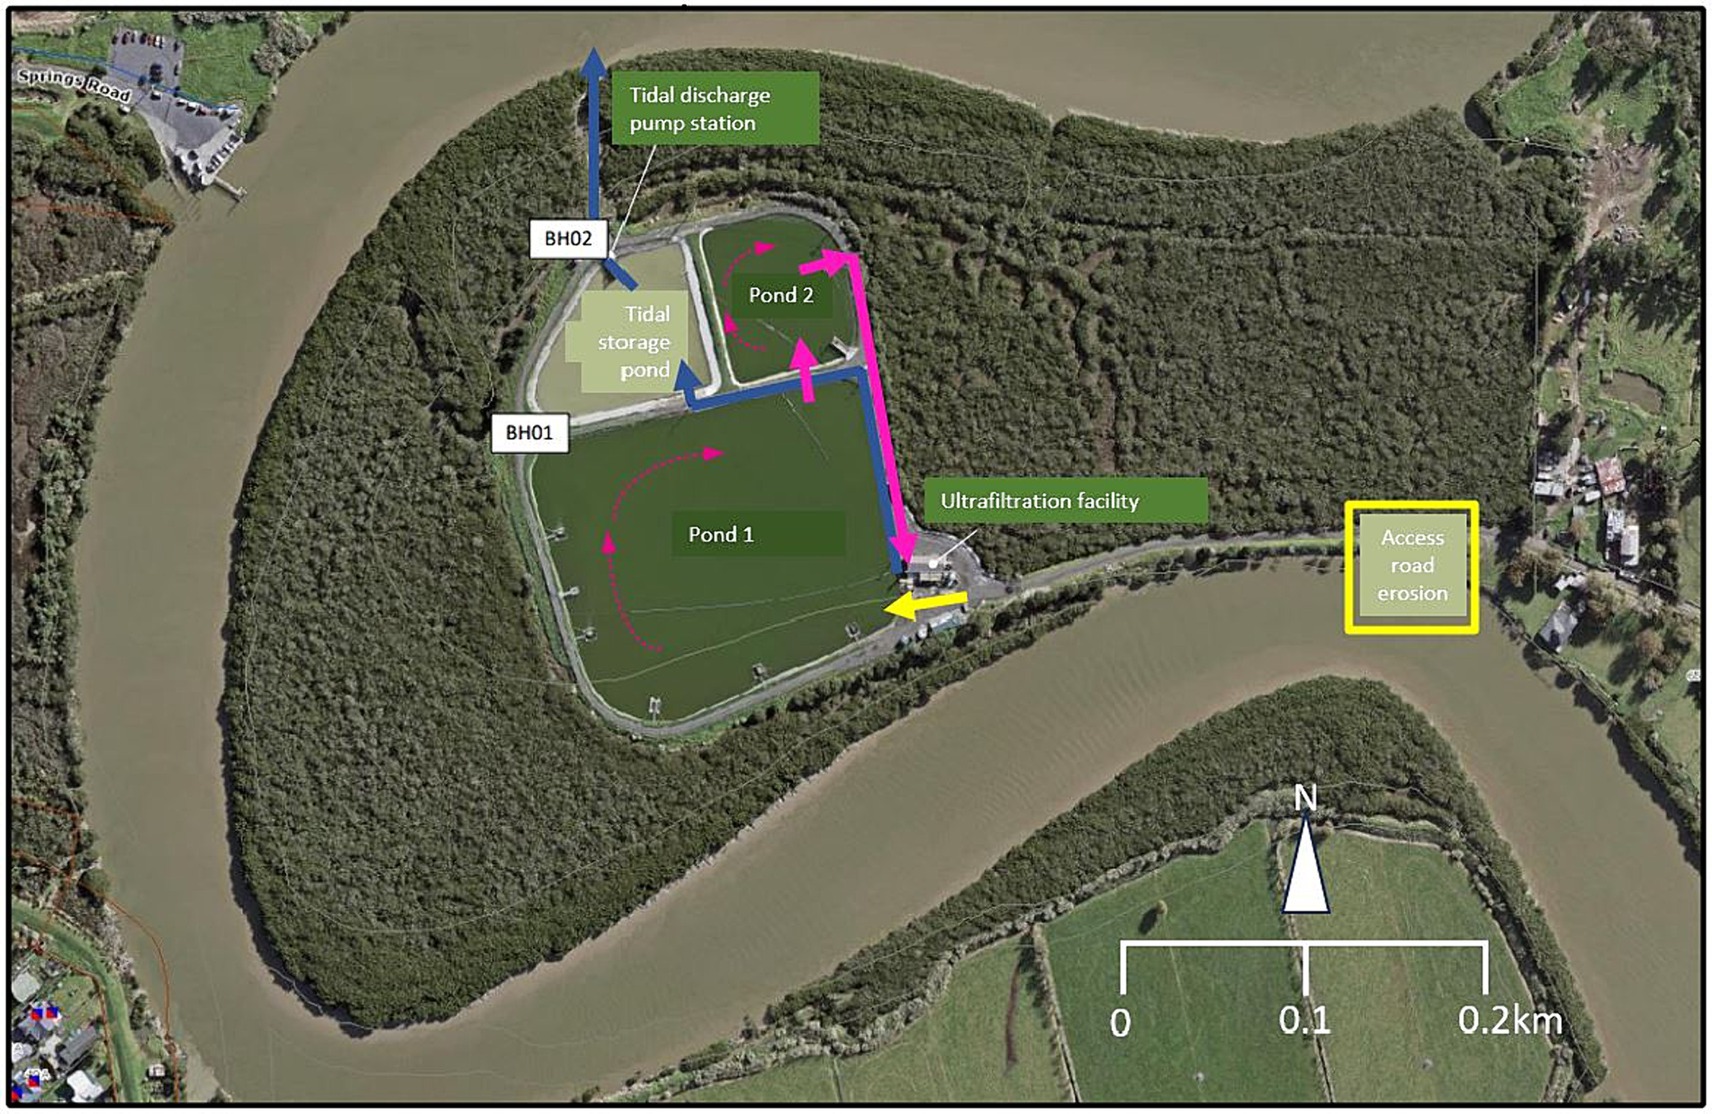
Figure 2. Helensville WWTP. Yellow arrow shows influent input to the WWTP. Solid pink arrows show movement of untreated and partially treated wastewater, small dotted pink arrows show wastewater movement within ponds, blue arrows show movement of treated wastewater and discharge into the Kaipara River that occurs on the outgoing tide. BH01 and BH02 indicate the location of groundwater boreholes. The yellow box shows the location of the access road, which is eroding. Image courtesy of Watercare.
Raw sewage is pumped up to 5 km from the Helensville and Parakai townships to the plant and flows through oxidation ponds 1 and 2 where it is biologically treated. It is then pumped through an ultrafiltration unit which filters out solids and microorganisms. The filtered water is then stored in the tidal storage pond and discharged via the outfall at high tide. At the inception of our research the plant ran at or near capacity, particularly during heavy rainfall events when there is infiltration into the wastewater pipe network, and there were on average seven non-compliant discharge events per year.
The plant operator, Watercare Services Limited (hereafter: ‘Watercare’), knew that changes were needed to the plant operations and location and were seeking certainty around the best way to adapt. In 2018, Watercare independently developed two DAPPs for Helensville-Parakai to guide their adaptation planning: one for the wastewater treatment plant (Figure 3) and one for the freshwater supply system. Four options were identified for climate change adaptation and for adapting to forecast influent volume increases. Watercare were an early adopter of DAPP in NZ but felt like they were ‘feeling their way through’ their first DAPP and contacted our research team for additional guidance (Stephens et al., 2021).
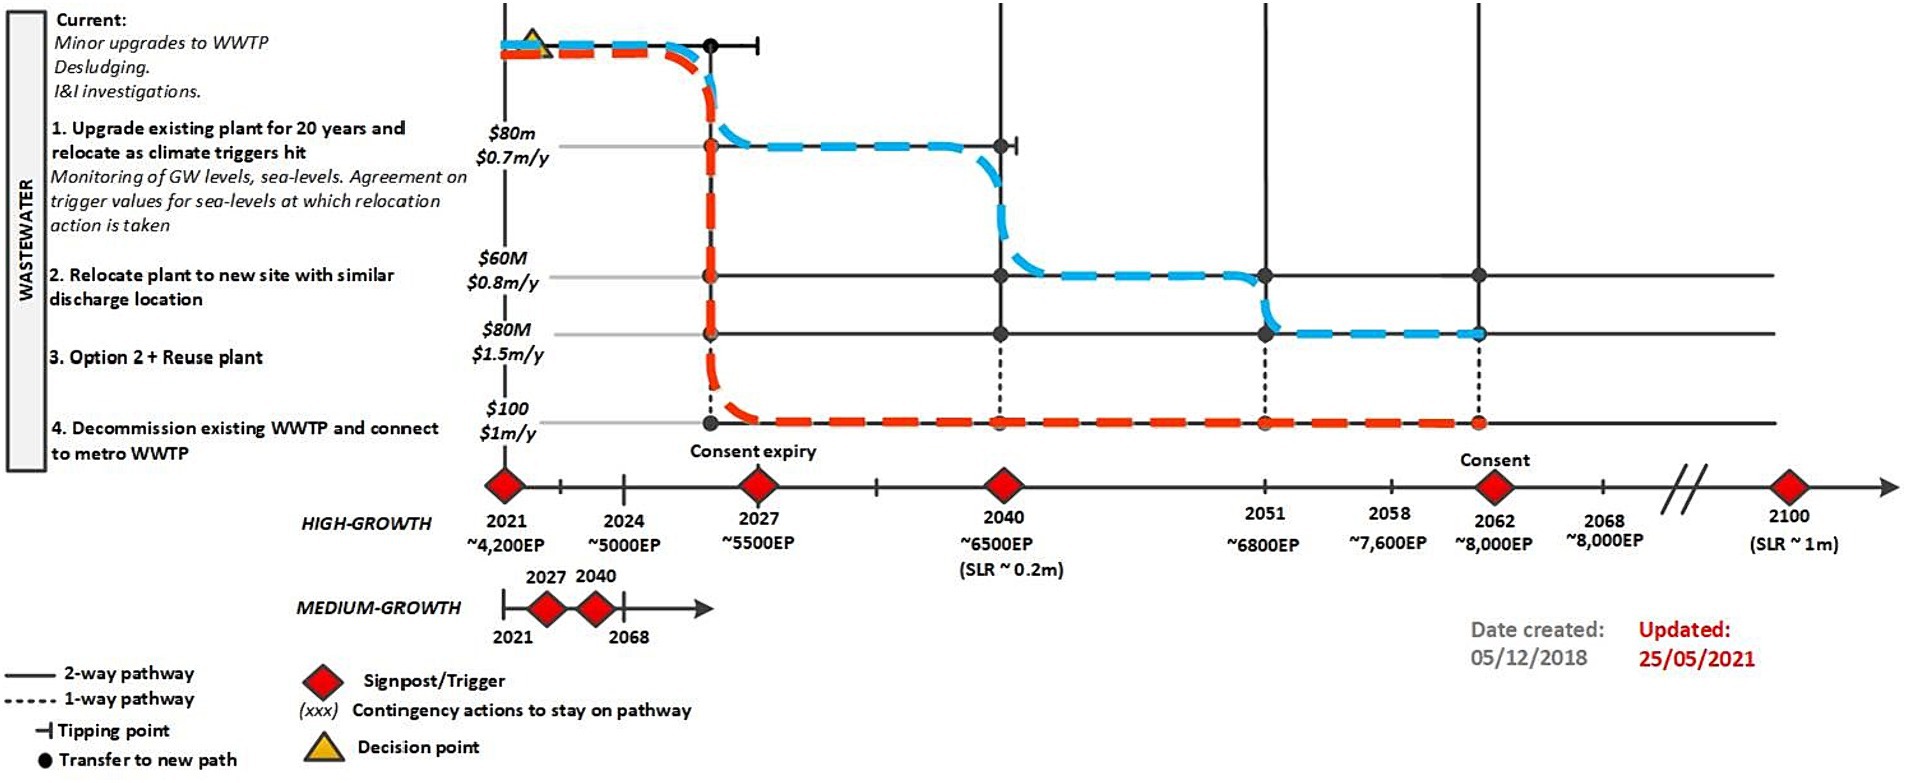
Figure 3. DAPP for Helensville-Parakai wastewater system. Blue line shows an incremental adaptation pathway, with gradual changes to the system prior to relocation of wastewater treatment elsewhere in the area. The red line shows a transformational change via a single shift to managed relocation. All actions in the DAPP were costed at the time of its development, so ROA was not used in the Helensville-Parakai wastewater case study. The plant upgrades implemented have a design life of 25 years, rather than the 20 years shown in the DAPP. Image courtesy of Watercare.
While considering the longer term, Watercare’s immediate focus was on reducing the likelihood of discharge quality failures—where effluent quality is non-compliant with the plant’s discharge consent—to zero. Accordingly, they implemented adaptive action 1—upgrading the existing plant with the intention of relocating when climate triggers were reached—in 2022. This action, therefore, became the focus of our modelling. The focus of case study one is on how an agency could go about implementing a DAPP. The aim was to quantify the thresholds, the triggers, and to understand what to monitor.
Figure 4 shows the methods used in case study one in the order in which they were used. A workshop was held to discuss the problem context, uncertainty around the speed of climate change and the ways different hazards interact in the vicinity of the Helensville WWTP, the magnitude and frequency of compound hazard events, and the DAPP that had been previously developed to guide adaptation and possible retreat of the WWTP. Subsequently, the researchers developed a system map (Figure 5) showing the WWTP alongside climate change hazard drivers and adaptation thresholds (Stephens et al., 2021). The system map was discussed with Watercare representatives, minor alterations made, and the use of policy levers and adaptation actions considered.
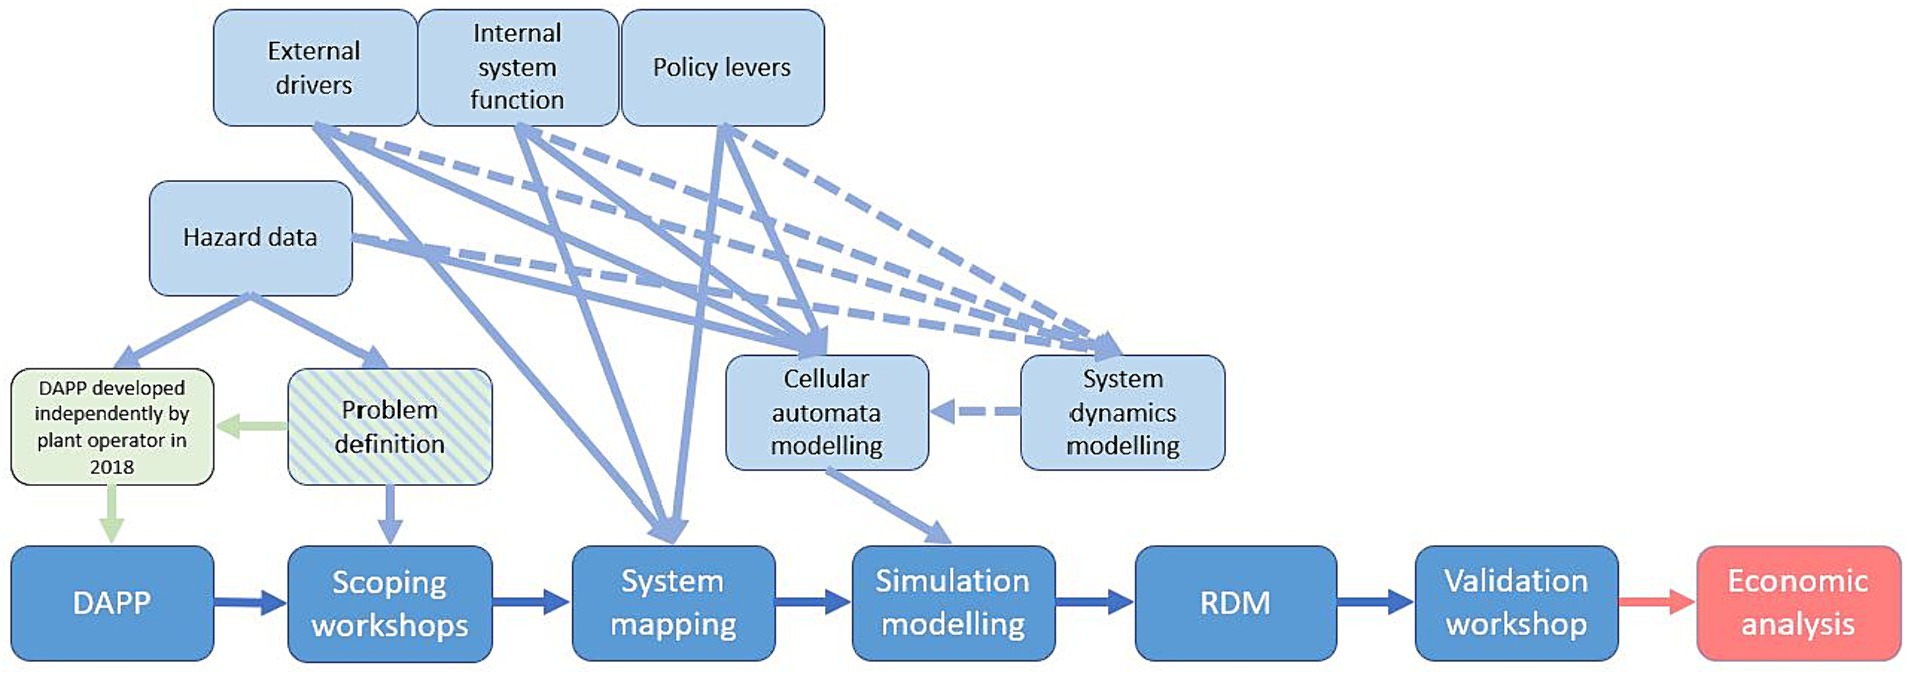
Figure 4. Methods used in case study one. Light-blue boxes indicate actions undertaken as part of a method. Dotted arrows highlight that system dynamics modelling was used but did not inform the results of this case study due to the lack of a spatial component. Green box indicates work undertaken independently by the case study partner before this research began on multi-hazards application of DAPP. The red box was not undertaken in this case study. Problem definition was undertaken twice: by Watercare when developing the DAPP, and by the research team and Watercare during scoping workshops for this project.
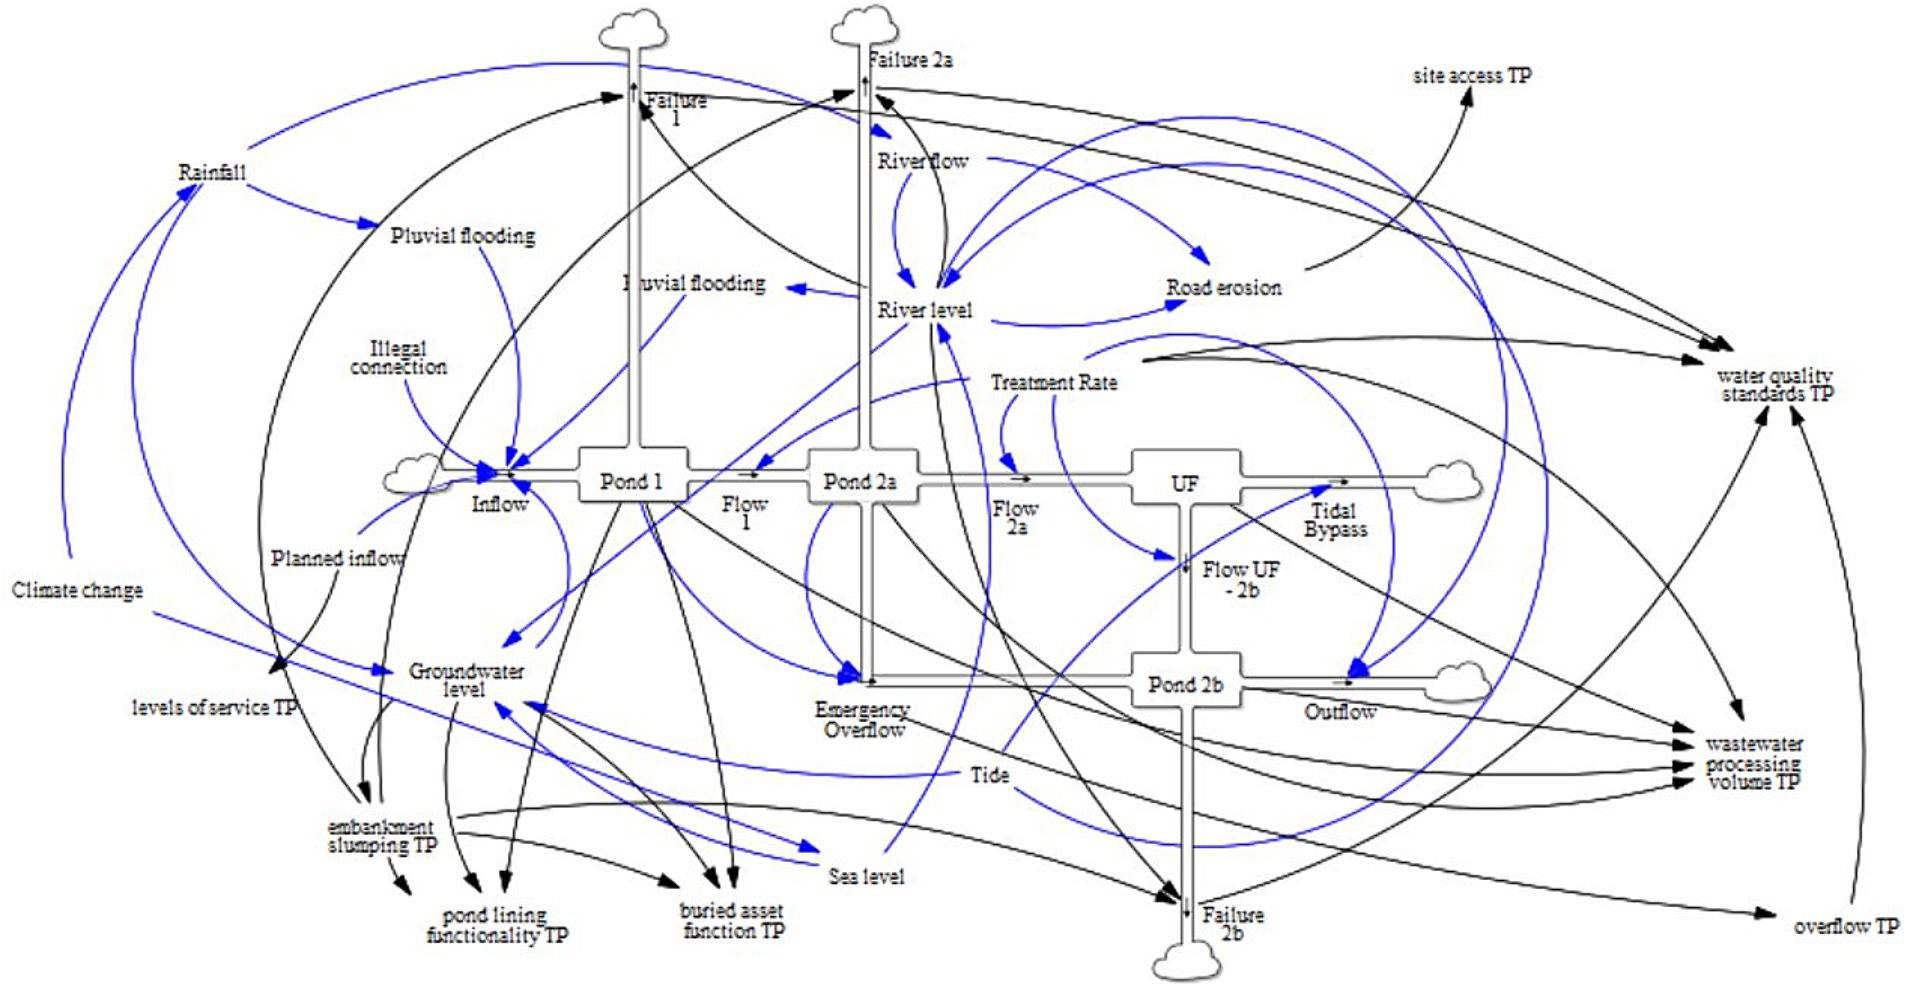
Figure 5. System map of Helensville WWTP showing critical connections within the system. Blue arrows show the influence of one variable on another, and black arrows show the influence of a variable causing an adaptation threshold to be reached. Boxes and large arrows show the movement of wastewater into, within, and out of the WWTP.
A basic system dynamics model, building on the system map was developed, but the absence of a spatial component in the system dynamics modelling meant that while it could simulate the conditions under which the WWTP may be inundated, it was not able to indicate where the plant was susceptible to failure. A cellular automata1 model was subsequently developed to address this early limitation. The model is spatially explicit and temporally dynamic, meaning that it simulates impacts at different areas of the plant and runs on a (daily) timestep, from 1 January 2022 to 1 January 2080. Watercare intended to have the plant moved before 2050 (Figure 3), so we did not simulate to at least 100 years (the time horizon for planning in the coastal environment in national direction). Inflow and plant processing capacity interact to simulate discharge effluent quality and volume, and multiple hazards interact to simulate plant viability at the current location.
The model includes data on groundwater, historic rainfall, rainfall/runoff projections, tides in the river, RSLR and local vertical land movement (VLM), influent and effluent to/from the WWTP, pond levels, topography/elevation, and inflow scenarios. Details on both case study models, data sources and model procedures is included in Supplementary material to this paper. Erosion of the access road, a known issue, was not simulated due to uncertainty around the conditions under which this erosion occurs; ongoing monitoring and maintenance of the access road means that any erosion can be promptly repaired when it occurs and so is unlikely to become an adaptation threshold. The model included adaptive action 1; as actions 2, 3 and 4 in the DAPP (shown in Figure 3) occur offsite and involve moving the WWTP to a different location. Only action 1 was simulated in the model as that was the existing system being modelled, whereas actions 2, 3 and 4 simulate a transition to a new wastewater system for Helensville in a new location. During model development, Watercare began implementing adaptive action 1, and completed the process shortly after the modelling was completed. Adaptive action 1 increased WWTP processing capacity by 50%, with subsequent impacts on processing volumes and discharge effluent quality but has no impact on the resilience of the plant to hazard impacts or inundation.
An RDM analysis was undertaken on the model, simulating the implementation of adaptive action 1 at two-yearly intervals between 2022 and 2040 (2022, 2024, 2026, etc.), to stress test actions against a wide range of future conditions for failure to meet the objectives. The model was driven by combinations of RSLR, influent scenarios and upgrade timing. All potential combinations were tested using a Monte Carlo approach of 10,000 iterations per combination, to ensure the full suite of potential system behaviours was simulated. The results of the RDM analysis were subsequently workshopped with Watercare during a validation workshop, to discuss the impacts and implications of the research.
Case study two is the Seaview WWTP located in Petone near Wellington, New Zealand. It is located on reclaimed land (infill) 300 m inland from Wellington Harbour and the mouth of Te Awa Kairangi / Hutt River (Figure 6). The plant and surrounding land are very low-lying and existing analysis suggests that the plant will become susceptible to inundation in a 1% AEP event after 60 cm of RSLR. The main hazards facing the plant are RSLR, high river flows, and groundwater flooding, particularly if these occur simultaneously at or around high tide. Groundwater in the study area is modulated by tidal level; rainfall and high river flows occurring at high spring tides, pose the greatest risk to the plant.
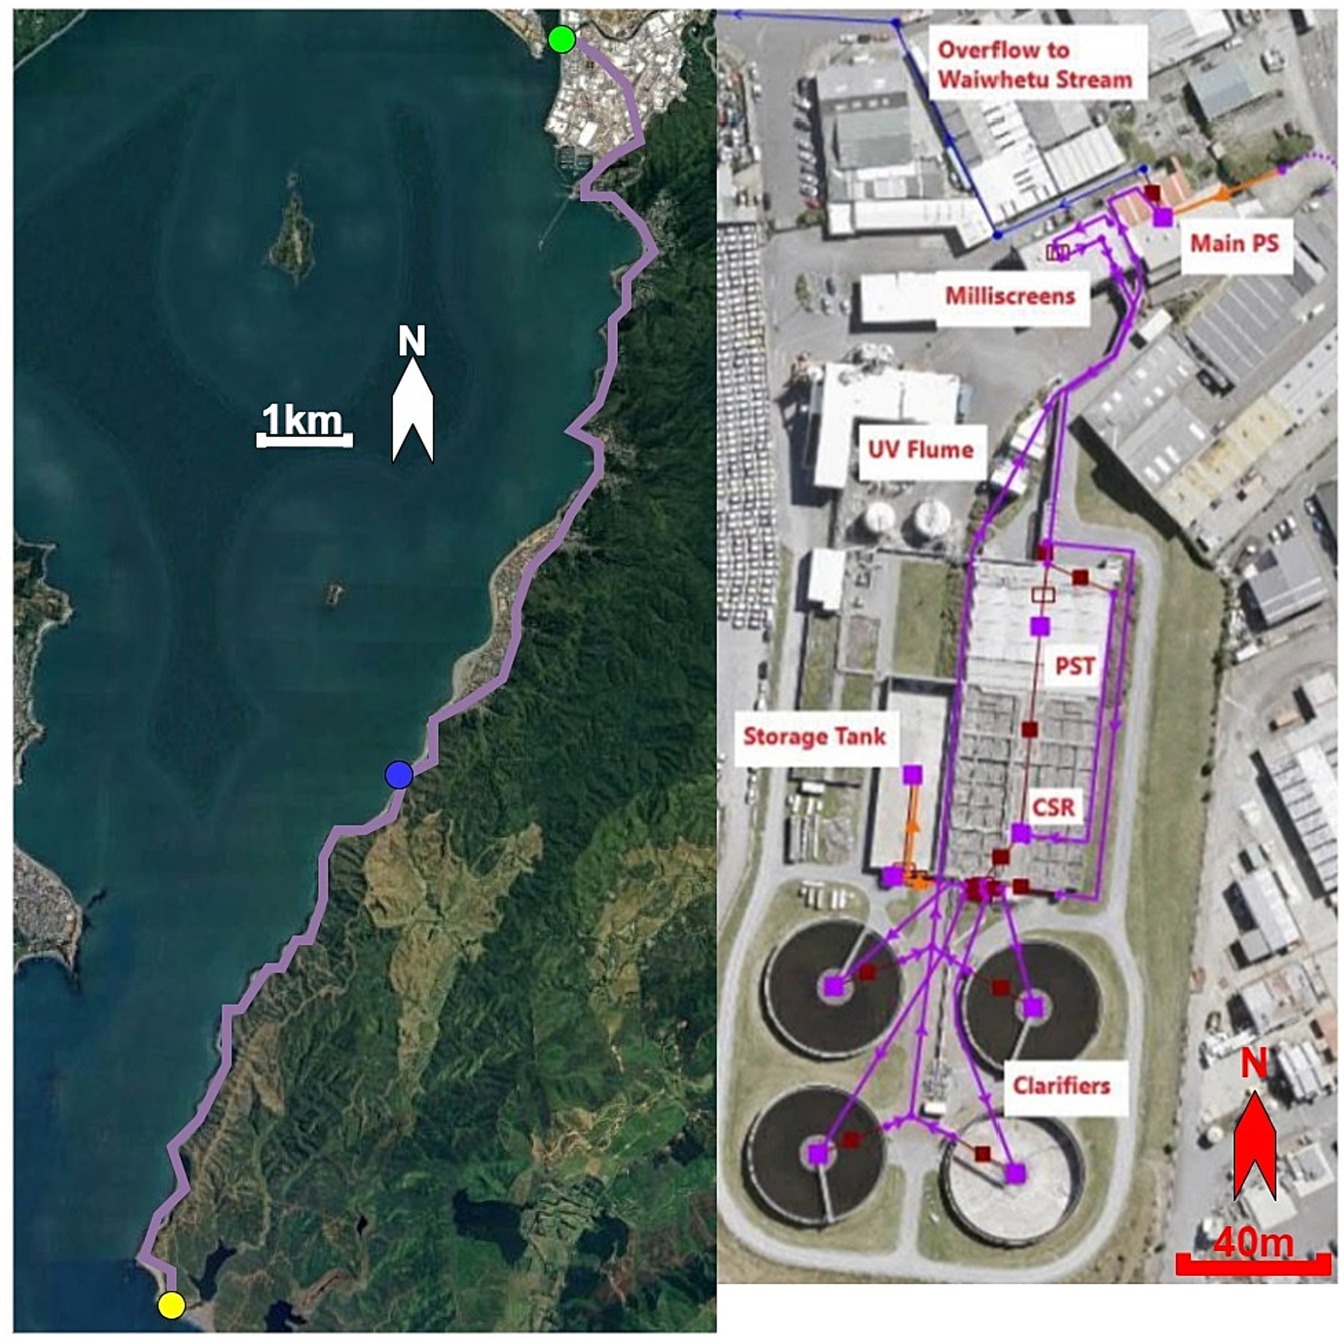
Figure 6. Map of Seaview WWTP and outfall pipeline. Right image: Orange arrow shows influent input to the WWTP (right image). Purple arrows show movement of untreated and partially treated wastewater within the plant, ending up back at the main pump station. Blue arrow shows emergency overflow to Waiwhetu Stream. Left image: Treated wastewater is pumped via the outfall pipeline (purple line), consisting of 18.1 km of 1,350 mm concrete pipe located below the road along the eastern coast of Wellington harbour, discharging at Pencarrow Head (left image). Green dot shows location of overflow to Waiwhetu stream. Blue dot shows Emergency overflow from Point Arthur pumping station. Yellow dot shows vortex structure, bypass valve and outfall. Adapted from an image courtesy of Wellington Water (2020).
Seaview WWTP was opened in 2002. It services over 150,000 people living and working in the Hutt Valley, Petone and Wainuiomata areas of Greater Wellington. Influent travels through the trunk network into the plant, where it passes through several screens, tanks, bioreactors, clarifiers and ultraviolet treatments within the plant grounds (Wellington Water, 2020). Treated effluent travels through a 15 km pipeline located under the road on the eastern margin of Wellington Harbour to an outfall at Bluff Point, at the harbour entrance. The plant is generally compliant with its discharge consents. The previous consent for discharges of treated or partially treated effluent into the Waiwhetu Stream via an overflow pipeline expired in 2018, but the plant has continued to intermittently discharge via the Waiwhetu overflow since that time, as they proceed through the discharge consenting process. Discharges into the Waiwhetu Stream occasionally occur during or immediately after heavy rain events, during maintenance, or in the event of power failure to the plant (Wellington Water, 2020).
Seaview WWTP’s design life is until 2080. The plant operator, Wellington Water, is acutely aware of the need for adaptive approaches to planning infrastructure upgrades with uncertainty around the timing, magnitude and frequency of climate change hazard events and the costs of adaptation. The uncertainties of greatest concern to Wellington Water are around the impact of climate change and hazard events on the plant, trunk and outfall pipeline, rather than uncertainties around discharge effluent quality; as the groundwater rises commensurate with RSLR, the hazards compound and become increasingly likely to occur. Therefore, our modelling focused on climate change hazard impacts and did not simulate internal plant workings of influent processing and discharge effluent quality.
Case study two is a fully heuristic case study: no internal Wellington Water process had been followed to identify adaptation thresholds, actions, lead times, triggers or indicators. The research team ran workshops to create these in order to demonstrate the value of this method to Wellington Water. The DAPP developed, is an illustrative adaptation plan for Wellington Water for the Seaview WWTP. In other words, it was a proof-of-concept.
The research team held a workshop with Wellington Water to discuss the methods to be used in case study two (Figure 7). The following were discussed—the problem definition, uncertainty around the speed of climate change and the ways different hazards interact in the vicinity of the Seaview WWTP, the magnitude and frequency of compound hazard events, and the process of developing a DAPP for the trunk network, WWTP and effluent pipeline and outfall. Subsequently, the researchers developed a system map showing the WWTP alongside hazard drivers and adaptation thresholds (Figure 8).
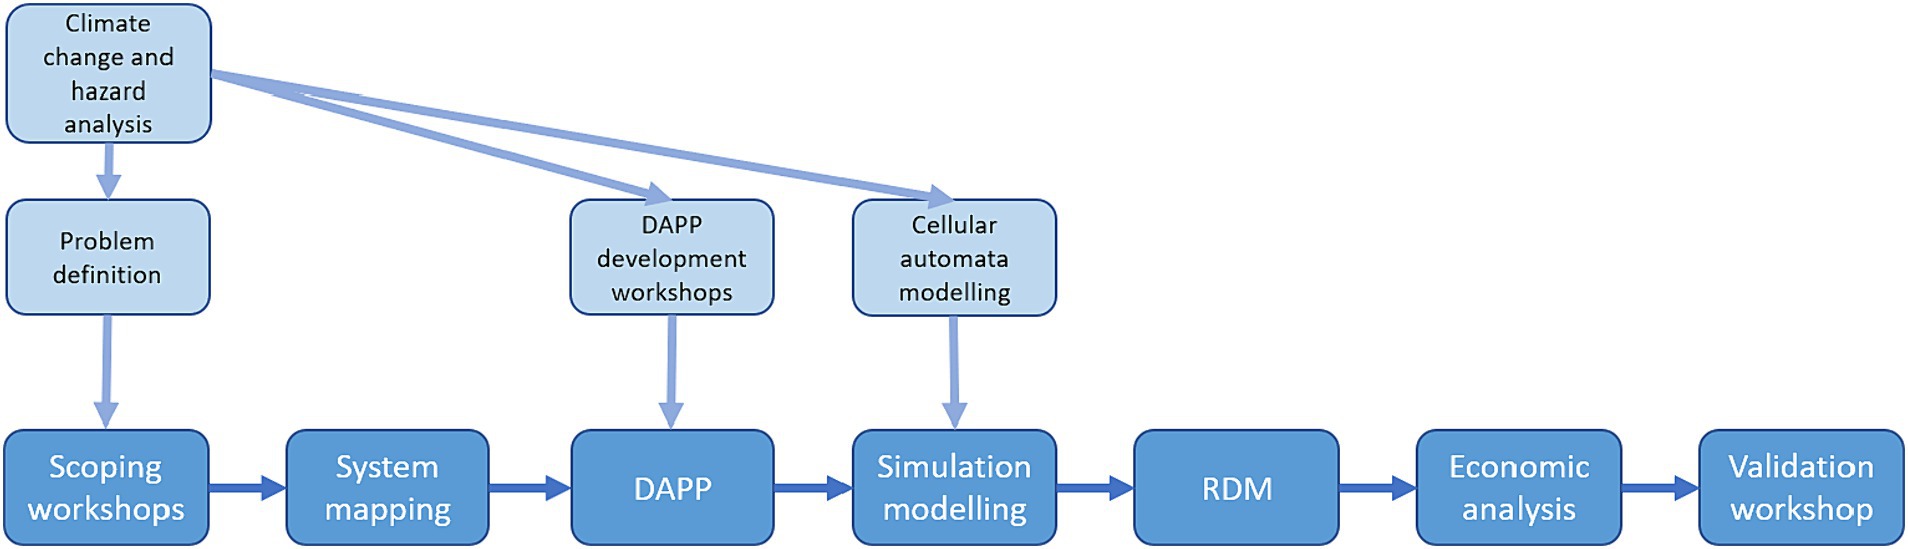
Figure 7. Methods used in case study two. Note the sequence of actions is different from case study one (Figure 4); the methods can be applied in different orders depending on how much background work has been undertaken and the needs of the infrastructure provider.
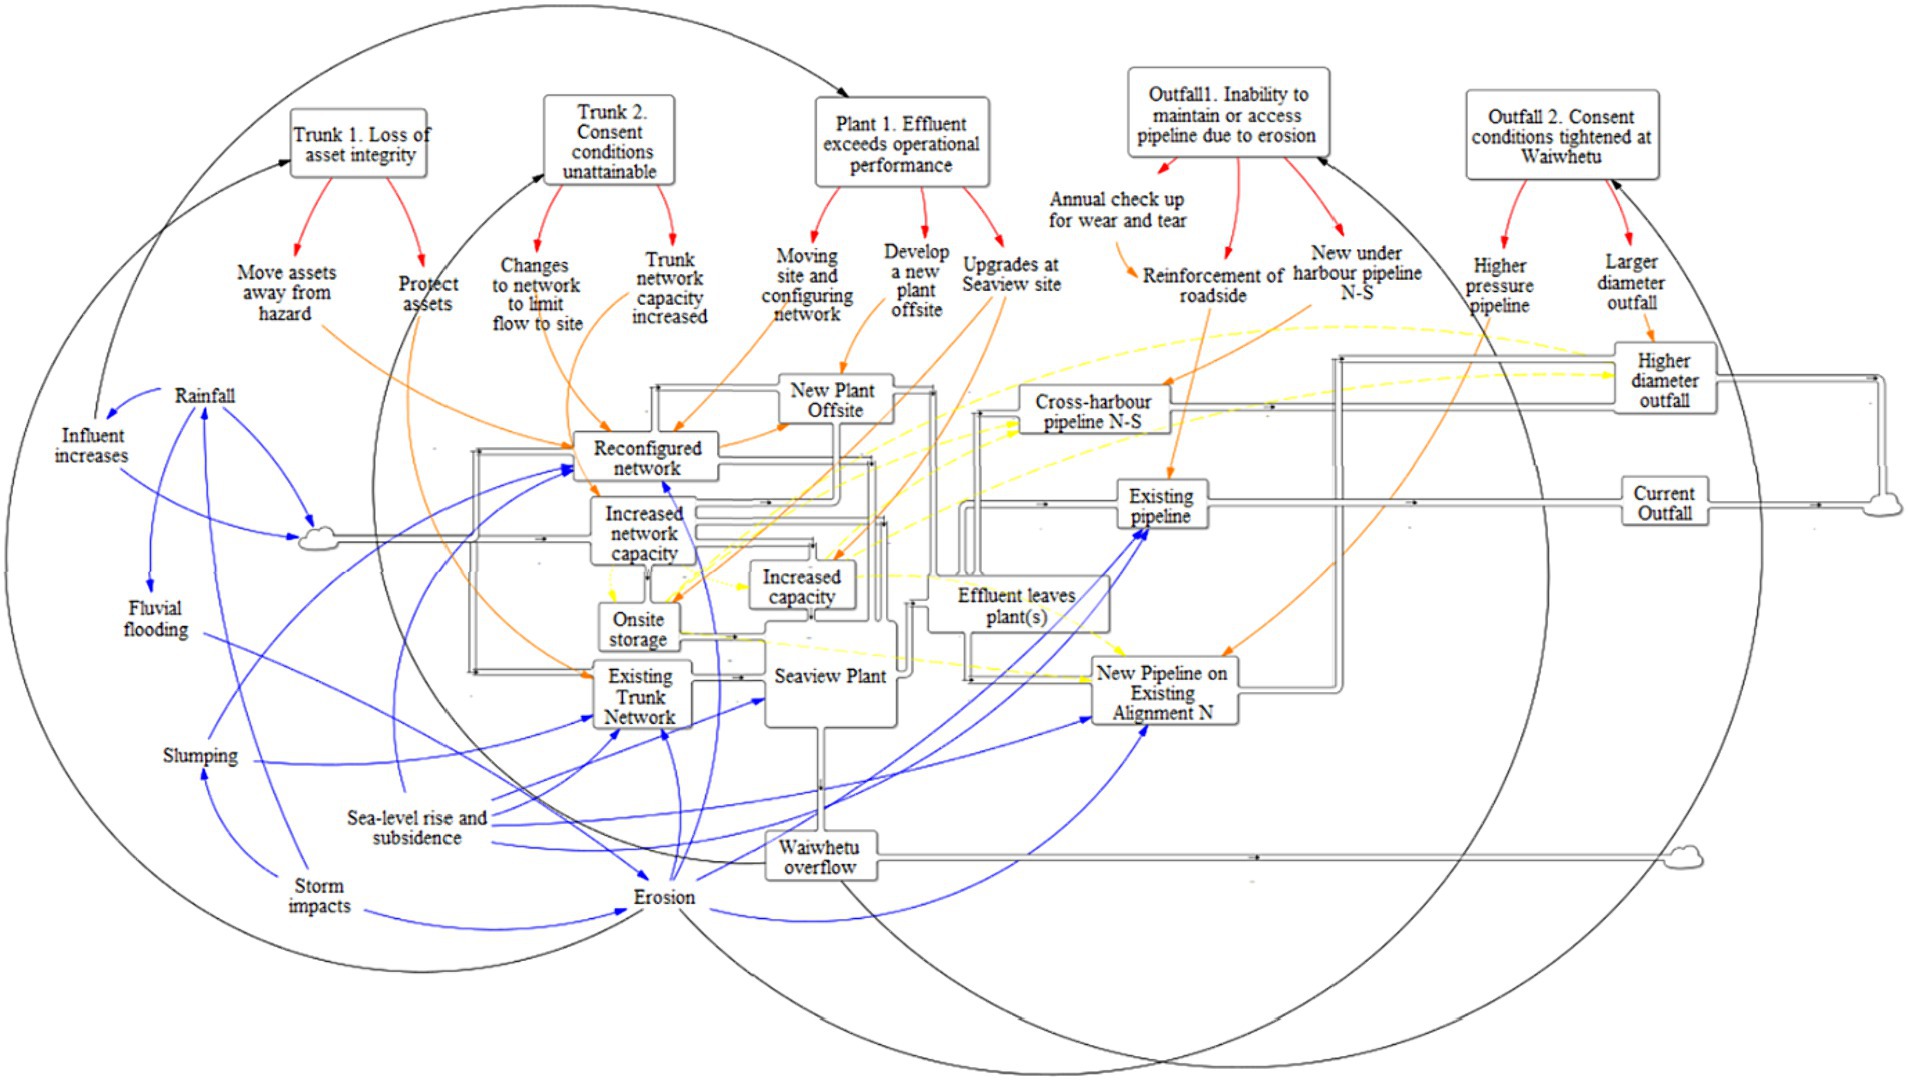
Figure 8. System map of Seaview WWTP showing critical connections within the system. Central boxes linked by pipes show the trunk network, Seaview WWTP and outfall pipeline and the movement of wastewater through the system. Top boxes show triggers. Black arrows show the drivers that may lead to triggers being reached. Red arrows show options for adaptive actions for each trigger. Orange arrows show where actions are implemented in the system, yellow arrows show secondary actions that are required if an action is implemented. Blue arrows show the influence of one variable on another.
Following the first workshop, the research team ran a series of workshops with Wellington Water to develop a DAPP for Seaview WWTP, trunk network and outfall pipeline with a specific focus on coastal hazards (Figure 9 and Table 1). Five adaptation thresholds were identified: two for the trunk network, one for the WWTP, and two for the effluent pipeline and outfall. Each adaptation threshold had options identified that were able to prevent the threshold from being reached. Each action has an associated lead time and lifetime which was considered during DAPP development; triggers needed to be set at a level that allowed each adaptive action to be implemented without reaching the adaptation threshold.
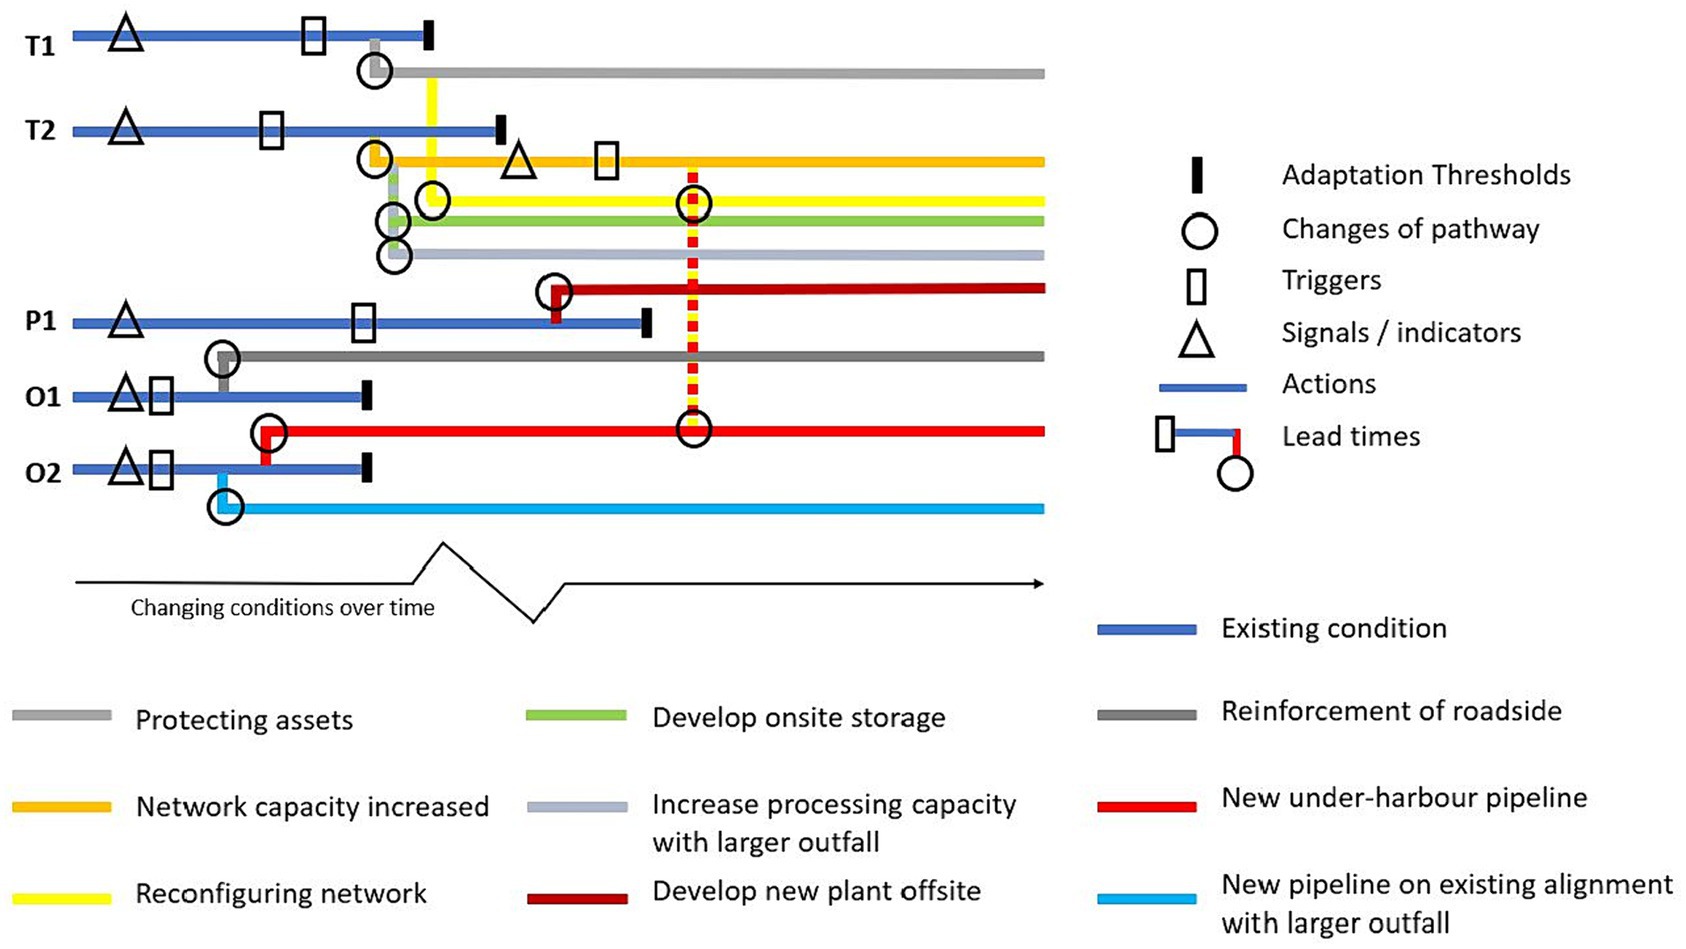
Figure 9. Seaview WWTP DAPP plan. T1 is trunk network status indicator 1, T2 is trunk network status indicator 2, P1 is WWTP status indicator, O1 is outfall pipeline status indicator 1, and O2 is outfall pipeline status indicator 2. Dotted vertical lines indicate a choice of option. E.g., if network capacity is increased (orange), one of onsite storage (green) or increased processing capacity with a larger outfall (light grey) must also be undertaken. Increased network capacity can also lead to a future trigger, meaning that a choice will be needed between a reconfigured network (yellow) and a new under-harbour pipeline (red).
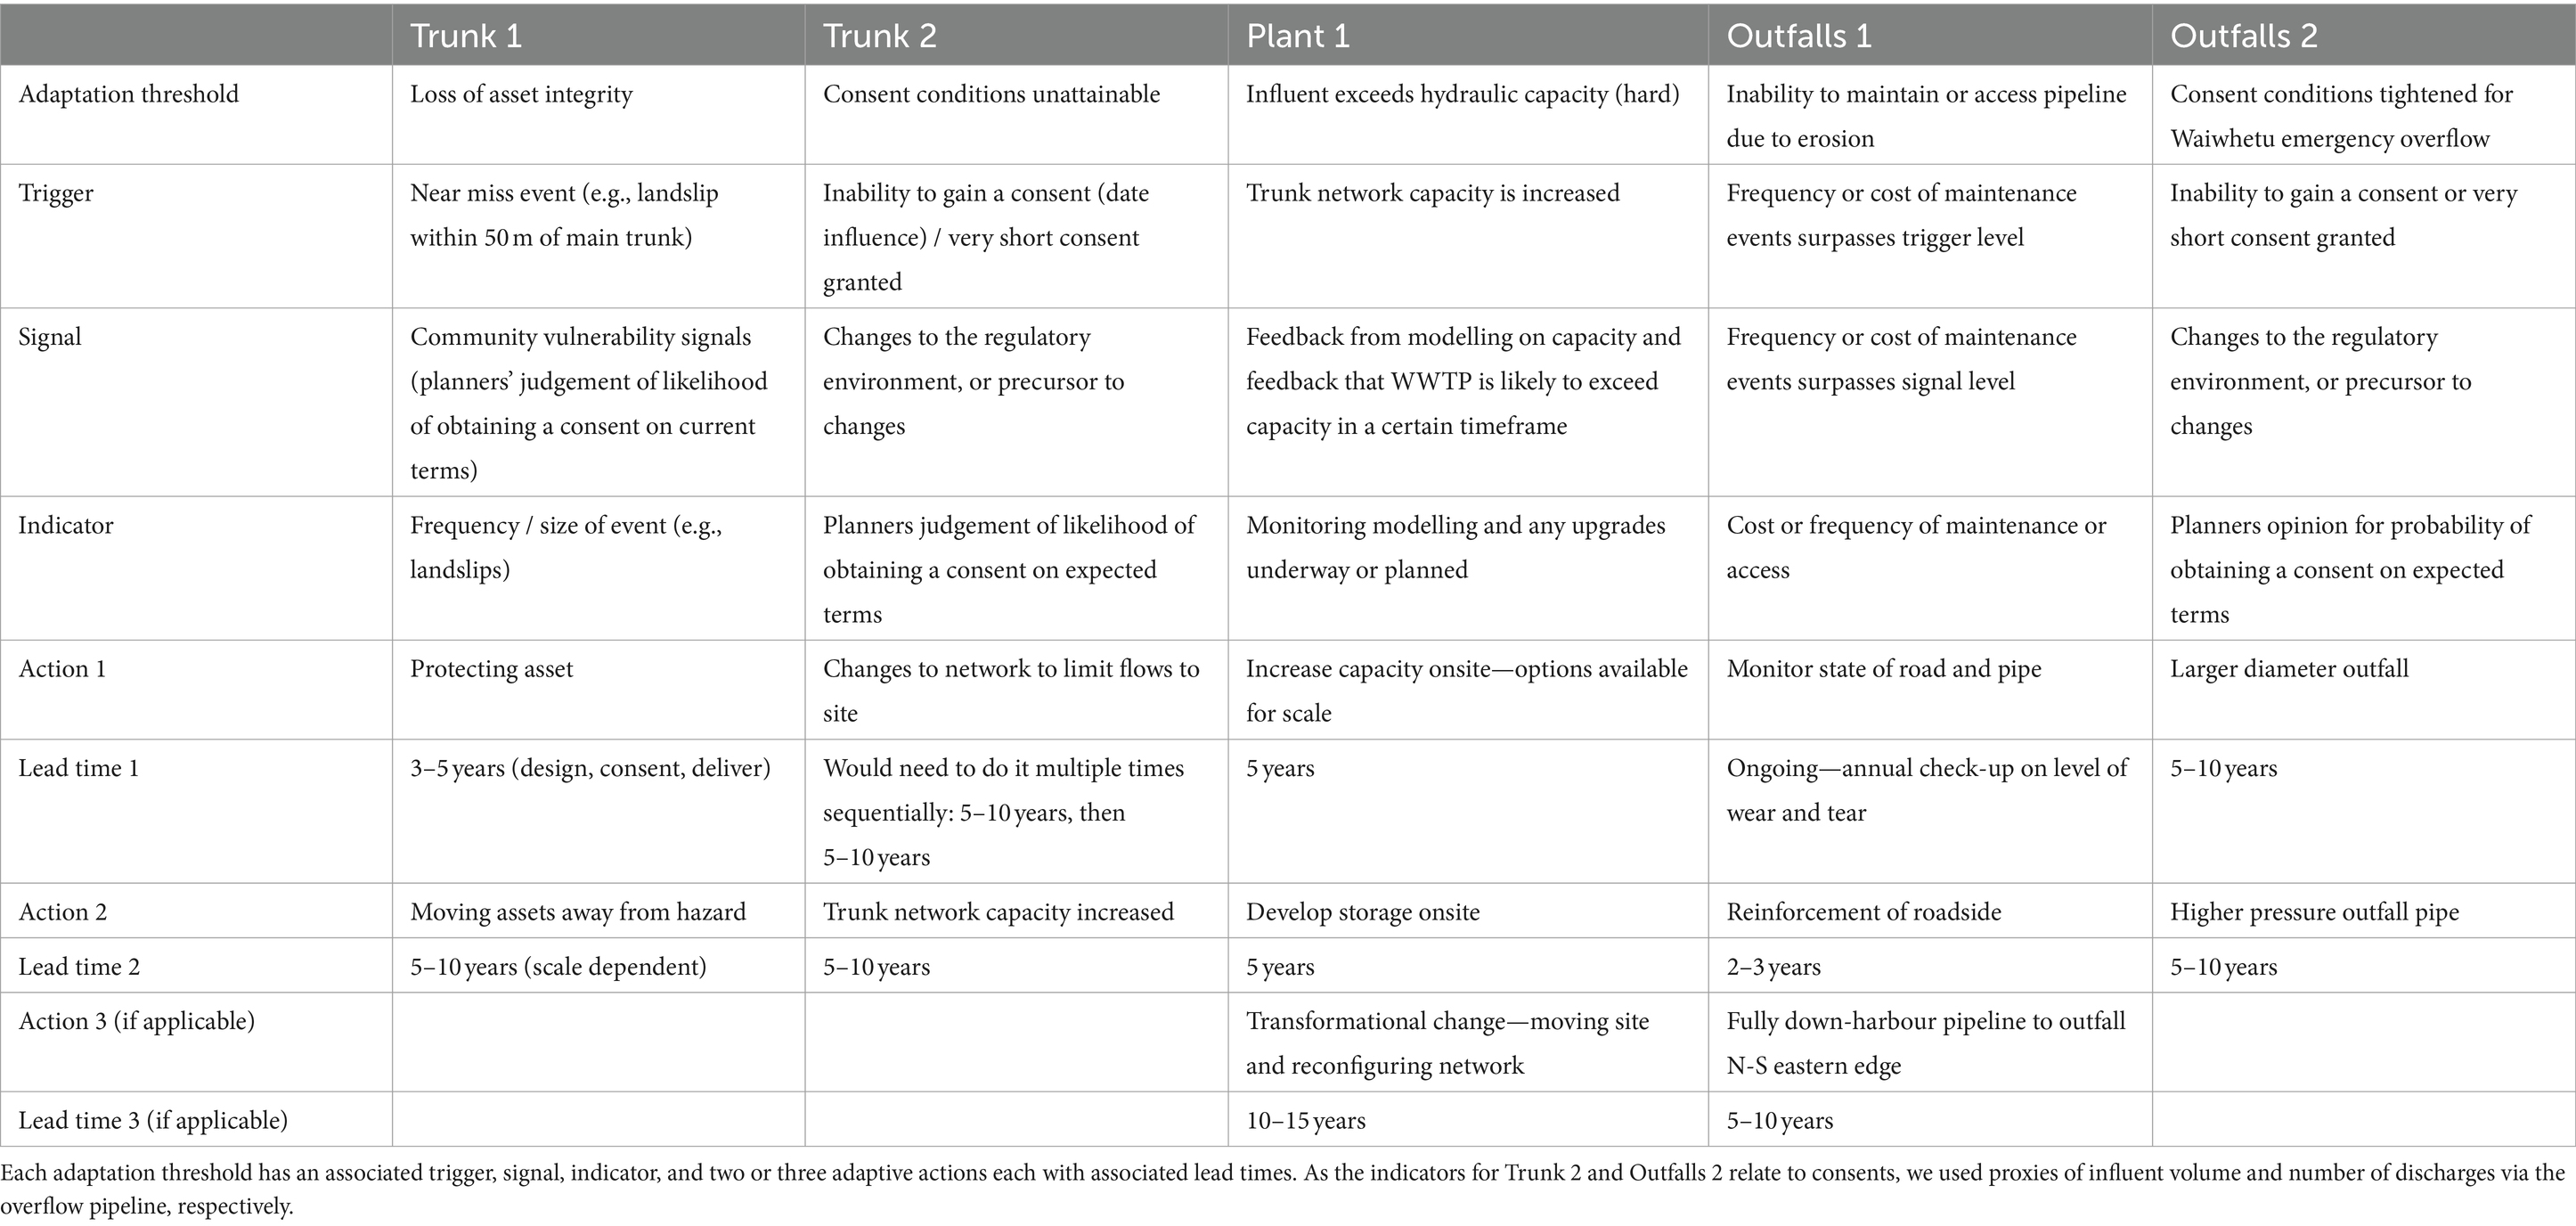
Table 1. DAPP components for Seaview WWTP DAPP plan.
A cellular automata model was developed to simulate Seaview WWTP, the trunk network, effluent pipeline and outfall. The model includes data on groundwater, historic rainfall, rainfall/runoff projections, tides, erosion, RSLR and VLM, influent and effluent to/from the WWTP, topography/elevation, and inflow scenarios. The model runs on a daily timestep from 1 January 2020 to 1 January 2100; this is the design life of the Seaview WWTP (2080) plus 20 years. Multiple hazards interact to simulate potential impacts to plant / plant viability at the current location. The modelling process simulated the implementation of the DAPP, with new actions chosen when triggers were reached in order to avoid adaptation thresholds.
A four-step RDM analysis was undertaken using the model. At step one, the model was run for 1,000 iterations for each emissions scenario with no adaptive actions taken in order to determine how long the plant, trunk network, and effluent pipeline and outfall are viable in their current states and locations without intervention. The number of iterations was reduced from case study one due to the computational expense2 of running 10,000 iterations for each potential combination of SSP3 and influent; in this case, model testing showed no statistically significant difference between outputs generated in 1,000 and 10,000 iterations when testing the performance of the automated DAPP plan. At step two, the model was run with the DAPP plan allowed to operate as developed in the workshops, to see whether the automated DAPP plan would select adaptive actions that allow the network to operate past 2,100. Each combination of SSP and influent scenarios was run for 1,000 iterations. At step three, an RDM analysis was undertaken. Adaptive actions that failed to meet the performance objective (allowing the wastewater system to continue to operate) were iteratively ruled out, and archetypes of adaptation were identified: sequences of adaptive actions that achieved the performance objective (see Figure 10).4 At step four, the adaptation archetypes were simulated for each potential combination of SSP and influent to see how successful they were at achieving the performance objective. Again, each combination of SSP and influent scenarios was run for 1,000 iterations.
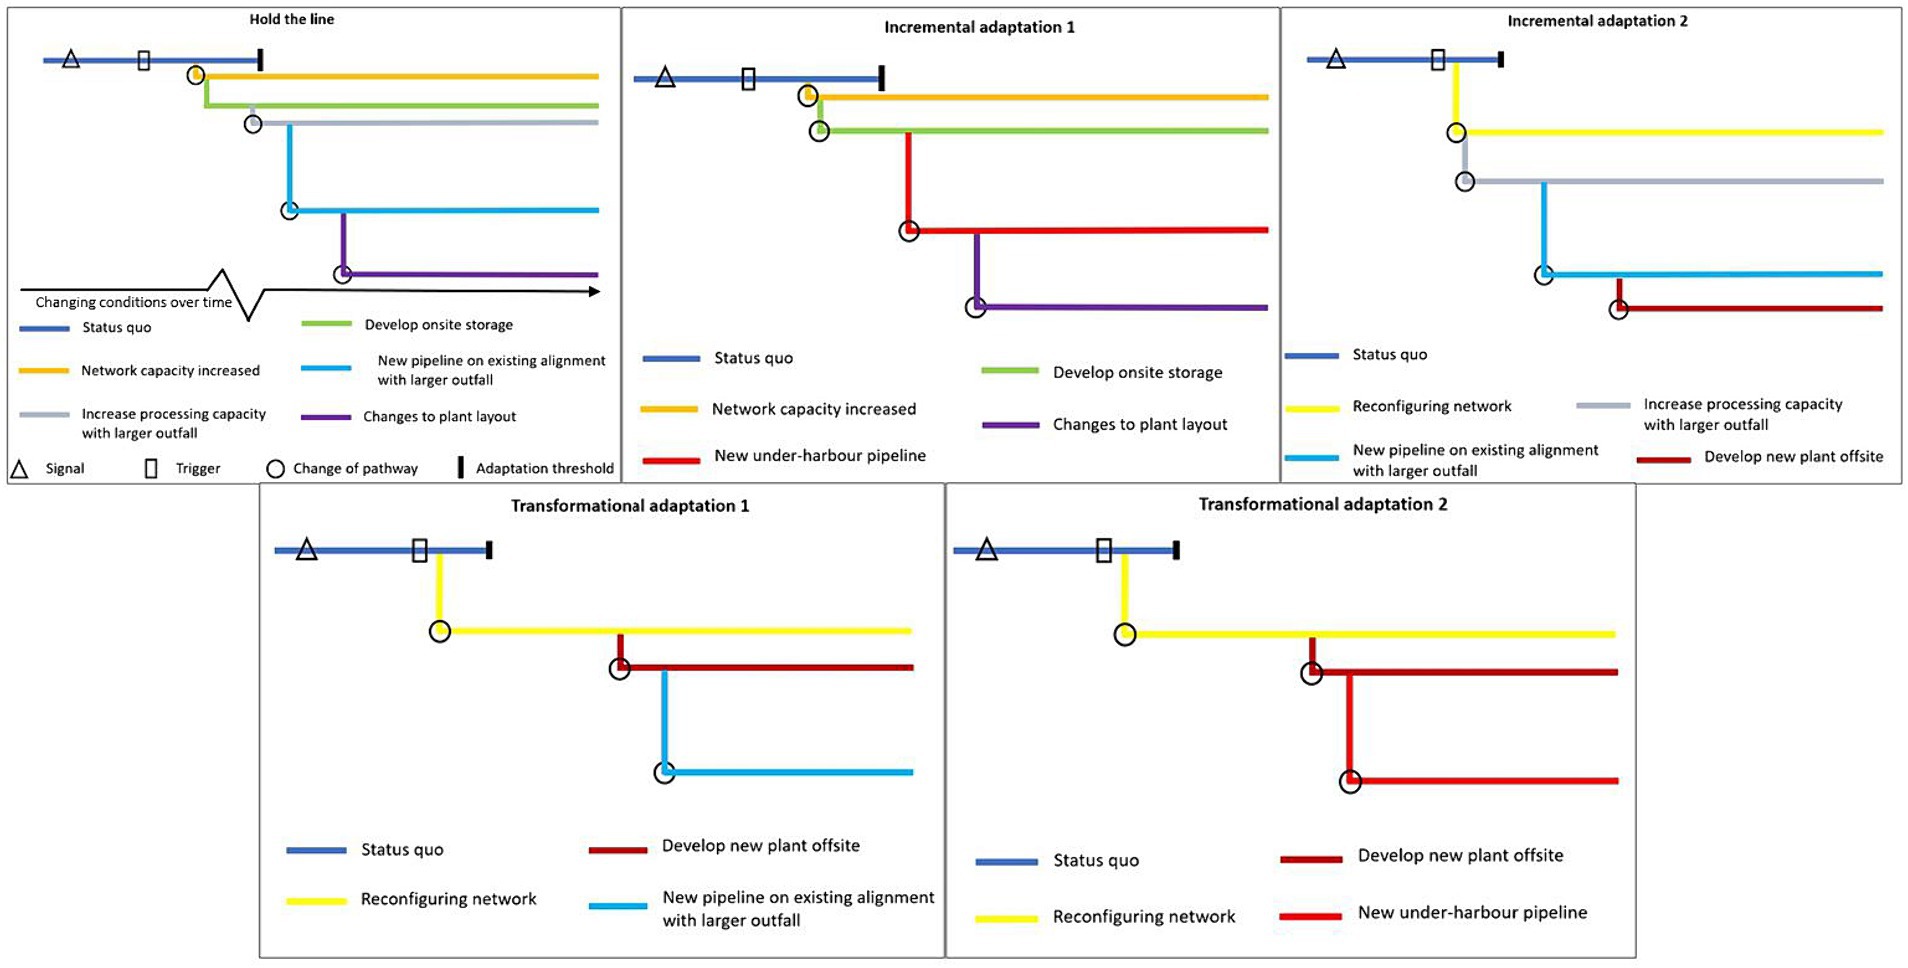
Figure 10. Adaptation archetypes for Seaview WWTP. Five sets of adaptive actions that are robust to future uncertainty in climate and influent volumes. The timing of when adaptive actions are implemented within each adaptation archetype is RSLR dependent: faster rates of RSLR requires actions to be implemented earlier than in slow RSLR scenarios. Times are not given on the figures x axes as the timing of implementation of each action in each adaptation archetype differs according to the rate of RSLR and adaptive actions would be triggered by monitoring the indicators outlined in Table 1.
Step one:
Step four:
The final step in the analysis was applying a form of ROA suitable for use under imminent threat and deep uncertainty (Stroombergen and Lawrence, 2022), carried out on the archetypes developed at step three. The fundamental point of ROA is to compare costs of alternate adaptive actions / adaptation archetypes and assign a value on the option to delay an action (such as investment in flood protection) that may reduce the uncertainties. The benefit of less uncertainty, and thus a superior investment, is compared to the cost of greater damage from postponed investment. Figure 11 shows how ROA fits with other quantitative methods.
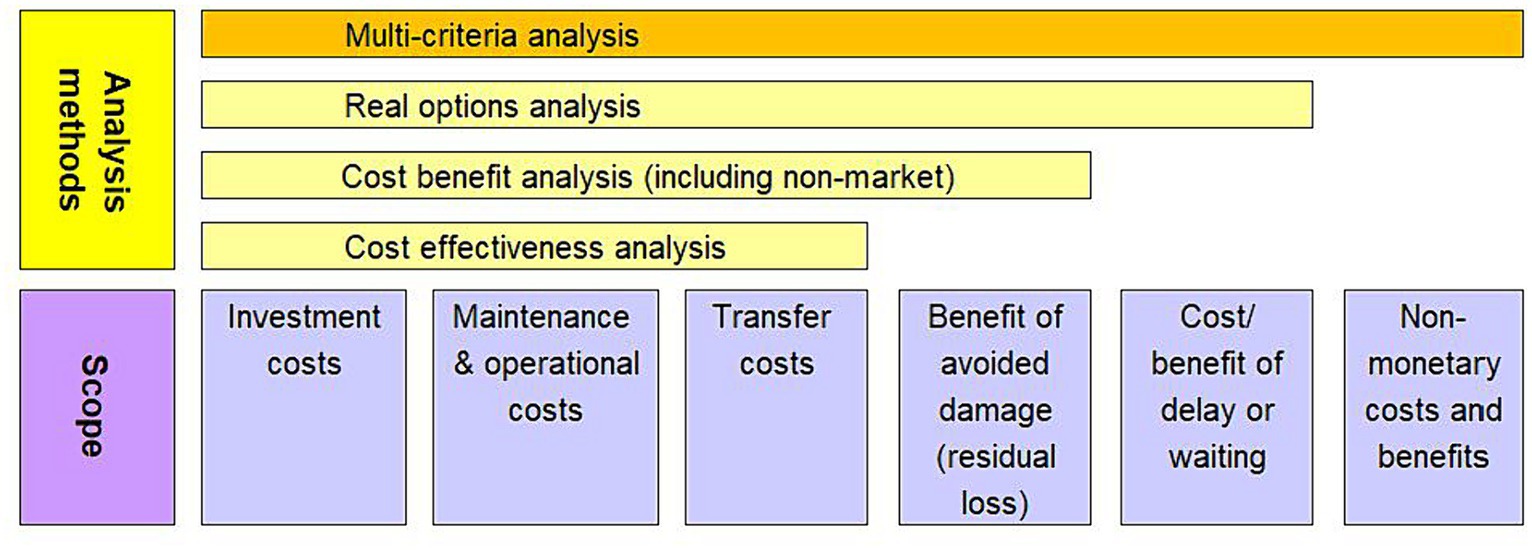
Figure 11. Economic analysis methods to assess adaptation strategies. Upper yellow boxes show analysis methods and lower purple boxes describe scope of the methods. Note, that the delay option is not a benefit that is added to a project’s other benefits. Rather it amends the evaluation of the project’s benefits by allowing for multiple decision points rather than a single decision point. Adapted from Stroombergen and Lawrence (2022).
Multi Criteria Analysis (MCA) is an entirely different method that is used to convert qualitative assessments into quantitative scores. It can incorporate non-monetary valuations of gains and losses such as environmental effects (e.g., maintaining or losing wetlands) and social considerations such as preserving or losing historical landmarks. For this reason, MCA is depicted in Figure 11 as having a wider span of applicability than the economic appraisal techniques. All of the methods can be used within a DAPP framework. Cost benefit analysis (CBA) and cost effectiveness analysis (CEA), in which the benefits are identical across all scenarios, are alternative forms of economic analysis. CEA excludes the benefit side of the calculation as benefits are assumed to be the same across all options. CBA includes benefits but excludes consideration of the option to delay. ROA was selected for this work as the non-monetary costs and benefits of the actions had not been identified, so MCA was not an option. CBA and CEA were insufficient for this work as Wellington Water was interested in understanding the physical and financial implications of delaying adaptation.
The results of the model development, RDM and ROA analyses were subsequently workshopped with Wellington Water during a validation workshop, to discuss the impacts and implications of the research.
The Helensville WWTP is susceptible to overtopping from a 1% AEP event after 31 cm of RSLR. This is due to a combination of two major hazards—RSLR and river flow—peaking around the high tide. The model suggests that if the world follows a high emissions trajectory (e.g., SSP5-8.5) the Helensville WWTP may be rendered inoperable by periodic compound flooding events anytime from 2060 onward. In the case of a moderate emissions scenario (SSP2-4.5 and SSP3-7.0) this will occur sometime from 2065 onward, and in the case of a low emissions scenario (SSP1-1.9 and SSP1-2.6) this will occur sometime after 2070. Under SSP5-8.5 the 31 cm comprises 23 cm of SLR and 8 cm of VLM; the ratio of SLR to VLM differs for the other SSPs according to the rate of SLR.
The model has a margin of error of 6 cm water level as the historical rainfall record for the area needed to be extrapolated to include 1% AEP events; this extrapolation introduces uncertainty into the model. However, 6 cm is approximately 7 years of SLR under SSP5-8.5, so the timing identified for the plant being rendered inoperable is relatively robust. Additionally, there is always the possibility of a sub-1% AEP event occurring, which would result in higher water levels than those simulated.
With regard to discharge effluent quality, if influent to Helensville WWTP increases from 2021 volumes by 10% per decade, the change of a discharge quality failure will double every ten years, and if influent increases by 20% per decade, the chance of a discharge quality failure will double every 5 years. The model suggests that under current influent scenarios the upgrades should make a discharge quality failure 20 times less likely. Even if influent increases by 20% per decade, the upgrades are rendered ineffective around 2045, meaning that the likelihood of a discharge quality failure at 2045 will be the same as prior to the upgrades. As the design life of the upgrades is to 2047 the upgrades were undertaken at an appropriate time to be able to process increasing influent volume over the design life of the plant, which reduces the likelihood of discharge quality failures. This validates the timing of the decision by Watercare to undertake the plant upgrades in 2022.
The results of the application of RDM at Helensville were well-received by Watercare, although they had intended that the plant upgrades (implementation of adaptive action 1) would mean that the likelihood of a discharge quality failure was reduced to zero. However, alongside the plant upgrades Watercare had decided that the plant would be moved prior to the end of the 25-year design life of the upgrades being implemented. This is because the likely driver of plant failure at Helensville would be compound coastal hazards, rather than insufficient processing capacity. In order to be robust, the chosen action / pathway has to be functional under as many climate scenarios as possible. Therefore, the decision to move the plant prior to it becoming susceptible to the 1% AEP inundation event is a robust decision.
Step one of the RDM analysis showed that Seaview WWTP is susceptible to being inundated in a 1% AEP event after 56 cm of RSLR. At or above 56 cm of RSLR, water would enter buildings and potentially impact electrical systems and pumps of the WWTP during a 1% AEP event. The plant grounds are susceptible to nuisance flooding after 26 cm of RSLR, but water would not enter buildings or impact on plant operations. Under nuisance flooding conditions only, the lowest-lying parts of the plant grounds would have groundwater at or above ground level. Recent research agrees with the findings of this work, that the plant is susceptible to inundation between 50 and 60 cm of RSLR (National Institute of Water and Atmospheric Research, 2023a).
The model suggests that if the world follows a very high emissions trajectory (SSP5-8.5H+), Seaview WWTP may be rendered inoperable by inundation of plant buildings as early as 2060 (Table 2). In the case of a moderate emissions scenario (SSP2-4.5) inundation could occur from 2075, and in the case of a low emissions scenario (SSP1-1.9) inundation could occur from 2090. Nuisance flooding of plant grounds could begin sometime between 2040 and 2047, depending on emissions trajectory (Table 3). Our analysis of nuisance flooding does not take into account ponding on plant grounds under high intensity, short duration rainfall events—we define nuisance flooding as plant grounds being inundated and unable to drain due to the combined impacts of storm impacts, high tides and sea level rise.
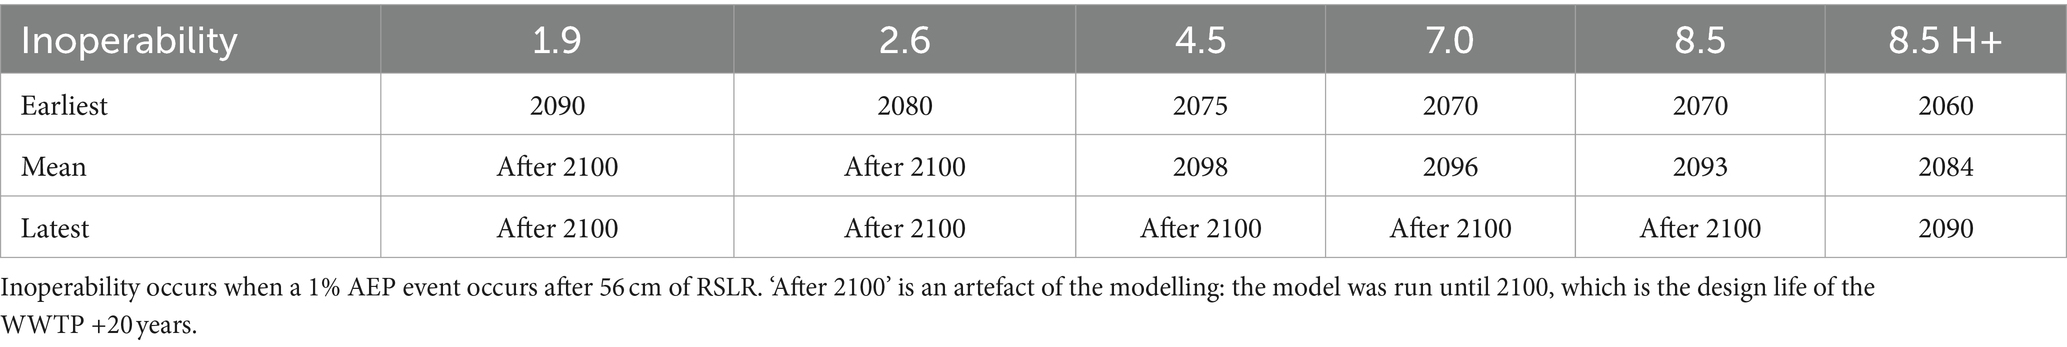
Table 2. Timing of inoperability of Seaview WWTP under six emissions scenarios.
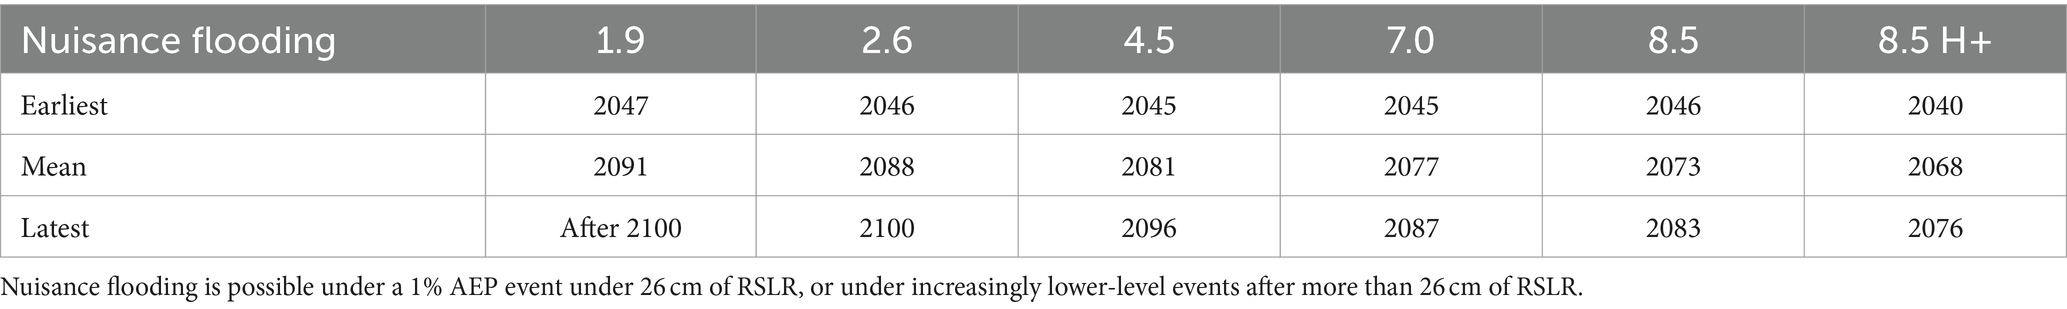
Table 3. Timing of nuisance flooding of Seaview WWTP grounds under six emissions scenarios.
At step two, when the model was run until 2,100 with the DAPP operating as developed in the workshops, the effectiveness of the DAPP plan in achieving Wellington Water’s performance and operational objectives for Seaview WWTP was shown to differ between emissions scenarios (Figure 12). Under SSP1-1.9 the wastewater system remained operable in 99% of model runs, reducing to under 20% for SSP5-8.5H+. In emissions scenarios 4.5, 7.0, 8.5 and 8.5H+, higher influent scenarios resulted in better performance of the DAPP than lower influent scenarios. This is due to the combination of high rates of RSLR and more frequent use of the Waiwhetu overflow resulting in triggers being reached earlier, leading to actions being implemented sooner and the adaptation threshold—inundation of the Seaview WWTP—being avoided.
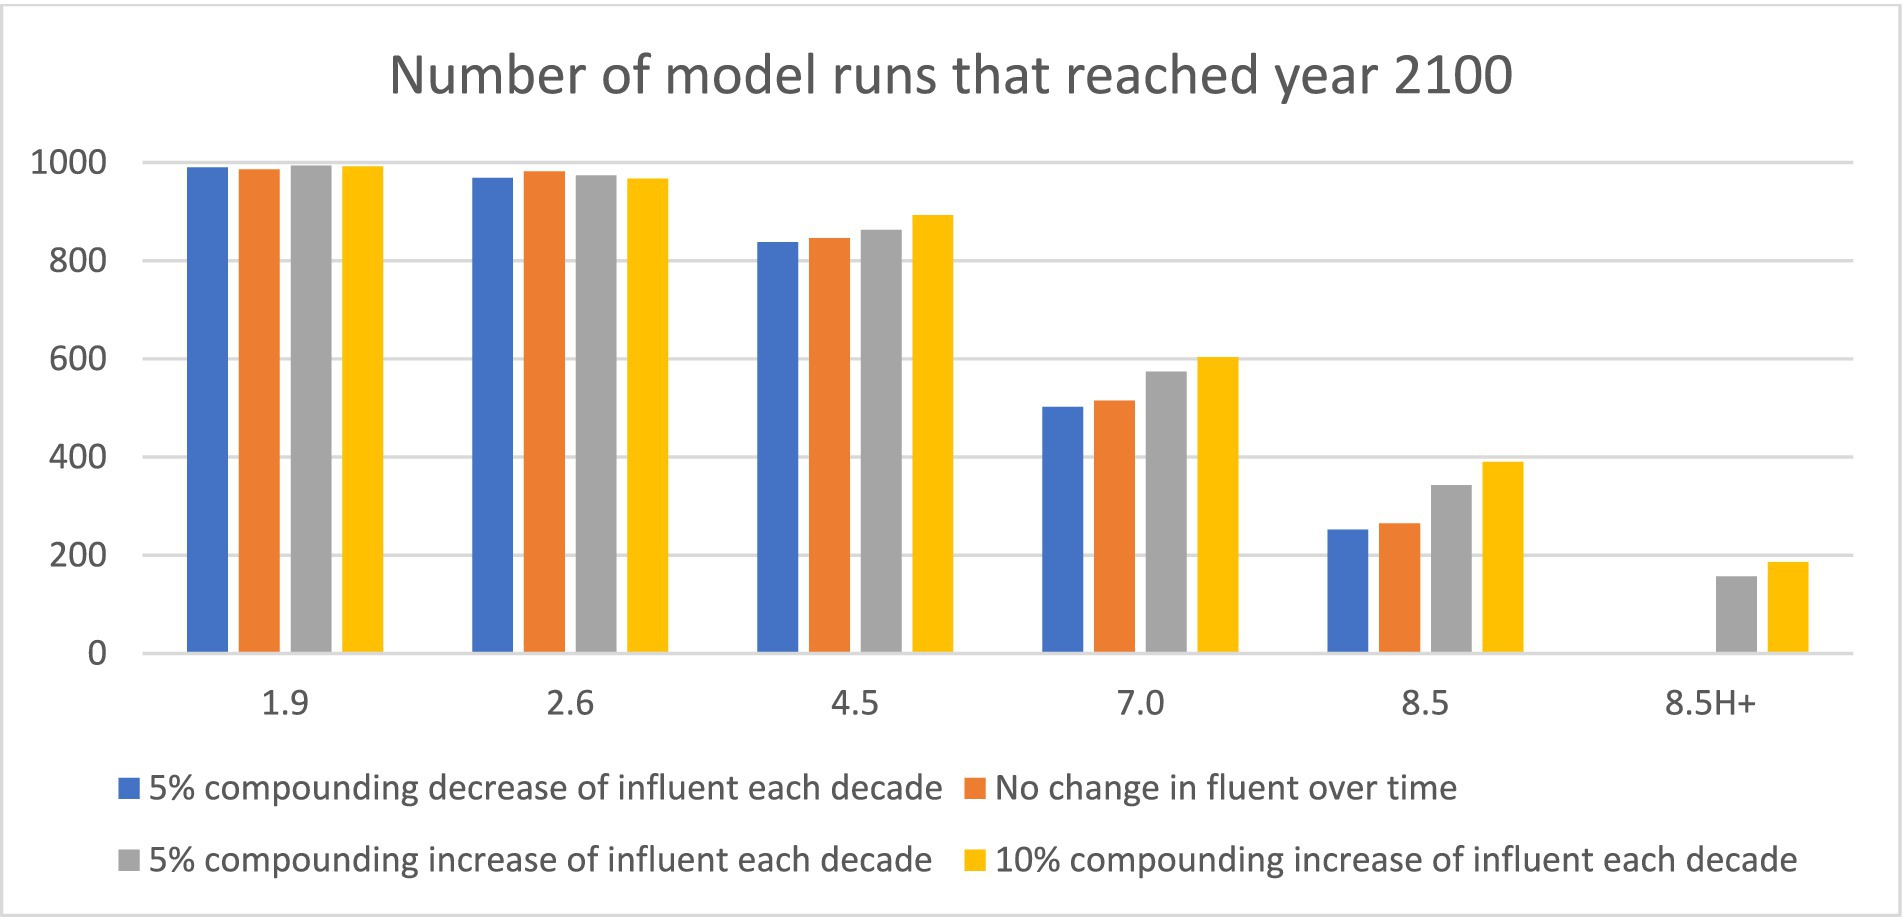
Figure 12. Outputs from the DAPP plan operating as developed in the workshops, showing the number of model runs under which the wastewater system was able to continue operating, for each combination of SSP and influent scenario (with 1,000 iterations per combination).
A seemingly counterintuitive finding is that the WWTP is more likely to meet performance objectives under higher influent scenarios. This is because higher influent scenarios result in triggers being reached earlier, meaning changes in adaptive action are implemented earlier and adaptation thresholds are avoided. This shows that the trigger values are set at a value more appropriate for high influent scenarios and would need to be lowered for lower influent scenarios to ensure that adaptation thresholds are avoided.
At step three, a robustness check was undertaken via analysis of the model runs that failed to meet the operational objective of keeping the plant onsite until 2100. This showed that shifting the Seaview WWTP to a different location was the only adaptive action guaranteed to ensure ongoing provision of wastewater services to the service area and avoid the inundation adaptation threshold in all scenarios based on the options considered in this research, i.e., for all the simulated adaptive actions and all the SLR trajectories by the year 2080, which is the design life of the plant. However, given the adaptation threshold that emerged at 2060 due to the influence of RSLR, a decision was made in conjunction with Wellington Water to include a new adaptive action in the simulated DAPP—‘changes to plant layout’. Changes to plant layout is a method for keeping the plant at the current location for the design life of the plant. In reality, this would likely consist of shifting critical parts of the plant—electrics and pumping systems—to a level where water would not reach them during 1% AEP inundation events. Modelling showed that implementing changes to plant layout would allow the plant to remain on site for its design life.
Five adaptation archetypes were identified from the quantitative modelling steps, three of which included shifting the plant and two of which included changes to plant layout (Figure 10). These adaptation archetypes were then simulated in the model to identify when the adaptive actions would need to be implemented by in order to ensure ongoing levels of service and preventing inundation of the Seaview WWTP; the timing of adaptive action implementation is dependent on RSLR and influent scenarios. To be robust against all future climate change scenarios, either changes to plant layout or a new plant offsite would need to be operational by 2060. To be robust against the range of future influent volume scenarios, either a reconfigured network or a combination of increased network capacity and onsite storage would need to be operational by 2040.
The ROA identified the discounted costs of the five adaptation archetypes (Figure 13). The ranking is unchanged with respect to discount rate (1, 3% (default) 5%) and RCP (2.6, 4.5 (default) 7.0 or 8.5), except that with a higher cost for the reconfigured trunk network Incremental Adaptation 2 is the most expensive. In all cases the least cost strategy is Transformational Adaptation 1.
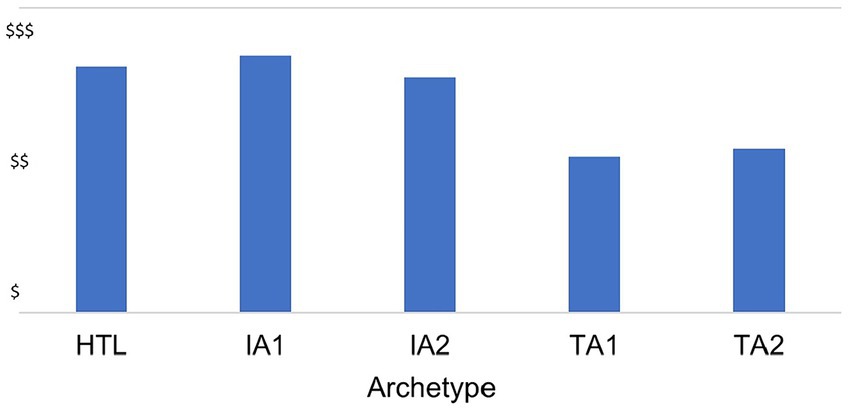
Figure 13. Discounted costs of the five adaptation archetypes at present value and with a 3% discount rate. HTL = hold the line. IA1 = incremental adaptation 1. IA2 = incremental adaptation 2. TA1 = transformational adaptation 1. TA2 = transformation adaptation 2. These rankings are unchanged with respect to discount rate (1, 3, 5%). The Y axis is intentionally without numerical values—the options used in the DAPP were developed during the workshops and had not been priced by Wellington Water or engineers: relative, ‘best estimate’ prices were used for the options.
In standard applications of ROA most investment strategies still involve some residual loss. Thus the total cost plus loss may be calculated for each strategy. Either probabilities are assigned to each strategy or one can solve for the set of probabilities at which any two strategies (including doing nothing) have the same expected present value of cost plus residual loss.
As it turned out in the case of Seaview, however, the investment archetypes were designed to generate the same residual loss and there were no options to shift between adaptation archetypes in the traditional sense of ROA. As the final action in each archetype (either a new plant offsite or changes to plant layout) would need to be implemented sometime prior to 2060 to be robust across the range of climate and influent scenarios tested, there was no ability to delay an action in each archetype after the first action had been implemented without running the risk of inundation during a 1% AEP inundation event. Hence, while the adaptation archetypes showed robust sequences of adaptive actions for the wastewater system, they reduced some of the flexibility inherent in the DAPP approach. There are no trade-offs between investment cost and residual loss across the strategies. Accordingly, the ROA essentially collapses to a standard cost minimization problem.
Therefore, we calculate the present value of each investment archetype strategy (s) with cost Cs,t in year t in 5-yearly intervals, with t ranging from 2025 to 2,100. Not all archetypes incur costs in every period, reflecting the possibility to delay, so the cost profiles (as well as cost magnitudes) differ across archetypes.
For discounting, we used a social rate social rate of time preference (SRTP) which recognises that the opportunity cost of capital is inappropriate in this situation.
The SRTP is expressed as:
r is the social rate of time preference. d is the rate at which future consumption is discounted over current consumption. g is the annual growth of consumption per capita. ε is the elasticity of the marginal utility of consumption.
The variable d is frequently further disaggregated into two components:
ρ is the pure rate of time preference. C is the risk of a catastrophe which severely disrupts life on earth.
There is much debate on the values of these variables, but the debate is beyond the ambit of this paper.
The system mapping exercises highlighted the importance of developing a shared system understanding between researchers and case study partners; identifying critical points of connection between seemingly unrelated variables allowed the group to see the previously unforeseen, helping ensure that the chances of surprises occurring was minimised.
The methodology applied was different for each site due to the individual circumstances of each plant. Helensville is a small, rural coastal WWTP with a limited range of adaptive actions other than retreat and an existing DAPP plan. Seaview is a large urban coastal WWTP with a wide range of potential adaptive actions and a design life of 2080, but no extant DAPP plan. Case study one focused on implementation of an existing DAPP by quantifying adaptation thresholds and triggers. Case study two focused on DAPP development and stress-testing a DAPP through exploratory modelling, RDM and ROA.
Watercare developed and began implementing a DAPP for Helensville WWTP. Ongoing non-compliance with their discharge consent meant they had to act before our research was completed, so implemented action 1 in the Helensville WWTP DAPP (Watercare, 2023). Our exploratory modelling and RDM analysis showed that they made the right decision; if they had acted later the benefits gained from implementing action 1 would have been lessened due to discharge quality failures remaining above consented levels in the interim. Also, as the Helensville WWTP has a limited viable lifetime at its current location (Watercare, 2023) delaying the upgrades would have necessitated the plant to be moved prior to the end of the upgrade design life. Our model suggested that the Helensville WWTP plant upgrades undertaken by Watercare would reduce the likelihood of a discharge quality failure by 95% under current influent scenarios. In the case of a 20% per decade influent increase, the plant upgrades will be rendered ineffective by 2045. This means that the plant will remain within its discharge consents for the life of the upgrade—delaying the upgrade would have had detrimental outcomes, with the number of discharge quality failures remaining higher than consents allow. Therefore, Watercare’s decision to implement plant upgrades in 2022 was robust.
Case study one began in March 2021 and the validation workshop was held with Watercare was held in September 2022. On 27 January 2023, Auckland was impacted by an extreme rainfall event with up to 265 mm falling in a 24-h period, of which 211 mm fell in under 6 hours (National Institute of Water and Atmospheric Research, 2023b). This 1-in-220-year event resulted in the Kaipara River bursting its banks and inundating farmland upstream from Helensville. Fortunately, the peak of the river flow coincided with the lower half of the tidal cycle, meaning that the Helensville WWTP was not overtopped or inundated by the high river flows peaking at the high tide. However, influent volumes were so high that the plant was unable to cope; mobile pumps were brought in to bypass the main ultrafiltration treatment unit by lowering pond levels, meaning that raw or partially treated sewage was discharged into the Kaipara River. For context, 11 wastewater pumping stations across Auckland failed and were offline for up to 10 days due to their being flooded or the electrics being damaged by the floods. While a discharge quality failure occurred at Helensville WWTP, the magnitude of the Auckland flood was well outside the design level of the plant upgrades or original plant design standards. This real-life test added to the robustness of the technical decision to plan a relocation of the wastewater treatment plant at Helensville.5
We identified five robust adaptation archetypes that would allow the Seaview WWTP to remain onsite for the duration of its design life (until 2080). To be robust against all future climate change scenarios, either changes to the plant layout or a new plant offsite would need to be operational by 2060. To be robust against all future influent volume scenarios, either a combination of increased network capacity and onsite storage or a reconfigured network would need to be operational by 2040. After initial RDM analysis suggested that a new option was needed to avoid moving the Seaview WWTP prior to the end of its design life, changes to plant layout were added. This highlights the need for flexibility in DAPP development and the value of an iterative development and stress-testing process (Immaraj et al., 2023); including a new action—changes to plant layout—into the DAPP during the model testing process showed that meeting performance objectives was possible while keeping the plant onsite for its design life, whereas if restricted to using the original options in the DAPP the plant would need to be moved before 2080. By adjusting the DAPP based on modelling outputs, a more robust DAPP was developed, which avoided path dependency where only one viable option or pathway existed. Path dependency is a significant issue for infrastructure, and DAPP is a flexible, qualitative approach; DAPPs are intended to be revisited and revised as new actions and more up-to-date information become available to decision-makers.
However, while inclusion of changes to plant layout gives Wellington Water flexibility, the two adaptation archetypes that include this option are the two most expensive, and the three options that attempt to hold the line or undertake incremental adaptation have significantly higher costs than the two transformational adaptation archetypes. While this suggests that incremental adaptation is more expensive than transformational adaptation (see Figure 13), this analysis does not consider the costs involved in moving the WWTP prior to the end of its design life. That would mean expenditure prior to 2080 when money has already been spent in building the current WWTP. On the other hand, expenditure to shift the WWTP may be required depending on the rate of RSLR in the coming decades (i.e., which SSP trajectory we track closest to).
The Seaview WWTP RDM analysis also showed that there was limited variety in pathways that could meet performance objectives. As seen in Figure 10, adaptation archetypes Hold The Line and Incremental Adaptation 1 are very similar (both requiring a network capacity increase, development of onsite storage, changes to the outfall pipeline, and changes to plant layout). Transformational Adaptation1 and Transformational Adaptation 2 were also very similar (both requiring a reconfigured network, a new plant offsite and a new outfall pipeline). Incremental Adaptation 2 is also similar to Incremental Adaptation 1, but with increased WWTP processing capacity added. This shows that while many options may be considered for adaptation of the trunk network, plant and outfall pipeline, the viable pathways are limited and there is not a lot of dynamism in the ‘dynamic’ pathways. While the archetypes provide a starting point for considering adaptation options for a large urban coastal wastewater system, they are limited in their flexibility and applicability to small rural WWTPs such as Helensville.
A seemingly counterintuitive finding is that the WWTP is more likely to meet performance objectives under higher influent scenarios. This is because higher influent scenarios result in triggers in the DAPP being reached earlier, while the adaptation threshold remains unchanged. This results in changes in adaptive action being implemented earlier allowing adaptation thresholds to be avoided. While this is an artefact of having preselected trigger values, the trigger values were set by our Wellington Water case study partners at levels they deemed appropriate. The RDM analysis showed that the trigger values were better suited for higher influent scenarios, rather than low influent scenarios. Planning for higher influent scenarios makes sense, as the higher influent scenarios are more likely to occur than lower ones. The trigger values were appropriate for all climate scenarios, although the triggers were reached earlier under higher SSPs due to the faster rate of RSLR. Similar to influent, planning for higher SSP scenarios makes sense, as that ensures that decisions made are robust against all lower SSP scenarios.
The results of our work were presented to and workshopped with the case study partner Wellington Water. In particular, the DAPP development work and ability to stress-test options and pathways in a DAPP using a multi-hazard model tested with an RDM approach were flagged as useful for future adaptation planning. Using exploratory modelling (to simulate each of the wastewater systems and explore the impacts of a range of climate change and influent scenarios) in tandem with RDM (to stress-test adaptive actions against future uncertainty under each combination of climate and influent scenarios) allows for the identification of robust pathways and adaptation archetypes.
The Seaview WWTP case study highlighted the potential of taking a ‘more-than-engineering’ approach to future wastewater infrastructure planning. Using regulatory indicators—ability to obtain a consent—as was done with the case study two, allows for social and cultural values to influence infrastructure adaptation decision-making as social and cultural considerations play a role in determining whether a consent may be granted. Wellington Water are now considering whether and how the method could be used to plan the future of the Seaview Wastewater Treatment plant and other water infrastructure under their jurisdiction, using the seven methods in a complementary approach, and have commissioned the research team to produce guidance on recommended next steps for implementing our approach for real-life adaptation planning for the Seaview WWTP.
We used two case studies to demonstrate the effectiveness of using the seven-step approach—scoping workshops, system mapping, DAPP, exploratory modelling, RDM, ROA, and validation workshops—to inform adaptation planning for wastewater systems, and to quantify indicators, signals, triggers and adaptation thresholds within DAPP plans—required to enable plan implementation.
Case study one focused on the implementation of an existing DAPP—the key challenge to overcome was quantifying the adaptation thresholds, triggers and indicators so as to know when to change action. Our modelling enabled that barrier to be overcome, and adaptation thresholds, triggers and indicators were identified—31 cm of RSLR (which could occur as soon as 2060 under SSP5-8.5), sufficient lead time to enable relocation, and rates of RSLR, respectively. Case study one demonstrated in a quantitative way how an existing DAPP can be functionally implemented by a water management agency.
In case study two, our modelling showed that 26 cm and 56 cm of RSLR are key thresholds for the Seaview WWTP. Nuisance flooding (after 26 cm or more of RSLR) could occur as early as 2040 under a high emissions scenario, while inundation of plant assets (after 56 cm or more of RSLR) could occur as early as 2060. Modelling showed that implementing changes to plant layout would allow the plant to remain on site for its design life (until 2080). SLR is unlike other hazards in that it is ongoing, will continue for centuries and is locked-in. When considering the interaction of RSLR and compound hazards, RDM has an edge over traditional optimization approaches especially used alongside a DAPP approach, because it explicitly addresses uncertainties through robustness assessment.
For most emissions scenarios tested, higher influent scenarios resulted in better performance of the DAPP because adaptive actions were triggered sooner and so the adaptation threshold (inundation of WWTP) was avoided. This shows that triggers need to be scenario-specific, and that modelling can help to identify appropriate trigger values for each indicator under each combination of RSLR and influent scenarios.
Case study two influenced Wellington Water’s course of action by demonstrating the ability of a DAPP, stress-tested using RDM, to identify the location of adaptation thresholds (in time and space), and to identify appropriate trigger values under different scenarios. The seven-step approach can complement the existing ‘engineering-first’ approach to water infrastructure adaptation, enable development and implementation of a DAPP, ensure that decisions made are more robust than under the present approach, and comply with regulatory requirements. The seven-step approach can also inform guidance for adaptation of infrastructure assets more widely in New Zealand, which is being developed as a further output from this research.
Our approach outlines a way to stress-test a DAPP, to quantify signals, triggers and adaptation thresholds, to simulate implementation of a DAPP under a range of scenarios, and thus to facilitate more robust decision-making for wastewater infrastructure assets under deeply uncertain futures.
The raw data supporting the conclusions of this article will be made available by the authors, without undue reservation.
AA: Conceptualization, Data curation, Formal analysis, Investigation, Methodology, Project administration, Software, Validation, Visualization, Writing – original draft, Writing – review & editing. JL: Conceptualization, Formal analysis, Funding acquisition, Investigation, Methodology, Validation, Writing – original draft, Writing – review & editing. SAS: Conceptualization, Funding acquisition, Investigation, Methodology, Project administration, Resources, Writing – original draft, Writing – review & editing. JK: Methodology, Validation, Writing – review & editing, Conceptualization, Software. SKS: Methodology, Writing – review & editing, Data curation, Investigation, Validation. PB: Conceptualization, Methodology, Writing – review & editing, Funding acquisition. AS: Conceptualization, Formal analysis, Methodology, Validation, Writing – review & editing.
The author(s) declare financial support was received for the research, authorship, and/or publication of this article. This research was funded by the Deep South National Science Challenge Project ‘Adaptive tools for decisions on compounding climate change impacts on water infrastructure’: grant number C01X1412, and by the Strategic Science Investment Fund project CAVA2402: Enabling Climate Change Adaptation.
JL was employed by PSConsulting.
The remaining authors declare that the research was conducted in the absence of any commercial or financial relationships that could be construed as a potential conflict of interest.
The author(s) declared that they were an editorial board member of Frontiers, at the time of submission. This had no impact on the peer review process and the final decision.
All claims expressed in this article are solely those of the authors and do not necessarily represent those of their affiliated organizations, or those of the publisher, the editors and the reviewers. Any product that may be evaluated in this article, or claim that may be made by its manufacturer, is not guaranteed or endorsed by the publisher.
The Supplementary material for this article can be found online at: https://www.frontiersin.org/articles/10.3389/fclim.2024.1355446/full#supplementary-material
1. ^Cellular automata models are spatially explicit, temporally dynamic, and simulate interactions between processes occurring in neighbouring cells (spatial area units).
2. ^The runtime for the Seaview model was around 10 times that of the Helensville model due to the greater complexity of the DAPP (11 options as opposed to 1), the increased area simulated (8 spatial areas as opposed to 6) and the increased length of simulation (80 years as opposed to 58).
3. ^SSP scenarios came from IPCC AR6, as recommended by Ministry for the Environment (2022).
4. ^Hard protection measures are not shown in the adaptation archetype pathway figures due to uncertainty in the timing, magnitude and frequency of erosion and landslip events that may necessitate repairs to the outfall pipeline or trunk network, respectively. These adaptive actions were not built into the model but ongoing monitoring and maintenance of the road means that any erosion can be promptly repaired when it occurs, while alterations to the trunk network due to landslips would occur on an as-needed basis necessitated by a significant landslip event. Subsequently, roadside reinforcement and trunk hardening were not considered in the ROA.
5. ^While the 1-in-220-years magnitude of the Auckland flood was outside the %AEP level simulated in the modelling, a re-run of the model to include events of that magnitude suggested that had the peak river flows occurred at high tide the plant would have been overtopped.
Allison, A. E. F., Dickson, M. E., Fisher, K. T., and Thrush, S. F. (2021). Communicating drivers of environmental change through transdisciplinary human-environment modelling. Earth’s Future 9:e2020EF001918. doi: 10.1029/2020EF001918
Allison, A. E. F., Stephens, S., Blackett, P., Lawrence, J., Dickson, M., and Matthews, Y. (2023). Simulating the impacts of a dynamic adaptive pathways plan using an agent-based model: a Tauranga City case study. J. Mar. Sci. Eng. 11:343. doi: 10.3390/jmse11020343
Allison, A., Stephens, S., Lawrence, J., Singh, S., Blackett, P., Matthews, Y., et al. (2022) Adaptive tools for decisions on water infrastructure affected by compounding climate change impacts, In: C. Hendtlass, T. FitzGerald, A. Serrano, and D. Neale, eds., Coastal adaptation–adapting to coastal change and hazard risk in Aotearoa New Zealand, NZ Coastal Society, Special Publication 5, November 2022, pp. 73–78. Available at: https://www.coastalsociety.org.nz/media/view/publications/special-publication-5-coastal-adaptation/
Auping, W. L., Pruyt, E., and Kwakkel, J. H. (2016). Simulating endogenous dynamics of intervention-capacity deployment: the Ebola outbreak in Liberia. Health Policy Plan. 4, 53–67. doi: 10.1080/23302674.2015.1128576
Ben-Haim, Y. (2019). “Info-gap decision theory (IG)” in Decision making under deep uncertainty. From theory to practice. eds. V. A. W. J. Marchau, W. E. Walker, P. J. T. M. Bloemen, and S. W. Popper (London: Springer Open), 93–115.
Connolly, J. (2022) Exploring the use of a system diagram and multi-variate analysis to understand multi-species complexes in fisheries, a report for the sustainable seas National Science Challenge, Hamilton, New Zealand, 142 pp.
Cooley, S., Schoeman, D. S., Bopp, L., Boyd, P., Donner, S., Ito, S. I., et al. (2021) Chapter 3: Oceans and coastal ecosystems and their services, IPCC WGII Sixth Assessment Report
Craddock-Henry, N. A., Connolly, J., Blackett, P., and Lawrence, J. (2020). Elaborating a systems methodology for cascading climate change impacts and implications. MethodsX 7:100893.
Department of Internal Affairs, Local Government Act (2002). Available at: https://www.legislation.govt.nz/act/public/2002/0084/latest/whole.html#DLM6236897 (Accessed February 5, 2024).
Dewar, J. A. (2006) New practices in long-term planning: building plans for deep uncertainty. Presentation given at the next generations of infrastructure (NGI) workshop (Delft University of Technology, November 16, 2006)
Haasnoot, M., Kwakkel, J. H., Walker, W. E., and ter Maat, J. (2013). Dynamic adaptive policy pathways: a method for crafting robust decisions for a deeply uncertain world. Glob. Environ. Chang. 23, 485–498. doi: 10.1016/j.gloenvcha.2012.12.006
Hamarat, C., Kwakkel, J. H., and Pruyt, E. (2013). Adaptive robust design under deep uncertainty. Technol. Forecast. Soc. Chang. 80, 408–418. doi: 10.1016/j.techfore.2012.10.004
Hamarat, C., Kwakkel, J. H., Pruyt, E., and Loonen, E. T. (2014). An exploratory approach for adaptive policymaking by using multi-objective robust optimization. Simul. Model. Pract. Theory 46, 25–39. doi: 10.1016/j.simpat.2014.02.008
Hughes, J., Cowper-Heays, K., Olesson, E., Bell, R., and Stroombergen, A. (2020). Impacts and implications of climate change on wastewater systems: a New Zealand perspective. Clim. Risk Manag. 31:100262
Hummel, M. A., Berry, M. S., and Stacey, M. T. (2018). Sea level rise impacts on wastewater treatment systems along the U.S. coasts. Earth’s Future 6, 622–633.
Immaraj, A., Skinner, S., Allison, A., Tyrell, S., and Warren, A. (2023) Moving adaptively from models to decision tables for a water resilient future, presentation at decision making under deep uncertainty annual meeting 2023, October 2023, Delft, The Netherlands.
Kool, R., Lawrence, J., Bell, R., and Drews, M. (2020). Preparing for sea-level rise through adaptive managed retreat of a New Zealand stormwater and wastewater network. Inf. Dent. 5:92. doi: 10.3390/infrastructures5110092
Kwakkel, J. H. (2017). The exploratory modelling workbench: an open source toolkit for exploratory modelling, scenario discovery, and (multi-objective) robust decision making. Environ. Model. Softw. 96, 239–250. doi: 10.1016/j.envsoft.2017.06.054
Kwakkel, J. H., Haasnoot, M., and Walker, W. E. (2016). Comparing robust decision-making and dynamic adaptive policy pathways for model-based support under deep uncertainty. Environ. Model. Softw. 86, 168–183. doi: 10.1016/j.envsoft.2016.09.017
Lawrence, J. (2023) A decade of dynamic adaptive decision-making tools in New Zealand–practice applications, lessons learned and next steps. Resilience to Nature’s Challenges National Science Challenge. Available at: resiliencechallenge.nz/wp-content/uploads/00-A-Decade-of-Dynamic-Adaptive-Decision-making-tools-in-New-Zealand-Practice-applications-lessons-learned-and-next-steps_Minisyposium-summary-of-findings-with-slides.pdf (Accessed December 1, 2023).
Lawrence, J., and Bell, R.G. (2022). The foundations of the sea-level rise challenge: coasts are a special case for adaptation. In: C. Hendtlass, T. FitzGerald, A. Serrano, and D. Neale, Coastal adaptation–adapting to coastal change and hazard risk in Aotearoa New Zealand, p. 3–7, NZ Coastal Society, Special Publication 5, November 2022. Available at: https://www.coastalsociety.org.nz/media/view/publications/special-publication-5-coastal-adaptation/
Lawrence, J., Boston, J., Bell, R., Olufson, S., Kool, R., Hardcastle, M., et al. (2020). Implementing pre-emptive managed retreat: constraints and novel insights. Curr. Clim. Chang. Rep. 6, 66–80. doi: 10.1007/s40641-020-00161-z
Marchau, V. A. W. J., Walker, W. E., Bloemen, P. J. T. M., and Popper, S. W. (2019). “Introduction” in Decision making under deep uncertainty. From theory to practice. eds. V. A. W. J. Marchau, W. E. Walker, P. J. T. M. Bloemen, and S. W. Popper (London: Springer Open), 1–22.
Maynard, D., Boyle-Gotla, A., and Ho, I. (2021) Dynamic Adaptive Pathway Planning – adding flexibility in an uncertain future, Water NZ Conference 2021 proceedings. Available at: https://www.waternz.org.nz/Attachment?Action=Download&Attachment_id=5197 (Accessed November 3, 2023).
Ministry for the Environment (2017) in Coastal hazards and climate change guidance for local government. eds. R. G. Bell, et al. (Wellington: Ministry for the Environment, Publication ME 1292) 284 pages + appendices
Ministry for the Environment (2022) Interim guidance on the use of new sea-level rise projections, Wellington: Ministry for the Environment.
Ministry for the Environment and Statistics New Zealand. (2019). New Zealand’s Environmental Reporting Series: Our marine environment 2019. Available at: www.mfe.govt.nz and www.stats.govt.nz.
National Institute of Water and Atmospheric Research (2023a) Extreme coastal flood maps for Aotearoa New Zealand. Available at: https://niwa.co.nz/natural-hazards/our-services/extreme-coastal-flood-maps-for-aotearoa-new-zealand (Accessed December 6, 2023).
National Institute of Water and Atmospheric Research (2023b) Auckland suffers wettest month in history. Available at: https://niwa.co.nz/news/auckland-suffers-wettest-month-in-history (Accessed February 7, 2024).
Railsback, S., Ayllón, D., Berger, U., Grimm, V., Lytinen, S., Sheppard, C., et al. (2017). Improving execution speed of models implemented in NetLogo. J. Artif. Soc. Soc. Simul. 20:3. doi: 10.18564/jasss.3282
Railsback, S. F., and Grimm, V. (2019). Agent-based and individual-based modeling: A practical introduction. Second Edn Princeton, New Jersey: Princeton University Press, 340.
Stephens, S., Lawrence, J., Allison, A., and Boyle-Gotla, A. (2021) Adaptive tools for decisions on compounding climate change impacts on water infrastructure, Australasian Coasts and Ports Conference Proceedings 2021. Available at: https://www.coastsandports.org/all-conference-papers (Accessed November 3, 2023).
Strombach, M. W., Döring, A. O., Möck, M., Sedrez, M., Mumm, O., Schneider, A.-K., et al. (2019). The “hidden urbanization”: trends of impervious surface in low-density housing developments and resulting impacts on the water balance. Front. Environ. Sci. 7:29. doi: 10.3389/fenvs.2019.00029
Stroombergen, A., and Lawrence, J. (2022). A novel illustration of real options analysis to address the problem of probabilities under deep uncertainty and changing climate risk. Clim. Risk Manag. 38:100458. doi: 10.1016/j.crm.2022.100458
Wahl, T., Jain, S., Bender, J., Meyers, S. D., and Luther, M. E. (2015). Increasing risk of compound flooding from storm surge and rainfall for major US cities. Nat. Clim. Chang. 5, 1093–1097. doi: 10.1038/nclimate2736
Walker, W. E., Harremoës, P., Rotmans, J., van der Sluijs, J. P., van Asselt, M. B. A., Janssen, P., et al. (2003). Defining uncertainty: a conceptual basis for uncertainty management in model-based decision support. Integr. Assess. 4, 5–17. doi: 10.1076/iaij.4.1.5.16466
Walker, W. E., Rahman, S. A., and Cave, J. (2001). Adaptive policies, policy analysis, and policy-making. Eur. J. Oper. Res. 128, 282–289. doi: 10.1016/S0377-2217(00)00071-0
Watercare (2023) Helensville and Parakai communities. Available at: https://www.watercare.co.nz/Water-and-wastewater/Water-and-wastewater-servicing-strategies/Helensville-and-Parakai-communities (Accessed November 3, 2023).
Wellington Water (2020) Seaview wastewater treatment plant and main outfall pipeline model build, produced by hydraulic analysis limited, Wellington, NZ.
Wilensky, U. (1999) NetLogo. Available at: http://ccl.northwestern.edu/netlogo/. Center for Connected Learning and Computer-Based Modelling, Northwestern University, Evanston, IL.
Keywords: robust decision-making, dynamic adaptive pathways planning (DAPP), coastal adaptation, infrastructure adaptation, wastewater, sea-level rise, coastal hazards
Citation: Allison AEF, Lawrence JH, Stephens SA, Kwakkel JH, Singh SK, Blackett P and Stroombergen A (2024) Planning for wastewater infrastructure adaptation under deep uncertainty. Front. Clim. 6:1355446. doi: 10.3389/fclim.2024.1355446
Edited by:
Edmundo Molina-Perez, Monterrey Institute of Technology and Higher Education (ITESM), MexicoReviewed by:
Laura Robichaux, Beca Limited, New ZealandCopyright © 2024 Allison, Lawrence, Stephens, Kwakkel, Singh, Blackett and Stroombergen. This is an open-access article distributed under the terms of the Creative Commons Attribution License (CC BY). The use, distribution or reproduction in other forums is permitted, provided the original author(s) and the copyright owner(s) are credited and that the original publication in this journal is cited, in accordance with accepted academic practice. No use, distribution or reproduction is permitted which does not comply with these terms.
*Correspondence: A. E. F. Allison, YW5kcmV3LmFsbGlzb25Abml3YS5jby5ueg==
Disclaimer: All claims expressed in this article are solely those of the authors and do not necessarily represent those of their affiliated organizations, or those of the publisher, the editors and the reviewers. Any product that may be evaluated in this article or claim that may be made by its manufacturer is not guaranteed or endorsed by the publisher.
Research integrity at Frontiers
Learn more about the work of our research integrity team to safeguard the quality of each article we publish.