 Pankaj Kumar1
 Dhanjit Deka2
 Md. Arif Husain3*
 Manish Kumar4
 Pandurang Choudhari5
 Shipra Singh6
 Azka Kamil7
 Abhishek Banerjee8
- 1Department of Geography, Delhi School of Economics, University of Delhi, New Delhi, India
- 2Department of Geography, Gauhati University, Guwahati, Assam, India
- 3Department of Geography, Shyama Prasad Mukherji College for Women, University of Delhi, New Delhi, India
- 4Department of Geography, School of Basic Sciences, Central University of Haryana, Mahendergarh, India
- 5Department of Geography, University of Mumbai, Mumbai, Maharashtra, India
- 6Department of Geography, Miranda House, University of Delhi, New Delhi, India
- 7Department of Geography, Kamala Nehru College, University of Delhi, New Delhi, India
- 8State Key Laboratory of Cryospheric Sciences, Northwest Institute of Eco Environment and Resources, Chinese Academy of Sciences, Lanzhou, China
Lahaul-Spiti district is a cold desert mountain, situated in the Trans-Himalayan region. The district has the lowest population density of 2 persons/km2 because of the harsh climate and rough topography that act as barriers to population growth. Specific knowledge of climate variability in the region is limited. Hence, it is essential to study the trends of temperature and precipitation for the region and also its effects on sustainable development. The objective of this study is to investigate the variability of rainfall and temperature on a monthly, seasonal, and annual basis from 1981 to 2021. Precipitation and temperature data on a monthly, seasonal, and annual basis were acquired from the National Aeronautics and Space Administration (NASA) Langley Research Center’s POWER Project. The trends of precipitation and temperature were derived using the Mann–Kendall trend test and the slope of the regression line using Sen’s slope test. Subsequently, the maximum, minimum, mean, standard deviation (SD), and coefficient of variation (CV) of precipitation and temperature were computed to analyze the range of variation in them. The results showed a significant increasing trend in the monthly temperature of October (p-value 0.011) and December (p-value 0.05), which is below the alpha value 0.05. Similarly, an increasing trend in annual (p-value 0.000), seasonal (winter p-value 0.008 and summer p-value 0.003), and monthly (January p-value 0.030, April p-value 0.032, June p-value 0.004, July p-value 0.027, and August p-value 0.002) precipitation was observed as computed p-values are less than the significance level of alpha = 0.05. This glaciated region is most vulnerable to climate change because it is already a scarce region in the context of natural resources. Changes in the pattern of precipitation and temperature affect the socioeconomic structure of the region, affecting sectors such as agriculture, livestock, forestry, tourism, and human health. According to the perceptions of people, the temperature rise has accelerated the melting of glaciers and reduced the snow cover area. The increase in rainfall can lead to a higher incidence of mudflows, landslides, floods, and other related events, as the region is made up of sedimentary rocks. Thus, it is crucial to continuously monitor the trends in temperature and precipitation.
1 Introduction
Climate change refers to major changes in global temperature, precipitation, wind patterns, and other indicators of climate that occur over several decades (Trajkovic and Kolakovic, 2009; Duhan and Pandey, 2013; Duan et al., 2017). At a global scale, climate change refers to the average long-term changes in temperature and precipitation over the entire earth. Since the eighteenth century, anthropogenic activities have been the main reason for climate change due to excessive use of fossil fuels (Yunling and Yiping, 2005; IPCC, 2018; Soeder, 2021). Greenhouse gas emissions continue to rise, and the earth is currently 1.1°C warmer than it was in the late eighteenth century (IPCC, 2013). The earth’s temperature has increased by 0.8°C from 1948 to 2016. The last decade (2011 to 2020) has been the warmest on record (WMO, 2021). The evidence of global climate change is visible at a large scale. In Canada, the mean temperature has increased by 1.7°C from 1948 to 2016, which is almost double the global average (Hugo et al., 1992). The warming of the atmosphere induces changes in extreme climate events, increasing both their frequency and magnitude on a global scale (Morak et al., 2013). As per the Indian Meteorological Department, the country’s annual mean temperature has increased by approximately 0.7°C between 1901 and 2018, largely due to global climate change. In recent years, this warming has accelerated, with 2021 and 2022 ranking among the warmest years on record. On the other hand, annual precipitation in India has been decreasing over the past 120 years. Precipitation in India has decreased on a winter, monsoon, and annual basis, while it has increased in the remaining seasons. In the winter season, rainfall has shown greater variation, with the coefficient of variation (CV) being 33.7919% (Kumaraswamy, 2022). Climate change has widespread impacts on ecosystems, people, settlements, and infrastructure. It happens due to an increase in the frequency of climate and weather extremes, such as hot extremes on land and in the ocean, droughts, heavy precipitation, and floods (Dullinger et al., 2012). The loss due to climate change is irreversible in freshwater, terrestrial, coastal, and marine ecosystems (IPCC, 2021). However, the dynamics of climate change and changes in extreme events provide comprehensive detail about climate variability (Easterling et al., 2000; IPCC, 2007). The impetus for a better understanding of climate extremes stems from their profound impacts on ecosystems, economies, and societies worldwide. As the frequency and intensity of events like hurricanes, droughts, heatwaves, and floods increase due to climate change, the need for precise knowledge about their drivers, patterns, and consequences becomes urgent (Mistry, 2019).
Mountains are the most suitable site for the study of climate change because of the presence of strong climatic gradients and varied topography (Beniston, 2003, 2005). Mountain ecosystems, such as those in the Himalayan region, are highly susceptible to climate change due to their limited adaptive capacity, scarce resources, and the adverse effects of climate change in these highland ecosystems on downstream environments (Joshi and Negi, 1995; Beniston and Stoffel, 2014). The concerns related to climate change in the Himalayan region are multifaceted, including droughts, floods, landslides, biodiversity loss, and threats to agriculture and food security (Barnett et al., 2005; Xu et al., 2009). High Mountain Asia has been significantly affected due to adverse changes in climate parameters, with these changes being much larger than the global average (Immerzeel et al., 2020; Banerjee et al., 2021). Over recent decades, these areas have experienced erratic rainfall patterns, with some regions witnessing increased precipitation leading to flooding, while others suffer from prolonged droughts and water scarcity (Khan et al., 2020; Abbas et al., 2023; Hussain et al., 2023; Rebi et al., 2023). Additionally, rising temperatures have been observed across the region, resulting in accelerated glacial melt in the Himalayas, affecting water availability for millions of people dependent on the rivers originating from these mountains. These climate trends pose severe challenges to agriculture, water resources, and overall socioeconomic stability in the region, demanding urgent adaptation and mitigation measures to address the impacts of climatic change.
The present study investigated the variability of temperature and precipitation in the Lahaul-Spiti district of Himachal Pradesh, India. The variability of rainfall and temperature on a monthly, seasonal, and annual basis was computed from 1981 to 2022. Studies conducted by Pratibha et al. (2017) and Goyal et al. (2018) emphasize the irregularity in precipitation distribution and its impact on water availability and agriculture. Variability poses challenges for the local communities’ sustenance as they rely on agriculture and pastoral activities. Climate change exacerbates this issue, potentially leading to more unpredictable precipitation patterns. The region experiences extreme temperature variability due to its high-altitude desert climate. Summers (May to September) see relatively mild daytime temperatures, ranging from 15°C to 25°C. However, nights can be chilly, dropping to approximately 0°C. Winters (October to April) are harsh, with temperatures plummeting to −15°C or even lower. This temperature range is attributed to the region’s altitude, arid conditions, and proximity to the Himalayas (IMD, 2022). The variability challenges residents and ecosystems, shaping the unique adaptations of flora, fauna, and human communities in this remote and captivating area. Hence, it is essential for Lahaul-Spiti to analyze the trend and pattern of climate change and also their effects on the lives of mountain dwellers.
2 Study area
Lahaul-Spiti is a cold desert mountain in the Trans-Himalayan region. The harsh climatic condition of the district acts as a barrier for population growth and the development of human settlement. Snow/glacier is a dominant land cover type in the region. The district is sparsely populated and situated in the Indian state of Himachal Pradesh. The district has a rugged terrain and consists of two major valleys: Lahaul and Spiti. The headquarter of the district is at Keylong, which lies between 31°44′57″ and 32° 59′57” N latitudes and 76°46′29″ and 78°41′34″ E longitudes. It is covered by the Survey of India sheets 52C, 52D, and 52 L. It is surrounded by Jammu and Kashmir in the north, Tibet in the east, Kulu in the south, Kinnaur in the southeast, and Kangra in the northeast (Figure 1). The district has 521 villages, but only 287 villages are inhabited and 234 are un-inhabited. It has been divided into two divisions: Keylong and Kaza. The district has two tahsils (Kaza and Keylong) and one sub-tahsil (Udaipur). It has a population of 31,564, with a density of 2 persons per km2 as per the 2011 census. It has been ranked 12th in the state on the basis of population. The sex ratio of the district is 903, with 16,588 male inhabitants and 14,976 female inhabitants.
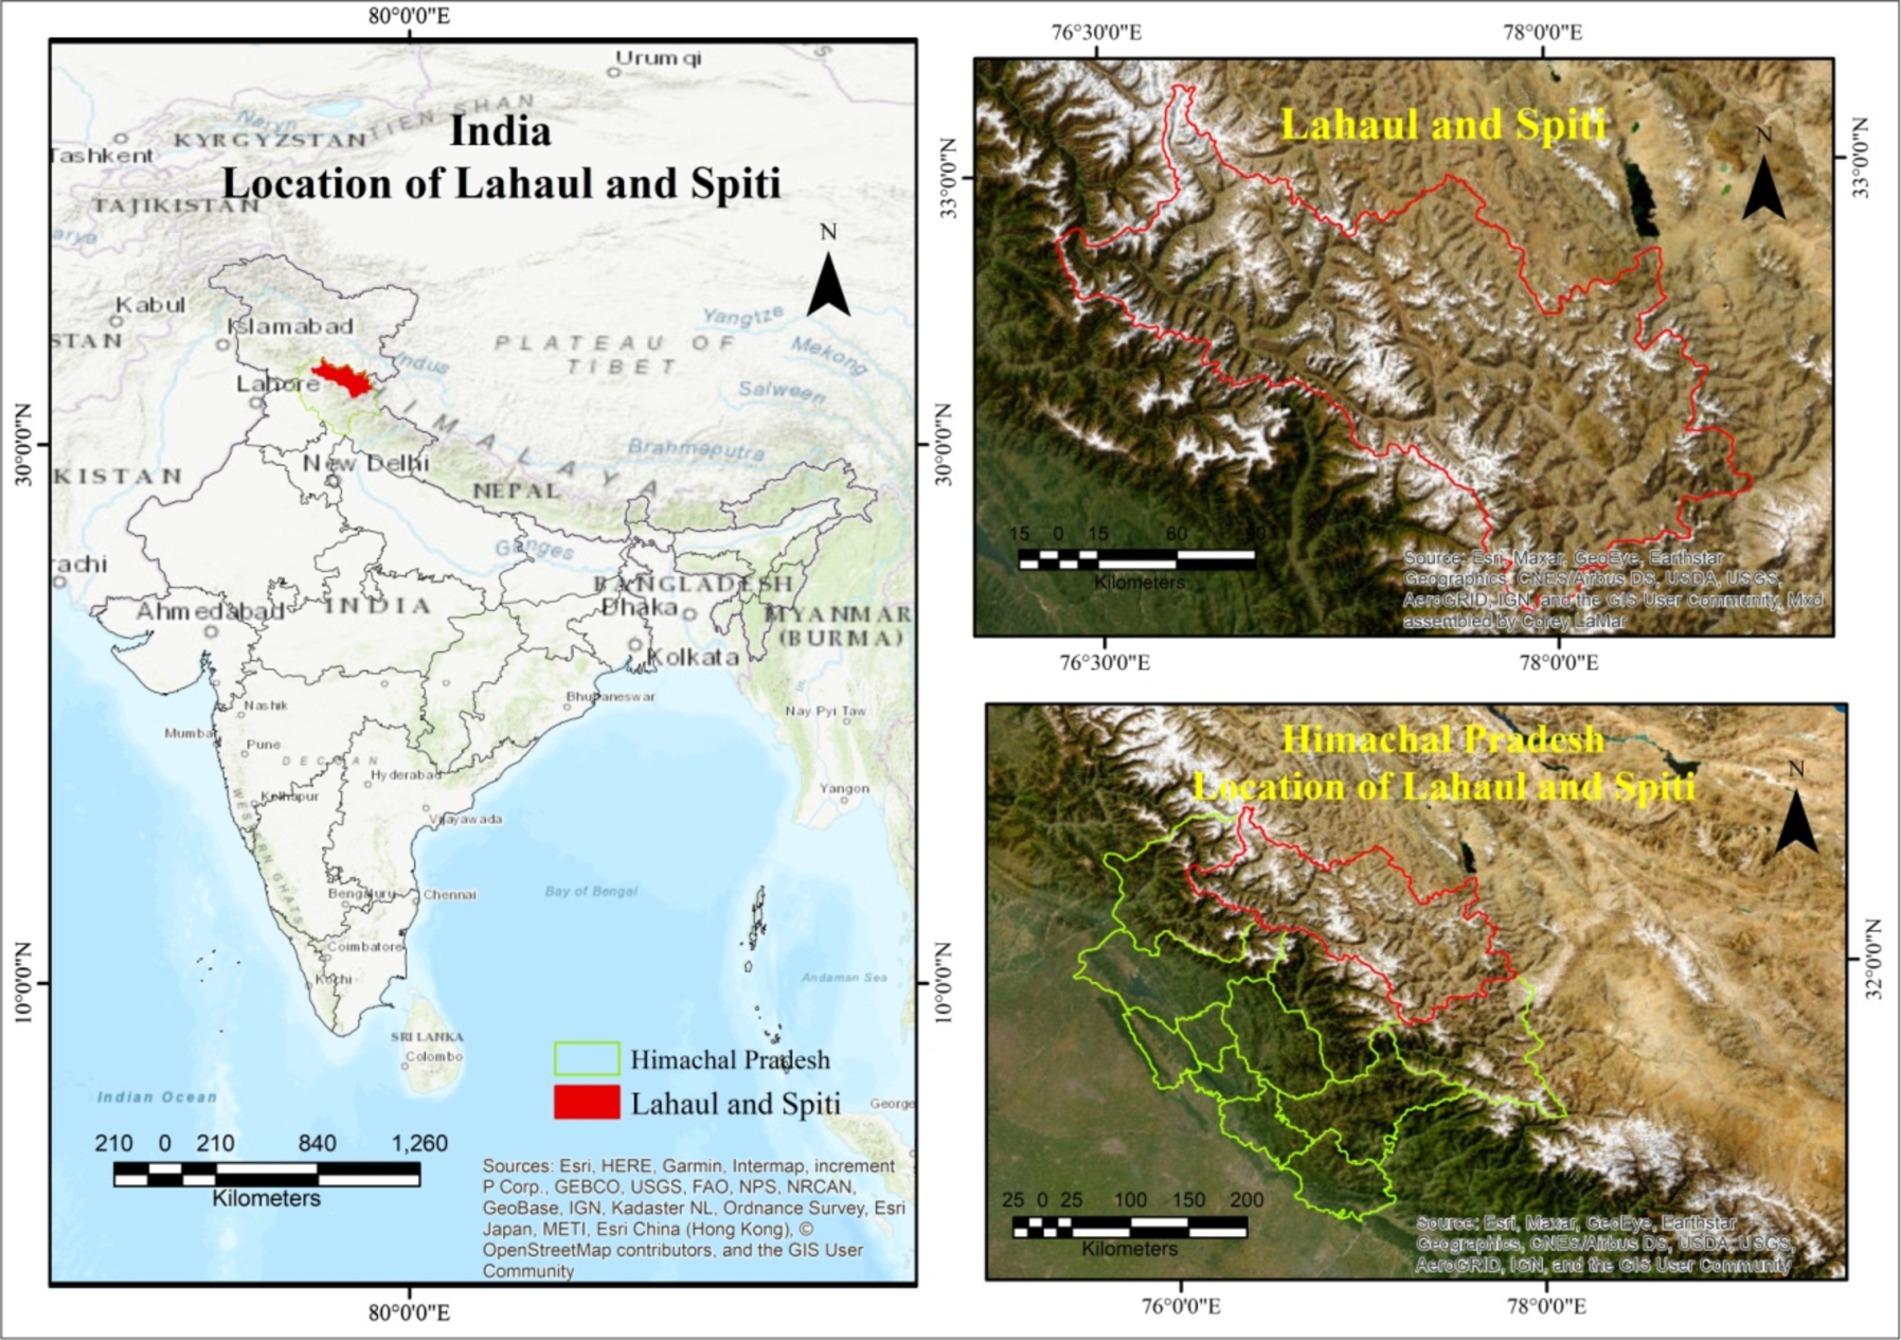
Figure 1. Study area.
3 Research methodology and materials
3.1 Datasets
Precipitation and temperature data on a monthly, annual, and seasonal basis were acquired from the NASA Langley Research Center’s POWER Project funded through the NASA Earth Science Directorate Applied Science Program. The eight specific sites within the district boundary of Lahaul-Spiti were entered in the POWER interface with the decimal degree coordinates of Tabo (latitude 32.1026 and longitude 78.4867), Dhankar (latitude 32.1328 and longitude 78.4416), Kungri (latitude 31.9428 and longitude 77.9948), Kaza (latitude 32.5733 and longitude 77.0322), Chhota Dara (latitude 32.2772 and longitude 77.4269), Keylong (latitude 32.228 and longitude 78.0517), Udaipur (latitude 32.7283 and longitude 76.6709), and Triloknath (latitude 32.7372 and longitude 76.4488). The data-acquired sites are shown in Figure 2. The air temperature is recorded at a height of 2 m from the ground. The temperature and precipitation data were acquired in the form of numerical values starting from January 1981 to December 2021 (Stackhouse et al., 2018). Thus, the data span 40 years, excluding 2 days, with a total of 14,607 days.
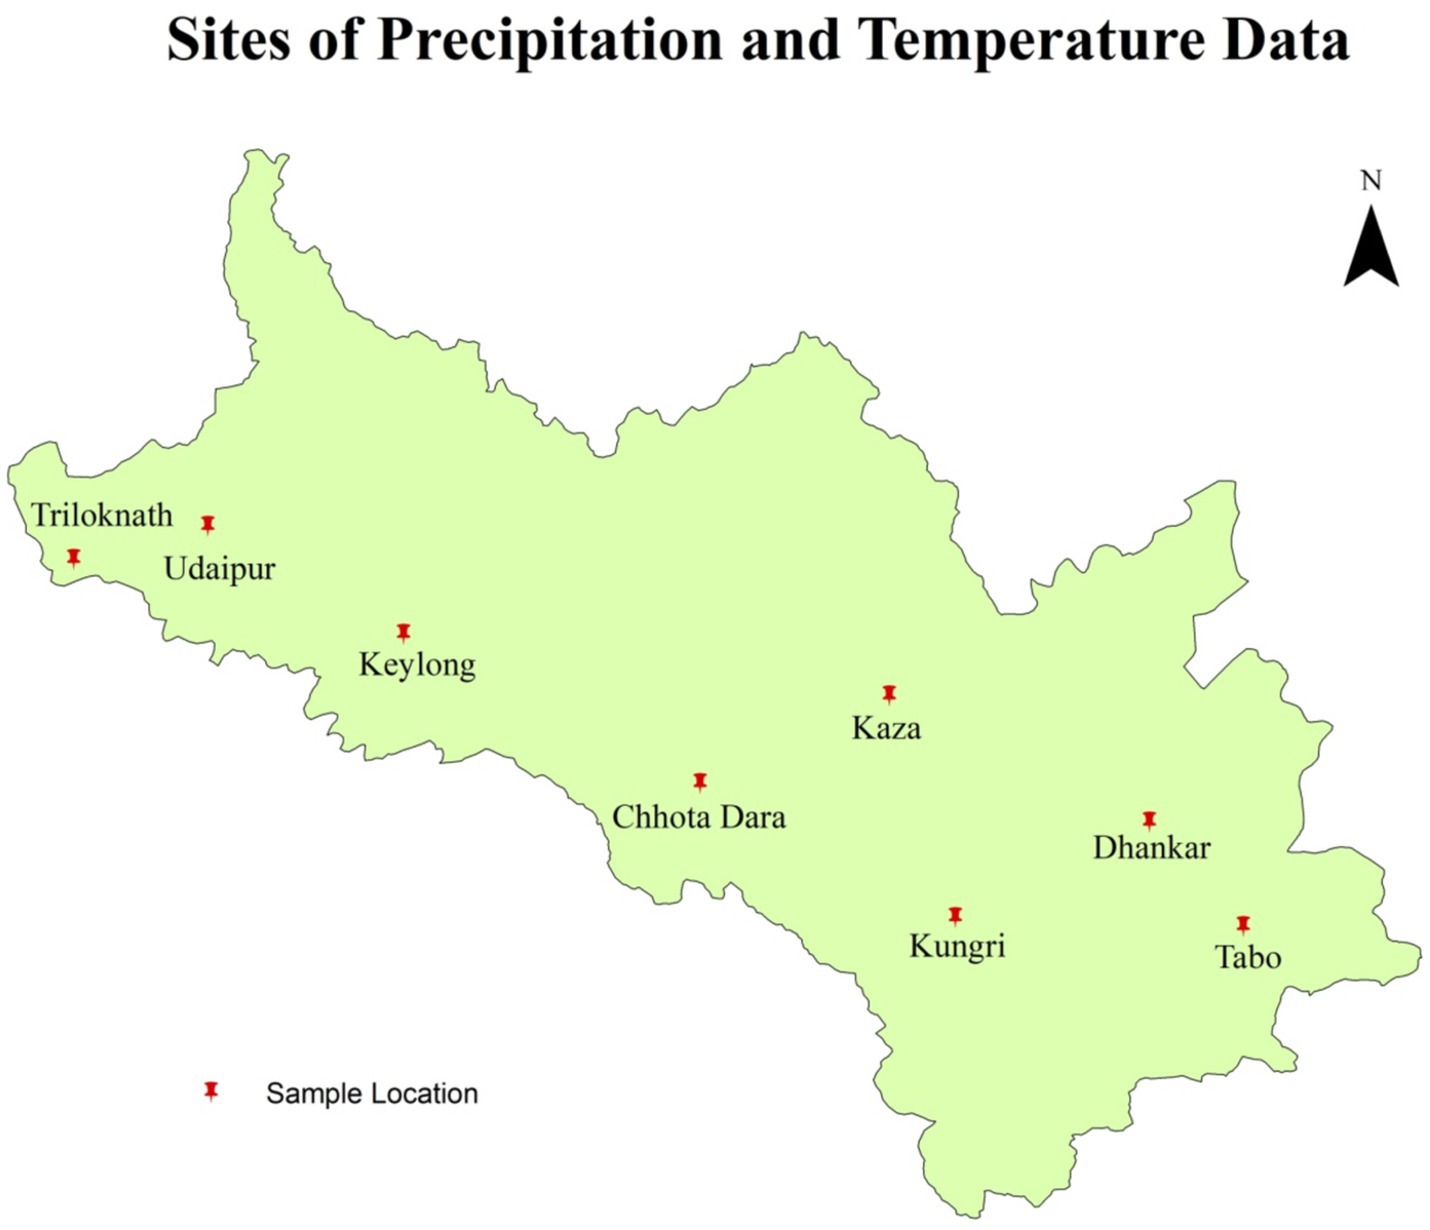
Figure 2. Data-acquired sites in Lahaul-Spiti.
3.2 Methodology
Before analyzing the trends of precipitation and temperature, the data acquired from the eight specific sites of Lahaul-Spiti were averaged based on month, year, and season to achieve the results with high accuracy. Tests for the calculation of significant trends in climate data series are categorized into two parts: parametric and non-parametric methods. The parametric trend test requires data to be independent and normally distributed, while the non-parametric trend test requires the data to be independent only. In the present study, two non-parametric methods were used to calculate the climate variables’ trends. The trends of precipitation and temperature were derived with the help of the Mann–Kendall trend test and the slope of the regression line using Sen’s slope test. Subsequently, the maximum, minimum, mean, standard deviation (SD), and coefficient of variation (CV) of rainfall and temperature were computed to analyze the relationship among them.
3.3 The Mann–Kendall test
The Mann–Kendall test is a non-parametric test for identifying trends in time series data. The test compares the relative magnitudes of sample data rather than the data values themselves (Kendall, 1975; Gilbert, 1987). The Mann–Kendall test uses two terminologies H0 and HI, where H0 assumes that there is no trend and the hypothesis is null (independent and randomly distributed data). The alternate hypothesis H1 assumes that there is a trend. Hence, H0 is tested against H1. The data values are evaluated as an ordered time series. Each data value is compared to all subsequent data values. The initial value of the Mann–Kendall statistic, S, is assumed to be 0 (e.g., no trend). If a data value from a later time period is higher than that from an earlier period, S is incremented by 1. On the other hand, if the data value from a later period is lower than the data value sampled earlier, S is decremented by 1. The net result of all such increments and decrements yields the final value of S. The Mann–Kendall test statistic S (Mann, 1945; Kendall, 1975) is calculated as:
A very high positive value of S is an indicator of an increasing trend, and a very low negative value indicates a decreasing trend. The Mann–Kendall test was computed with the help of XLSTAT 2021 software. The statistical significance of the trend is evaluated using the Z value.
The variance is computed using the following equation:
where n is the number of data points, m is the number of tied groups, and ti denotes the number of ties of extent i. A tied group is a set of sample data having the same value.
3.4 Estimation of Sen’s slope
Sen (1968) developed a non-parametric procedure for estimating the slope of the trend in a sample of N pairs of data:
Q = Median (xj-xk/j-k) j > k.
where xj and xk are the data values at times j and k (j > k), respectively. If there is only one datum in each time period, then N = n (n-1)/2, where n is the number of periods. If there are multiple observations in one or more periods, then N < n (n-1)/2, where n is the total number of observations. The N values of Qi are ranked from the smallest to largest, and the median of slope or Sen’s slope estimator is computed as
The Qmed sign reflects data trend reflection, while its value indicates the steepness of the trend. To determine whether the median slope is statistically different from zero, one should obtain the confidence interval of Qmed at a specific probability.
In the present study, Sen’s non-parametric method was used to estimate the slope of existing monthly, annual, and seasonal trends of climate data. This test was performed using XLSTAT 2021 software. The positive value of Sen’s slope shows an increasing trend, and the negative value indicates a decreasing trend in the time series.
3.5 Collection of people’s perceptions
Purposive sampling technique was used to take the perception of people from the same villages (Tabo, Dhankar, Kungri, Kaza Chhota Dara, Keylong, Udaipur, and Triloknath) to validate the result obtained from Mann-Kendall and Sen’s slope trend tests. (Figure 3) People above 45 years old were involved in the survey that lives in snow cover areas that receive snowfall and who have experienced snowfall in the past. The target was total 500 respondent of the total population but sample size was 600 keeping in mind a margin of 100 respondents. The drop outs were not much and comfortably managed to have 500 responses from the study area. The selection criteria were based on purposive sampling technique where respondents having knowledge about basic terminologies in the study area were given preference. The respondent’s selection is also filtered on the basis of age - minimum age was 45 years and kept gender ratio in consideration also. The exclusion criteria included participants not aware about the area and age below 45 years. The authors also didn’t select samples who had migrated in the area and living for less than 20 years. The questions were administered by the authors based on review of literature regarding similar topics and the author’s understanding. The target people above 45 years old were involved in primary activities as dominant occupation in the area is primarily agriculture and cattle rearing. Their consent was taken before filling up the questionnaires and all ethical considerations were kept in mind. Once the data was collected using questionnaires, coding was done in Microsoft excel and representation was carried out with the help of charts, bar diagrams and figures.
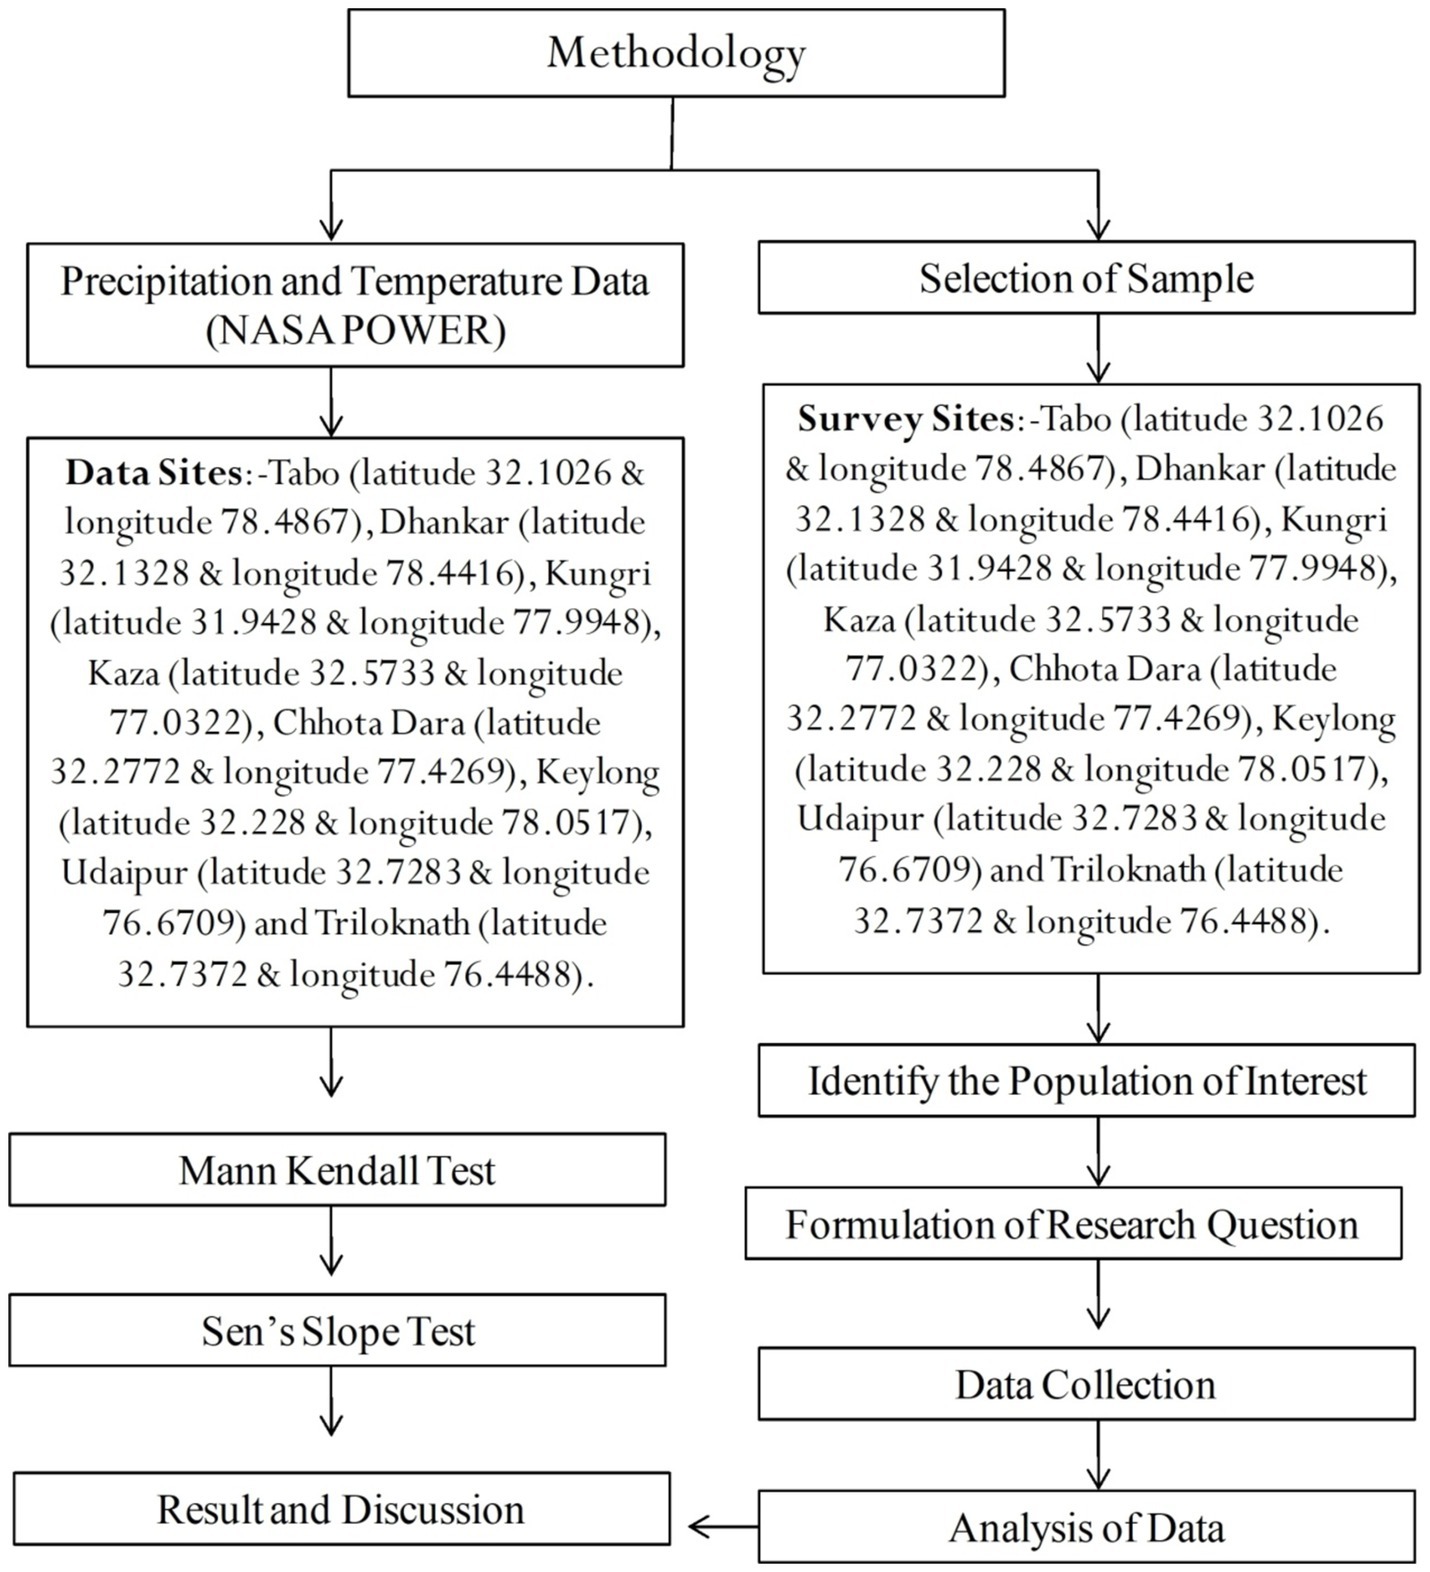
Figure 3. Research methodology incorporated in the study.
4 Results
4.1 Trend analysis of temperature
Temperature is one of the most important indicators of climate change because it has a great impact on the regional ecosystem. The Mann–Kendall and Sen’s slope tests were used to analyze the trend of temperature from 1981 to 2021. The descriptive statistics of temperature such as maximum, minimum, mean, standard deviation (SD), and coefficient variation (CV) are given in Table 1. The maximum, minimum, and mean temperature ranges are −1.47°C to 7.95°C, 5.48°C to −19.2°C, and 6.863°C to −15.791°C, respectively, from January 1981 to December 2021. The standard deviation (SD) and coefficient of variation of temperature range from 0.58°C to 2.225°C and 9.19% to −257.89%, respectively. As per the result of the coefficient of variation, the highest and lowest consistency in temperature were observed in May (−257.89%) and August (9.19%), respectively.

Table 1. Summary of statistical techniques of temperature (°C).
The annual maximum, minimum, and mean temperatures were recorded as −6.3°C, −3.35°C, and − 8.66°C, respectively. According to Shekhar et al. (2010), seasonal maximum, minimum, and mean temperatures increased by 2.8°C, 1°C, and 2°C, respectively, in the western Himalayas. The obtained SD of 0.75°C indicates that temperature had varied by 0.75°C from the annual mean temperature. The CV of −17.19% indicates that temperature had been highly consistent in Lahaul-Spiti in the last 40 years.
Annual and seasonal trends of temperatures were analyzed using the Mann–Kendall and Sen’s slope trend tests from January 1981 to December 2021. The study area experiences only two seasons, summer and winter, due to its strategic location in the Himalayan region. Annual and seasonal trends of temperatures are shown in Figure 4. As per the results, the computed p-values are greater than the significance level of alpha = 0.05 (Table 2). Hence the null hypothesis H0 was not rejected.
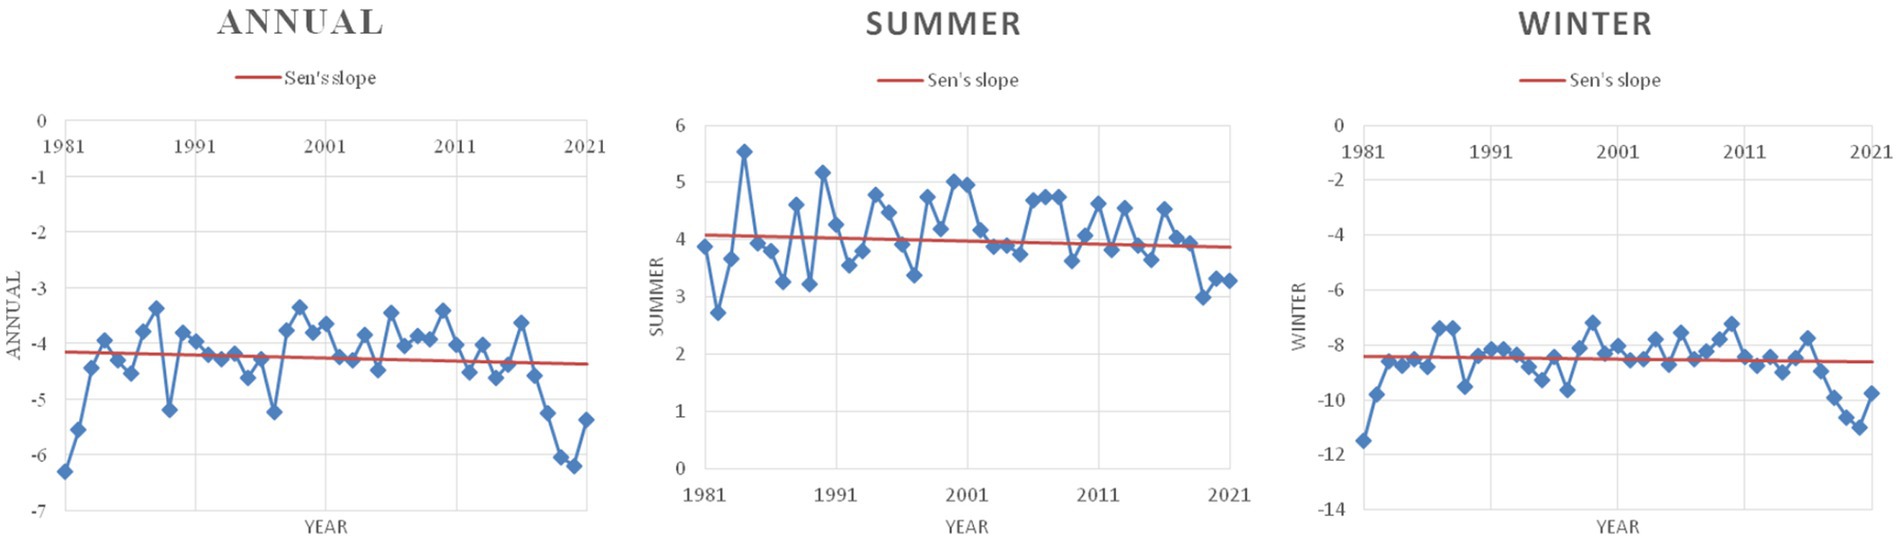
Figure 4. Annual and seasonal trends of temperature.
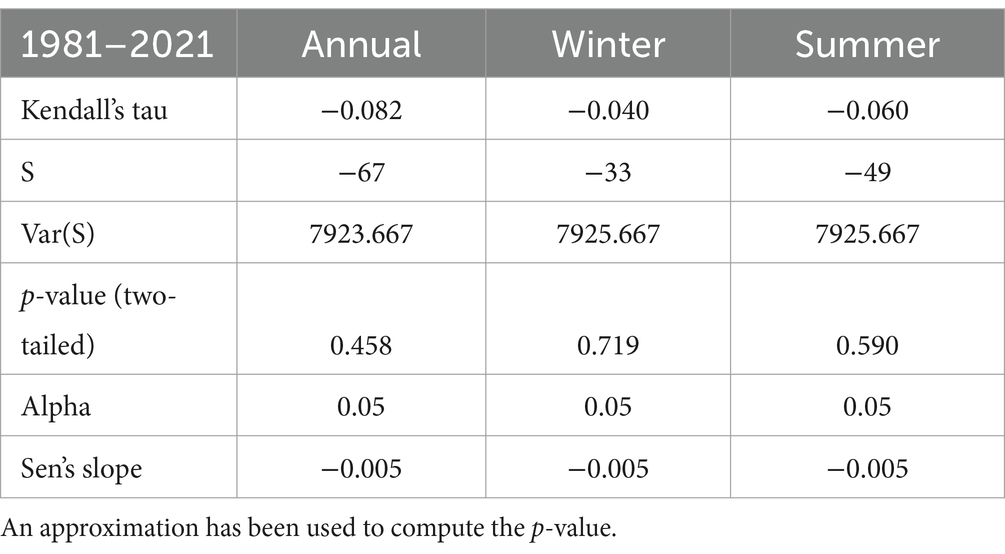
Table 2. The Mann–Kendall trend test/two-tailed test.
A very high positive value of S is an indicator of an increasing trend, and a very low negative value indicates a decreasing trend (Panda and Sahu, 2019). The values of S were obtained as −67, −33, and −49, which are neither high positive nor very low negative. Therefore, no significant trend was found in temperature during the research span. This indicates that no significant change had occurred in temperature in the last 40 years in Lahaul-Spiti.
Furthermore, the study investigated the temperature on a monthly basis to determine the trend in temperature from January 1981 to December 2021. The results of the Mann–Kendall and Sen’s slope trend tests are given in Table 3. Monthly variations and trends of temperature are shown in Figure 5. According to Figure 6, in the monthly trends of temperature, a significant trend was observed in October (p-value 0.011) and December (p-value 0.050). The p-value of 0.011 for October showed a significant increasing trend in temperature, as it is below the alpha value of 0.05. The p-value of 0.05 for December also showed an increasing trend of temperature in the Lahaul-Spiti district. Therefore, the null hypothesis H0 was rejected, and the alternative hypothesis H1 was accepted. As per the result, a significant increasing trend in monthly temperature was observed in October and December at a 5% significant level and a 95% confidence level. However, other months showed no significant trends.
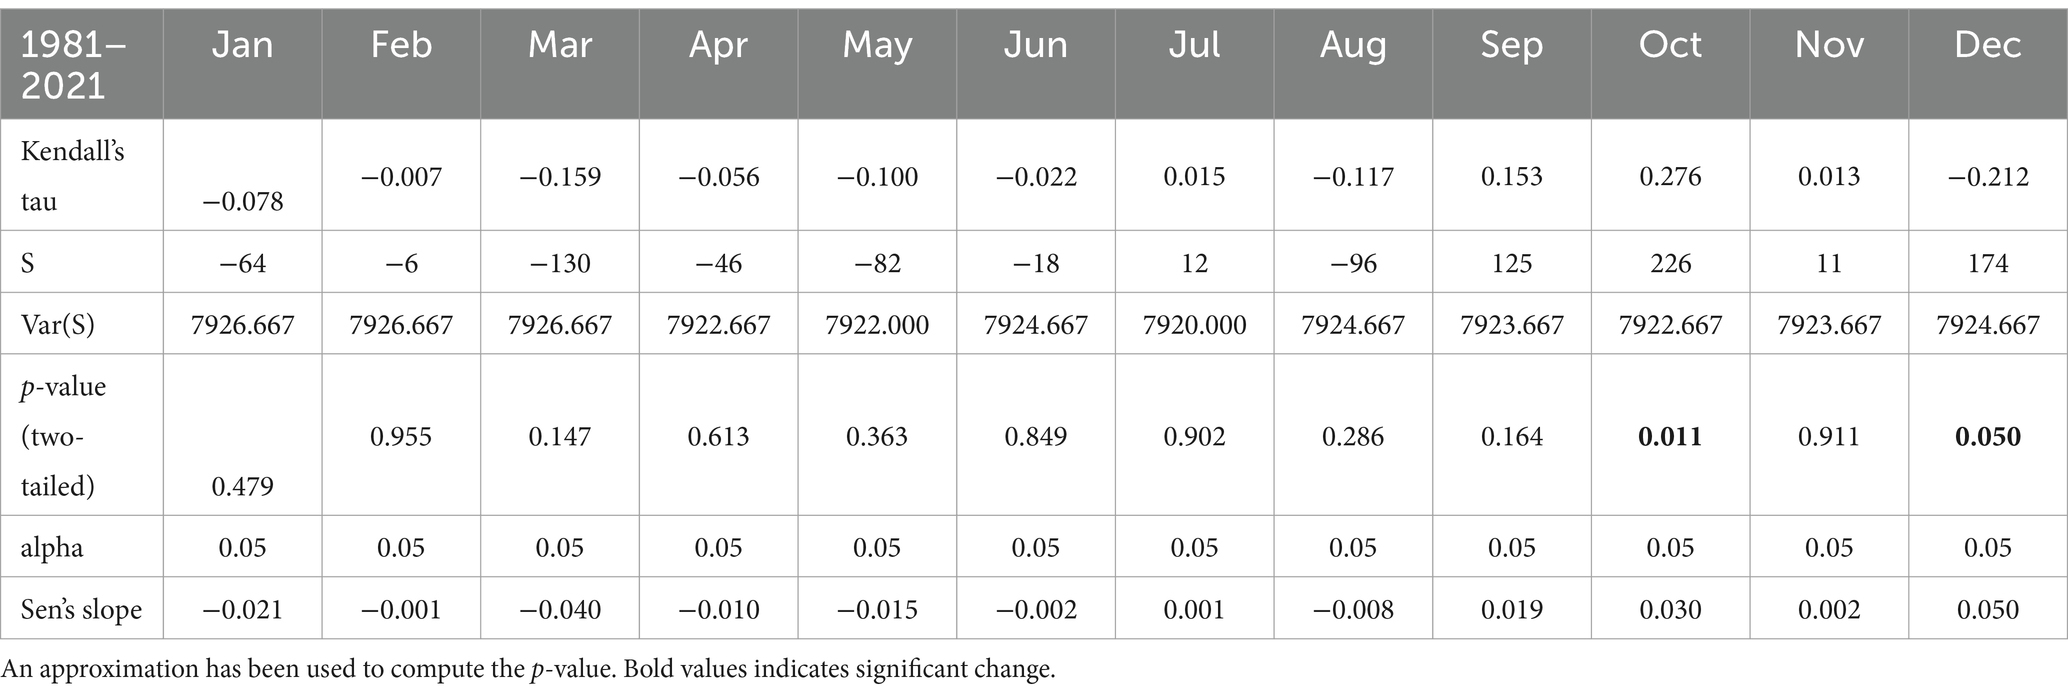
Table 3. The Mann–Kendall trend test/two-tailed test on a monthly basis.
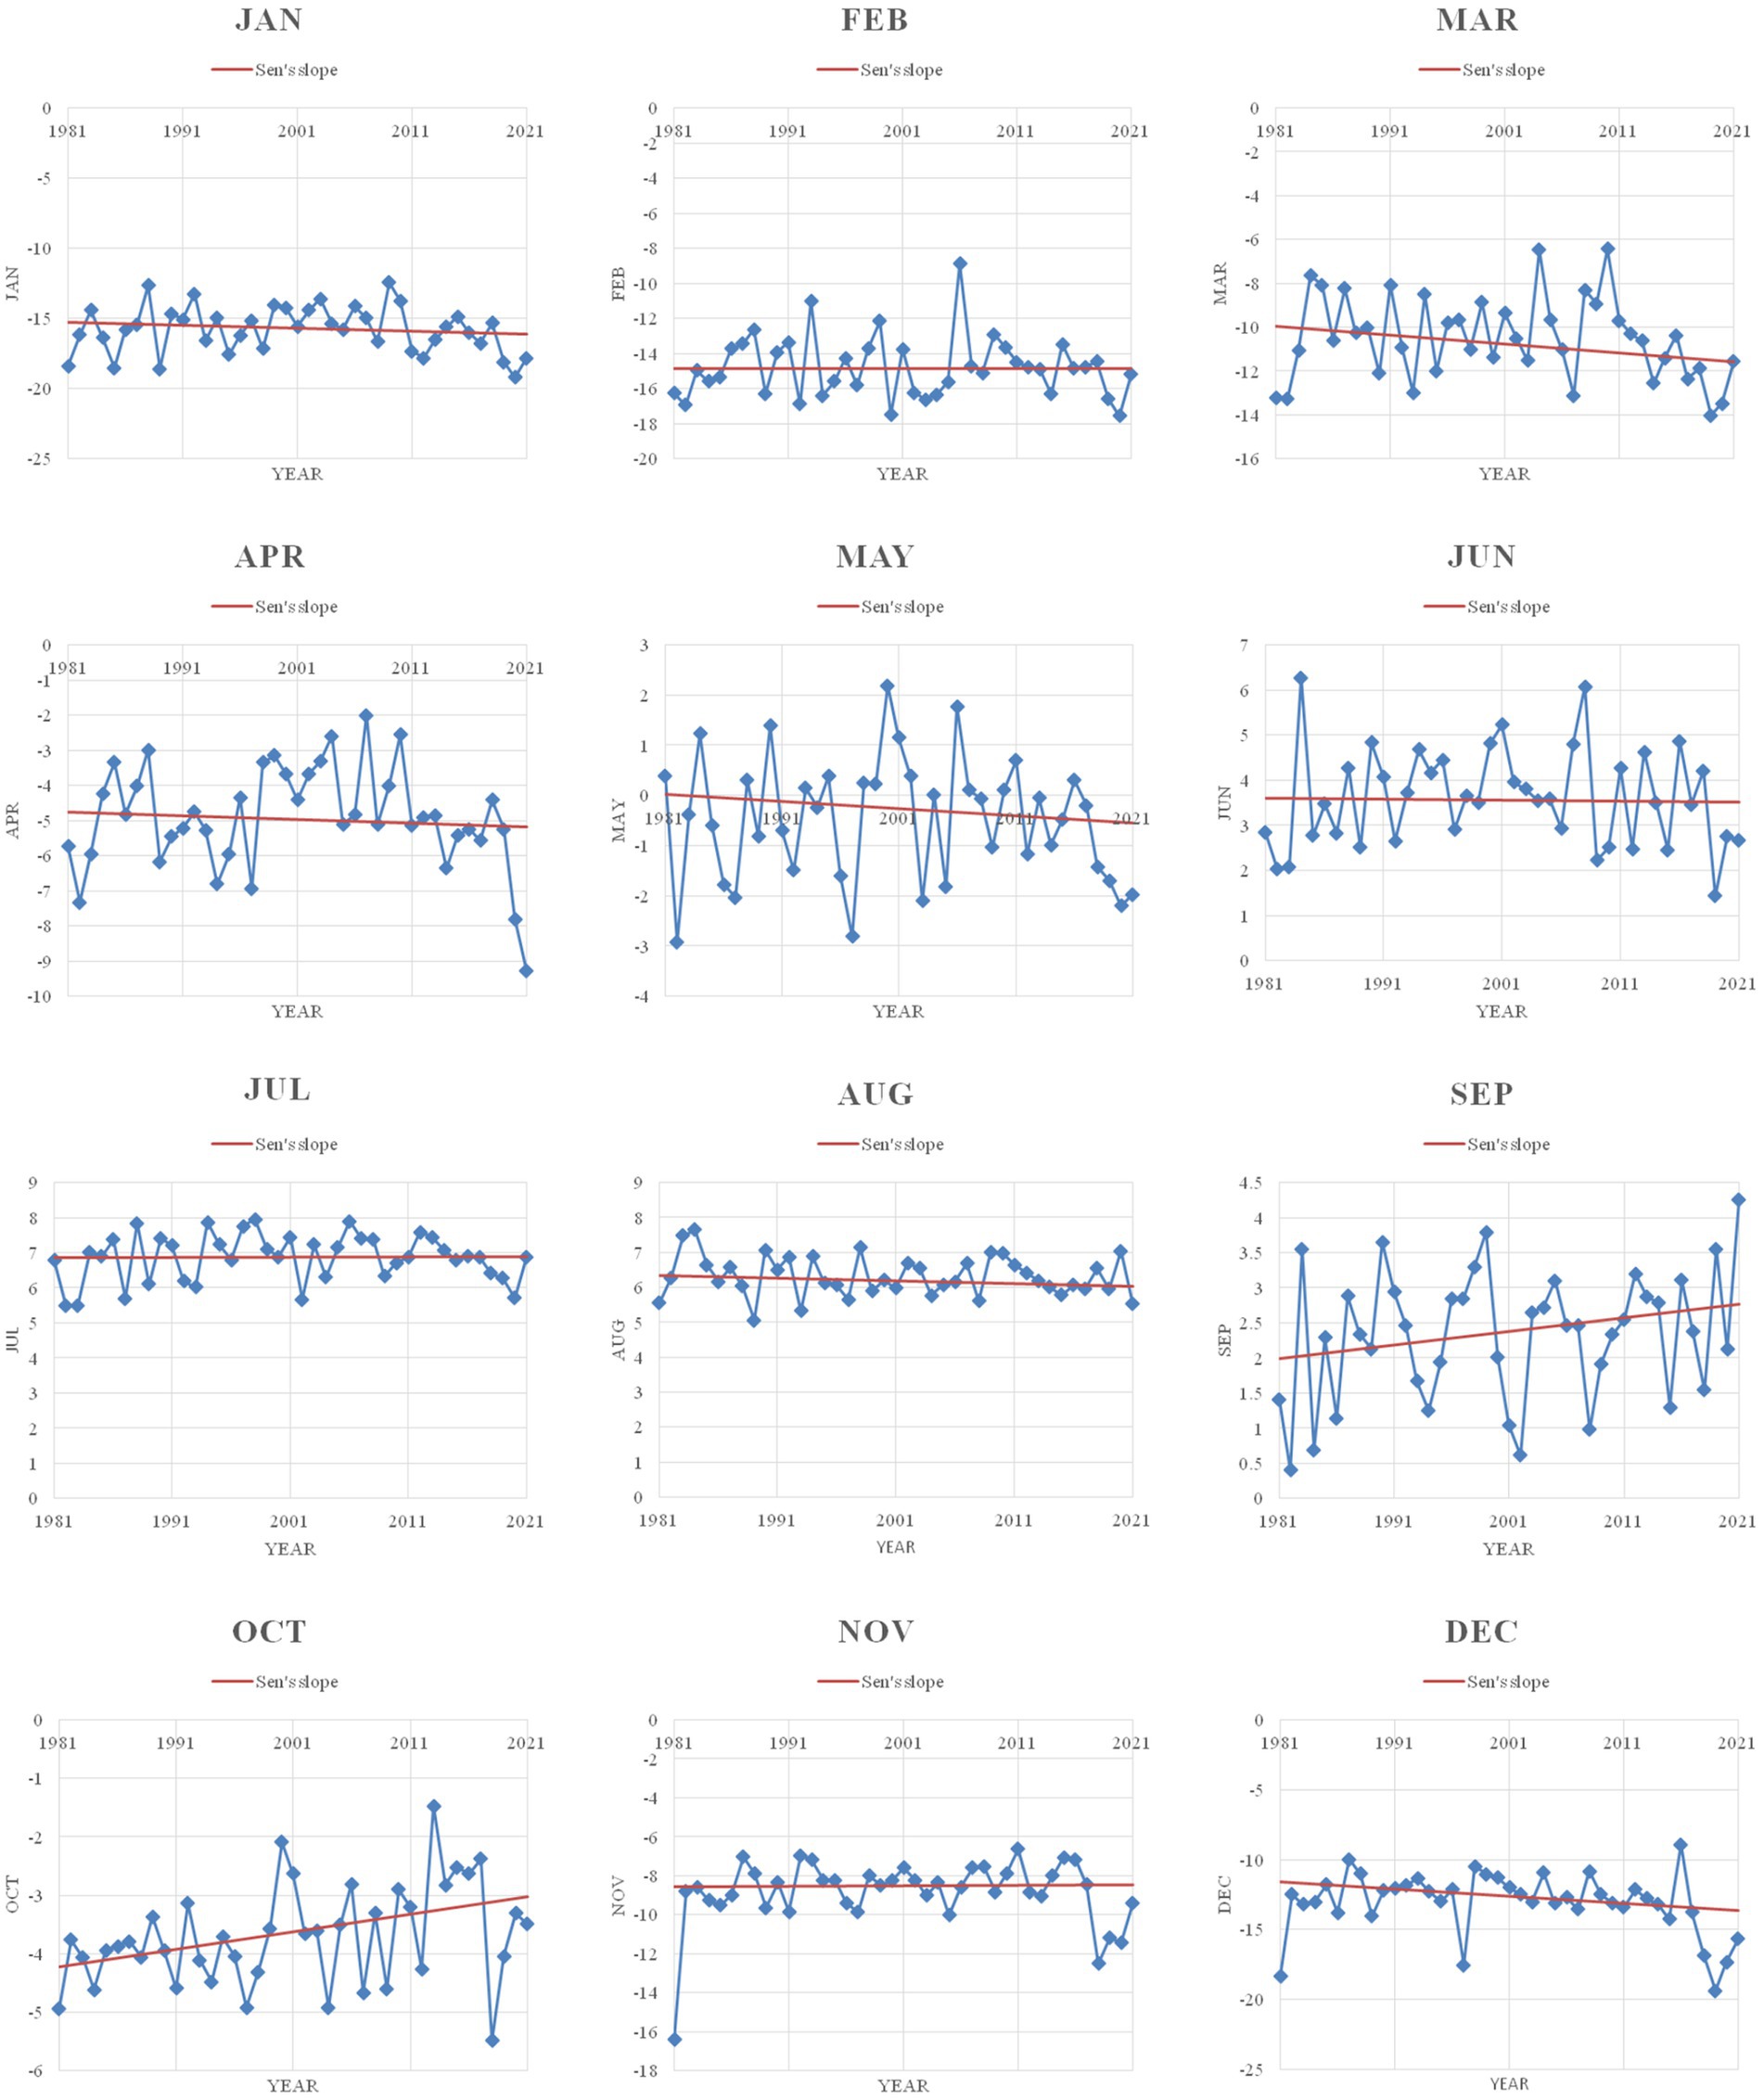
Figure 5. Monthly temperature trend from 1981 to 2021.
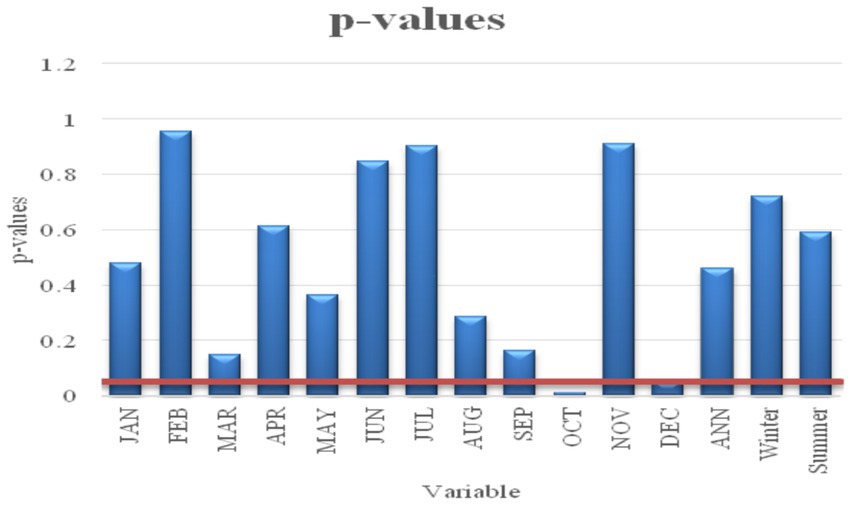
Figure 6. Graphical representation of p-values at a 5% significance level.
As per the above results, a dramatic shift in the temperature trend was observed in recent years, reflecting the stark impacts of climate change on this high-altitude region of Lahaul-Spiti. Historically known for its extremely cold temperatures, the area has experienced a notable uptick in monthly temperature, leading to altered weather patterns and environmental conditions. This shift has profound implications for the delicate ecosystems and traditional livelihoods dependent on the region’s unique climate dynamics. Increased temperatures are not only thawing permafrost and altering precipitation patterns but also disrupting local flora and fauna. Consequently, adaptation measures are becoming increasingly urgent for the communities of Lahaul-Spiti to mitigate the adverse effects of this rapid environmental transformation.
4.2 Trend analysis of precipitation
Precipitation is another important indicator of climate change, alongside temperature. It has a significant impact on regional ecosystems across the earth’s surface. As a vital source of fresh water, precipitation meets the needs of flora, fauna, and human populations. In the case of Lahaul-Spiti, it has an exceptional role in the lives of mountain dwellers because there is no alternative source of water except precipitation. Therefore, the region is highly susceptible to climate change. The Mann–Kendall and Sen’s slope tests were used to analyze the precipitation trend from 1981 to 2021. The descriptive statistics of precipitation such as maximum, minimum, mean, SD, and coefficient variation are shown in Table 4. The maximum, minimum, and mean precipitation ranges are 0 mm to 2.14 mm, 2.19 mm to 12.94 mm, and 0.469 mm to 6.324 mm, respectively, from January to December during the research period. The SD and CV of precipitation range from 0.564 mm to 2.993 mm and 42.32 to 163.54%, respectively. According to the analysis, the highest and lowest consistency in precipitation were observed in August (42.32%) and November (163.54%), respectively.
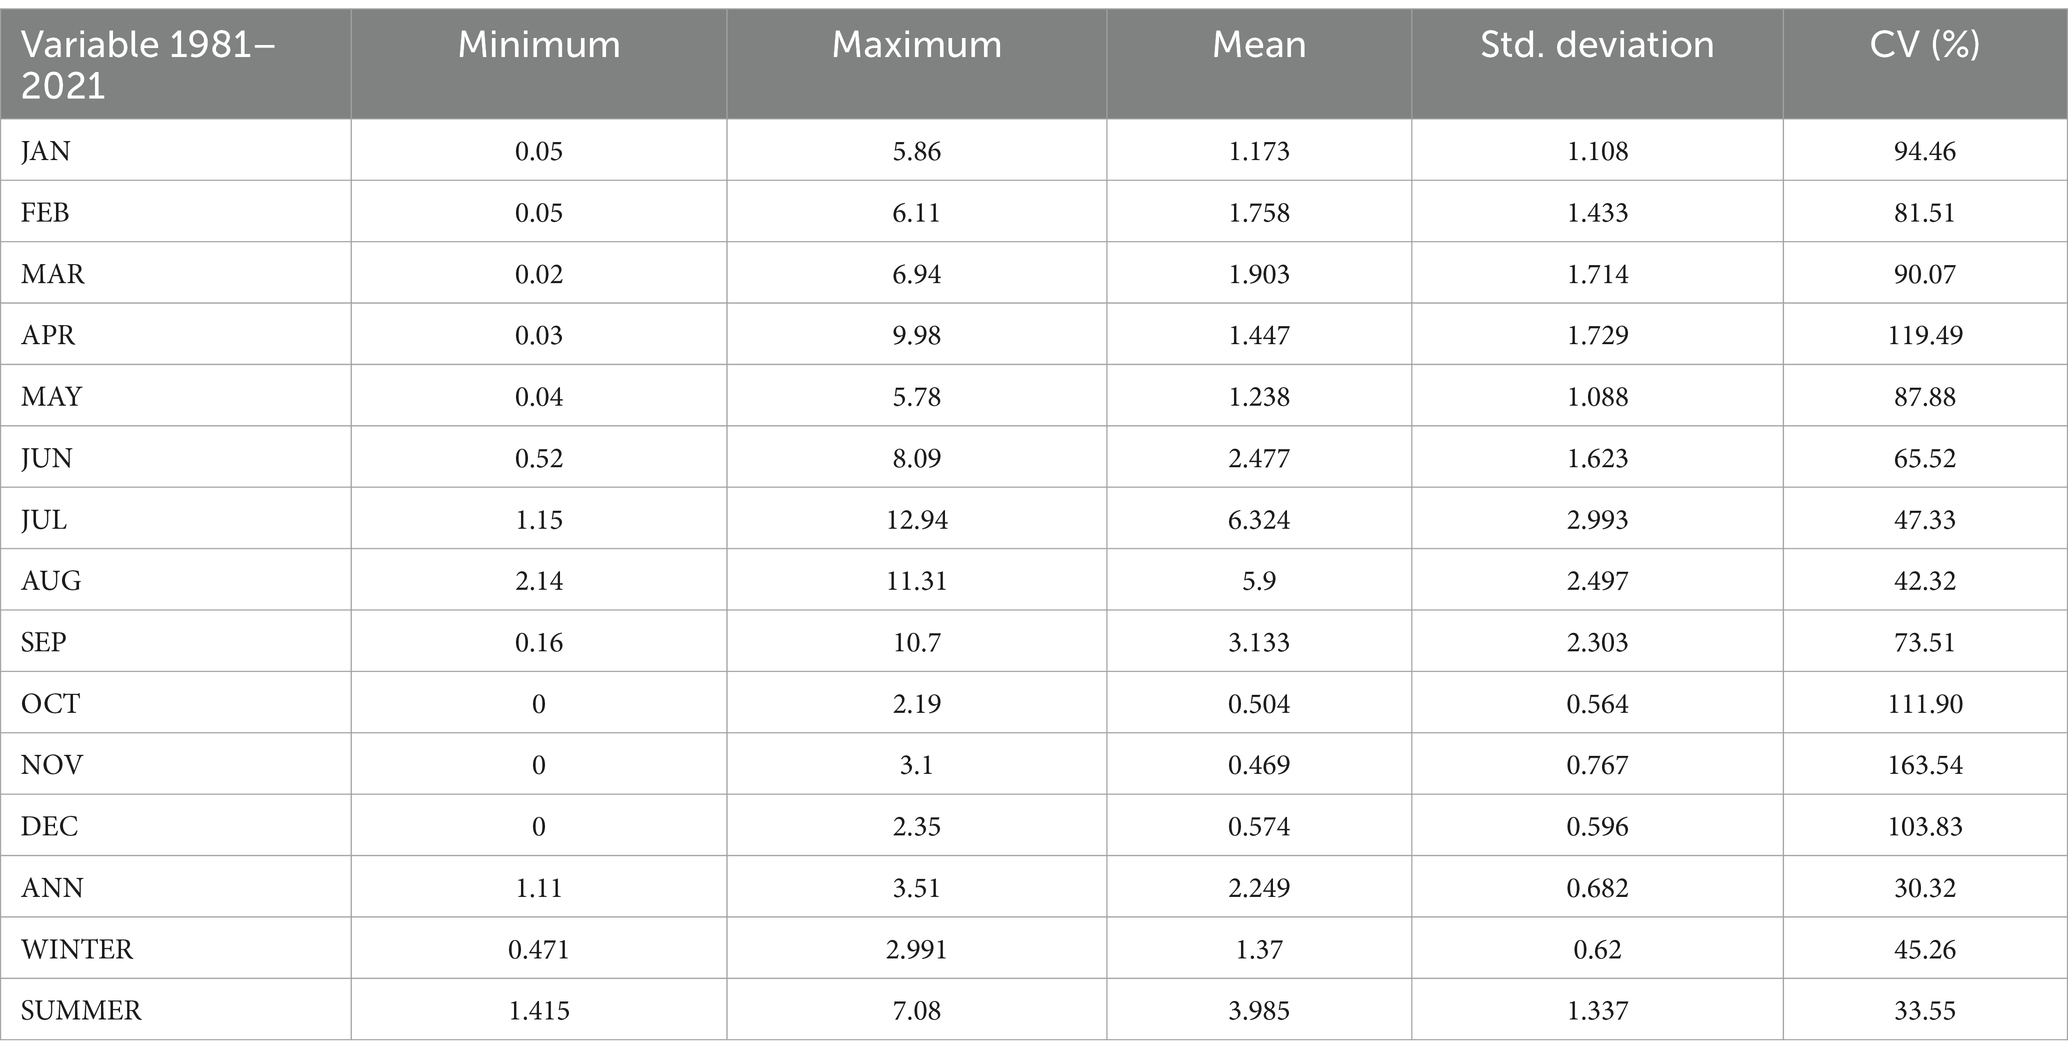
Table 4. Summary of statistical techniques of precipitation (mm/day).
The annual minimum, maximum, and mean precipitation values were recorded as 1.11 mm, 3.52 mm, and 2.249 mm, respectively, during the research period. The value of SD indicates that precipitation varied by 0.682 mm from mean precipitation. The obtained results of the annual coefficient of variation, at 30.32%, showed the highest consistency in precipitation. Lahaul-Spiti comprises only two seasons, summer and winter, due to its strategic location in the Himalayas. Therefore, annual precipitation data were grouped into only two particular seasons. According to the seasonal analysis, the maximum, minimum, and mean precipitation values were recorded as 1.414 mm, 7.08 mm, and 3.985 mm, respectively, in summer and 0.471 mm, 2.991 mm, and 1.37 mm, respectively, in winter. SD showed variations of 33.55 mm and 45.26 mm during summer and winter from mean precipitation, respectively.
The trend of annual and seasonal precipitation was also analyzed using the Mann–Kendall and Sen’s slope trend tests from 1981 to 2021. The annual and seasonal trends of precipitation are shown in Figure 7. According to the results, the computed p-values are lower than the significance level of alpha = 0.05 (Table 5). Therefore, the null hypothesis H0 was rejected, and alternative hypothesis H1 was accepted. The results of the annual and seasonal trend analysis of precipitation showed an increasing trend. This indicates that a significant change has occurred in precipitation in the last 40 years in Lahaul-Spiti.
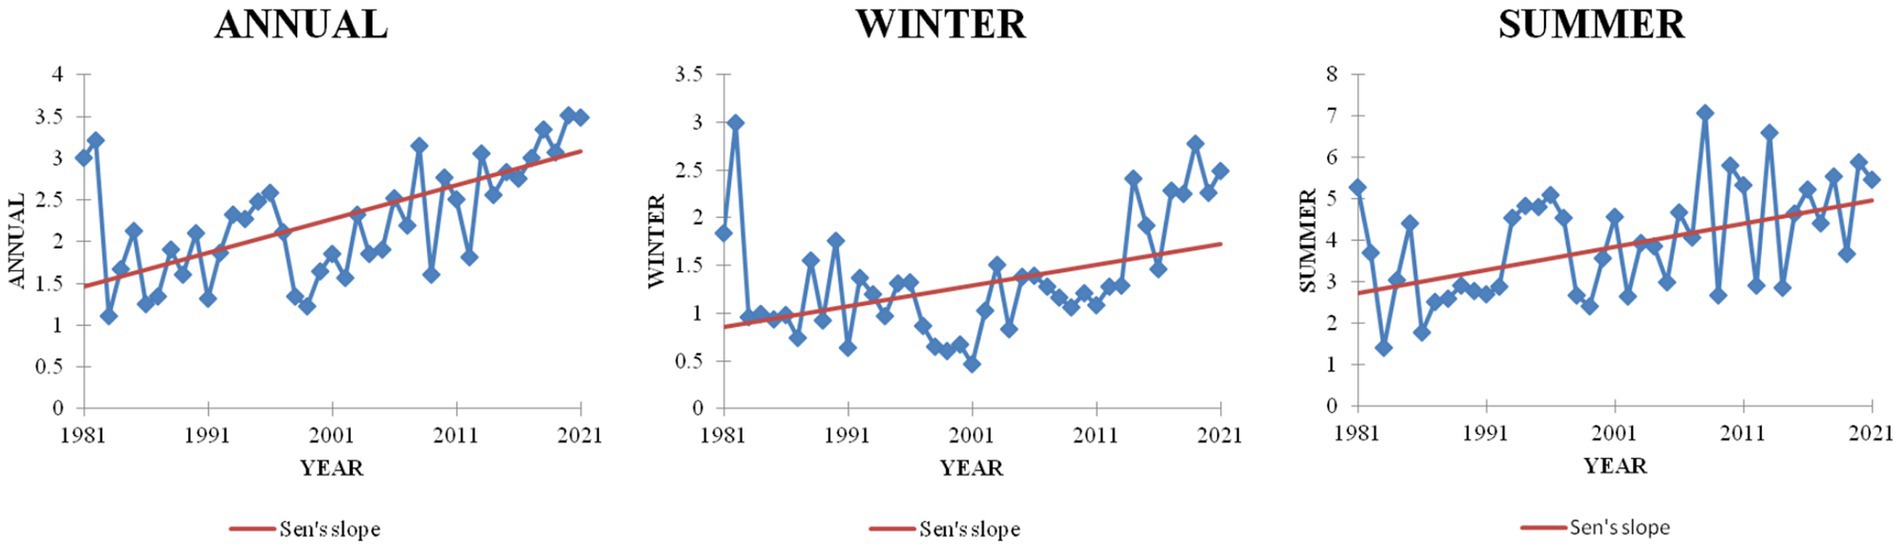
Figure 7. Annual and seasonal trends of precipitation from 1981 to 2021.
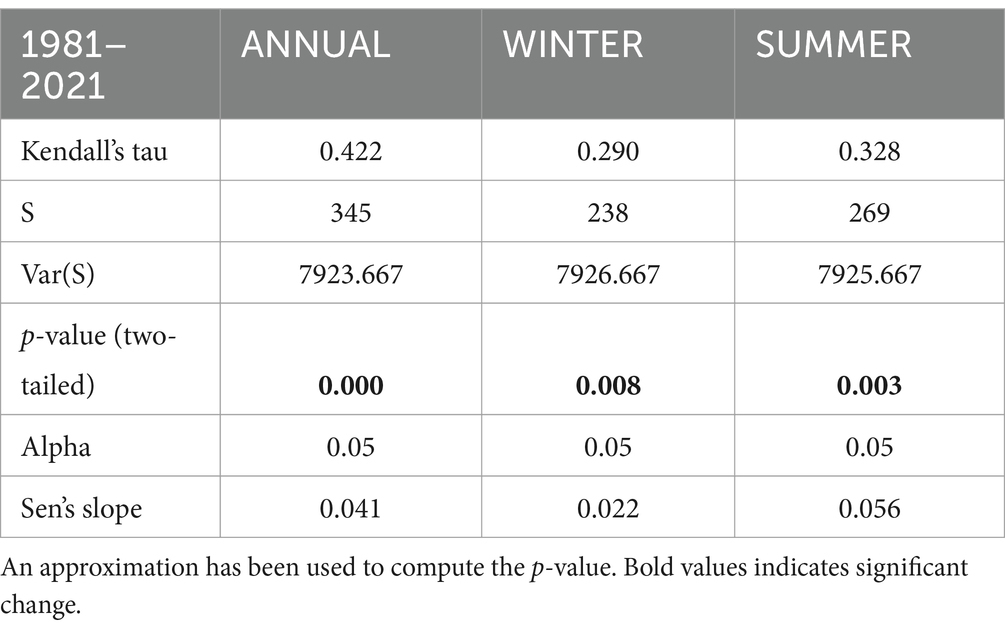
Table 5. The Mann–Kendall trend test/two-tailed test.
The study area is situated in the rain shadow area of the Trans-Himalayan region, where precipitation in the form of rainfall is not a very frequent event. The change in the trend of precipitation occurred due to the increase in temperature in October and December. As a result, the region has started receiving precipitation in the form of rainfall, attributed to the continuous rise in temperature. An earlier study conducted by Kumar et al. (2018) also stated that precipitation started occurring in the form of rainfall due to increasing land surface temperature and vegetation cover in Spiti Valley. This is the main reason behind the increasing trend of precipitation in Lahaul-Spiti during the research period.
The monthly trend of precipitation was obtained using the Mann–Kendall and Sen’s slope trend test analysis from January 1981 to December 2021 (Table 6). According to Figure 8, the monthly trends of precipitation indicated that a significant trend in precipitation was observed in January (p-value 0.030), April (p-value 0.032), June (p-value 0.004), July (p-value 0.027), and August (p-value 0.002). Therefore, the null hypothesis H0 was rejected, and the alternative hypothesis H1 was accepted for these months. The trend and monthly variations of precipitation are shown in Figure 9. According to the results, significant increasing trends in precipitation were observed in January, April, June, July, and August at a 5% significant level and a 95% confidence level. However, other months showed no significant trends.
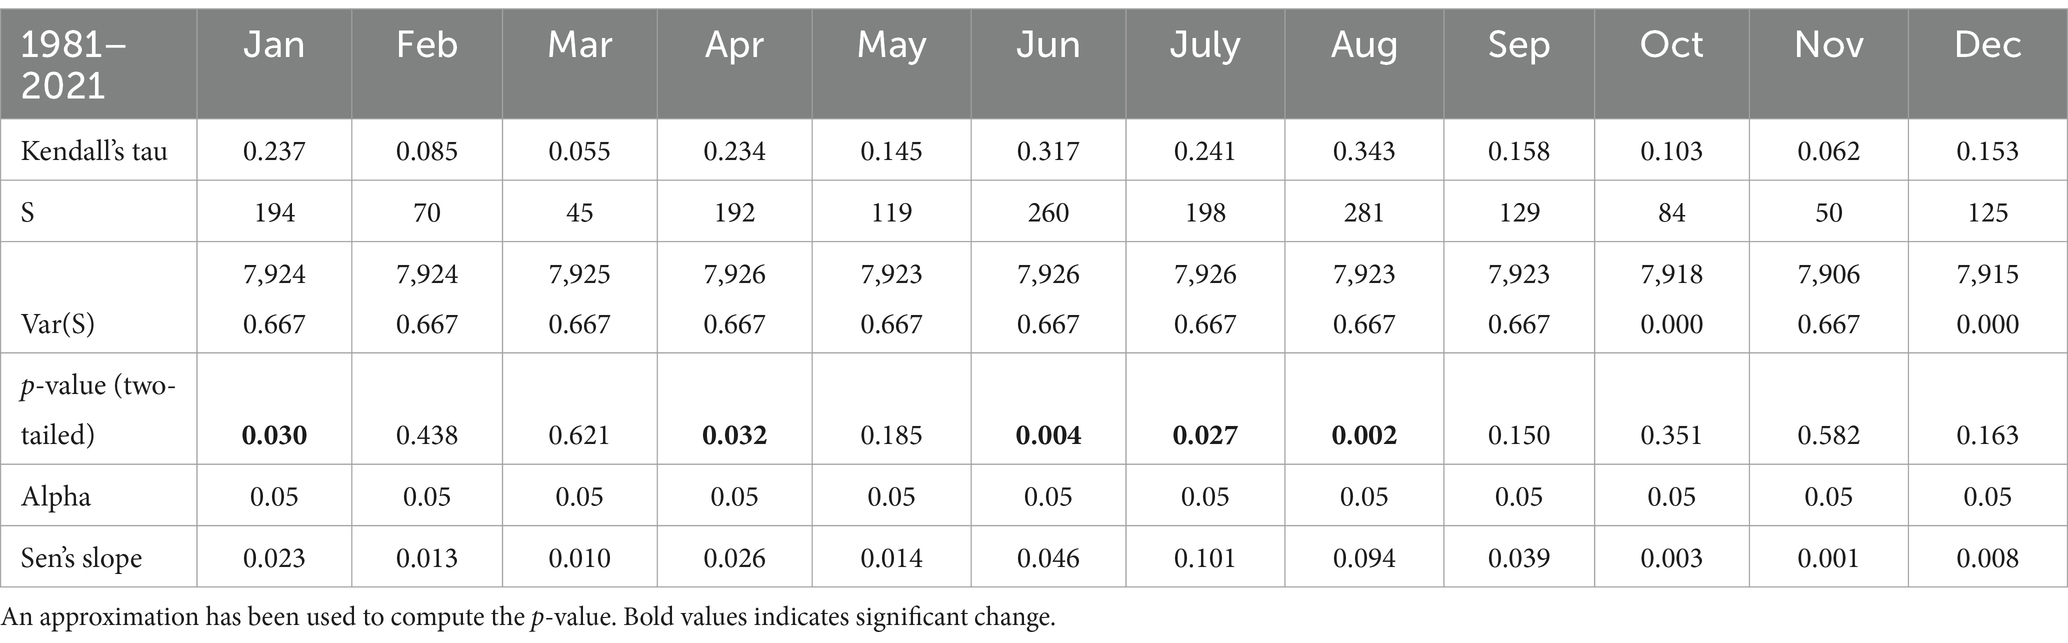
Table 6. The Mann–Kendall trend test/two-tailed test.
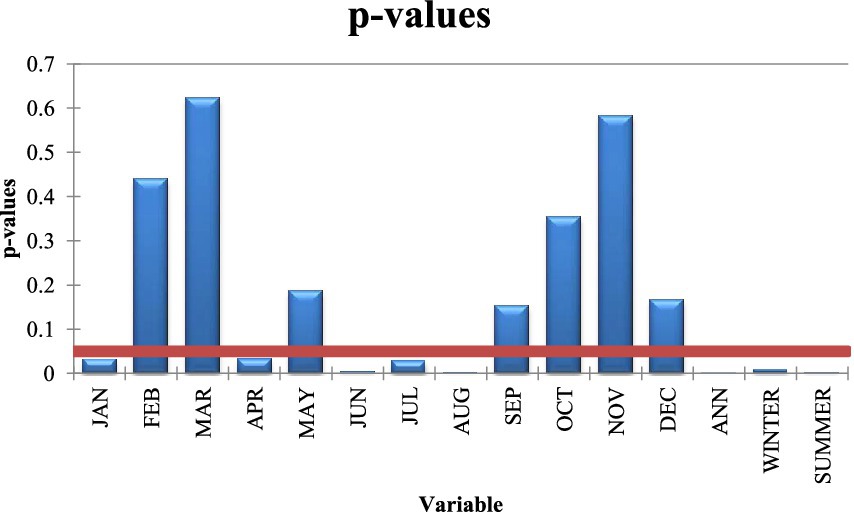
Figure 8. Graphical representation of p-values at a 5% significant level.
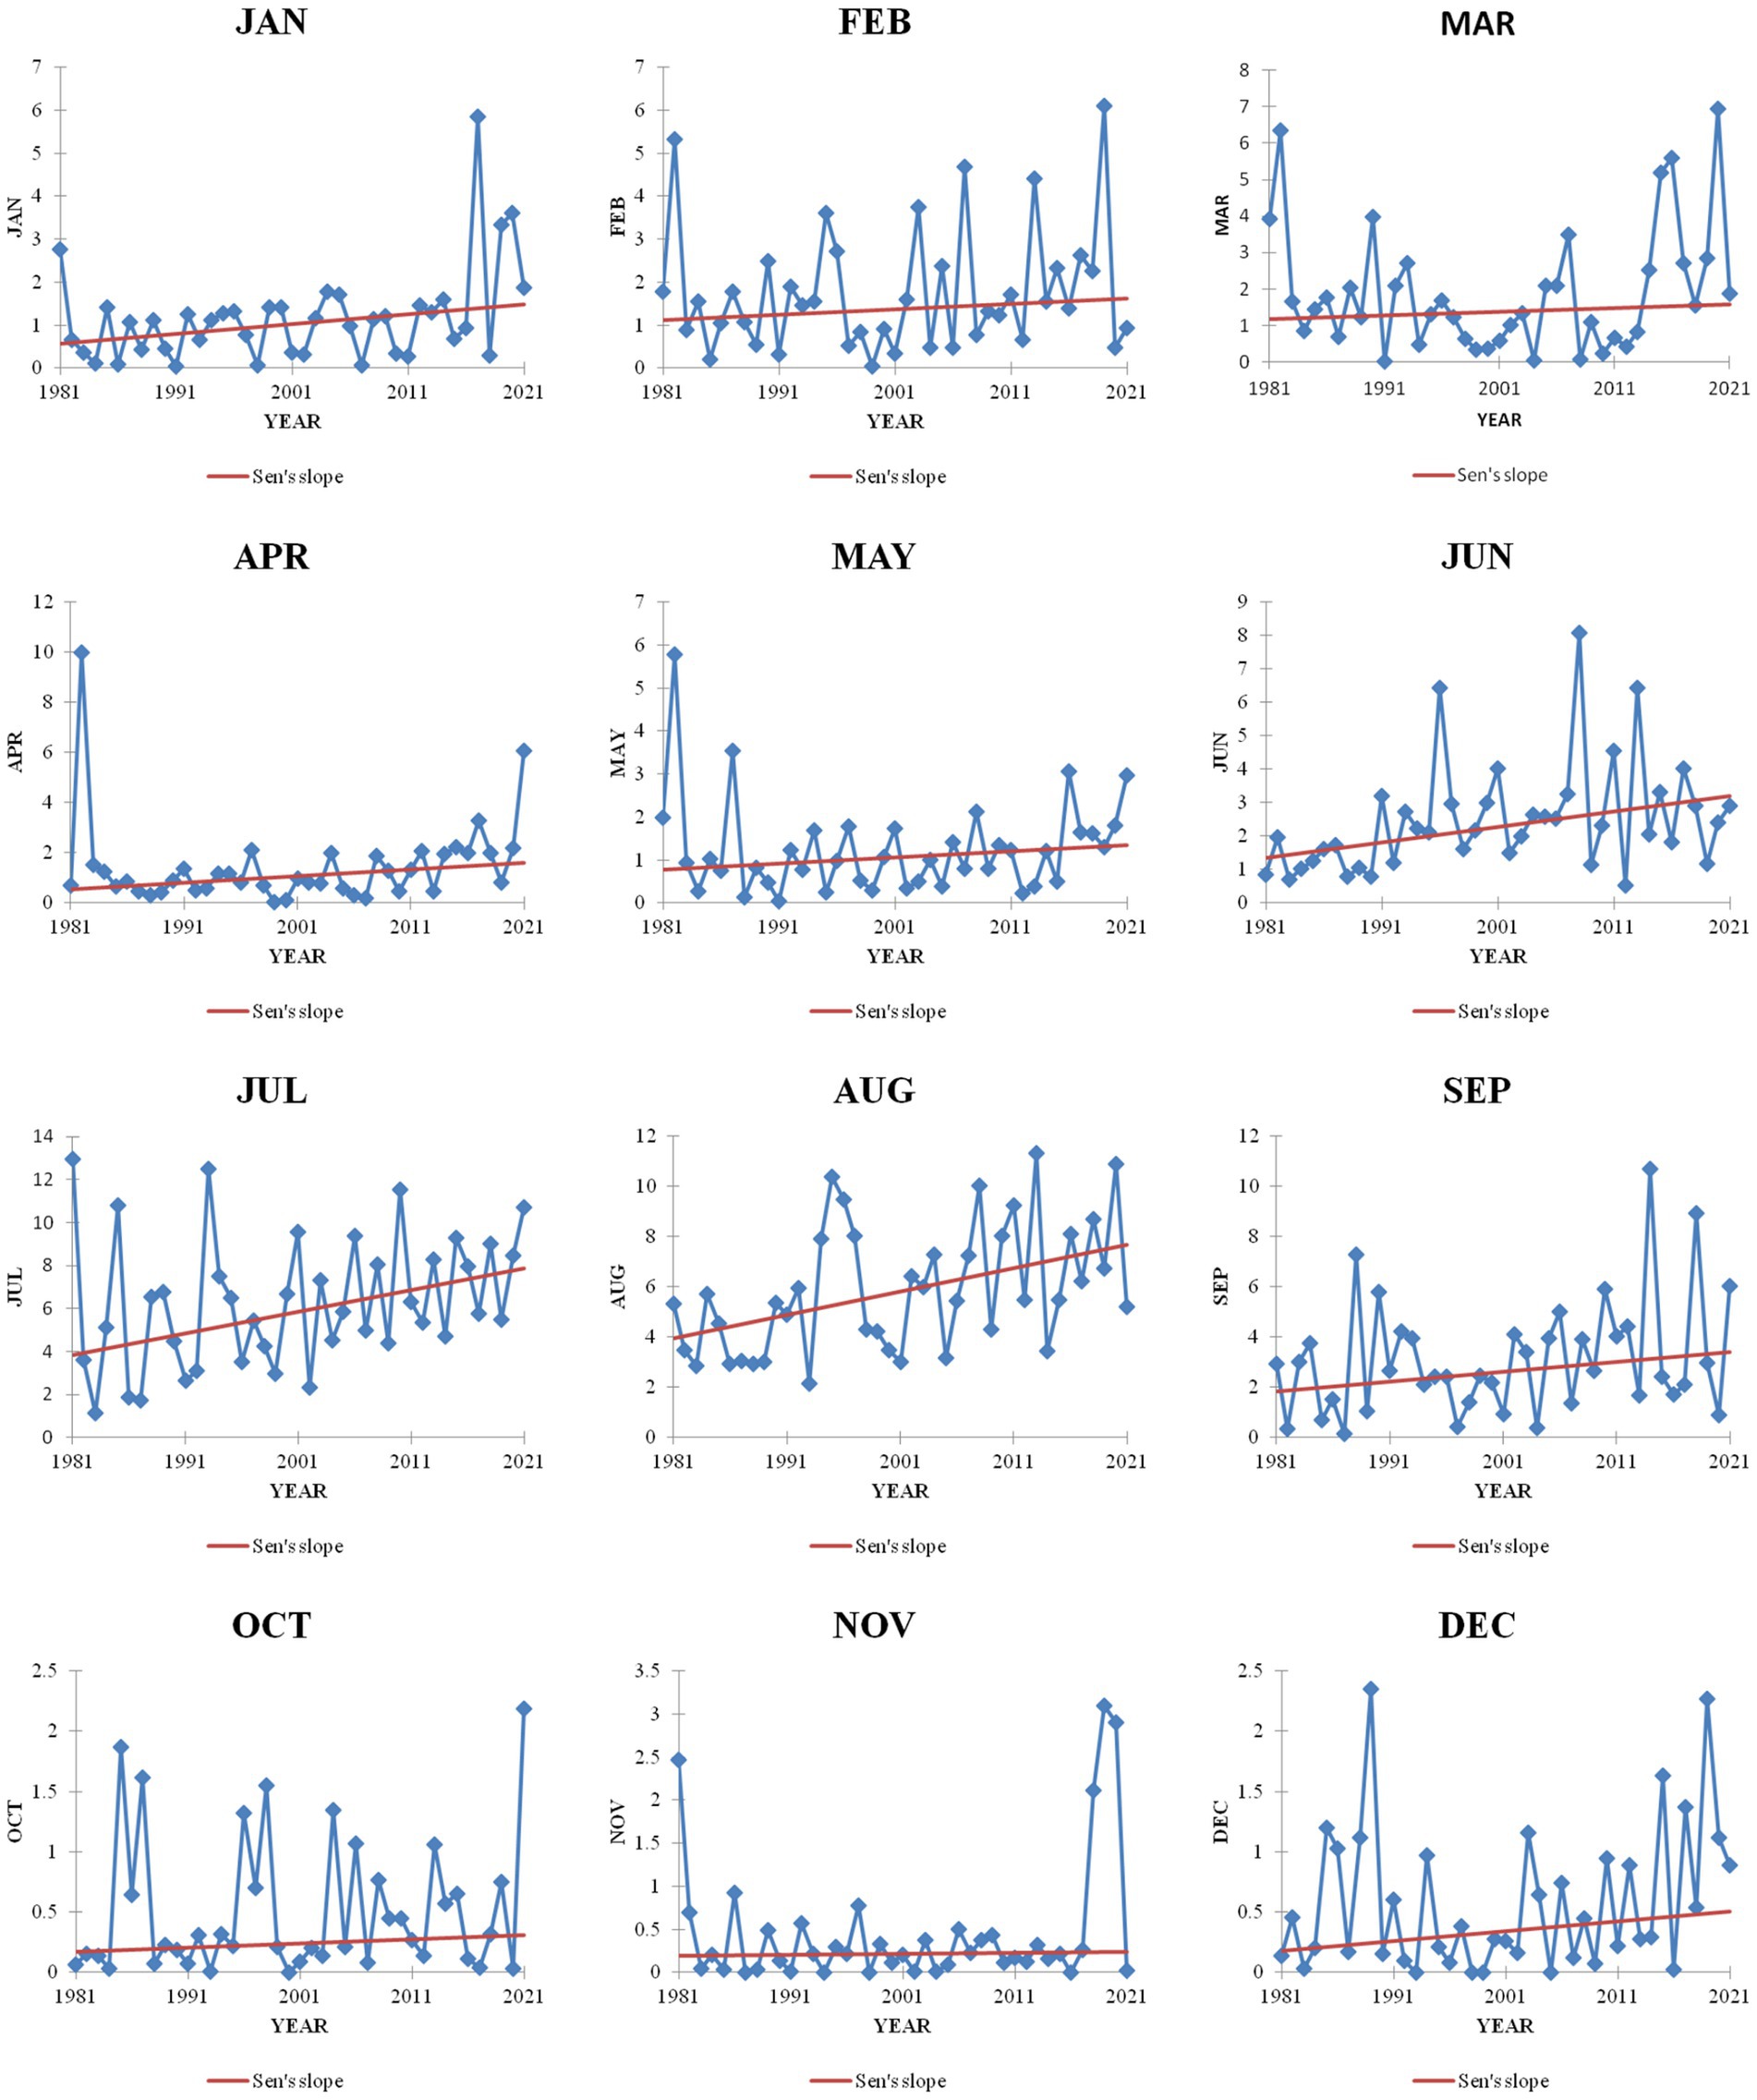
Figure 9. Monthly trend of precipitation from 1981 to 2021.
5 Assessment of people’s perceptions of climate change
People’s perceptions were gathered from the same villages (Tabo, Dhankar, Kungri, Kaza, Chhota Dara, Keylong, Udaipur, and Triloknath) to validate the results obtained from the Mann–Kendall and Sen’s slope trend tests. The questionnaire survey involved individuals above 45 years old who lived in snow-cover areas that receive snowfall and who have experienced snowfall in the past. The target was a total of 500 household respondents of the total population, but the sample size was 600 considering a margin of 100 respondents. The dropout rate was minimal, and it was possible to comfortably gather 500 household responses from the study area. The selection criteria were based on a purposive random sampling technique where respondents having knowledge about basic terminologies in the study area were given preference. The respondent selection was also filtered on the basis of age; the minimum age was 45 years and the gender ratio was also considered. The exclusion criteria included participants not aware of the area and aged below 45 years. The authors also did not select individuals who had migrated to the area and lived for less than 20 years. The questions were administered by the authors based on a review of the literature regarding similar topics and their understanding. The target individuals, aged above 45 years, were primarily involved in agriculture and cattle rearing, which are the dominant occupations in the area. Their consent was obtained before completing the questionnaires, and all ethical considerations were taken into account.
The sample size (n) for each of the surveyed sites was determined using the approach recommended by Arkin and Colton (1951):
where N = total number of households, Z = Z-statistics (i.e., 1.96 at 95% confidence level), p = estimated population proportion (0.05; this maximizes the sample size), and d = error limit of 5%. The majority of the questions for household surveys were designed as multiple-choice questions with answers in terms of one of the following: increased, decreased, no change, and do not know (Figure 10).
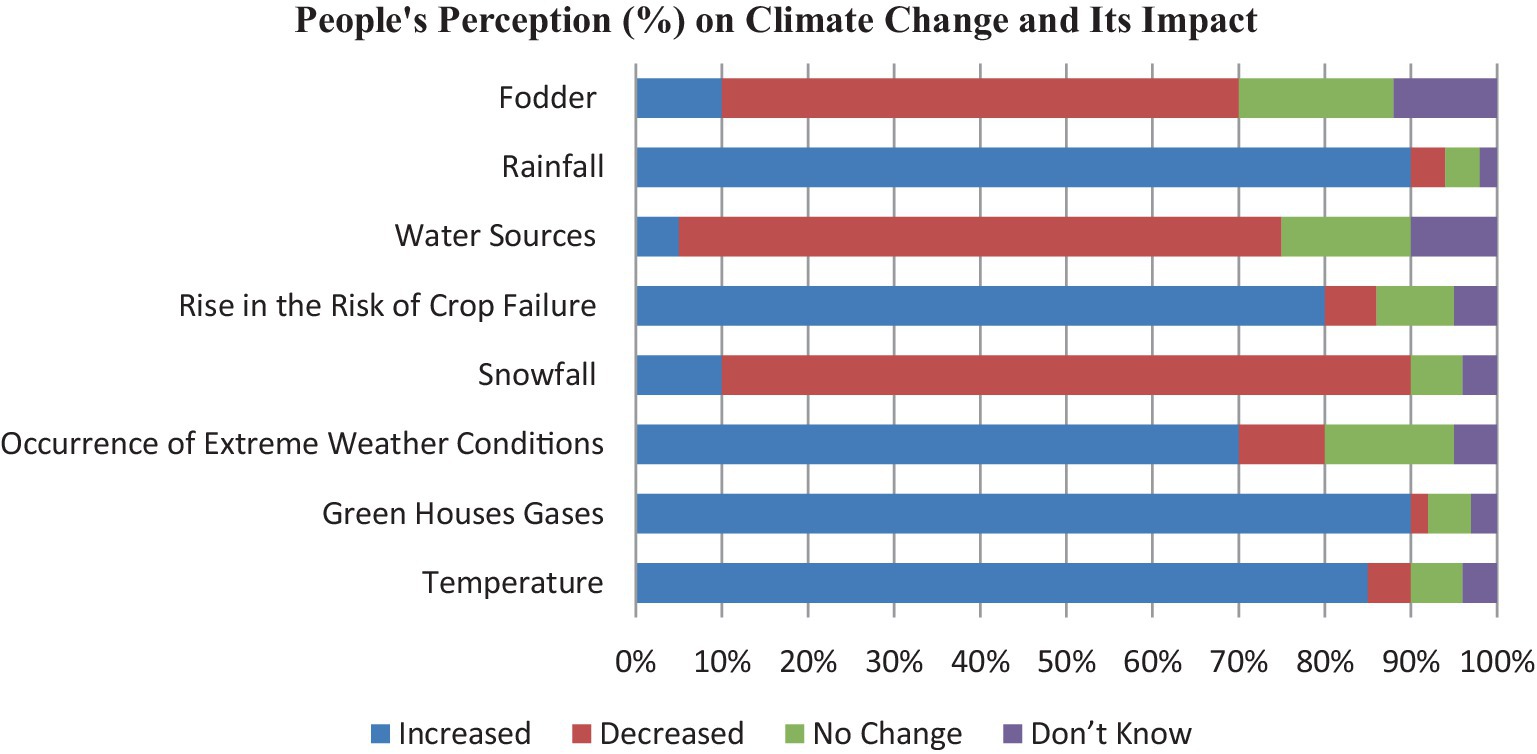
Figure 10. People’s perceptions of climate change and their impact.
Figure 10 shows perceptions regarding changes in various climatic factors, showing the percentages of respondents who believe there has been an increase, decrease, no change, or uncertainty (“Do not know”) for each factor. The majority of respondents report an increase in temperature (85%) and greenhouse gases (90%), highlighting concerns about climate change. Similarly, there is a notable perceived rise in rainfall (90%) and the risk of crop failure (80%), possibly indicating climate-related agricultural impacts. On the other hand, snowfall (80%) and water sources (70%) are perceived to have decreased, suggesting a possible reduction in winter precipitation and water availability. Perceptions on fodder availability show more variation, with a majority indicating a decrease (60%) but also a significant portion reporting no change (18%). Extreme weather conditions show a mixed response, with 70% perceiving an increase, though 15% see no change. These data reflect a widespread concern about environmental changes and resource availability in the context of climate shifts.
The Himalayan mountain region is very sensitive to climate change, and the impact of climate change in this region can pose new threats to the livelihoods of mountain dwellers (Singh et al., 2010). The positive trend of precipitation and temperature is a clear indication of regional climate change in Lahaul-Spiti. The majority of people have said that temperature is increasing due to global warming and its effects can be easily seen in the snow/glacier-capped mountains. According to people’s perceptions, the region has started receiving more precipitation in the form of rainfall due to the rise in regional temperatures, while snowfall has been decreasing in the region.
The perceptions of the mountain dwellers match with the results obtained from the Mann–Kendall and Sen’s slope trend test analysis. The problem of water scarcity has been arising due to the decreasing snowfall and snow/glacier cover area. The water received from rainfall does not remain for long in the valleys, unlike snow or glacier meltwater, due to the steep slopes of the valleys. Therefore, it is very essential to introduce water harvesting techniques in the region. The perceptions of people and their understanding of climate are important assets, and they can play a major role in policy design and reducing the impact of climate change (Negi et al., 2017). People’s perceptions of climate change can be recognized as a critical contribution to environmental problems, agricultural production, and possible solutions (Weber, 2010). A detailed summary of people’s perceptions is given in Table 7.
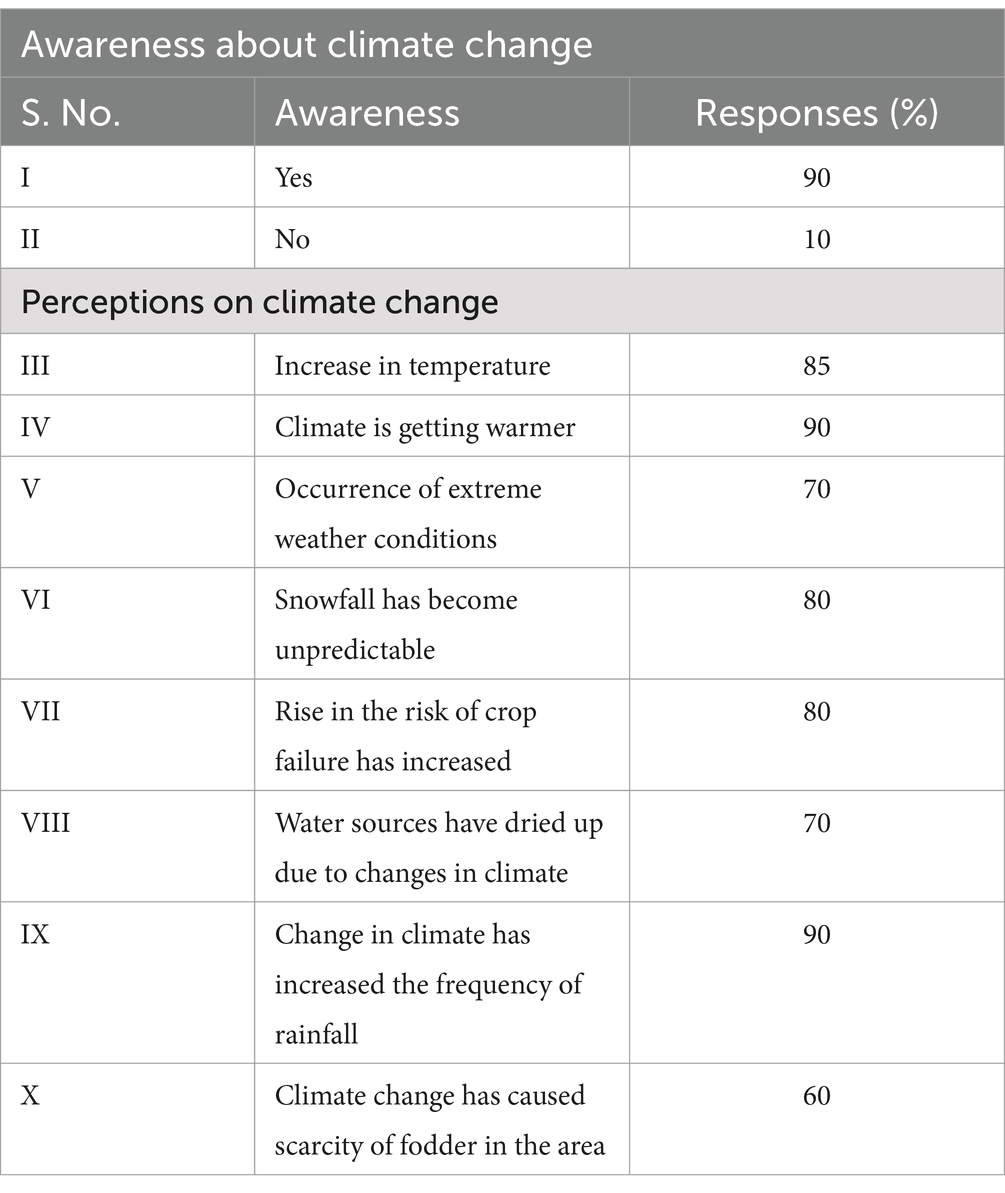
Table 7. People’s perceptions and knowledge of climate change.
The data on people’s perceptions reveal a high level of awareness concerning climate change, with 90% of respondents acknowledging it as a significant issue. The perceptions of climate change impacts are notably strong, with 90% perceiving an overall warming trend and increased rainfall frequency, while 85% report a rise in temperature. Furthermore, 80% observe unpredictable snowfall and a heightened risk of crop failure, underscoring the impact on agriculture. Additionally, 70% note dried water sources and extreme weather events, indicating concerns over water security and environmental stability. Finally, 60% report fodder scarcity, reflecting climate change’s adverse effect on local resources essential for livestock. These responses collectively highlight broad awareness and concern regarding the tangible effects of climate change in the area.
According to the precipitation trend analysis, over the past few decades, Lahaul-Spiti, nestled amid the rugged terrain of the Indian Himalayan region, has experienced a discernible shift in precipitation patterns. Historically known for its arid climate, characterized by minimal rainfall and harsh winters, the region has witnessed a notable alteration in its precipitation trend. While traditionally reliant on snowmelt for sustenance, recent years have seen a marked increase in rainfall during the monsoon season, accompanied by sporadic and unpredictable precipitation events throughout the year. This shift has brought both opportunities and challenges to the inhabitants and ecosystems of Lahaul-Spiti, with implications for agriculture, water resource management, and ecological balance in this fragile mountain ecosystem.
6 Discussion
The Lahaul-Spiti district is situated in a high altitudinal region of the Himalayas, and this region faces the problem of elevation-dependent warming (EDW). It presents a crucial facet of climate change, particularly pronounced in high-altitude regions such as the Himalayas. This phenomenon describes the disproportionate warming rates experienced at various elevations, where higher altitudes undergo more rapid temperature increases compared to lower elevations (You et al., 2020; Shen et al., 2021; Ullah et al., 2018). In the Himalayan context, this holds significant implications for ecosystems, glacial melt, and regional water resources, amplifying concerns over water security and ecological stability. The intricate interplay between atmospheric dynamics, land surface characteristics, and complex topographical features accentuates the vulnerability of these regions to EDW (Banerjee et al., 2024). Concurrently, the longitudinal variations between the Indian Ocean and the Tibetan Plateau play a significant role in enhancing regional land surface temperature, which eventually brings more moisture-laden clouds toward the Himalayan foothills (Banerjee et al., 2023). However, such intensive investigations are still a big challenge due to the scarcity of high-resolution datasets (Banerjee et al., 2020).
The recent IPCC report on climate change indicates that the Himalayan region is warming at a rate higher than the global average rate (Liu and Chen, 2000; Shrestha et al., 1999). The Lahaul-Spiti district, located in the Himalayan region, is highly sensitive to climate change, as even small changes in this region can disturb the regional ecosystem (Cannone et al., 2007). The long-term trend estimation and people’s perceptions both indicate that a significant change has occurred in the trends of precipitation and temperature in the last 40 years. The annual and seasonal trends of temperature have no significant trend, while the monthly trend shows an increasing trend in October and December (Table 3). According to the temperature trend analysis, it has increased in October (p-value 0.011) and December (p-value 0.050) in the Lahaul-Spiti in the last 40 years. Rising temperatures have led to significant glacial retreats in the district, which is a major concern as the region’s water supply heavily depends on glaciers and snowmelt. Warmer conditions have also altered the region’s fragile ecosystem, leading to changes in flora and fauna patterns. Species once suited to colder climates are either moving to higher altitudes or facing survival challenges, while invasive species adapted to warmer temperatures are increasingly appearing. Normally, snowfall begins in late October or early November, but a rise in temperature has altered this pattern. Recently, snowfall has been delayed by a month and no longer occurs on time in the valleys. A recently published study on the Uttarakhand Himalayan region has reported pre-monsoon elevation-dependent cooling and winter heating scenarios from 2000 to 2020 using a series of observed and remotely sensed datasets, where they emphasized large-scale changes in the global atmospheric teleconnections, thus altering regional snowfall patterns (Banerjee et al., 2021). According to Tiwari et al. (2016), winter snowfall is important because it feeds glaciers, which slowly release water during the summer, which in turn recharges springs, feeds rivers, and also provides water for irrigation. The annual (p-value 0.000) and seasonal (summer p-value 0.008 and winter p-value 0.003) trends of precipitation show a significant increasing trend in Lahaul-Spiti. The Mann–Kendal and Sen’s slope trend tests for monthly data show a major change in precipitation in January (p-value 0.030), April (p-value 0.032), June (p-value 0.004), July (p-value 0.027), and August (p-value 0.002) (Table 6). Additionally, the changing precipitation patterns, with reduced snowfall and more erratic rainfalls, are disrupting traditional agricultural practices that rely on predictable seasonal cycles. The study found that precipitation is increasing in the form of rainfall instead of snowfall due to high-elevated warming, which transforms solid to liquid precipitation. This change is a negative sign for the Lahaul-Spiti region as it is made up of completely sedimentary rocks that are very susceptible to rainfall. Snowfall feeds glaciers, which ensures water supply during the summer season, and people use snow/glacier meltwater for irrigation and household activities. However, snowfall has decreased in Lahaul-Spiti in the last three to four decades resulting in a severe water scarcity problem. The decreasing snow cover area in the region can be linked to the broader impact of climate change. Rising temperatures, changes in precipitation patterns, and altered snowfall contribute to reduced snow accumulation and earlier melting. Additionally, human-induced changes including improper land utilization and massive urbanization collectively accelerate regional warming because of augmented greenhouse gas emissions, which further long-transported to the Himalayan region and settle down on the snow surface, thereby resulting in decreased surface albedo and high altitudinal warming (Banerjee et al., 2023; Banerjee et al., 2024; Tiwari et al., 2016). Occasionally, the study found that agriculture in the region heavily relies on water received from snowmelt and glaciers. Shrinking water sources affect crop productivity and the livelihoods of the local people. Reducing the availability of water from traditional sources puts pressure on the supply of drinking water to communities. This can lead to conflicts over water resources. It is essential for stakeholders, including the government, local communities, and environmental organizations, to collaborate in implementing sustainable strategies to address the decreasing snow cover and water scarcity challenges in the Lahaul-Spiti district. This may involve a combination of short-term measures to alleviate immediate concerns and long-term strategies to adapt to the changing climatic conditions. Ongoing research and monitoring of water resources, glacial changes, and climate patterns provide valuable data for informed decision-making.
Socioeconomically, these climate shifts are deeply affecting the livelihoods of the region’s residents, who depend on agriculture, horticulture, and tourism. Shorter winters with less snowfall have hampered winter tourism, which relies on snow-based activities. Agricultural productivity has been adversely affected by both the reduction in snow cover, which naturally irrigates fields, and the increased occurrence of cloudbursts or sudden heavy rains, leading to soil erosion and crop damage. The changes are also leading to increased water scarcity during the crucial growing season, making local communities more vulnerable to food insecurity and economic instability. The combined effects of these changes threaten the sustainability of both the environment and the economy in Lahaul-Spiti.
The findings of the study can help in addressing the policy implications of increasing temperature, declining snowfall, snow cover, and effects on water availability, particularly in regions dependent on snowmelt for their water supply. Policymakers can formulate water management policies to ensure sustainable water usage, equitable distribution, and adequate storage to compensate for reduced snowmelt runoff, with the help of the present study.
6.1 Limitations of this study
The major constraint of this research is the availability of high-resolution datasets, while station-observed data records are also limited due to the inapproachable Himalayan surface topography and inhospitable weather conditions. Therefore, relying on remotely sensed datasets is the only available option to carry out such an investigation. Previously, several studies have used satellite data records to estimate long-term climate trends. However, they have reported that some datasets have significant over-or underestimation capacity to predict actual precipitation and temperature counts and suggested to use of monthly means to eradicate such issues (Du et al., 2024; Dollan et al., 2024). Moreover, another recent study by Kim et al. (2024) has reported a significant overestimation of regional temperature counts (nearly 4°C) due to the presence of intense snow cover. Additionally, high-altitudinal intense cloud cover during the monsoon period, seasonal snow cover area, and coarse resolution of satellite images have collectively impacted the investigation of long-term climate and cryospheric monitoring.
6.2 Suitable policies to mitigate such environmental issues
It is notable that regional temperature is increasing day by day in the Uttarakhand Himalayan region along with declined precipitation, which has a significant implication on regional agricultural productivity. Therefore, regional and central governments should take necessary actions to reduce such environmental dilapidations.
a. Strong environmental and social impact assessments are required to mitigate climate issues.
b. Increasing public awareness about protecting the environmental structure is crucial, as it can help alleviate climate-induced changes.
c. Implementing precise land utilization practices and minimizing the rapid urbanization near the Himalayan foothills are also effective for addressing environmental challenges.
d. Capacity building and early warning systems can be installed more widely to save people and their infrastructures from unpredicted events.
e. Massive-level plantations near the river banks are also effective in reducing hazard intensities, as in recent decades, the Himalayan regions have often witnessed several floods, cloudbursts, and earthquake events, which caused massive destruction downstream.
f. Overall, cross-border scientific collaboration and intensive investigations of future climate change and associated risks can be helpful in reducing environmental issues, thus enhancing long-term sustainability.
7 Conclusion
The conclusion can be drawn on the basis of the findings of the study. The computed p-values of the annual and seasonal trends of temperature are greater than the significance level of alpha 0.05. Hence, the null hypothesis H0 was not rejected. Further study investigated the trend of temperature on a monthly basis. The results indicated that a significant increasing trend in temperature was observed in October (p-value 0.011) and December (p-value 0.050). This is a clear indication of the rising temperature in the Lahaul-Spiti district. The results of the annual, seasonal, and monthly trend analyses of precipitation showed an increasing trend. This indicates that a significant change had occurred in precipitation and exceptionally showed an increasing trend in Lahaul-Spiti in the last 40 years. The obtained trend of precipitation and temperature showed a clear indication of climate change. Until a few years ago, the region received 70–80% precipitation in the form of snowfall and scanty rain as it is situated in a rain shadow region. Currently, precipitation started occurring in the form of rainfall, and it has become a common phenomenon in the valleys. Rainfall has a negative impact on the region as it does not remain for long, unlike snow/glaciers, due to the steep slopes of the valleys. Increasing precipitation in the form of rainfall has a greater impact than the increase in temperature. In earlier decades, snowmelt water flowed through kuhls almost the whole year, except for a few months in the freezing winter. However, in recent years, water availability in kuhls has massively reduced due to decreased snowfall and rising temperatures. Currently, water no longer flows in kuhls throughout the year, creating an alarming situation for the valleys. Lahaul-Spiti does not get adequate water to irrigate agricultural fields, thereby causing a massive drop in crop production as well as in its quality. An increase in precipitation may be the result of a regional temperature increase. The valley is composed of sedimentary rocks, and if heavy rainfall occurs on a large scale, it could lead to significant disasters in the future, including landslides, mudflow, floods, and other related events.
The Lahaul-Spiti district is very susceptible to climate change, and changing climate will have a negative impact on the lives of the mountain dwellers in the long run. Continued monitoring of climatic variability is recommended using the Mann–Kendall, Sen’s slope, and other trend identification tests. The findings of the study can help in the further analysis of possible causes behind the increase or decrease in precipitation and temperature patterns.
Data availability statement
Publicly available datasets were analyzed in this study. This data can be found at: https://power.larc.nasa.gov/.
Ethics statement
The requirement of ethical approval was waived by Department of Geography, Delhi School of Economics, University of Delhi, Delhi for the studies involving humans because Department of Geography, Delhi School of Economics, University of Delhi, Delhi. The studies were conducted in accordance with the local legislation and institutional requirements. The participants provided their written informed consent to participate in this study.
Author contributions
PK: Conceptualization, Data curation, Funding acquisition, Investigation, Methodology, Software, Supervision, Writing – review & editing. DD: Formal analysis, Funding acquisition, Project administration, Resources, Validation, Visualization, Writing – review & editing. MH: Conceptualization, Data curation, Formal analysis, Investigation, Methodology, Resources, Software, Validation, Visualization, Writing – original draft, Writing – review & editing, Funding acquisition, Project administration, Supervision. MK: Data curation, Formal analysis, Resources, Writing – review & editing. PC: Formal analysis, Funding acquisition, Project administration, Validation, Writing – review & editing. SS: Formal analysis, Funding acquisition, Project administration, Resources, Validation, Visualization, Writing – review & editing. AK: Funding acquisition, Resources, Visualization, Writing – review & editing. AB: Data curation, Funding acquisition, Project administration, Resources, Validation, Visualization, Writing – review & editing.
Funding
The author(s) declare that no financial support was received for the research, authorship, and/or publication of this article.
Acknowledgments
This research was under a major ICSSR project (File No. 02/69/2021-22/ICSSR/MJ/RP) and minor project (Ref. No./IoE/2024-25/12/FRP). We would like to thank SPM college and Ratan Tata Library for providing peaceful environment and necessary infrastructure. We also thank the reviewers for their comments which contributed in improving the quality of the research paper.
Conflict of interest
The authors declare that the research was conducted in the absence of any commercial or financial relationships that could be construed as a potential conflict of interest.
Publisher’s note
All claims expressed in this article are solely those of the authors and do not necessarily represent those of their affiliated organizations, or those of the publisher, the editors and the reviewers. Any product that may be evaluated in this article, or claim that may be made by its manufacturer, is not guaranteed or endorsed by the publisher.
Supplementary material
The Supplementary material for this article can be found online at: https://www.frontiersin.org/articles/10.3389/fclim.2024.1348132/full#supplementary-material
References
Abbas, A., Ullah, S., Ullah, W., Zhao, C., Karim, A., Waseem, M., et al. (2023). Characteristics of winter precipitation over Pakistan and possible causes during 1981–2018. Water 15:2420. doi: 10.3390/w15132420
Arkin, H., and Colton, R. R. (1951). Tables for statisticians. New York, NY: Barnes and Noble Books.
Banerjee, A., Chen, R., Meadows, M. E., Sengupta, D., Pathak, S., Xia, Z., et al. (2021). Tracking 21st century climate dynamics of the Third Pole: An analysis of topo-climate impacts on snow cover in the central Himalaya using Google Earth Engine. Int. J. Appl. Earth Observ. Geoinformat. 3:102490. doi: 10.1016/j.jag.2021.102490
Banerjee, A., Chen, R., Meadows, M. E., Singh, R. B., Mal, S., and Sengupta, D. (2020). An Analysis of Long-Term Rainfall Trends and Variability in the Uttarakhand Himalaya Using Google Earth Engine. Remote Sens. 12:709. doi: 10.3390/rs12040709
Banerjee, A., Kang, S., Meadows, M. E., Xia, Z., Sengupta, D., and Kumar, V. (2023). Quantifying climate variability and regional anthropogenic influence on vegetation dynamics in northwest India. Environ Res. 1:116541. doi: 10.1016/j.envres.2023.116541
Banerjee, A., Kang, S., Moazzam, M. F. U., and Meadows, M. E. (2024). Climate dynamics and the effect of topography on snow cover variation in the Indus-Ganges-Brahmaputra river basins. Atmospheric Res. 309:107571. doi: 10.1016/j.atmosres.2024.107571
Barnett, T. P., Adam, J. C., and Lettenmaier, D. P. (2005). Potential impacts of a warming climate on water availability in snow-dominated regions. Nature 438, 303–309. doi: 10.1038/nature04141
Beniston, M. (2003). Climatic change in mountain regions: a review of possible impacts. Clim. Chang. 59, 5–31. doi: 10.1023/A:1024458411589
Beniston, M. (2005). “The risks associated with climatic change in mountain regions” in Global change in mountain regions. An overview of current knowledge. eds. U. M. Huber, H. K. M. Bugmann, and M. A. Reasoner (Dordrecht: Springer), 511–519.
Beniston, M., and Stoffel, M. (2014). Assessing the impacts of climatic change on mountain water resources. Sci. Total Environ. 493, 1129–1137. doi: 10.1016/j.scitotenv.2013.11.122
Cannone, N., Sgorbati, S., and Guglielmin, M. (2007). Unexpected impacts of climate change on alpine vegetation. Front. Ecol. Environ. 5, 360–364. doi: 10.1890/1540-9295(2007)5[360:UIOCCO]2.0.CO;2
Dollan, I. J., Maina, F. Z., Kumar, S. V., Efthymios, I., Nikolopoulos, D., and Maggioni, V. (2024). An assessment of gridded precipitation products over High Mountain Asia. J. Hydrol. Reg. 52:101675. doi: 10.1016/j.ejrh.2024.101675
Du, H., Tan, M. L., Zhang, F., Chun, K. P., Li, L., and Kabir, M. H. (2024). Evaluating the effectiveness of CHIRPS data for hydroclimatic studies. Theor. Appl. Climatol. 155, 1519–1539. doi: 10.1007/s00704-023-04721-9
Duan, W., Bin, H., Sahu, N., Pingping, L., Daniel, N., Maochuan, H., et al. (2017). Spatiotemporal variability of Hokkaido's seasonal precipitation in recent decades and connection to water vapor flux. Int. J. Climatol. 37, 3660–3673. doi: 10.1002/joc.4946
Duhan, D., and Pandey, A. (2013). Statistical analysis of long term spatial and temporal trends of precipitation during 1901-2002 at Madhya Pradesh, India. Atmos. Res. 122, 136–149. doi: 10.1016/j.atmosres.2012.10.010
Dullinger, S., Gattringer, A., Thuiller, W., Moser, D., Zimmermann, N. E., Guisan, A., et al. (2012). Extinction debt of high-mountain plants under twenty-first-century climate change. Nat. Clim. Chang. 2, 619–622. doi: 10.1038/nclimate1514
Easterling, D. R., Gerald, A. M., Camille, P., Changnon, S. A., Karl, T. R., and Mearns, L. O. (2000). Climate extremes: observations, modeling, and impacts. Science 289, 2068–2074. doi: 10.1126/science.289.5487.2068
Gilbert, R. O. (1987). Statistical methods for environmental pollution monitoring. New York: Van Nostrand Reinhold.
Goyal, M. K., Jain, S., and Kumar, V. (2018). Climate change over Himalaya: a review. J. Earth Sci. Clim. Change 8:429. doi: 10.4172/2157-7617.1000429
Hugo, B., Jessop, A. M., and Mareschal, J.-C. (1992). Ground temperature histories in eastern and Central Canada from geothermal measurements: evidence of climatic change. Glob. Planet. Chang. 6, 167–183. doi: 10.1016/0921-8181(92)90033-7
Hussain, A., Hussain, I., Ali, S., Ullah, W., Khan, F., Ullah, S., et al. (2023). Spatiotemporal temperature trends over homogenous climatic regions of Pakistan during 1961–2017. Theor. Appl. Climatol. 153, 397–415. doi: 10.1007/s00704-023-04484-3
IMD (2022). Statement on Climate for the State of Himachal Pradesh. O/o climate research and services. IMD Pune 411:5.
Immerzeel, W. W., Lutz, A. F., Andrade, M., Bahl, A., Biemans, H., Bolch, T., et al. (2020). Importance and vulnerability of the world's water towers. Nature. 577, 364–369. doi: 10.1038/s41586-019-1822-y
IPCC (2007). “Climate change 2007: synthesis report. Contribution of working groups I, II and III to the fourth assessment report of the intergovernmental panel on climate change” in Core writing team. eds. R. K. Pachauri and A. Reisinger (Geneva: IPCC), 104.
IPCC (2013). “Climate change 2013: The physical science basis” in Working Group I Contribution to the Fifth Assessment Report of the Intergovernmental Panel on Climate Change. ed. T. F. Stocker (Cambridge, MA: Cambridge University Press), 1535.
IPCC (2018). Global warming of 1.5°C: An intergovernmental panel on climate change special report (summary for policymakers). Geneva, Switzerland: World Meteorological Organization, 32.
IPCC (2021). “Climate change 2021: The physical science basis” in Contribution of working group I to the sixth assessment report of the intergovernmental panel on climate change. eds. D. Masson, et al. (Cambridge: Cambridge University Press).
Joshi, V., and Negi, G. C. S. (1995). Analysis of long-term weather data from Garhwal Himalaya. ENVIS Bulletin Himalayan Ecol. 3:63.
Khan, I., Waqas, T., Samiullah,, and Ullah, S. (2020). Precipitation variability and its trend detection for monitoring of drought hazard in northern mountainous region of Pakistan. Arab. J. Geosci. 13:698. doi: 10.1007/s12517-020-05700-4
Kim, K. Y., Haagenson, R., Kansara, P., Rajaram, H., and Lakshmi, V. (2024). Augmenting daily MODIS LST with AIRS surface temperature retrievals to estimate ground temperature and permafrost extent in High Mountain Asia. Remote Sens. Environ. 305:114075. doi: 10.1016/j.rse.2024.114075
Kumar, P., Husain, A., Singh, R. B., and Kumar, M. (2018). Impact of land cover change on land surface temperature: a case study of Spiti Valley. J. Mt. Sci. 15, 1658–1670. doi: 10.1007/s11629-018-4902-9
Kumaraswamy, K. (2022). Precipitation trend analysis of India - a climate change study. Indian J. Sci. Technol. 15, 351–356. doi: 10.17485/IJST/v15i8.2040
Liu, X., and Chen, B. (2000). Climate warming in the Tibetan plateau during recent decades. Int. J. Climatol. 20, 1729–1742. doi: 10.1002/1097-0088(20001130)20:14<1729::AID-JOC556>3.0.CO;2-Y
Mistry, M. N. (2019). A high-resolution global gridded historical dataset of climate extreme indices. Data 4:41. doi: 10.3390/data4010041
Morak, S., Hegerl, G. C., and Christidis, N. (2013). Detectable changes in the frequency of temperature extremes. J. Clim. 26, 1561–1574. doi: 10.1175/JCLI-D-11-00678.1
Negi, V. S., Maikhuri, R. K., Pharswan, D., Thakur, S., and Dhyani, P. P. (2017). Climate change impact in the Western Himalaya: people’s perception and adaptive strategies. J. Mt. Sci. 14, 403–416. doi: 10.1007/s11629-015-3814-1
Panda, A., and Sahu, N. (2019). Trend analysis of seasonal rainfall and temperature pattern in Kalahandi, Bolangir and Koraput districts of Odisha, India. Atmos Sci Lett. 20:e932. doi: 10.1002/asl.932
Pratibha, M., Ojha, C. S. P., and Kumar, A. (2017). Assessment of climate change over Lahaul-Spiti, Himachal Pradesh, India. J. Earth Sci. Clim. Change 8:386. doi: 10.4172/2157-7617.1000386
Rebi, A., Hussain, A., Hussain, I., Cao, J., Ullah, W., Abbas, H., et al. (2023). Spatiotemporal precipitation trends and associated large-scale teleconnections in northern Pakistan. Atmos. 14:871. doi: 10.3390/atmos14050871
Sen, P. K. (1968). Estimates of the regression coefficient based on Kendall’s tau. J. Am. Stat. Assoc. 63, 1379–1389.
Shekhar, M., Chand, H., Kumar, S., Srinivasan, K., and Ganju, A. (2010). Climate-change studies in the western Himalaya. Ann. Glaciol. 51, 105–112. doi: 10.3189/172756410791386508
Shen, L., Zhang, Y., Ullah, S., Pepin, N., and Ma, Q. (2021). Changes in snow depth under elevation-dependent warming over the Tibetan plateau. Atmos. Sci. Lett. 22:1041. doi: 10.1002/asl.1041
Shrestha, A. B., Wake, C. P., Mayewski, P. A., and Dibb, J. E. (1999). Maximum temperature and trends in the Himalaya and its vicinity: an analysis based on temperature records from Nepal from period 1971–94. J. Clim. 12, 2775–2786. doi: 10.1175/1520-0442(1999)012<2775:MTTITH>2.0.CO;2
Singh, S. P., Singh, V., and Skutsch, M. (2010). Rapid warming in the Himalayas: ecosystem response and developmental options. Clim. Dev. 2, 221–232. doi: 10.3763/cdev.2010.0048
Soeder, D. J. (2021). “Fossil fuels and climate change” in Fracking and the environment (Cham: Springer).
Stackhouse, P. W.Jr., Zhang, T., Westberg, D., Barnett, A. J., Bristow, T., Macpherson, B., et al. (2018). POWER release 8 (with GIS applications) methodology (data parameters, sources, & validation) documentation date may 1, 2018 (all previous versions are obsolete) (data version 8.0.1). NASA. Available online at: https://power.larc.nasa.gov/documents/POWER_Data_v8_methodology.pdf
Tiwari, S., Kar, S. C., and Bhatla, R. (2016). Interannual variability of snow water equivalent (SWE) over Western Himalayas. Pure Appl. Geophys. 173, 1317–1335. doi: 10.1007/s00024-015-1163-1
Trajkovic, S., and Kolakovic, S. (2009). Wind-adjusted Turc equation for estimating reference evapotranspiration at humid European locations. Hydrol. Res. 40, 45–52. doi: 10.2166/nh.2009.002b
Ullah, S., You, Q., Ullah, W., Ali, A., Xie, W., and Xie, X. (2018). Observed changes in temperature extremes over China-Pakistan economic corridor during 1980–2016. Int. J. Climatol. 39:5894. doi: 10.1002/joc.5894
Weber, E. U. (2010). What shapes perceptions of climate change? WIREs. Climate Change 1, 332–342. doi: 10.1002/wcc.41
WMO (2021). State of the global climate 2021. Geneva: Publications Board World Meteorological Organization (WMO).
Xu, J., Grumbine, R. E., Shrestha, A., Eriksson, M., Yang, X., Wang, Y., et al. (2009). The melting Himalayas: cascading effects of climate change on water, biodiversity, and livelihoods. Conserv. Biol. 23, 520–530. doi: 10.1111/j.1523-1739.2009.01237.x
You, Q., Chen, D., Wu, F., Pepin, N., Cai, Z., Ahrens, B., et al. (2020). Elevation dependent warming over the Tibetan plateau: patterns, mechanisms and perspectives. Earth Sci. Rev. 210:103349. doi: 10.1016/j.earscirev.2020.103349
Keywords: Lahaul-Spiti, cold desert, precipitation, temperature, seasonal trends
Citation: Kumar P, Deka D, Husain MA, Kumar M, Choudhari P, Singh S, Kamil A and Banerjee A (2025) Trend analysis of precipitation and temperature in Lahaul-Spiti district, Himachal Pradesh, India. Front. Clim. 6:1348132. doi: 10.3389/fclim.2024.1348132
Edited by:
Jose Antonio Rodriguez Martin, Instituto Nacional de Investigación y Tecnología Agroalimentaria (INIA), SpainReviewed by:
Innocent Osoro Ngare, Kenyatta University, KenyaNewton Matandirotya, Nelson Mandela University, South Africa
Copyright © 2025 Kumar, Deka, Husain, Kumar, Choudhari, Singh, Kamil and Banerjee. This is an open-access article distributed under the terms of the Creative Commons Attribution License (CC BY). The use, distribution or reproduction in other forums is permitted, provided the original author(s) and the copyright owner(s) are credited and that the original publication in this journal is cited, in accordance with accepted academic practice. No use, distribution or reproduction is permitted which does not comply with these terms.
*Correspondence: Md. Arif Husain, bWRhcmlmMzkxQGdtYWlsLmNvbQ==
Md. Arif Husain, orcid.org/0000-0002-5043-8137