 Lauro Rossi1*
 Sylvain Ponserre2
 Eva Trasforini1
 Daria Ottonelli1
 Lorenzo Campo1
 Andrea Libertino1
 Eleonora Panizza1,3
 Roberto Rudari1
- 1International Center for Environmental Monitoring, CIMA Research Foundation, Savona, Italy
- 2Internal Displacement Monitoring Centre (IDMC), Humanitarian Hub Office, Geneva, Switzerland
- 3Department of Political and International Sciences (DISPI), University of Genoa, Genoa, Italy
This paper presents an enhanced probabilistic flood displacement risk assessment methodology. Several techniques have been proposed to estimate the number of people at risk of being displaced triggered due to climatic extremes. Among these methods, the probabilistic approach is promising for its quantitative nature and versatility at different scales. However, it has so far been limited to assessing loss of housing as the sole cause of displacement. The proposed methodology addresses this limitation by considering two additional elements beyond the traditional evaluation of housing loss: the likelihood of losing means of livelihood, directly included in the computation, and the likelihood of losing access to essential services, such as schools and health centers, provided as a factor to increase the propensity to displace. This new methodology is applied to assess flood disaster displacement risk in Fiji and Vanuatu, where climate change, coupled with the vulnerability of exposed assets, poses an existential threat to these Pacific islands, potentially leading to internal and cross-border population movements. Different climate scenarios were considered: current climate conditions (1979–2016 period), medium-term projected climate conditions (2016–2060), and long-term projected climate conditions (2061–2100). The average annual displacement increases in Fiji and Vanuatu by a factor of 3 and 4, respectively, in the projected long-term pessimistic climate scenario compared to current conditions. Depending on the country and climate change scenario, 20 to 40% of these displacements stem from loss of livelihoods as a dominant factor, highlighting the importance of considering this aspect in the vulnerability approach. The outcomes of these scenarios serve as the foundation for implementing displacement risk adaptation and management measures. This novel quantitative methodology holds significant potential for applications in larger domains and even globally.
1 Introduction
Disaster displacement is defined as the movement of people forced or obliged to leave their houses or places of habitual residence, either due to the consequences of an occurred disaster or as a preventive measure to avoid the impact of a forecasted event (The NANSEN Initiative, 2015). Displaced people might either cross international borders or, more commonly, stay within their own country. According to the United Nations High Commissioner for Refugees (UNHCR), internally displaced people accounted for 58% of all displaced people globally at the end of 2022 (UNHCR, 2022). Displacement durations vary, with short-term displacement over short distances being more common (Danish Refugee Council, 2023).
According to the latest data from the Global Internal Displacement Database (GIDD) by the Internal Displacement Monitoring Centre (IDMC), weather extremes such as floods and storms trigger the highest number of new displacements, approximately 22 million globally in 2021 alone (Internal Displacement Monitoring Centre, 2022). Floods have been a major driver of internal displacement over the years. From 2008 to 2022, more than 185.5 million new displacements were recorded worldwide because of floods, averaging around 13 million people being displaced each year due to floods (Internal Displacement Monitoring Centre, 2022). The Intergovernmental Panel on Climate Change (IPCC) also acknowledged in its latest report that climate change is exacerbating weather extremes, leading to more displacements and involuntary migrations in Africa, Asia, North America (high confidence), and Central and South America (medium confidence, Intergovernmental Panel on Climate Change, 2023). It is also reported that small island states in the Caribbean and South Pacific have been disproportionately affected relative to their small population size (high confidence, Intergovernmental Panel on Climate Change, 2023). The areas that face greater challenges are usually more exposed to environmental and climate hazards and are characterized by higher vulnerabilities and a lack of resilience.
Disaster displacement risk assessment models play a crucial role in identifying the nature and the extent of the risks associated with displacement. Quantitatively assessing displacement patterns and trends supports decision makers in designing effective intervention measures accordingly.
Various methods have been used to study the risk of displacement caused by disasters. One common approach is historical analysis, which involves examining past data on disasters and displacement in a systematic manner. By studying historical records, reports, and other data sources, researchers can identify patterns and trends in displacement over time. Important sources of data include the Global Internal Displacement Database (GIDD), the Displacement Tracking Matrix by the International Organization for Migration (IOM) (2022), and The Humanitarian Data Exchange by the Office for the Coordination of Humanitarian Affairs (OCHA, 2022). These sources provide information on the impact of disasters on people’s assets, the scale of displacement events, their duration, and their direction. For instance, data collected by the Internal Displacement Monitoring Centre (IDMC) revealed that the number of annual global displacements quadrupled between 1970 and 2013 due to more frequent extreme events (Ginnetti, 2015).
Recent research by Mester et al. (2023) has correlated estimates of human displacement from IDMC records, fatalities, and economic damages (recorded in the Emergency Events Database, EM-DAT) with flooded areas identified in the Global Flood Database (GFD). Similarly, Thalheimer and Oh (2023) have proposed an approach to assess recorded displacement events alongside weather and climate-related events in order to better utilize displacement data in real-time, especially at the local level, where extreme weather impacts occur.
While historical analysis offers valuable insights into patterns and trends, it has limitations. Firstly, it relies on available observed data, which are often limited in scope and time. Secondly, it overlooks contextual changes such as population dynamics and climate change. Therefore, while historical analysis is essential for assessing and predicting future disaster displacement risk, it benefits greatly from being complemented by forward-looking methods.
One straightforward approach involves analyzing a set of reference scenarios. These scenarios can be quantitative, using historical records, geospatial data, and mathematical models to estimate the number of people at risk of displacement or affected by the event. Alternatively, they can be qualitative, focusing on narrative descriptions and expert opinions. Semi-quantitative approaches combine quantitative data with qualitative information to assess the potential impact of a scenario.
Machine learning approaches, utilizing big data, have emerged for analyzing datasets from various sources. These methods sift through large volumes of data to generate estimates of displacement figures. For instance, Martin et al. (2021) developed the Dynamic Model of Displacement (DMD) using machine learning techniques to understand the factors influencing decision-making and the consequences of disaster displacement.
System dynamics modeling is also employed, particularly for slow-onset events. For instance, the Internal Displacement Monitoring Centre (IDMC) developed a system dynamics model to assess the impact of drought on pastoralist groups in Kenya. This model uses causal feedback structures to explain the relationship between the hazard and involuntary mobility within a system of feedback loops.
Other studies utilize agent-based modeling (ABM) to investigate the link between disasters and displacement. ABM replicates the behaviors and decisions of individual entities within the model to understand macro-level outcomes. For example, Kniveton et al. (2011) studied migration drivers in Burkina Faso, incorporating socioeconomic, demographic, political and environmental factors. Smith (2014) explored the effects of precipitation changes on economic resources, food production, and migration decisions in Tanzania. Abebe et al. (2019a,b) combined ABM with flood modeling to test flood risk reduction measures in Sint Marteen and observe residents’ responses to interventions and flood events. System dynamics and ABM are certainly fundamental tools to better comprehend the complex connection between the physical stressors and the social network stressed, but their complexity and overparameterization confine them to very specific case studies with limited possibility of being scaled up.
For sudden-onset hazards, such as floods, probabilistic risk assessment is one of the approaches currently used to understand displacement risk (Kam et al., 2021, 2023). This methodology aims to estimate the probability of occurrence of specific events in future scenarios, in this case the probability of being displaced due to sudden-onset disaster events. IDMC applied a probabilistic risk assessment methodology to estimate the number of people at risk of displacement in response to sudden-onset hazards. The model used a simplified approach based on a hazard threshold (i.e., a reference water depth value) on residential built-up areas, assuming that above that threshold the houses would be rendered uninhabitable. In this case, the average number of household members multiplied by the number of houses affected by the modeled events gave the estimated number of displaced individuals (Anzellini et al., 2017; Internal Displacement Monitoring Centre, 2019; Barrett et al., 2021).
Probabilistic analysis emerges as a promising method in the realm of disaster displacement risk assessment. Solidly based on the probability theory and on the IPCC risk definition as a function of hazard, exposure and vulnerability (Intergovernmental Panel on Climate Change, 2012), this approach offers the opportunity to transcend the mere analysis of past events and provides a more exhaustive analysis compared to the historical and scenario ones. However, its potential to assess displacement risk has not yet been fully exploited, since it is currently limited to the assessment of direct damage to residential buildings and does not include other relevant components (Internal Displacement Monitoring Centre, 2017).
Other elements need to be considered to better understand and assess the displacement risk associated with flood events.
People may need to leave their homes not only because their houses are damaged, but also because their livelihoods are affected, leading to food insecurity, or because they have limited access to essential services (Armah et al., 2010; Ahmad and Afzal, 2021; Mühlhofer et al., 2023; Vestby et al., 2024). Displacement can be seen as movement triggered by events that threaten safety, security or livelihoods. Floods often cause significant harm to crops, livestock, and other assets, resulting in loss of income, which eventually becomes an economic driver of displacement (Armah et al., 2010; Black et al., 2011; Ahmad and Afzal, 2021; Hossain et al., 2022). When floods repeatedly damage a community’s livelihoods, the likelihood of people being forced to move increases (Armah et al., 2010). Therefore, it is crucial to account for the vulnerability of crops, livestock and services when assessing disaster displacement risk, and this can help in designing and implementing effective policies.
In order to fill this research gap, the present paper proposes a new enhanced probabilistic approach that includes the likelihood of losing means of livelihood in different sectors and provides information on the likelihood of losing access to essential services, such as schools and health centers. This more comprehensive probabilistic model helps to better estimate the actual risk under different probable scenarios, including future climate scenarios, and thus supports a better design of intervention strategies and disaster risk reduction measures.
The model was implemented and tested in Fiji and Vanuatu, two Small Island Developing States (SIDSs) located in the Pacific Ocean. Since 2008, most of the displacements triggered by floods have been localized in Asia and the Pacific, with an estimated 129 million displacements. SIDSs bear the greatest displacement risk relative to their population size. Communities in the Pacific Islands face an existential threat due to the impact of climate change combined with the vulnerability of exposed infrastructure, housing and socioeconomic assets. In this delicate geographical context, we conducted a first attempt to estimate riverine flood displacement risk at the national and sub-national levels, under present and future climates, with the final goal of better supporting decision-making related to this hazard. The methodology may be further extended to coastal and pluvial flooding in future for a comprehensive flood risk assessment.
2 Methods
In this section, we outline all the components of the methodology. Sub-section 2.1 provides a general overview of the methodology, independent of the specific models and datasets used in the case study. Sub-section 2.2 details how the methodology was implemented in the context of Fiji and Vanuatu, showing the history of observed displacements, all models used in the hazard modeling chain, the creation of an exposure model from available local and global datasets, and the method chosen for risk computation tailored to this particular case.
2.1 A new paradigm for disaster displacement risk assessment
Risk analysis was performed through a modeling chain that encompasses hazard, exposure and vulnerability (Figure 1).
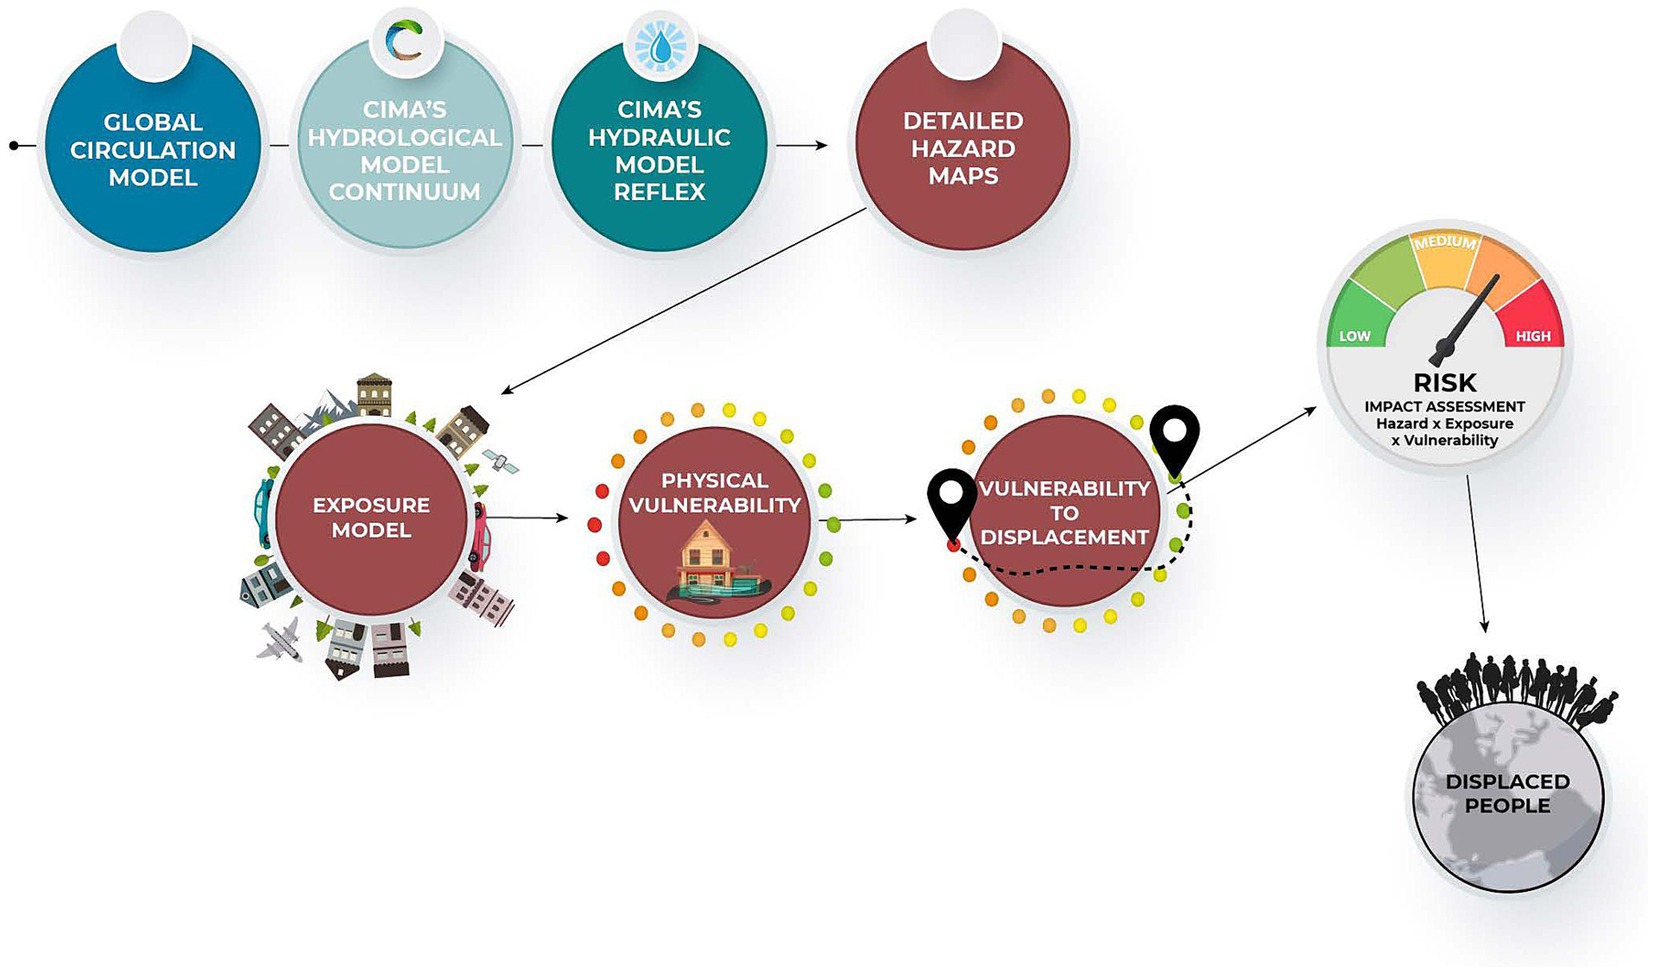
Figure 1. Representation of the modeling chain developed for flood displacement risk assessment.
Hazard computation follows a consolidated path, based on a climate-hydrologic-inundation modeling chain (Ward et al., 2015; Arrighi et al., 2018; Dottori et al., 2021). Climate drivers are extracted from global or regional climate models (either re-analysis or future projections) and bias is corrected before these drivers feed the hydrological model that converts the climate signal into discharge, which is the dominant variable determining flood conditions. Extreme value statistics allows the characterization of these discharges in terms of frequency, often expressed through the concept of the return period. These discharge quantiles are used as a boundary condition for inundation models that compute the flood hazard maps in terms of extent and related maximum water depth at each location in the flood plain. Such results stand as the basis of hazard characterization for risk computations.
The exposed elements (the second element of the risk equation) are generally characterized by people, infrastructure, housing, production capacities and other tangible human assets located in hazard-prone areas (UNGA, 2016). The methodology requires that assets (e.g., buildings, crop fields) should be characterized in terms of physical vulnerability to flood.
The third element of the risk equation is vulnerability. According to the UN terminology (UNGA, 2016), vulnerability corresponds to the conditions determined by physical, social, economic and environmental factors or processes which increase the susceptibility of an individual, a community, assets or systems to the impacts of hazards. In flood risk analysis, the physical factor is usually described by stage-damage functions (Romali et al., 2015), which are functional relationships relating percent damage to flood water depth, while the socioeconomic dimension is often described by indices capturing characteristics such as income level, education, gender and other factors that can affect the vulnerability of people and assets to a possible hazard.
In the context of disaster displacement risk, the concept of vulnerability is complex and depends on several physical and social factors. Although academic research exists in this direction (Přívara and Přívarová, 2019), significant simplifications have been applied in quantitative models that consider loss of housing as the sole factor determining displacement as a consequence of a fast-onset disaster. In addition, the criterion for deeming a house uninhabitable currently relies solely on a flood-depth threshold, without considering the physical vulnerability of the building.
The proposed methodology refines and expands this concept by simultaneously taking into account two different elements that may trigger displacements: direct impact on houses; direct impact on livelihoods, namely damage to croplands, grazing lands, shops, industries and services. It also involves a third element that may increase the susceptibility to forced movement: direct impact on critical facilities and services, such as health centers and education facilities. Although still based on direct physical damage estimation of these three components, social vulnerability factors are indirectly considered. Loss of livelihoods can be associated with a state of unemployment, even temporary, since this is recognized as a key theme in the literature on social vulnerability (Li et al., 2023). Access to education and health services, which are other social vulnerability factors, is also quantified, as additional information. In line with this, the World Health Organization (2009) highlighted the strong connection between physical vulnerability and other vulnerability dimensions (social, economic, physical, environmental, institutional and cultural dimensions, as further described by Malgwi et al. (2020), Birkmann et al. (2013), and Mazzorana et al. (2014), pointing out that the disruption of physical elements directly affects social and economic activities within a society.
The proposed methodology includes advancements on several levels. The first improvement concerns the method employed to determine whether a house is deemed uninhabitable. Frequently, displacement triggers are calibrated based on hazard (i.e., water depth) thresholds, resulting in limited spatial differentiation (e.g., Kam et al., 2021, 2023). However, in reality, different types of buildings may respond very differently to flood events. While empirical calibration on specific events might ensure that overall figures align with observations distribution, this method cannot reproduce the spatial distribution of damage at the sub-domain level, because it does not account for spatial differences in house vulnerability. Moreover, this approach may yield a limited predictive capacity when applied to events with vastly different spatial patterns within the domain.
It is more appropriate to reason in terms of damage thresholds that might render houses uninhabitable. This concept is not only closer to reality but also allows the differentiation of impacts as a function of diverse house typologies. The proposed methodology employs a complete physical vulnerability model to compute the impact on housing. The vulnerability of an asset to flooding is commonly characterized by stage-damage curves (also known as vulnerability curves or damage curves) that show the relationship between hazard intensity (e.g., flood depth or velocity) and the degree of impact (e.g., damage ratio, and relative or absolute monetary loss). These curves are specific for each type of exposed element. The matching between the curve and the element is made according to different features, such as building use or main construction typology, depending on the vulnerability library used. By way of example, some flood vulnerability libraries for buildings differentiate the curves by occupancy type and number of floors, as proposed in HAZUS (Federal Emergency Management Agency, 2010), by occupancy and country (Huizinga, 2007; Huizinga et al., 2017), or by construction typologies (Cardona et al., 2012). A threshold on the damage ratio of the curve is assigned for the displacement evaluation. It is assumed that beyond this threshold the damaged structure is unable to provide its function (e.g., hosting people for residential buildings, providing jobs for commercial buildings, guaranteeing health or education services), thus causing the forced mobility of people. In this study, we adopted the European macroseismic scale (EMS-98, Grünthal, 1998) as a reference to describe what this threshold represents. The scale was developed in the field of seismic risk, and is referred to here for its description of damage classes, regardless of the hazard under consideration. The threshold value was mapped to the D3 EMS-98 damage class, which corresponds to substantial to heavy damage; such a qualitative description of the damage suggests a lack of possibility to inhabit or use the building for its own purposes. In the seismic field, some studies connect damage classes to building loss ratio (e.g., Lagomarsino and Giovinazzi, 2006; Tyagunov et al., 2006), class D3 being representative of a damage ratio between 0.4 and 0.6.
The second improvement, with respect to traditional models, is about assessing the direct impact of a disaster on people’s livelihoods. There are several studies that recognize loss of livelihoods as one of the major economic factors for displacement, especially in societies strongly dependent on certain sectors such as agriculture (e.g., Armah et al., 2010; Black et al., 2011), and this is more relevant when particular socioeconomic conditions are considered (e.g., individuals with low incomes who do not own homes). Loss of livelihoods is cited frequently as cause of displacement in the DTM as well as in the IDMC database. In implementing this piece of the methodology, two contrasting factors need to be explicitly accounted for: on the one hand only a proportion of the people would decide to displace if their means of livelihood became untenable, thus reducing the number of displacements to be considered; on the other hand, if the person losing his/her means of livelihood is the sole breadwinner within a household, all the people dependent on this person might be affected by the decision to displace, and therefore household composition should be carefully analyzed to gain reasonable estimates. Accounting for this additional factor provides a more comprehensive understanding of disaster-related impacts that may shape people’s decisions to move. Since people react differently to loss of livelihood, and are influenced by factors such as the availability of alternative employment opportunities, it is unrealistic to expect that 100% of those experiencing job loss would relocate. Accordingly, the methodology explicitly includes a parameter that represents the proportion of individuals who would relocate after losing their jobs due to a flood event. In the absence of literature, this parameter is assumed to be 35%.
Another consideration must be made regarding loss of livelihood. When the primary breadwinner of a household loses his/her means of livelihood and decides to move, the whole family follows. To address this, we consider the “dependency ratio” data, which are usually available from the national census, to estimate the average household composition. The dependency ratio is a measure of the number of dependents aged 0 to 14 plus those over the age of 65, compared with the total population aged between 15 to 64. This approach allows us to account for individuals such as children and elderly people who rely on employed people and are likely to follow them in their move.
The third improvement is about addressing indirect impacts, such as the prolonged absence of essential services. People’s decisions to stay or move are often influenced by access to critical facilities, public infrastructures and services, including education and health facilities. This introduces an additional factor that increases people’s vulnerability and, consequently, the likelihood of displacement.
Collectively, these three elements contribute to a more accurate estimate of the potential displacement of individuals due to impacts of floods.
The implementation of the methodology imposes strong requirements in the preparation of the exposure model in a manner suitable for risk analysis. It is crucial to characterize the spatial distribution of the population in relation to different services and functions. Specifically: (1) to determine the number of people displaced due to house damage, it is essential to know the spatial distribution of the residential population across the housing sector; (2) to determine the number of individuals displaced as a result of livelihood loss, it is necessary to have information on the spatial distribution of employees within each specific sector (e.g., agriculture, industry, etc.); this aspect includes knowing the spatial locations of various workplaces and the corresponding number of employees associated with each; (3) to determine the group of people who lose access to basic services, potentially heightening their inclination to migrate, it is necessary to identify the locations of these services and the number and location of people relying on each of them. While points (1) and (2) are factored into the risk computation, estimates on a lack of access to basic services (point 3) are provided as additional information.
Since the methodology envisages that an individual’s mobility may be triggered by the loss of housing, livelihood, or both, that same person might be counted twice, i.e., being displaced due to the loss of both a house and a livelihood. Hence, a procedure to prevent potential double counting was implemented by unequivocally associating each person with his/her home and workplace, enabling the identification of individuals who simultaneously lose both housing and livelihood. The population density is computed for each administrative level and is used to determine the residence capacity of each building. The process of associating each person with his/her home and workplace relies on the minimum geometric distance between the two, and is executed iteratively in consecutive steps. Based on the percentages proposed at a national level, the workers in the different sectors and the students are quantified for each home at the beginning of the procedure. After this, starting randomly with a workplace (e.g., a factory), employees are allocated to the residences closest to their workplace, initially within a specified radius (e.g., 1 km). If the residence capacity is reached within the specified radius and not all the workers are accommodated, the radius is progressively expanded (e.g., first to 2 km and then to 3 km). This iterative procedure continues until all the workers are successfully assigned to their respective residence. This association ensures that workers who experience flooding at both their place of residence and workplace during a single event are identified and counted only once. We provide an explanation of the application of this procedure in the Supplementary material.
Analogous to the average annual loss, the loss exceedance probability curve (also referred to as “risk curve,” Arrighi et al., 2018), and probable maximum loss curve commonly used in catastrophe risk modeling (United Nations Office for Disaster Risk Reduction, 2015; Rossi et al., 2023), we introduced similar risk metrics for displacement: average annual displacement (AAD), displacement exceedance probability curve and probable maximum displacement (PMD) curve.
Displacements are computed for each hazard map scenario and a displacement exceedance probability curve – a curve describing the probability to exceed a certain number of displaced people in 1 year – is built for each administrative level. The exceedance probability curve is constructed by plotting the frequency of each hazard map versus the number of displacements originated by those hazard maps. The integral under the displacement exceedance probability curve represents the average annual displacement, AAD, as described by Equation 1.
Where EP = P (X > x) is the probability to exceed the number of displacements x.
This is the expected number of displacements per year, averaged over many years. A curve similar to the displacement exceedance probability curve, where frequency is expressed in terms of return period (RP) instead of probability, is the probable maximum displacement (PMD) curve. The PMD for different return periods can be defined as the expected number of displacements as a function of the return period, where the return period is the average interval time between two events equaling or exceeding that number of displacements. The PMD curve is constructed by plotting the number of displacements originated by each hazard map versus the return period for each hazard map. By depicting displacements as a function of return periods, the PMD curve has the capacity to better visualize the tail of the curve (very low frequencies and high return periods) when compared to the displacement exceedance probability curve, and therefore the PMD curve has been used in this paper to show the number of displacements during extreme conditions.
2.2 Applying the methodology to the case study of Fiji and Vanuatu
Fiji and Vanuatu are located to the east of Australia and north of New Zealand, and the two archipelagos are separated by approximately 1,000 kilometers. The climate of the two countries is generally categorized as oceanic tropical, with a dry season from May to October and a rainy season from November to April. The El Niño Southern Oscillation (ENSO) plays an important role across the region in different ways and has impacts on the livelihoods of Pacific Islands communities (Weir et al., 2021). In Fiji and Vanuatu, the ENSO can lead to prolonged rainfall and to an increase in the frequency and intensity of cyclones and other tropical storms (Kuleshov et al., 2020).
Fiji is one of the largest nations in the Pacific Islands region. The capital, Suva, on the island of Viti Levu, is home to about three-quarters of the population. More than 90% of the population, both rural and urban, lives in coastal areas, where most of the services, infrastructure and agricultural production are located. The economy is large and developed as a result of a significant natural resource base. Tourism also makes up a substantial part of the economy, as does agriculture (Internal Displacement Monitoring Centre, 2020).
Vanuatu consists of a chain of 82 volcanic islands, including 13 principal islands, extending 850 km from north to south. Vanuatu concentrates a large share of its population (about 36%) in the capital, Port Vila, in Shefa Province. About 80% of the population works in subsistence or small-scale agriculture. The economy is based primarily on the exploitation of natural resources such as copra, beef, timber, kava and coconut oil (Chen et al., 2015).
2.2.1 Disaster displacement in Fiji and Vanuatu: historical trends (2008–2022)
Empirical data are important elements to understand the magnitude, causes and triggers of displacement. Records of disaster-induced displacements worldwide have been compiled by the Internal Displacement Monitoring Centre since 2008 (Internal Displacement Monitoring Centre, 2022) through a rigorous process of research, data management, analysis and validation.
Disasters have triggered about 382,000 displacements in Fiji since IDMC began collecting data on the phenomenon in 2008. IDMC has detected 53 disaster displacement events (Internal Displacement Monitoring Centre, 2023). A large number of displacements in Fiji and Vanuatu have been triggered by weather-related events, which are classified according to the subtype of hazard: flood, storm, cyclone, avalanche, rogue wave. Storms and cyclones are the main triggers of displacement. However, when a cyclone has struck, it is impossible to discern from the records whether structures were damaged by inland flooding, storm surges, strong winds, or a combination of these factors. Table 1 reports data on internally displaced people, respectively, for Fiji and Vanuatu due to riverine flood from 2008 to 2022, as recorded by IDMC. Several events between 2008 and 2022, mainly associated with tropical depressions, generated widespread flooding in Fiji. The most relevant of these events happened in the Western Division of Fiji, where torrential rains caused by multiple tropical depressions in 2012 resulted in severe damage to schools, homes, businesses, agriculture, and infrastructure. In Vanuatu, only the 2014 flood that hit Efate Island has been recorded.1
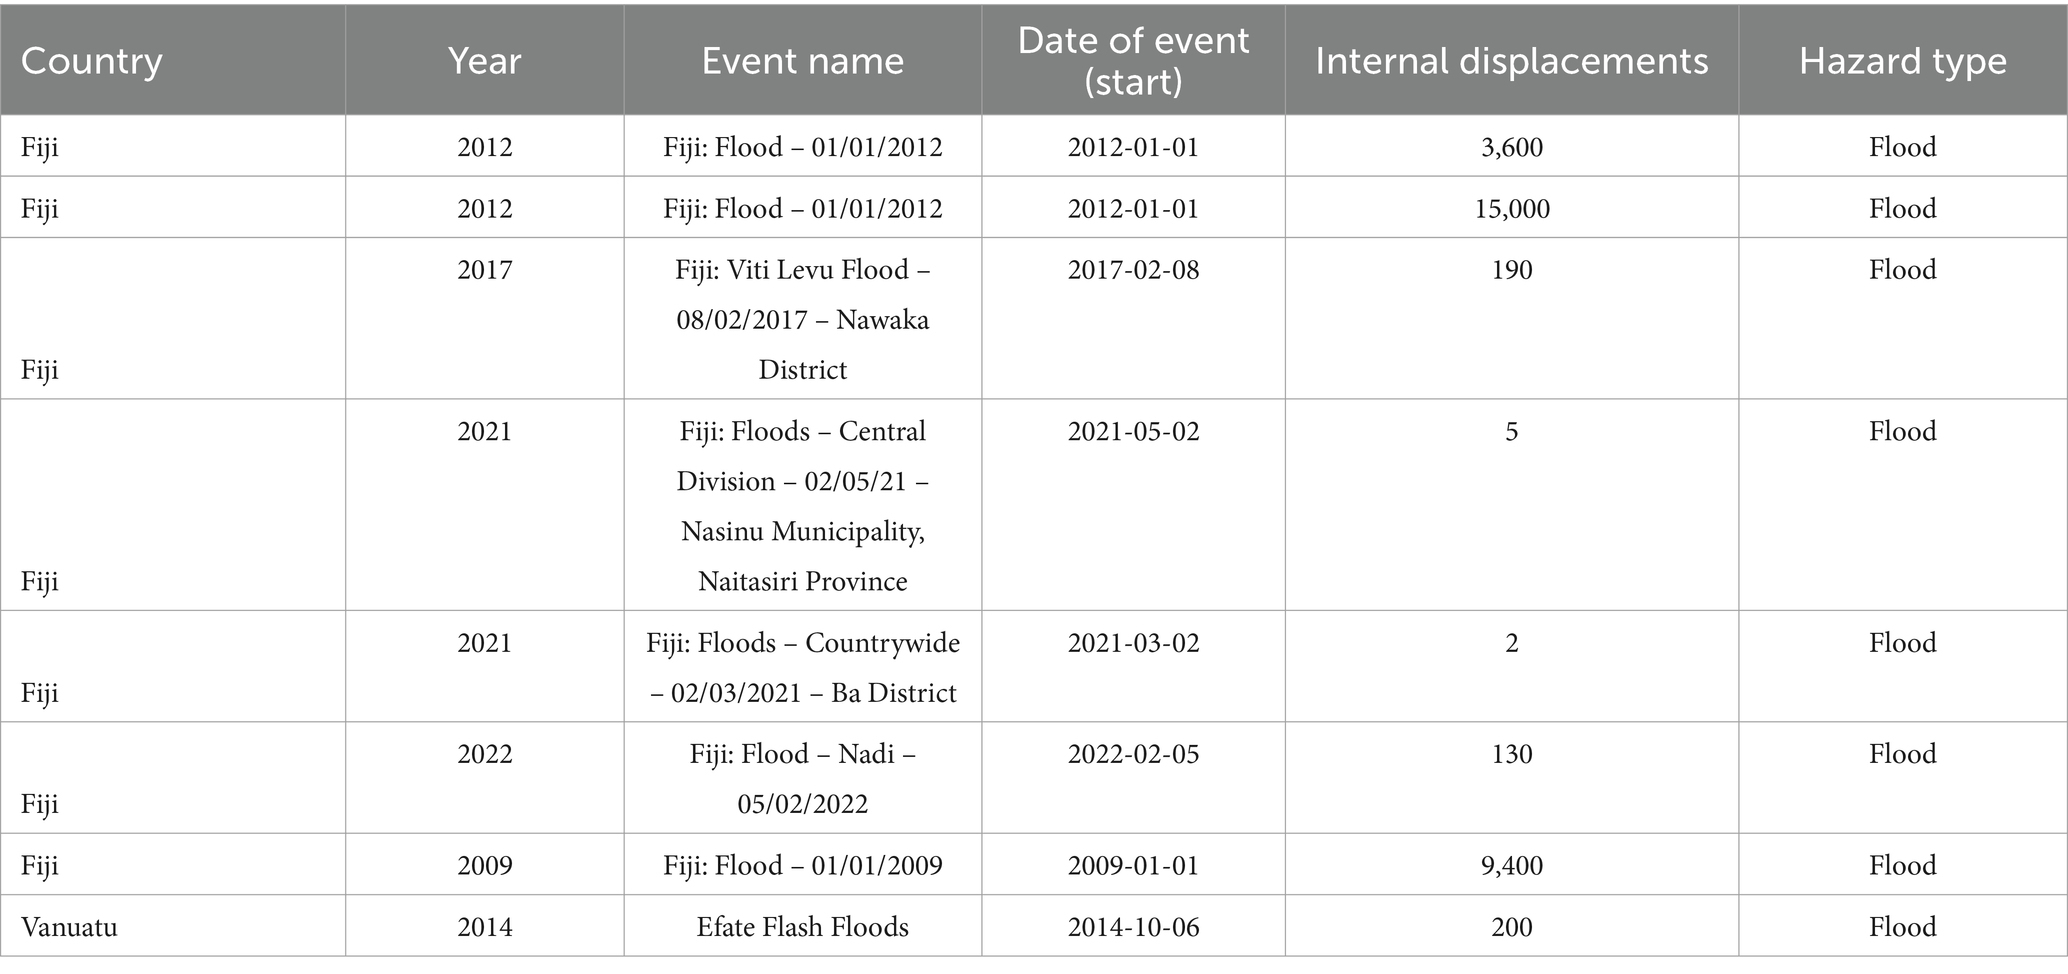
Table 1. Internally displaced people in Fiji and Vanuatu due to riverine flood from 2008 to 2022, according to the Internal Displacement Monitoring Centre (IDMC).
This dataset, although limited, serves as a basis for the comparison with our model results presented in Section 3. Moreover, additional IDMC datasets from the South-East Asia and Pacific region have been retrieved to broaden the scope of our comparison. These datasets are accessible in the Supplementary material.
2.2.2 Hazard modeling chain
As mentioned in Sub-section 2.1, hazard modeling was performed for both the current and projected climate conditions by using a full flood modeling chain, composed of three main steps: (1) climate models selection and bias correction; (2) the hydrological simulation for the estimation for the streamflow design values under different climate conditions; and (3) the flood mapping through the hydro-geomorphological model.
In more detail, the physically-based distributed hydrological model Continuum (Silvestro et al., 2013, 2021) was implemented separately for the two regions of interest. Continuum can reproduce the main hydrological processes, resolving both mass and energy balances at pixel scales. As main output, it provides time series of river discharge for each stream of the river network. The hydrological model was driven with the W5E5 (Lange, 2019) climate data of precipitation, air temperature, air humidity, wind velocity, and solar radiation, with 0.5° spatial resolution and daily temporal resolution to derive the streamflow time series in the present climate (historical period: 1979–2016). W5E5 is a merged dataset. It combines WFDE5 data (Weedon et al., 2014; Cucchi et al., 2020) over land with ERA5 data (Hersbach et al., 2020) over the ocean. The WFDE5 dataset (C3S, 2020) was generated using the WATCH Forcing Data (WFD) methodology applied to surface meteorological variables from the ERA5 reanalysis. Bias-adjusted monthly precipitation totals of WFDE5 result in more plausible global hydrological water balance components when analyzed in an uncalibrated hydrological model (WaterGAP) than with the use of raw ERA5 data for model forcing.
In addition, the W5E5 dataset was used for the bias adjustment of climate input data for the impact assessments carried out in phase 3b of the Inter-Sectoral Impact Model Intercomparison Project (ISIMIP3b dataset,2 0.5° spatial resolution and daily temporal resolution), therefore guaranteeing consistency between the present climate forcing and the projected climate forcing used in this study. The results of the ISIMIP3b project were used to drive the Continuum model in projected conditions. Five different General Circulation Models (GCM) for three Shared Socioeconomic Pathway (SSP)-Representative Concentration Pathway (RCP) scenarios (SSP1-RCP2.6, SSP3-RCP7.0 and SSP5-RCP8.5) provided an ensemble of 15 combinations of models and scenarios. The variability of trends in key climatic variables (e.g., temperature and precipitation) among the different models/scenarios is very large, and thus, to reach a compromise between a proper representation of this variability and the available computational resources for this study, a selection was made. The choice was guided by the intent of the study, which is to provide sensible bounds to the displacement figures under possible climate change scenarios. The uncertainty in climate projections varies in nature, and can be traced on one hand to the uncertainties brought by the specific numerical model used for the prediction, and on the other to our inability to guess what scenario of greenhouse gas emissions connected to a specific socioeconomic development pathway will materialize in future. From the risk assessment perspective, both sources of uncertainty should be explicitly considered, and therefore selection of the binding climate scenarios should be independent from the modeling suite and SSP considered. Since it was impossible to use all the ISIMIP combinations of GCM and SSP, due to computation limitations, we opted to select two climate scenarios that were representative of low (“optimistic”) and high (“pessimistic”) future emission conditions. We selected the two scenarios based on statistical criteria, employing percentile thresholds derived from the ensemble of temperature trajectories (precipitation trends were correlated with the trends in temperature for all the different models and SSPs). For each year of the future projection period (2017–2100), the 20th percentile and 80th percentile of the ensemble of average world temperature were computed, yielding two additional temperature trajectories produced as the 20th percentile and 80th percentile of the ensemble (for a further explanation, see Alfieri et al., 2023). Then, the most similar simulation among the model runs available was selected for each of the two percentiles. The selected simulations were SSP126/IPSL-CM6A-LR for 20th percentile - “optimistic” scenario - and SSP585/IPSL-CM6A-LR for 80th percentile - “pessimistic” scenario (Figure 2). It should be noted that even though they represent the state of the art in climate simulations, the global models of the ISIMIP3b suite can have poor representations of the terrain feature, especially when SIDSs are concerned. Specifically, the IPSL-CM6A-LR GCM represents only the main island in Fiji (Viti Levu) as land. Despite these approximations, no other option, such as regional downscaling of such models, was available at the time of the study. The Continuum model forced with these two selected GCM simulations generated two discharge time series from 2016 to 2100, and this timespan was split into two parts so as to consider two different reference periods: medium-term projected climate conditions (2016–2060), and long-term projected climate conditions (2061–2100). The Continuum model results, analyzed with a statistical approach, were then used to identify the design discharge for the return periods of 2, 5, 10, 20, 25, 50, 100, 200 and 250 years for all the streams in all scenarios considered (i.e., current climate conditions, plus four projected climate scenarios: medium-term “optimistic” and long-term “optimistic,” medium-term “pessimistic” and long-term “pessimistic”). Flood protection measures especially close to urban areas play a dominant role in determining impact and risk figures. As information on the level of protection is rarely available, assumptions are made on the shortest return period to be considered. Since flood defenses are related to the values to be defended and to the spending capacity of a country, GDP has often been considered as a good proxy for flood defenses at national level (see e.g., Rudari et al., 2015). In this study, we assumed that rivers in Fiji are defended up to a 5-year event, i.e., events that have less than a 5-year return period cause no damage to assets, while in Vanuatu even a 2-year event would cause some losses. This difference can be justified by a higher GDP per capita in Fiji (World Bank, 2022) and a consequent propensity to flood protection investment (Corugedo et al., 2023).
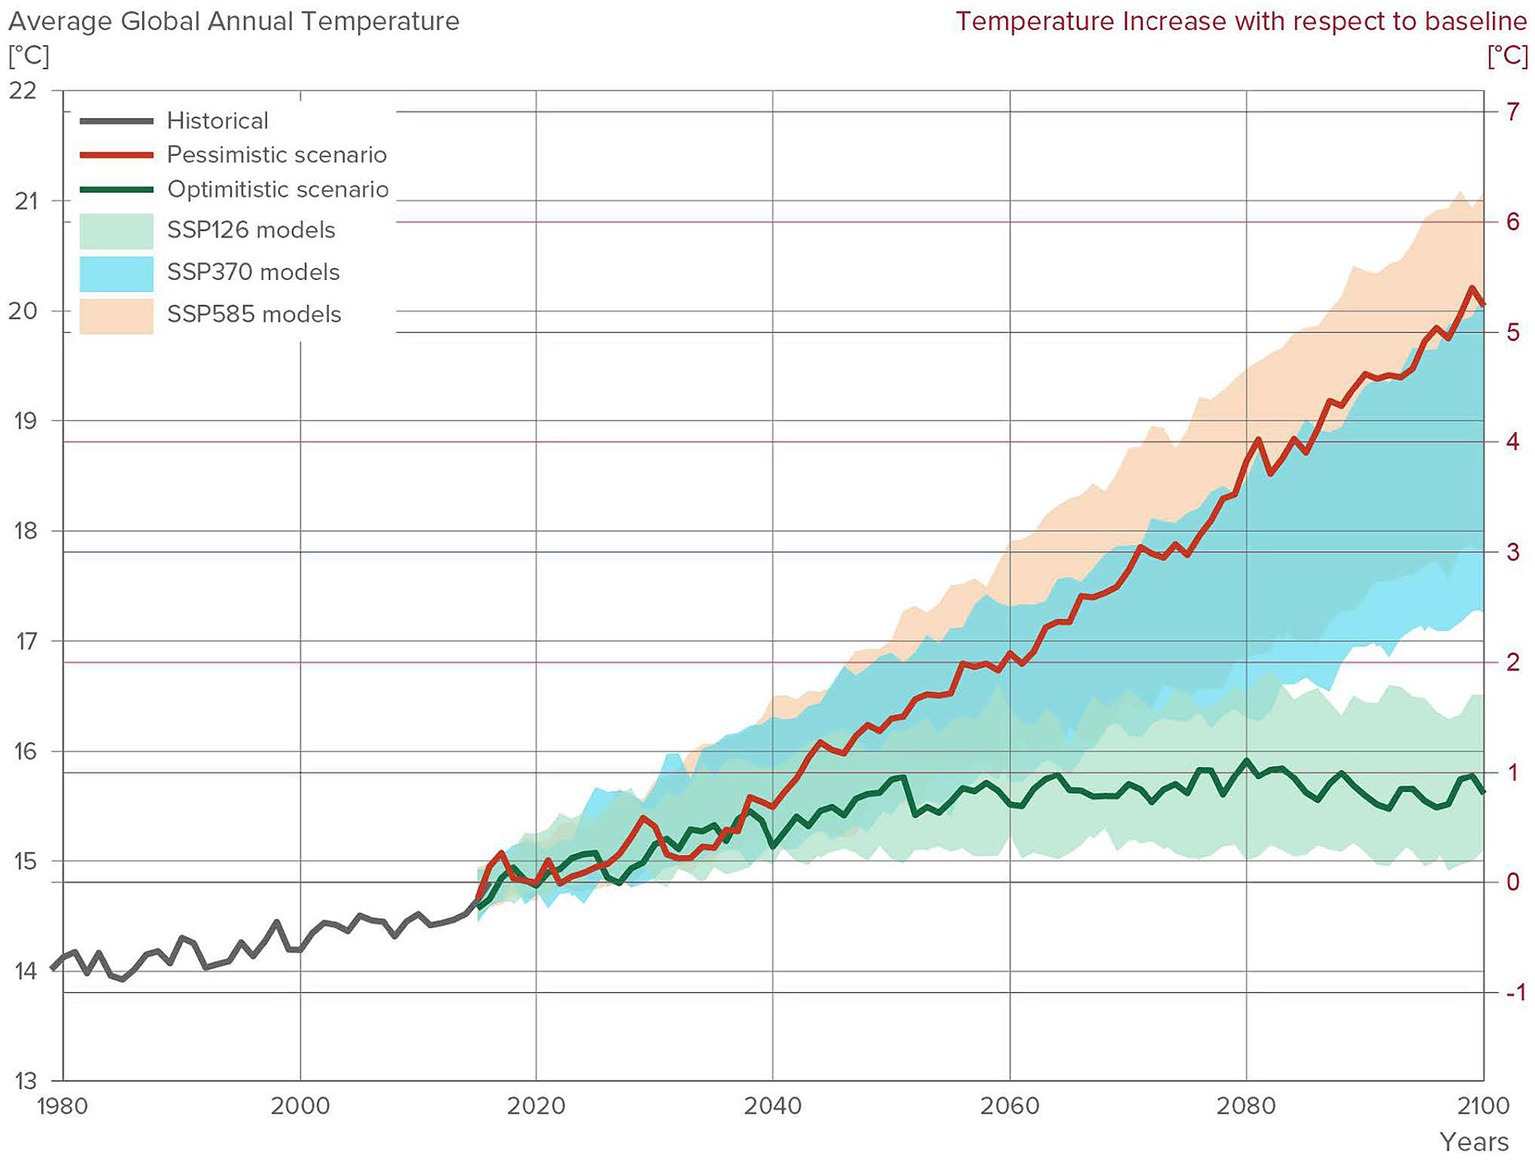
Figure 2. Model projections of future climate scenarios from ISIMIP3b. The green and red lines represent the optimistic and pessimistic scenarios (respectively SSP126/IPSL-CM6A-LR and SSP585/IPSL-CM6A-LR) used in this work.
Long-term simulations were analyzed statistically to extract annual discharge maxima and to estimate extreme value distributions in all representative river sections along the simulated river network for both the historical and future climates. We tested various analytical probability distribution functions on each set of discharge peaks, including the Generalized Extreme Value (GEV), Log-normal, Gamma, Weibull, Gumbel, Normal, Exponential, Generalized Pareto, and Log-Pearson. For each fitted probability distribution we calculated several quantiles, which presented finer refinement around both tails of the distribution, and we compared these with the empirical ones. The probability distribution with the minimum root mean square error between the empirical and the fitted quantiles was then selected.
It should be noted that the reliability of the results substantially diminishes as the return period increases, since the analysis is based on only around 40 years of data. Lastly, discharge values were used to feed the inundation model REFLEX (Arcorace et al., 2019) that performs a hydro-geomorphological computation to provide hazard maps for each return period, i.e., maps of flood depth and extent over large areas for each return period. REFLEX was developed for a rapid identification of flooded areas of major rivers, and is an expansion of the Height Above the Nearest Drainage (HAND) approach (Nobre et al., 2011), designed as a reliable and slim tool able to provide rapid inundation mapping, constraining the possible geomorphological flood extent with the available flood volume. The REFLEX model starts from an initial streams and basins delineation derived from a Digital Elevation Model (DEM). The Strahler method is then used to order each stream and corresponding sub-basin. Concerning floodplain delineation, the HAND methodology is adopted to derive the relative soil gravitational potentials from topography. A HAND map is created for each river order, starting from the lowest one. Lastly, flood extent and depth information are derived for each sub-basin sequentially merging the HAND maps, using an optimized flood water stage resulting from a water balance between the volume underlying the HAND maps and the flood water volume. The limitations on flood plains, where the grid-based watershed delineation is more delicate, were solved by implementing the D-infinity approach, in order to increase the level of dispersion of flow direction over flat areas, and developing a coastal expansion methodology able to attribute the pixels falling outside of the main watershed to the nearest, and most appropriate, basin.
Both the hydrological model Continuum and the inundation model REFLEX require a DEM as the base raster data for identifying the model grid and deriving the main hydrological features. The FABDEM (Hawker et al., 2022) with a spatial resolution of 1 arc-second (∼30 m) is considered one of the best suited global DEMs available for hydrological and hydraulic modeling, and was thus used for implementing the hazard modeling chain, for Fiji and Vanuatu separately.
As usual in hydrological modeling practice, the DEM was aggregated to a coarser spatial resolution (1 km) to drastically reduce the computational load of the simulations, while preserving a good level of detail in representing the main hydrological processes (see e.g., Aerts et al., 2022; Li et al., 2022 for discussion on result dependency on resolution in hydrologic models). For the inundation model, where a more detailed representation of the local morphology is required, the original DEM resolution (∼30 m) was maintained.
The estimate of the soil characteristics required by Continuum was derived from maps of soil fraction in sand and clay at 250-m spatial resolution obtained by the ISRIC SoilGrids (Hengl et al., 2017) maps combined with land cover information at 300-m resolution derived from the ESA-CCI Land Cover map v2 (European Space Agency, 2017). The same map was used to characterize vegetation cover, which plays a key role in modeling evapotranspiration.
2.2.3 Exposure and vulnerability evaluation
The exposure model for Fiji and Vanuatu considers people (residents, employees, and students), buildings (houses and workplaces), and agricultural areas, with the aim of describing the different population distributions introduced in Sub-section 2.1. To this end, various data sources were integrated: (i) statistical databases; (ii) available exposure models; (iii) global datasets on population distribution, settlement identification, and land use/land cover; and (iv) building footprints.
The primary statistical data source (i) considered for population distribution was the national census, which provides an official count of population, dwellings, and households. In Fiji, the most recent census of population and housing was conducted in 2017 (Fiji Bureau of Statistics, 2017). The country consists of 86 Tikinas (administrative level 3), which are aggregated into 15 Provinces (administrative level 2). These Provinces, in turn, are grouped into 4 Divisions (administrative level 1). In Vanuatu, the most recent census of population and housing was published in 2020 (Vanuatu National Statistics Office, 2020). Vanuatu is divided into 6 Provinces (administrative level 1) and 66 Area Councils (administrative level 2). Figure 3 illustrates the population distribution for Fiji and Vanuatu, respectively, at administrative levels 3 and 2.
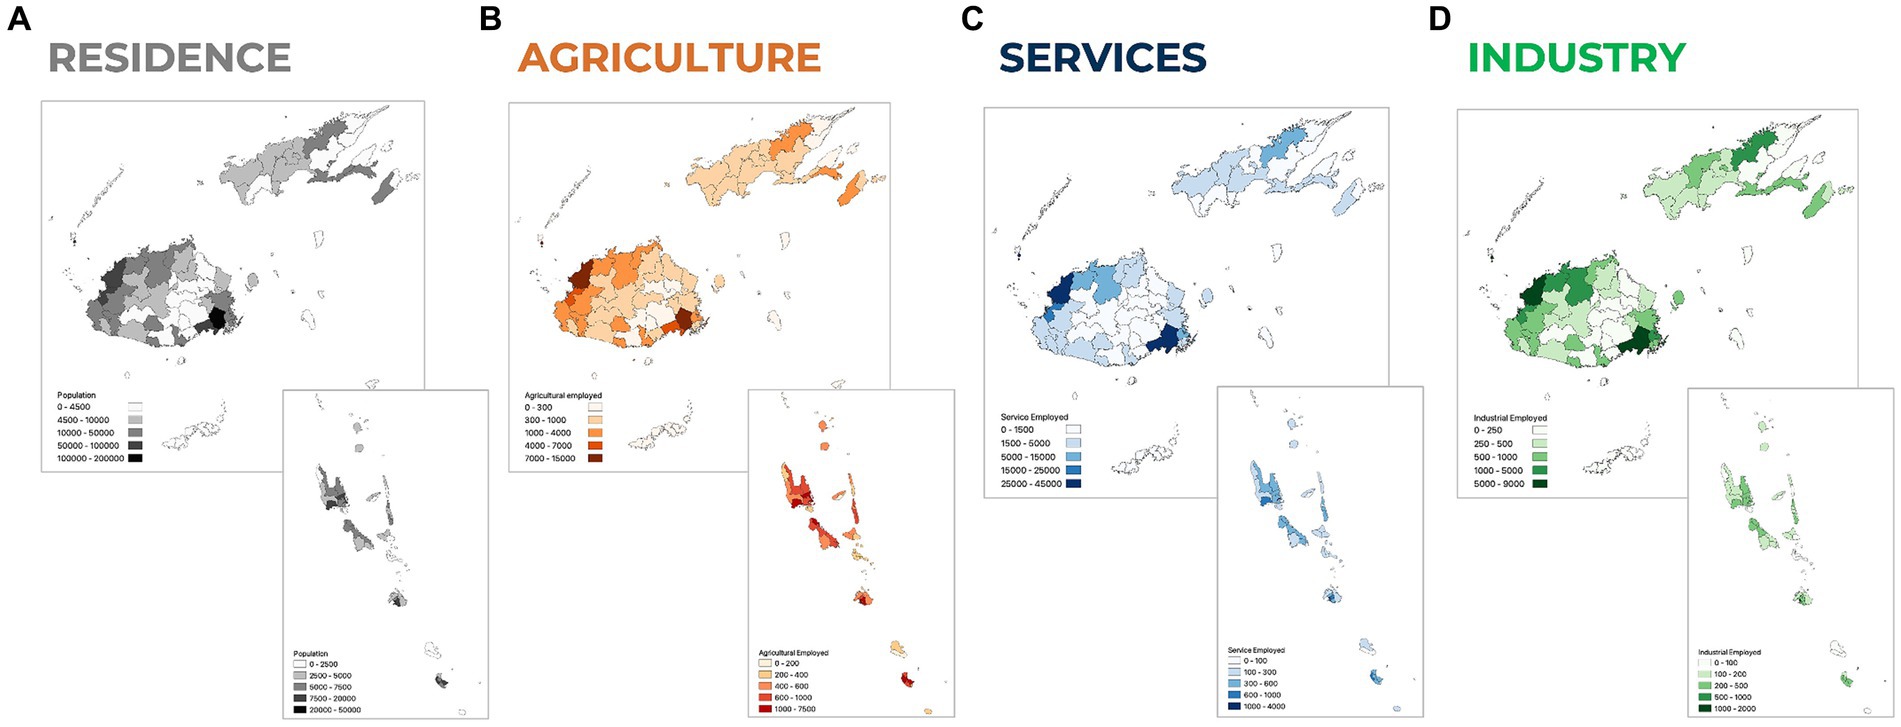
Figure 3. Residential population (A) and workers in agricultural, service and industrial sectors (B–D) at the administrative levels of reference for Fiji (admin 3) and Vanuatu (admin 2).
Furthermore, another statistical data source that was consulted and utilized for specific figures is the International Labour Organization (ILO) database (International Labour Organization, 2022). This database encompasses a comprehensive range of information related to the labor market, including data on employment by economic sector adopted in the study. The ILOSTAT entry page provides access to country-specific or subject-specific statistics, along with information on concepts and definitions. Considering these two primary sources, the relevant statistical information pertinent to this study was extracted (Table 2).
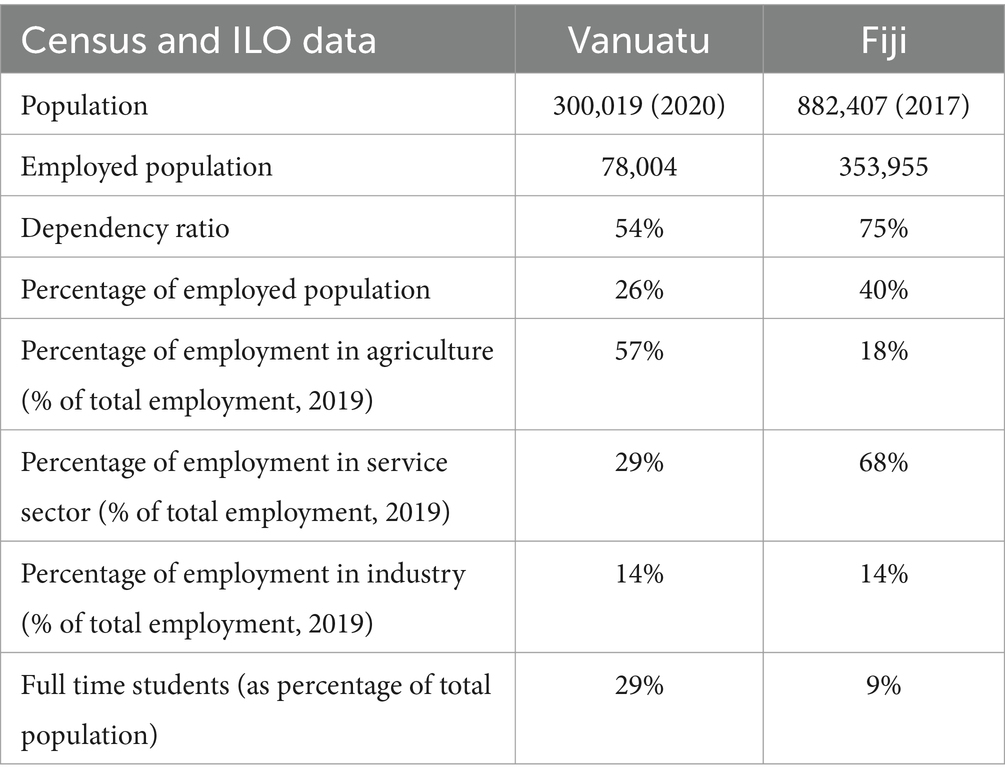
Table 2. Statistical information derived from census surveys and from the ILO database.
The existing exposure model (ii) from PCRAFI (Pacific Catastrophe Risk Assessment and Financing Initiative, 2015) Project was used to derive asset attributes. The PCRAFI model is a point vector layer comprising about 140,000 elements, with attributes to describe the occupancy type, the number and type of buildings, the number of stories, the floor area and the economic value of each asset. The occupancy types considered in this model are industrial, residential, commercial, infrastructure, public and other. In this case study, commercial, infrastructure and public have been merged to describe the services category (Figure 4).
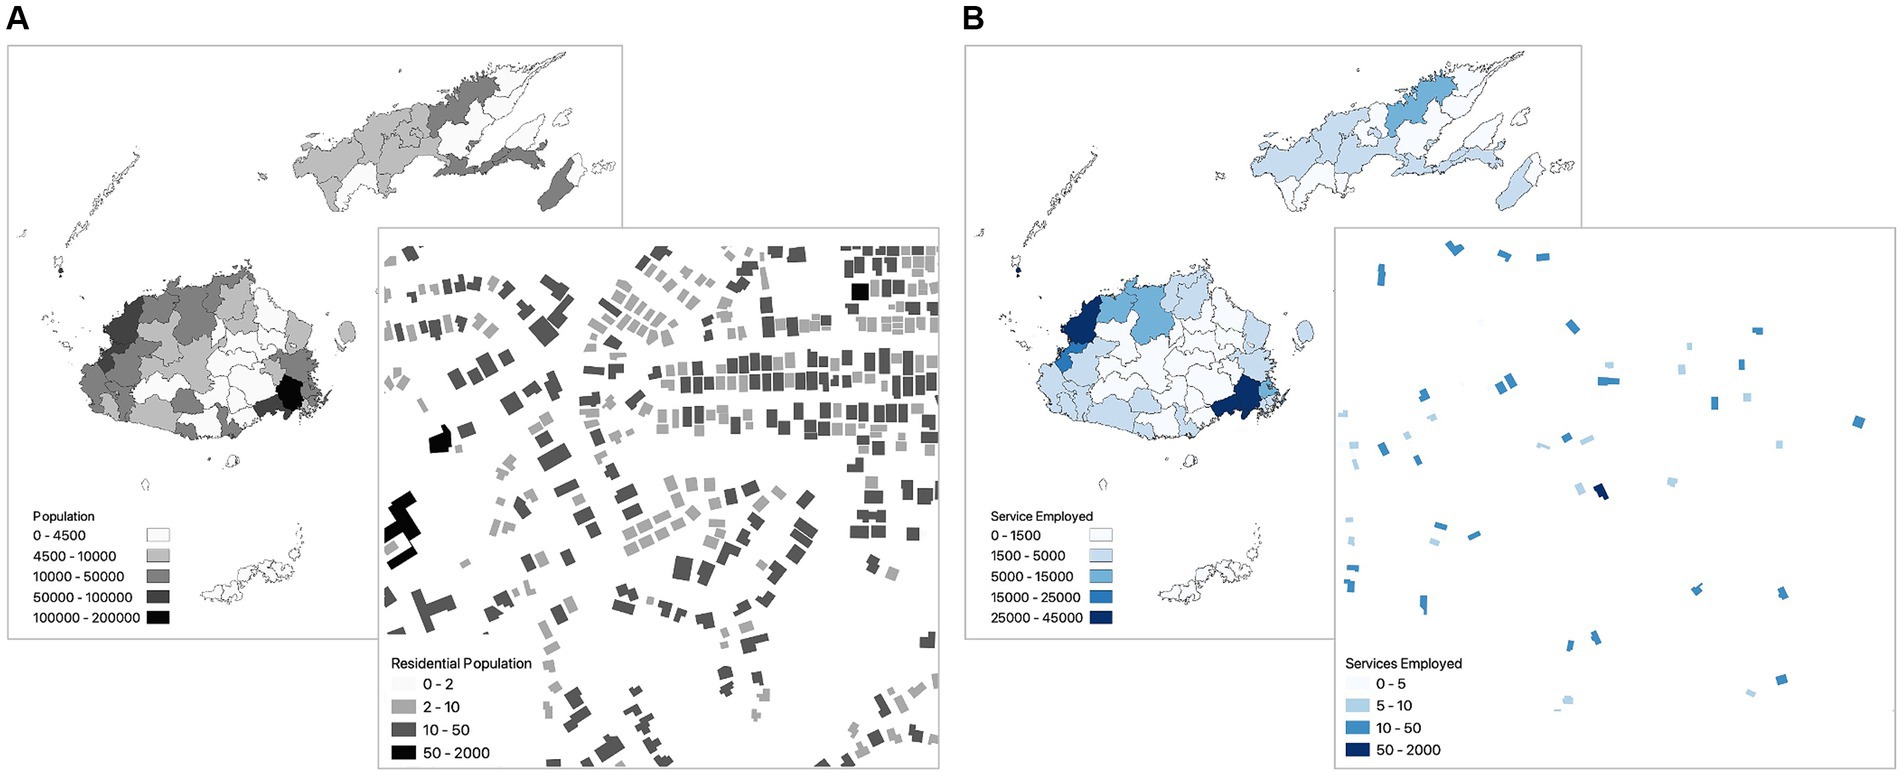
Figure 4. Assignment of residential population to their homes (A) and workers in service sector to their workplaces (B). Residence population and worker totals from census were downscaled to building level, considering the “effective” area of each building.
Several global datasets on population distribution, settlement identification, and land use/land cover (iii) are available. In the study, the analysis was performed with the data from the census available at administrative level 2. To evaluate the representativeness of the data and the coherence among the datasets available, these values were compared with two global products: High-Resolution Settlement Layer at 30-meter resolution (CIESIN, 2016) and WorldPop at 100-meter resolution (Bondarenko et al., 2020). The two datasets provide a spatial distribution consistent with the census. Some differences can however be noticed. For Fiji, the greatest differences are found in the inland area, which is more rural and difficult to survey. For Vanuatu, the greatest differences are concentrated in the northernmost island, where the global products underestimate compared to the census.
While not strictly necessary for the construction of the exposure model, these layers may help the application of the methodology to other cases where local data are not available. To identify the cropland and grazeland areas in both countries, the ESA global land cover map at 10-meter resolution based on both Sentinel-1 and Sentinel-2 data (Zanaga et al., 2020) was used. The GHS-SMOD R2022A settlement layer (Schiavina et al., 2022) were used to identify the rural and urban areas for both countries.
The OpenStreetMap (OSM) (2020) layer of building footprints updated in 2020 was adopted (iv).
From these datasets, a high-resolution exposure model was created. This model meticulously characterizes built-up areas at building scale as a vector layer, where each polygon represents a building footprint taken from the OSM building footprint layer, with attributes drawn from the PCRAFI model. Additionally, it incorporates statistical data and land cover/use information. Following this, building occupancy was assigned from PCRAFI data. Residential population and worker totals at reference administrative level (Figures 3B–D) were downscaled considering the “effective” area of the building, i.e., building footprint area multiplied by the number of stories. The results are shown in Figure 4. To avoid double counting, a procedure that linked each worker to his/her home and workplace (based on the minimum geometric distance between the two) was applied. The association was guided by the criterion of minimizing the distance between each industrial or service building, cropland or grassland area, and each residential dwelling. Initially, each person employed in a specific sector was assigned to the nearest house within a designated distance, such as a radius of one kilometer. Subsequently, this procedure was iterated, gradually increasing the radius to accommodate workers who were not assigned in previous iterations, until all workers were matched with houses. The same iterative process was applied to users of basic services. Upon completion of the process, each house was linked with its occupants’ workplaces, the schools attended, and the hospitals providing services. In this way, workers who lose both home and job through a single event are counted only once. The procedure for building the exposure model is detailed in the Supplementary material.
For the built-up area, the set of physical vulnerability functions from HAZUS (Federal Emergency Management Agency, 2010) was adopted. The FEMA vulnerability library comprises water depth-damage functions for buildings and is developed on the basis of 20 years of empirical damage data, integrated with functions developed by the US Army Corps of Engineers (USACE). The curves depend on building type, number of floors, and presence of a basement, and provide damage estimates both for building content and structure.
The sensitivity of the results on the choice of the vulnerability curves was explored through some comparisons with the CAPRA vulnerability library (Cardona et al., 2012), and with the JRC (Joint Research Centre) curves (Huizinga et al., 2017). Figure 5 shows a comparison between different vulnerability curves for residential buildings: HAZUS (single-story, no basement), JRC (single-story, no basement) and CAPRA (single-story, concrete and masonry). The final choice also depended on the type of attributes characterizing the exposure layer. In this context, the HAZUS vulnerability library was the preferred choice compared to others, as it aligns most closely with the building characterization in the available exposure model. Specifically, it can be effectively linked to buildings using key elements such as usage and the number of floors. In contrast, using CAPRA curves (which are based on construction material) would necessitate additional assumptions about the correspondence between building usage and construction materials. Along the same lines, opting for the JRC library would not permit the differentiation of buildings based on their number of floors.
The gray area in Figure 5 represents percentage values of building damage that no longer allows the edifice to be used. As mentioned in Sub-section 2.1, we assumed the threshold to be when the building experiences “substantial to heavy damage,” and literature (e.g., Lagomarsino and Giovinazzi, 2006; Tyagunov et al., 2006) suggests the range to be between 40 and 60%. In the absence of literature suggesting a value within the 40–60% range to define when a building becomes unusable, we made the following considerations. We opted to exclude the extremes of the range and initially considered the middle value, 50%. However, this corresponds to a water depth of about 4.6 m for HAZUS curves (structure), which seems highly unrealistic. Instead, we chose 45%, corresponding to a water depth of 2.8 m, which we find more reasonable. Additionally, upon comparing other vulnerability curves, we observed that the range of water depth values is narrower at 45% damage (standard deviation 0.52 m) than at 50% (standard deviation 1.02 m). In essence, at 45% damage there is reduced epistemic uncertainty in the physical vulnerability compared to 50% damage.
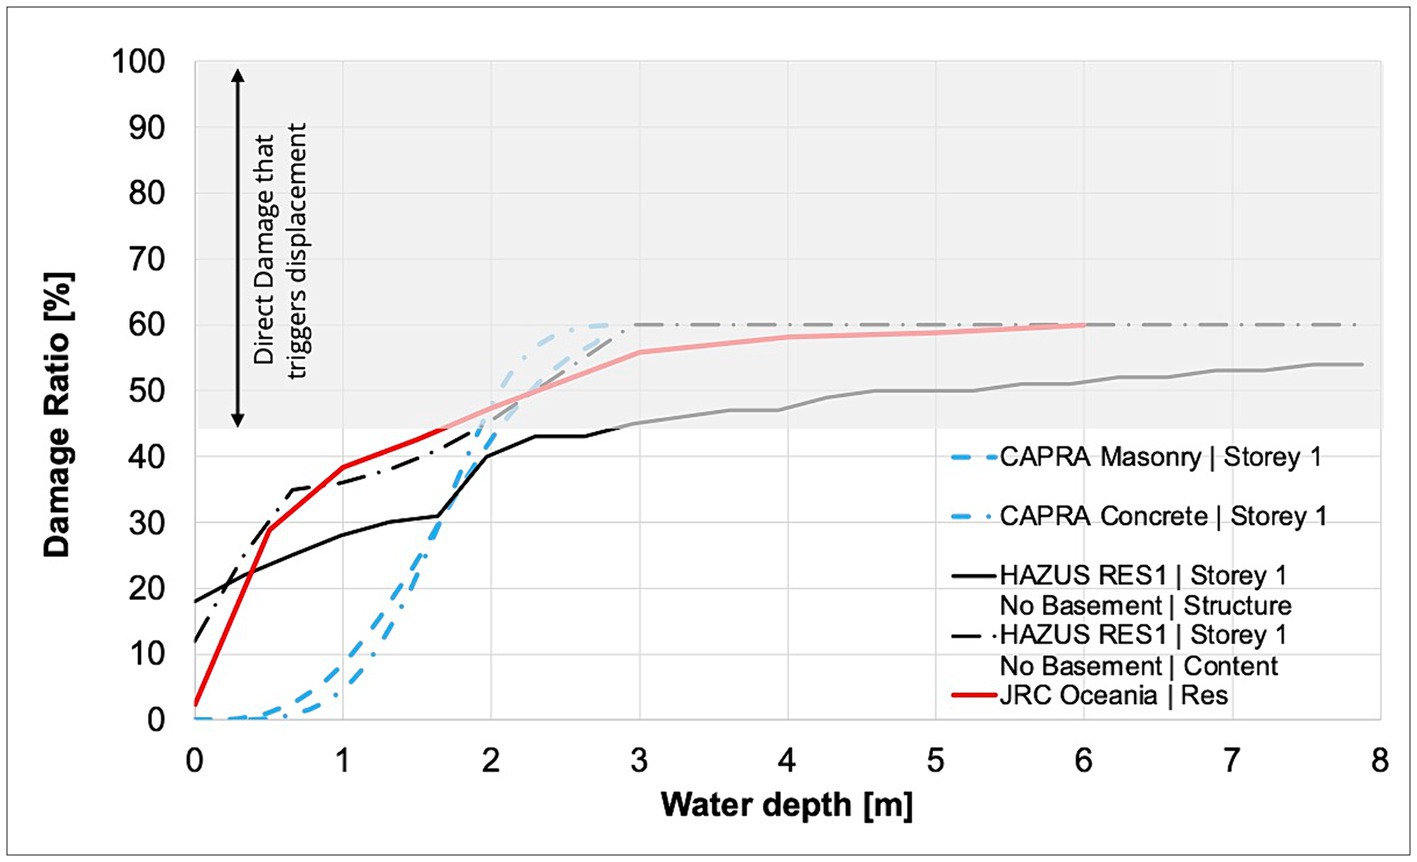
Figure 5. Vulnerability curves for residential buildings from different sources. For those ratios of damage in the gray area, the building is considered unable to provide its function (home, job), thus triggering displacement. Curves from CAPRA (blue) differentiate based on constructive typologies (different hatching typologies represent different constructive typologies), while those from HAZUS are based on occupancy and are available for both structure and content (solid and dash-dotted black line, respectively). Residential curve for Oceania by JRC is represented in red.
In the context of agriculture, there is limited or no publicly available data on the spatial distribution of croplands in Fiji and Vanuatu, and global layers such as MAPSPAM3 (You et al., 2014) provide little useful information for these two countries. This limitation implies that it was not possible to reference the seasonality of single crops, as they cannot be spatially distinguished. Given these constraints, we opted for a single value to represent the phenomenon of plant asphyxia, encompassing floods with different possible durations. Some reference sources suggest 0.4–0.5 m as the minimum water depth causing damage to crops for different durations. These sources include Agenais et al. (2013) and Fӧrster et al. (2008) for maize, and Shrestha et al. (2021) for rice. The latter study provides a review of other models, among which the value of 0.5 m appears to achieve a certain consensus. Therefore, the vulnerability function adopted for agriculture is a binary parameter, “flooded” or “not flooded.” It categorizes a field as flooded if it cannot support agriculture and pastoralism for farmers, leading to displacement. This classification is based on a threshold water depth of 50 cm.
Changes in exposure and vulnerability between current and future climate conditions were not considered in future projections. However, it is worth emphasizing that factors such as population growth, distribution, and the rapid urban sprawl that decreases natural areas available to absorb floodwater have the potential to significantly alter the future “riskscape.”
2.2.4 Risk computation
In probabilistic risk assessment for natural hazards, such as earthquakes, floods or hurricanes, it is essential to account for various scenarios of these events to understand their potential impact. Typically, these assessments involve a large set of scenarios to simulate the potential intensity and occurrence of the hazard over a specific area. However, the approach to be chosen depends on the geographical scope of the assessment to be conducted. When examining a wide geographical area, it is not advisable to rely solely on hazard maps for the computations. This is because hazard maps represent the likelihood of an event occurring at specific locations but do not inherently account for how these events may be spatially correlated. In other words, hazard maps may not adequately capture the interdependencies or simultaneous occurrences of events across the entire region. Therefore, for large-scale assessments, use of a comprehensive scenario set that considers these spatial correlations is recommended in order to make more accurate risk assessments.
On the other hand, when the assessment focuses on a very specific and small geographical area, it may be acceptable to conduct computations directly using the hazard maps. In this case, the spatial correlations may have less impact because what is looked at is a confined area where events normally strike with similar intensity in the whole area considered. In this case, hazard maps can provide a reasonable approximation of the risk within this limited scope without the need for an extensive scenario set (see e.g., Arrighi et al., 2018). This was the case of the flood displacement risk for Fiji and Vanuatu presented in this paper.
Each hazard map described in Sub-section 2.2.2 served as input for evaluating the impact on potentially displaced individuals. To accomplish this, we took the following action. For each feature (polygon) in the exposure model, we computed the average value of water depths over the feature footprint, and we assigned this value to the considered feature (residential buildings for residential population, industrial or service buildings for population working in these sectors, croplands or grazing areas for employees in agriculture/pastoralism, and schools for students). Damage assessment was conducted at the individual building level using the vector exposure model and the HAZUS (Federal Emergency Management Agency, 2010) vulnerability curves. Elements that exhibited damage beyond the damage threshold of 45% were considered unable to fulfill their functions (e.g., provide shelter, workplace), resulting in displacement. The population associated with these assets was deemed susceptible to displacement. Individuals who experienced both housing and livelihood loss in the same scenario were counted only once to avoid duplication. To take into account that only a proportion of the people who would lose their means of livelihood would displace, a reduction factor was applied. While there is no specific dataset to be used to quantify this parameter, we applied a reduction factor of 0.35 in accordance with firsthand questionnaires applied in other parts of the world. It is recognized that in the present case study, this is a mere expert speculation and additional data should be retrieved for a proper calibration of this parameter. On the other hand, the dependency ratio from the censuses of Fiji and Vanuatu, respectively 54 and 75%, were used as proxy for the household composition. This accounts for individuals who would move along with the breadwinner. The number of potentially displaced people across various sectors was aggregated at the relevant administrative level. These impacts were then used to determine the average annual displacement (AAD) and probable maximum displacement (PMD) values. While AAD expresses an average number of expected displacements due to flood events, it does not capture signals from rarer and more intense events. For this reason, it is useful to compare the PMD curves for current and projected conditions, which show the number of potentially displaced people in connection to frequent (low return periods) or rare (high return periods) events. For each administrative level, the PMD curve is constructed by plotting the number of displacements originated by each hazard map versus the return period for each hazard map, and then the integral under that curve is calculated, and this represents the AAD. The same process is repeated at national level.
3 Results
3.1 Flood hazard maps
Flood hazard mapping was conducted for various return periods following the methodology outlined in Sub-section 2.2.2. These maps serve as the foundation for the displacement estimation discussed in this section.
Considerable effort was dedicated to gathering alternative data sources on flood hazards from authorities in Fiji and Vanuatu, leveraging direct contacts at the local level through IDMC. Regrettably, official hazard maps for these two countries are unavailable, precluding the use of specific official data for benchmarking our results. However, some studies from UNOSAT, part of the project “Commonsensing: Building Climate Resilience with Small Island Nations,”4 have identified flood-prone areas using the basic HAND geomorphological method. Given that the REFLEX methodology builds upon the HAND methodology, direct comparisons between the results are challenging due to inherent similarities in both mapping approaches.
The accompanying figures (panels a and b of Figure 6) depict details of the hazard maps for 10- and 100-year return periods in Fiji. Various shades of blue indicate increasing water depth. Noticeable disparities in spatial extent and heightened water depths are evident between the two maps, particularly for the 100-year return period. While areas impacted by the shorter return period affect limited portions of inhabited areas, the longer return period reveals more exposed assets that are vulnerable to flooding.
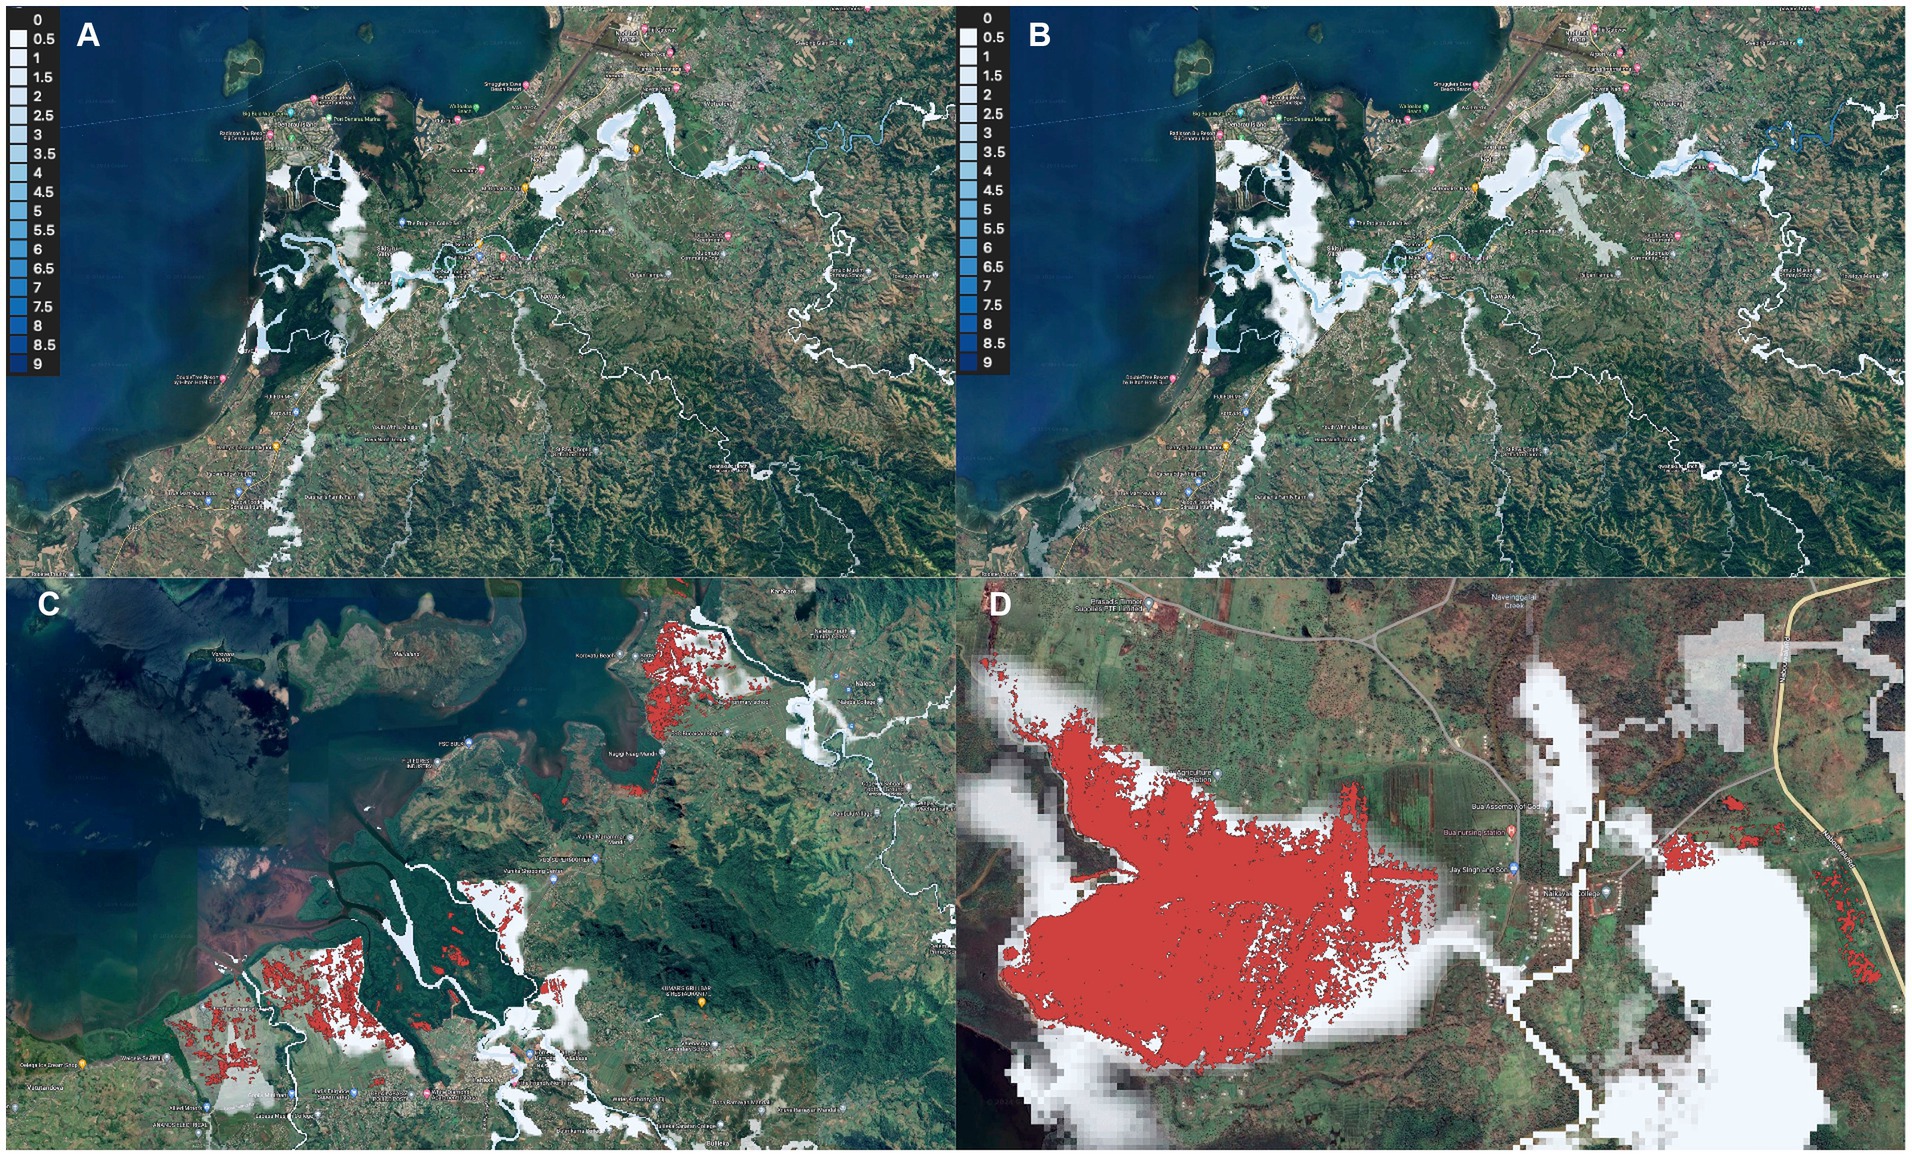
Figure 6. Hazard maps detail for Fiji. The upper panels present a comparison between the 10-year return period (A) and the 100-year return period (B), blue shades represent different water depths, the lower panels (C,D) present in red satellite-observed flooded areas for an event in 2020 due to Cyclone Yasa which is compared with the modeled Hazard maps (Satellite elaborations from UNOSAT, acquisitions from Sentinel-1 on 18-19/01/2020, event GLIDE, Number TC20201215FJI).
Soft validation can also involve cross-referencing satellite observations of past flood events to verify the agreement between delineated flood areas and hazard map extensions, particularly in areas observed post-event. A commonly used resource for this purpose is the Global Surface Waters Dataset from JRC (Pekel et al., 2016), which generates maximum water extension maps using three million Landsat satellite images spanning the past 32 years at a 30-meter resolution. Unfortunately, optical data are often affected by cloud, and the extension available for Fiji and Vanuatu, despite those islands experiencing relevant events within the observation time window, do not show particularly interesting results, and the water extension is mainly limited to the permanent or seasonal water bodies.
While comprehensive datasets may be lacking, isolated events have been documented by UNOSAT, such as during Cyclone Yasa in 2020.5 Flooded areas were identified in two specific locations. Figure 6 (panels c and d) juxtaposes these flooded areas with the 10-year flood hazard maps, revealing a notable alignment between the observed flooded locations and the hazard map delineations.
3.2 Comparison with historical displacement records
A direct validation of the methodology with data from Fiji and Vanuatu alone was not possible because of the small number of events reported in the IDMC database (§2.2.1). In the case of Vanuatu only one event is reported, while six events are recorded for Fiji in the period 2008–2022. An empirical AAD of 1,890 per year can be derived for Fiji, but the reliability of the data remains low. This number has the same order of magnitude as the model-derived AAD of 936 displacements, corresponding to about 0.1% of the overall population (Table 3). However, this cannot be considered as a sound scientific validation, due to the very limited observed time series.
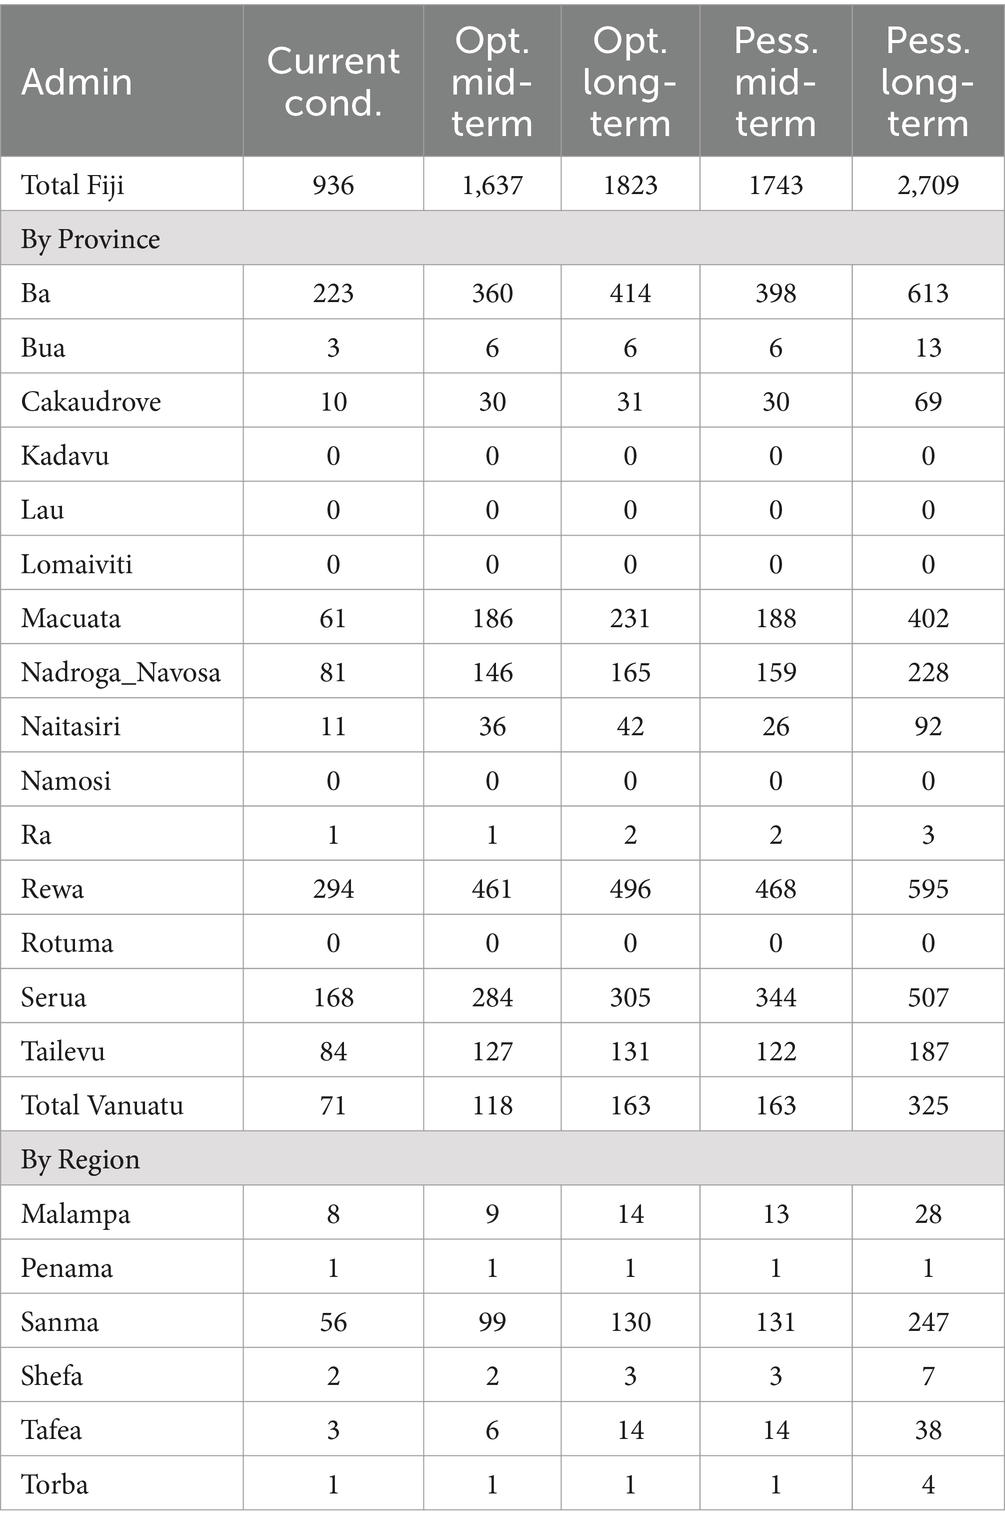
Table 3. AAD estimates for Fiji and Vanuatu at administrative levels 0 (country) and 1 (provinces).
For a more comprehensive evaluation of the model performance, we expanded the impact dataset by incorporating data from additional countries in the East Asia and Pacific region, encompassing all flood events (Internal Displacement Monitoring Centre, 2023). To facilitate cross-country comparisons, the numbers were normalized by the total population, ensuring a meaningful assessment of the figures across different nations. Subsequently, we analyzed the estimated figures for Vanuatu and Fiji in relation to those recorded for the broader geographical region.
Figure 7 reveals that the AAD value of 71 in Vanuatu, corresponding to 0.03% of the total population, aligns closely with the median values for current conditions. In contrast, AAD in Fiji settles close to the third quartile, indicating a heightened susceptibility to flood impacts. Nevertheless, it is noteworthy that both estimates fall within the overall range recorded for countries in the same geographical region, emphasizing the contextual validity of the findings.
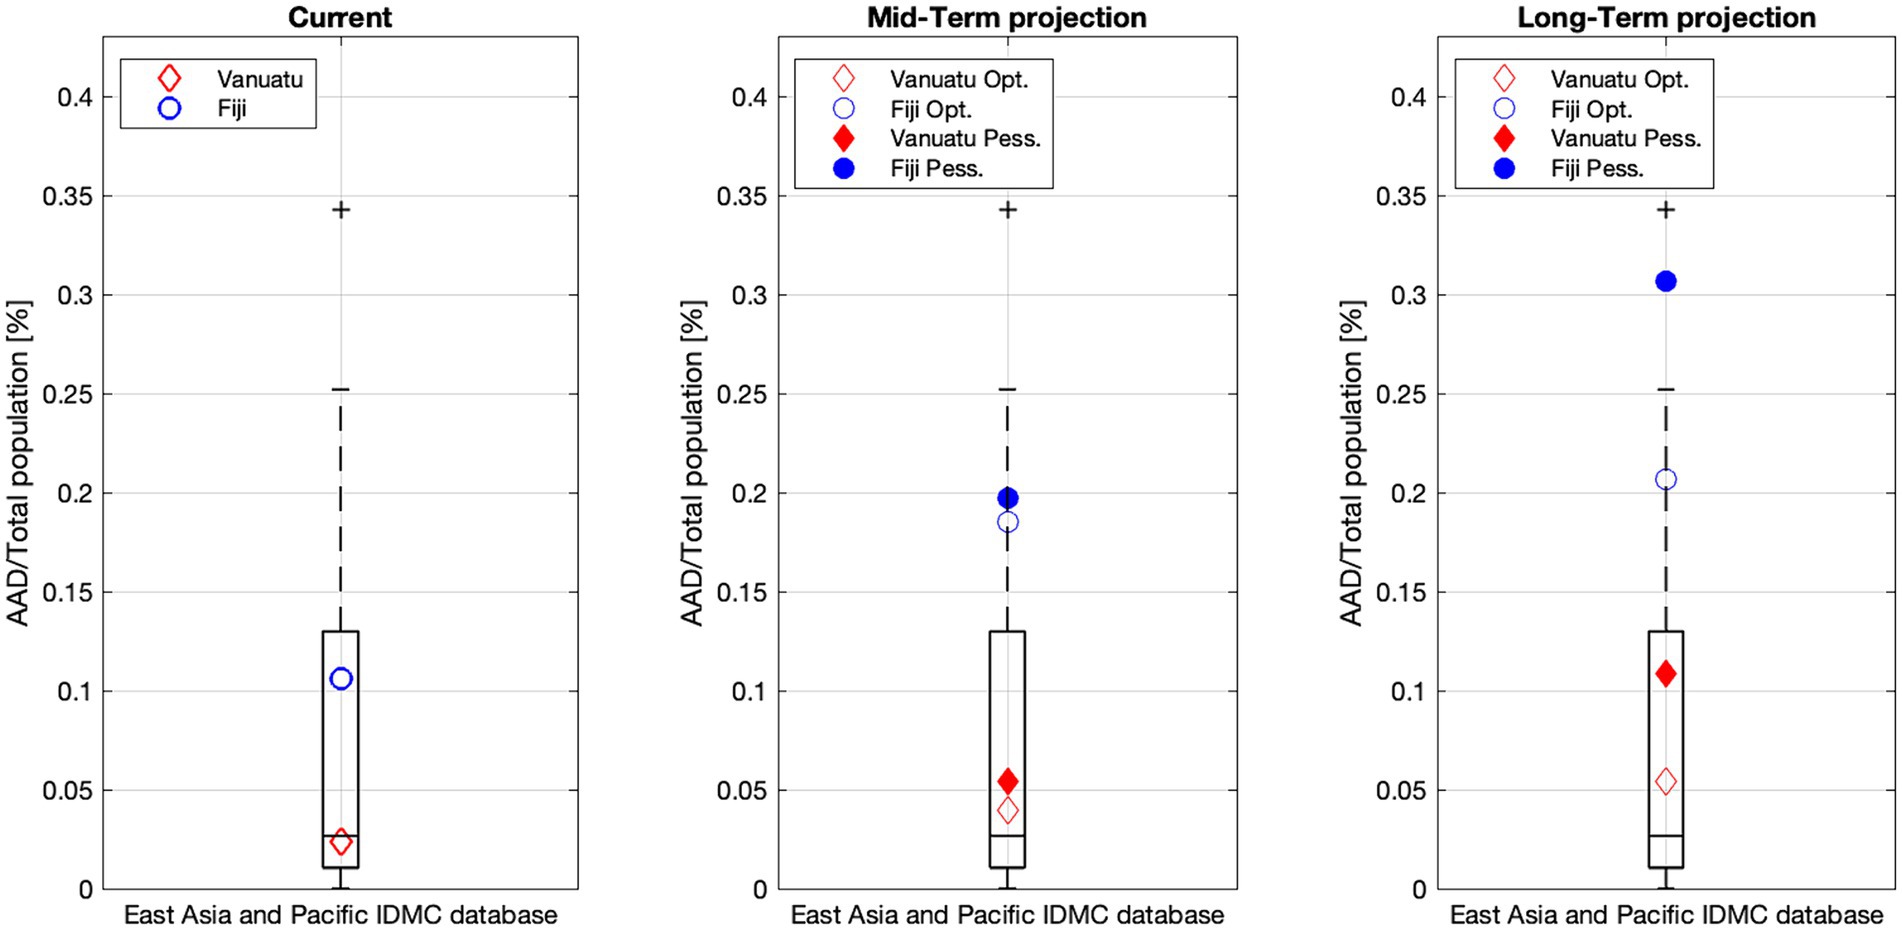
Figure 7. Comparison between the simulated AAD for Fiji (blue) and Vanuatu (red) with the empirical average from the IDMC database. In the box-plot graphs the central mark denotes the median, and the lower and upper edges of the box represent the 25th and 75th percentiles, respectively. The whiskers extend to the most extreme data points that are not classified as outliers, while outliers are individually plotted using the “+” marker symbol. Solid fill symbols represent the “pessimistic” scenario, while no fill symbols denote the “optimistic” scenario.
In projected climate conditions, while AAD for Vanuatu stays within the current interquartile boundaries of the recorded regional events, AAD for Fiji significantly exceeds those limits (Figures 7).
3.3 Comparison between current and projected average annual displacement
Fiji results are produced for different administrative levels from 0 (country level, Table 3) to level 3, corresponding to Tikina (level 2 is not shown here for the sake of brevity). The analysis at country level shows an AAD value of around 936 people, corresponding to about 0.1% of the overall population. The results indicate that AAD values are double those in current conditions in the optimistic and the pessimistic medium-term scenarios (Table 3). Instead, both AAD estimates at country and province levels (Table 3), and in Tikina units (admin level 3), show that the two scenarios diverge toward the end of the century (long-term projections), with the AAD value triplicating in the pessimistic long-term scenario. While in a relevant number of Tikinas (admin 3) the expected level of displacement increases, their AAD spatial pattern in Tikina units is comparable when considering results in current climate conditions in comparison to the projected ones (Figure 8).
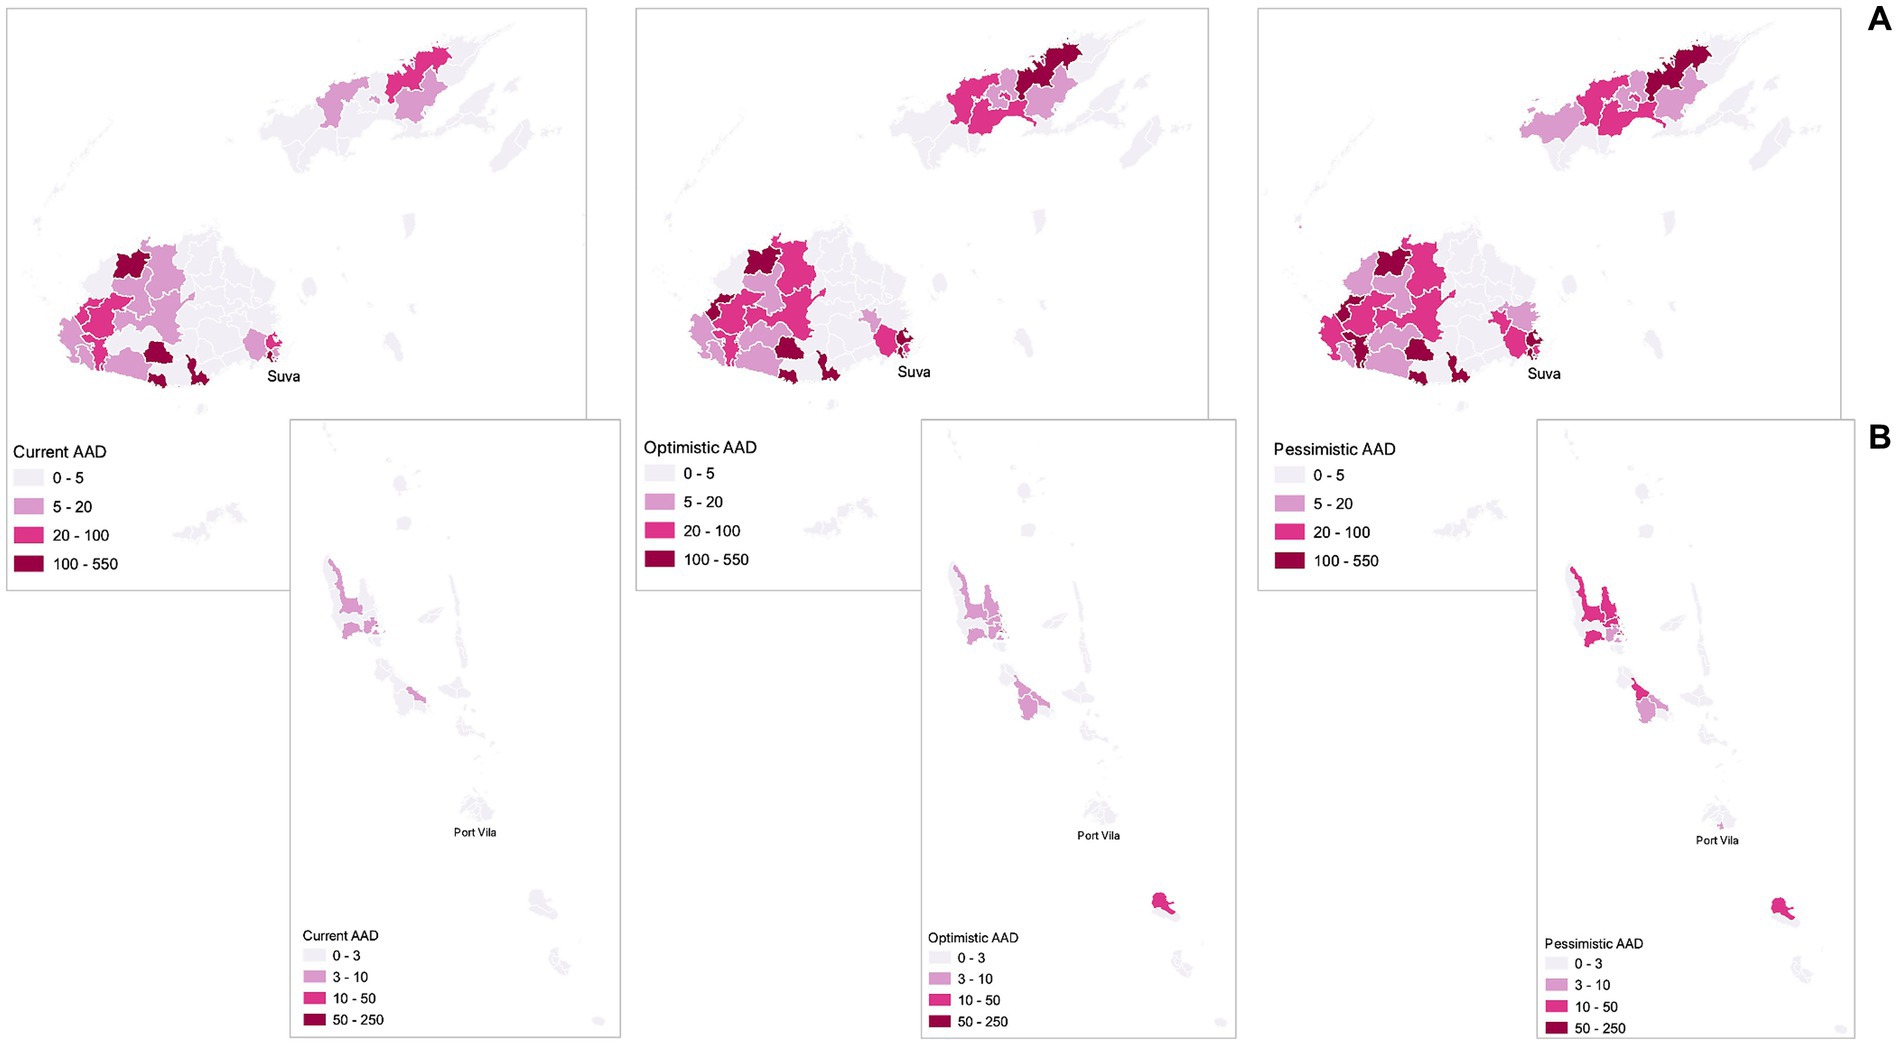
Figure 8. AAD for Fiji (A) and Vanuatu (B) in current climate conditions and in long-term projections under optimistic and pessimistic scenarios. Results are aggregated at administrative level 3 for Fiji and level 2 for Vanuatu.
Vanuatu results are obtained at administrative level 0 (country level, Table 3) through to level 2 (districts). The analysis at country level shows an AAD value of around 71 people, corresponding to about 0.03% of the overall population. The level-1 AAD results under current climate conditions show that a province in the north (Sanma) is by far the province most at risk (Table 3). The same also applies under future conditions, regardless of whether the optimistic or pessimistic projections are considered, and the time horizons involved. For some provinces, such as Penama and Torba, the overall AAD figure is small, and it does not substantially change in projected climate conditions. Other provinces show a significant increase, among them Tafea, where AAD is projected to strongly rise under the pessimistic long-term scenario, mainly due to the increase of displacement in the northern Erromango island. For all provinces in both countries, the mid-term pessimistic projection and the long-term optimistic projection show very similar results, identifying a clearly worsening path.
Regarding the disaggregation of AAD in terms of origin of the displacement (rural/urban), in Fiji almost 60% of displacements are currently originated in rural areas (Table 4). Such a proportion decreases significantly to 50% in long-term projected climate conditions. In Vanuatu, three-quarters of displacement is likely to originate from rural areas in current climate conditions. This proportion decreases to 54% under projected conditions.
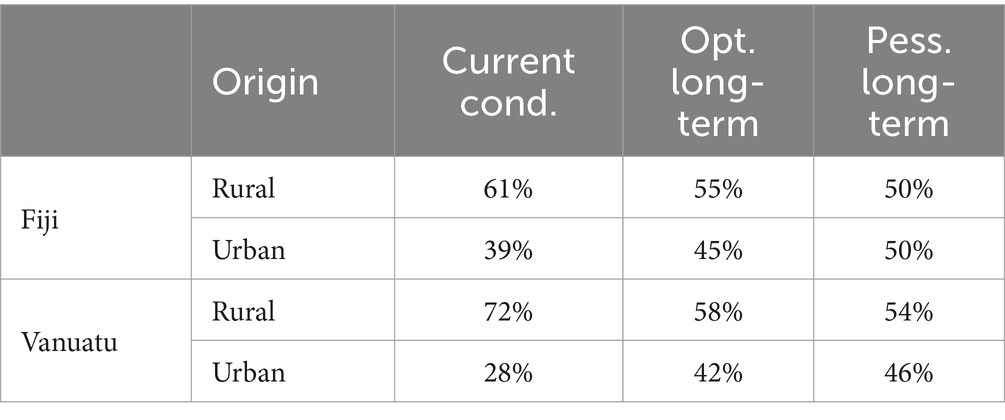
Table 4. Origin of displacements (proportion of AAD) at country level for Fiji and Vanuatu.
It must be noted that factors such as future population growth and changes in distribution (e.g., urbanization), which might significantly change these estimates, are not considered in the modeled future scenarios. This increase in the urban share is likely to be even more pronounced in reality, given that the projected scenario does not account for population growth and the concurrent increase in urbanization.
Figure 9 depicts the causes of displacement as a proportion of AAD. In Fiji, under current climate conditions, nearly 70% of displacements are attributed to the loss of housing. Among the remaining 30% connected to the loss of livelihoods, people working in the service sector are the most affected. Similar distribution is observed in long-term climate projections.
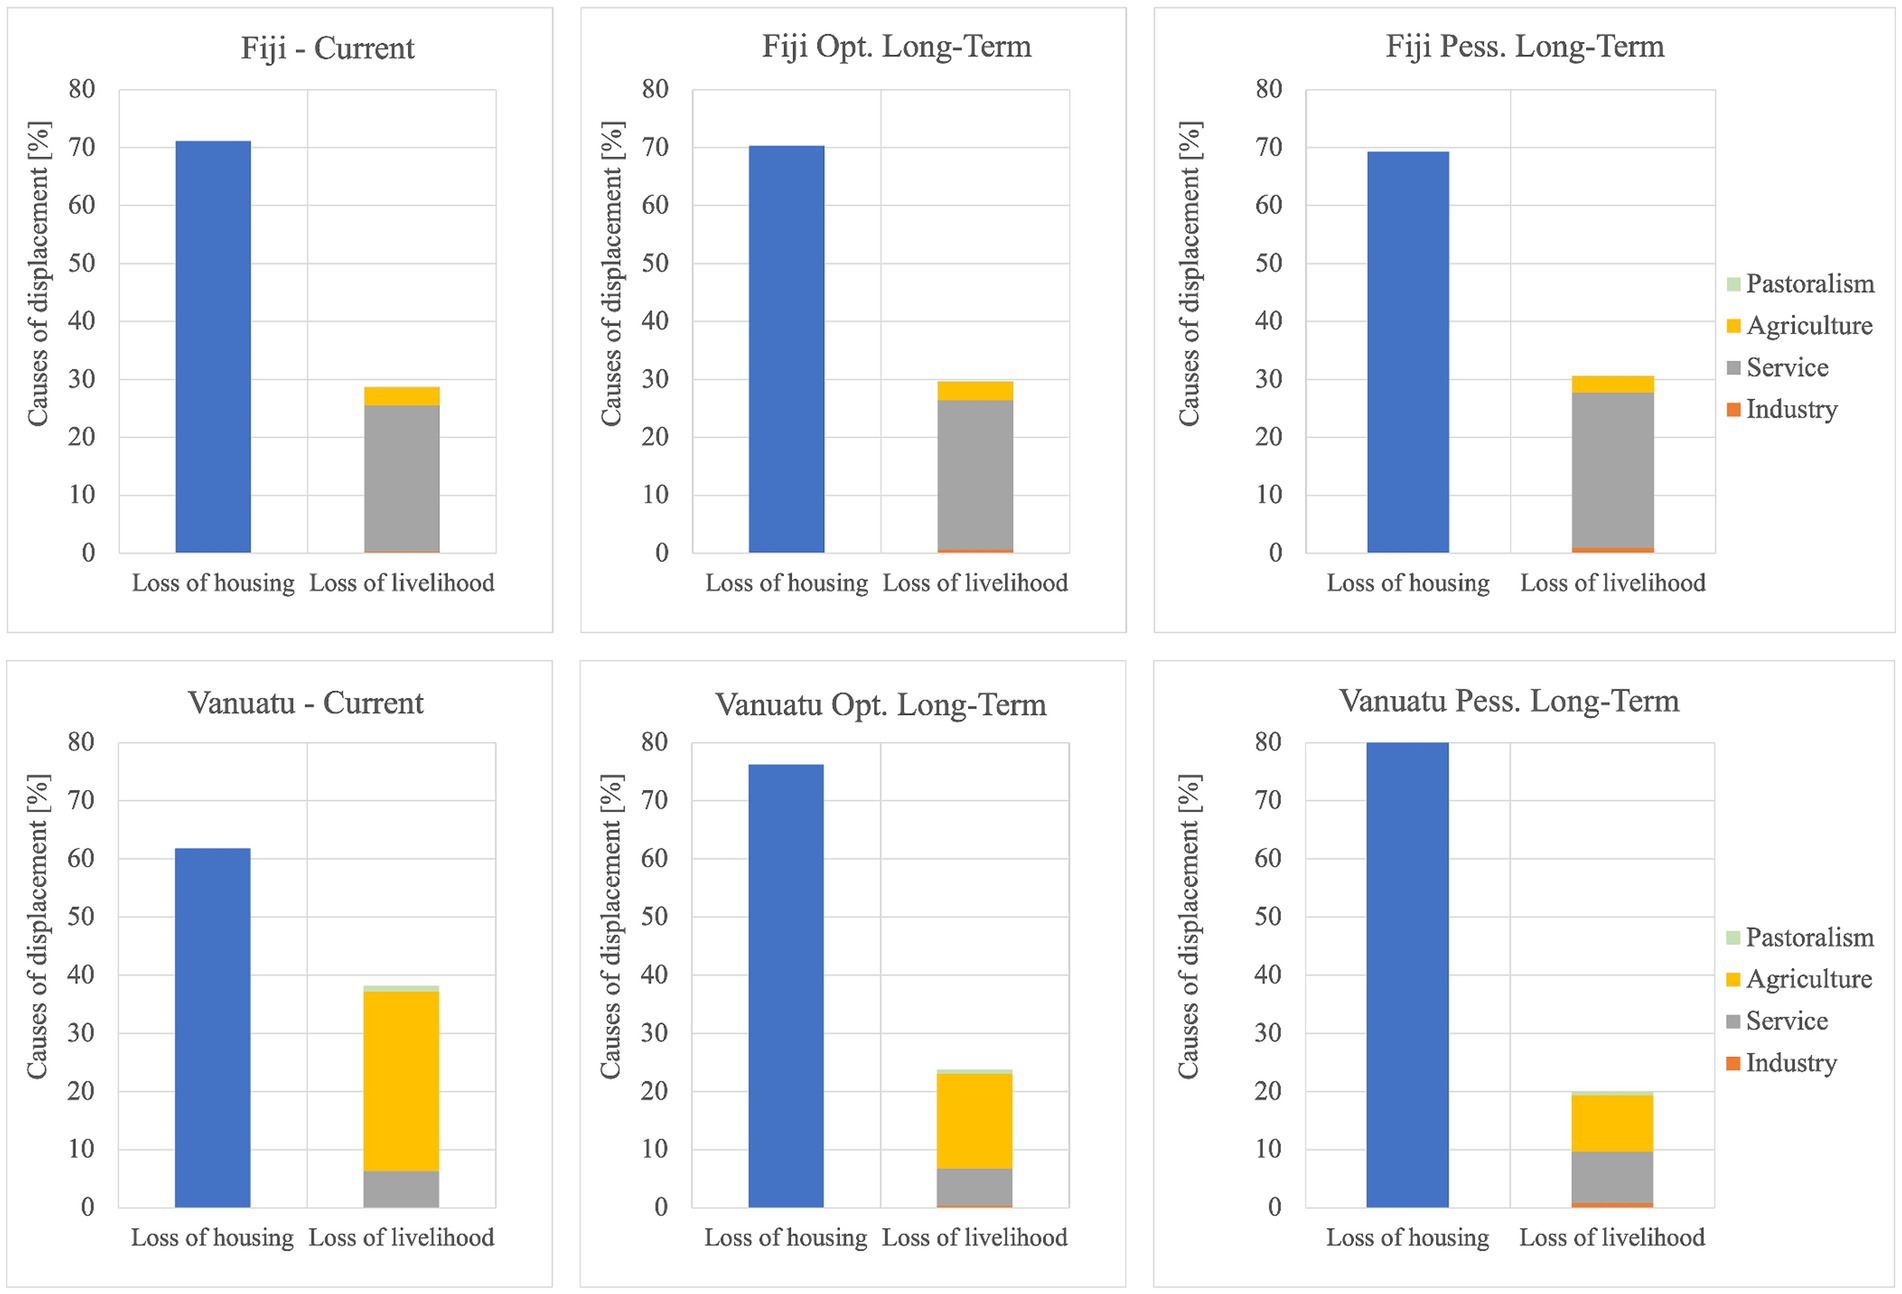
Figure 9. Cause of displacements (proportion of AAD) at country level for Fiji and Vanuatu.
In Vanuatu similarly, under current climate conditions, nearly 60% of displacements are attributed to the loss of housing. Concerning the loss of livelihoods, individuals working in the agricultural sector are by far the most affected group (around 30%), while people working in the service sector are around 7%. The distribution undergoes a significant change in long-term climate projections, where the ratio of displacement linked to the loss of houses rises to more than 75 and 80%, respectively, in the optimistic and pessimistic scenarios. Accordingly, the share of the agriculture sector reduces to 15 and 10%, respectively, in the optimistic and pessimistic scenarios. Displacements resulting from job loss in the service and industrial sectors show a progressive increase as conditions worsen, transitioning from the current to the optimistic long-term scenario and further to the pessimistic long-term scenario.
While lack of services affects people’s wellbeing, it cannot be directly associated with a life-saving decision (or extremely precarious physical living conditions), at least in the short term, and therefore we assume that it is not sufficient to immediately trigger displacements. Nevertheless, the combined criticality of loss of housing and/or work and a general lack of services in the area can be a worsening factor that could also drive to displacement on a longer time window. In the present study, this was not considered as a factor inducing displacement directly. However, this can be a worsening element which increases vulnerability, leading to a higher displacement propensity, and should be taken into consideration when formulating future policies. In Fiji, people who lose access to health and education services will double in the pessimistic long-term scenario compared to the current conditions. It is worth noticing that in Vanuatu floods do not affect health services in current conditions, while the number of students who lose access to schools increases considerably under long-term climate scenarios (Table 5).
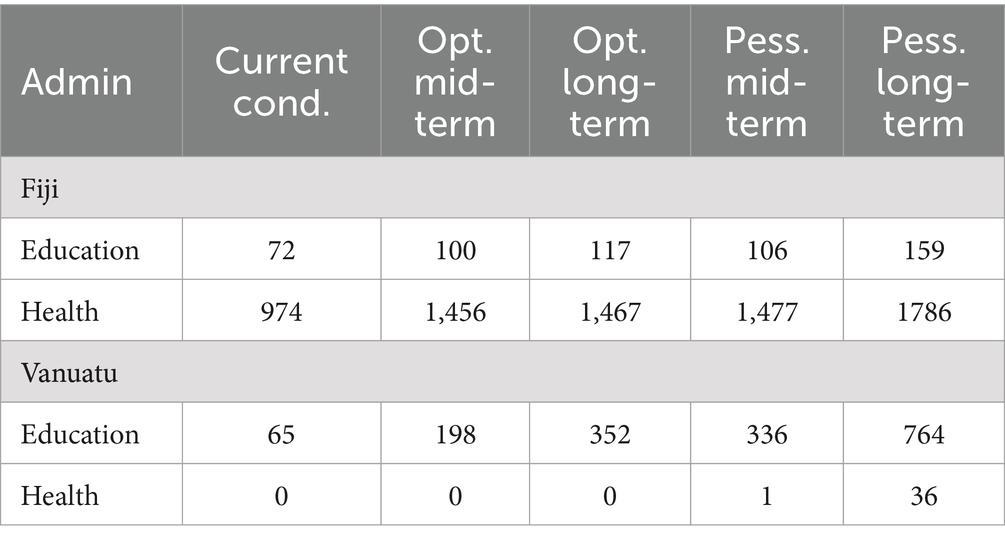
Table 5. Average annual number of people who lose access to education and health services in Fiji and Vanuatu.
3.4 Comparison between current and projected probable maximum displacement
In Fiji, displacements would increase significantly under projected climate conditions with respect to current conditions (Figure 10A). For instance, for a 50-year return period (RP), displacements more than double in the projected optimistic scenario and almost triple in the projected pessimistic scenario. Similar proportions are estimated for RP = 5 years and RP = 250 years. It is worth noting that in the long-term pessimistic scenario, a 250-year event is associated to around 23,000 potentially displaced people, corresponding to 3% of the current overall population.
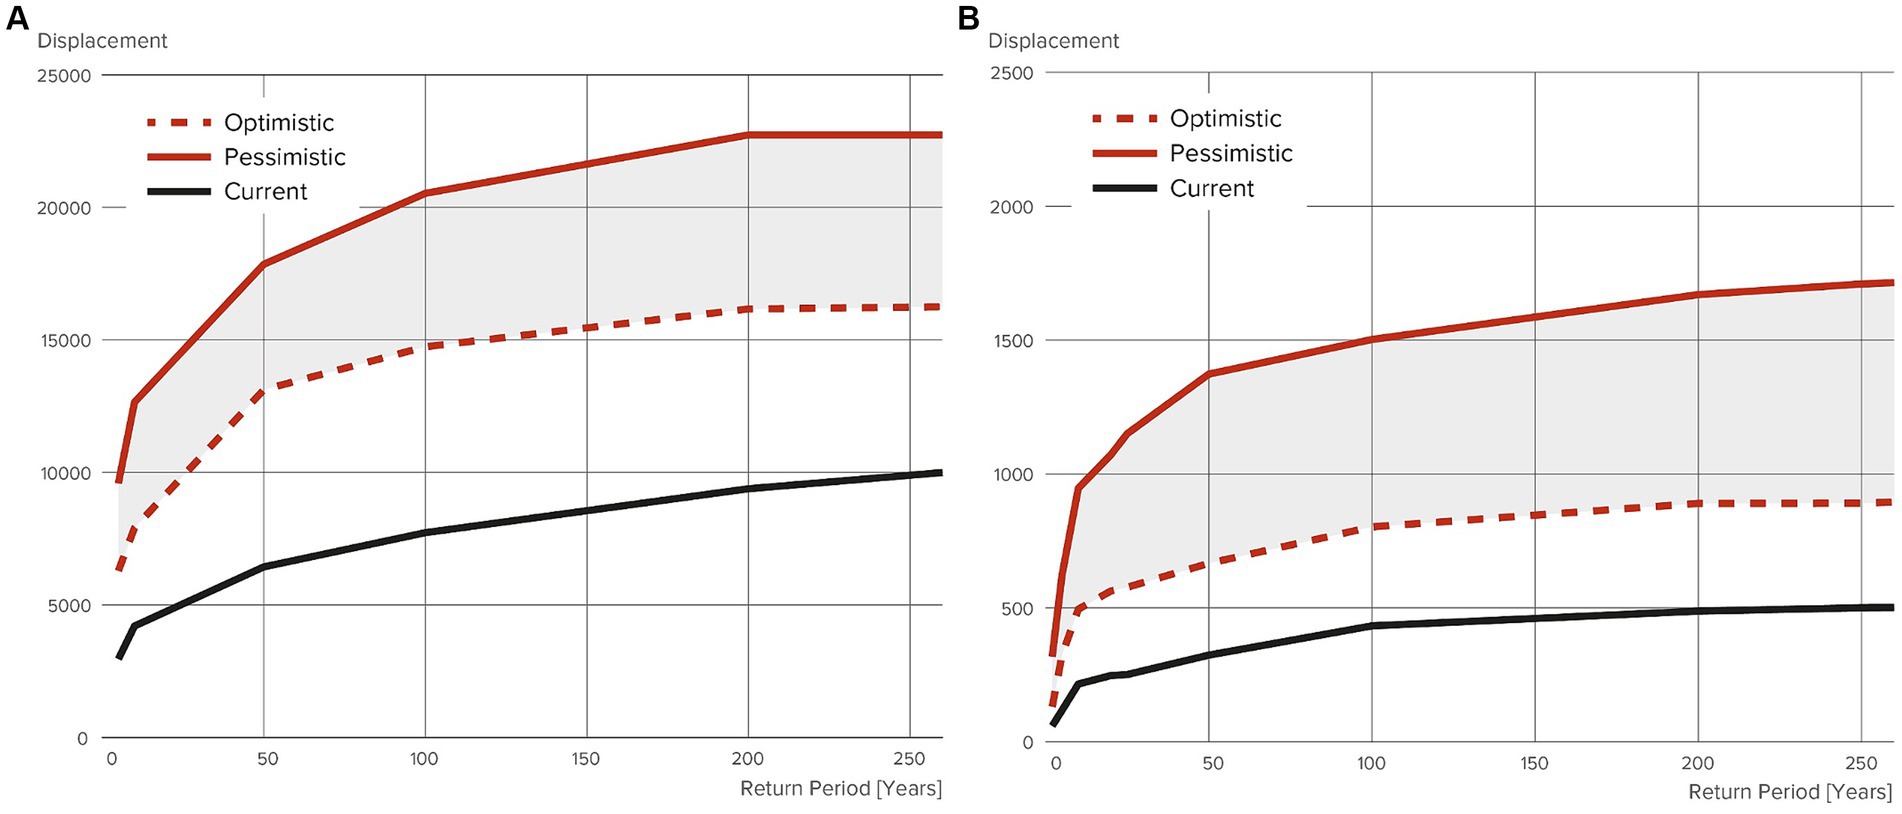
Figure 10. PMD curves for current climate conditions and long-term projections under both optimistic and pessimistic scenarios: (A) Fiji, (B) Vanuatu.
In Vanuatu, the PMD curves show that an event with a 50-year return period could trigger up to 330 displacements under current conditions, but this figure could almost double in the long-term optimistic scenario and quadruplicate in the long-term pessimistic scenario (Figure 10B).
4 Discussion and concluding remarks
The main novelty introduced by this study concerns impacts of riverine floods on places of employment, implying a potential loss of livelihood that may cause displacement. The methodology is rooted in a comprehensive probabilistic risk assessment, incorporating climatic, hydrological and hydraulic modeling, as well as estimating the impacts on physical assets leading to displacement.
The assessment quantifies the risk in terms of Annual Average Displacement (AAD) and Probable Maximum Displacement (PMD), considering both current climate conditions and medium to long-term projections based on optimistic and pessimistic scenarios. The benefits of AAD and PMD quantification lie in their ability to encompass rare scenarios, providing a more exhaustive understanding of potential displacement risks. Applied for the first time in the Pacific islands of Fiji and Vanuatu, the methodology yields valuable insights into the proportion of housing and livelihoods at risk, along with the quantification of potential disruptions to critical services such as education. Losing access to such services may not trigger displacement per se, but it acts as an aggravating factor that heightens vulnerability and makes movement more likely.
The methodology emphasizes a physically-based modeling approach rather than relying solely on historical data and empirical models, enabling simulation of future conditions in explicit terms.
The anticipated tripling of AAD in Fiji and quadrupling in Vanuatu underscores the urgency of addressing these risks. This is valid also for rarer events, e.g., for a 50-year return period, which might pose serious challenges in managing the displacement situation, exacerbating the potential criticality of the situation in terms of general disaster management. PMD curves further highlight a frequency shift, suggesting that events with a 250-year RP under current conditions may become more frequent by the end of the century, occurring on average every 5 to 25 years.
Crucially, the method allows for the differentiation of displacement causes, distinguishing between house loss and job loss. In Fiji, under current climate conditions, 70% of displacements are attributed to housing loss, with the remaining 30% attributed to the loss of livelihood. In Vanuatu, there is an approximate 60–40% split between displacements caused by housing loss and those caused by the loss of livelihood. This suggests that estimates focusing solely on housing loss are likely to be significantly underestimated, as they overlook the impact of livelihood loss. In all the projected climate scenarios explored, a minimum of 20% of displacement results from job loss, confirming the importance of incorporating this aspect in vulnerability assessments also for future assessment.
This distinction offers actionable insights for implementing mitigation and adaptation measures. Explicitly differentiating the vulnerability by house typology, including loss of livelihoods and access to critical services, indirectly accounts for social and economic factors in determining displacement risk.
We acknowledge the data-intensive nature of the methodology, emphasizing the need for a robust data collection framework. With respect to traditional approaches, the proposed methodology requires greater effort during exposure model preparation, which needs to incorporate information not only on resident population but on occupation as well, distinctly mapping the relation between where people live and where people work to avoid double counting.
As a collateral implication of employing this method, we emphasize the importance of differentiating the causes of displacement when collecting impact data on observed events. This enhances calibration of the vulnerability approach on the one hand and on the other strengthens knowledge of the factors to be accounted for in managing and reducing the displacement issue.
Direct validation of the methodology using historical data from Fiji and Vanuatu brought challenges due to the limited number of events reported in the IDMC database. While an empirical AAD for Fiji was estimated at about 1,890 displacements per year, the reliability of the data remains low. Despite a match with the model-derived AAD of 936 displacements at least in the order of magnitude, the scarcity of observed data limits the scientific soundness of this comparison.
While the overall approach shows promise, its scalability hinges on the availability of sufficient data to describe livelihoods and essential service features beyond residential population. However, the choices made in this study (e.g., use of dependency ratio to estimate the number of people who would be displaced together with the breadwinner) are dictated by the intention to increase the portability of this method to the geographical areas where classic census data are available. We acknowledge that, in the absence of literature, certain assumptions had to be made, especially regarding the damage threshold that makes houses uninhabitable and the proportion of people who would decide to move after experiencing loss of livelihoods. While the first one can be estimated to a certain extent from datasets, the second one would require firsthand data collection about displacement causes in past events (Table 5).
As climate-related risks escalate globally, this methodology opens avenues for similar assessments on a larger scale, contributing valuable insights for informed decision-making and adaptive strategies in vulnerable regions.
More specifically, the ability to estimate displacement numbers resulting from present and future climate change has significant policy implications across various sectors, including loss and damage, climate change adaptation and mitigation, and humanitarian aid and relief efforts.
Estimating displacement numbers due to climate change contributes to understanding the extent of loss and damage caused by climate-related events. This influences policies that revolve around the need for mechanisms to address the financial, physical and social impacts of displacement. A quantitative estimation in probabilistic terms may favor the development of insurance schemes, compensation mechanisms or liability frameworks to support affected communities.
Dimensioning the displacement issue with a prospective approach that highlights the main cause for displacement (e.g., loss of housing, loss of livelihood), disaggregated per sector, as well as some key aggravating factors (e.g., limited access to essential services) informs the design and implementation of risk reduction and resilience-building measures to minimize future displacement and associated loss and damage.
Quantitative estimates of displacement numbers can also inform climate change adaptation strategies by identifying areas most vulnerable to displacement, in this case due to riverine floods. Policy responses may involve land-use planning, infrastructure development, and relocation programs aimed at reducing vulnerability and enhancing resilience in high-risk areas. In the context of humanitarian aid and relief, estimating displacement numbers is crucial for humanitarian agencies and governments to anticipate and respond effectively to the needs of displaced populations. Policy implications include the need for early warning systems, contingency planning, and coordination mechanisms to ensure timely and appropriate humanitarian assistance.
Furthermore, displacement estimates can inform resource allocation and funding decisions for humanitarian aid and relief efforts, ensuring that adequate support reaches affected communities.
When the dimension of the problem requires it, policies may also focus on ensuring the protection of human rights, including the rights of displaced persons, and promoting durable solutions such as voluntary return, local integration, or resettlement.
Overall, the possibility to estimate displacement numbers in present and future climate scenarios underscores the importance of integrated and proactive policy responses across multiple sectors. By addressing the challenges posed by climate-induced displacement, policymakers are given a tool to enhance resilience, reduce vulnerability, and uphold the rights and well-being of affected populations in the face of climate change.
Data availability statement
The raw data supporting the conclusions of this article will be made available by the authors, without undue reservation.
Author contributions
LR: Conceptualization, Investigation, Methodology, Supervision, Writing – original draft, Writing – review & editing. SP: Writing – review & editing. ET: Conceptualization, Investigation, Methodology, Writing – review & editing. DO: Data curation, Formal analysis, Investigation, Writing – original draft. LC: Formal analysis, Writing – original draft. AL: Formal analysis, Writing – original draft. EP: Writing – original draft. RR: Conceptualization, Methodology, Supervision, Writing – original draft, Writing – review & editing.
Funding
The author(s) declare financial support was received for the research, authorship, and/or publication of this article. The research was made possible thanks to the financial contribution of the European Union through the initiative “Understanding and enhancing the preparedness and response to risks of disaster displacement in the Pacific” (Contract number 6000057638, 2010). The project partnership combines: IDMC’s leading expertise on internal displacement data, research, and analysis; the technical and operational capacity of International Organization on Migration in responding to disaster displacement; and Platform on Disaster Displacement’s strength in bringing together policymakers, practitioners, and researchers in a community of practice on disaster-related human mobility. CIMA Research Foundation received funding from IDMC to lead this research.
Conflict of interest
The authors declare that the research was conducted in the absence of any commercial or financial relationships that could be construed as a potential conflict of interest.
Publisher’s note
All claims expressed in this article are solely those of the authors and do not necessarily represent those of their affiliated organizations, or those of the publisher, the editors and the reviewers. Any product that may be evaluated in this article, or claim that may be made by its manufacturer, is not guaranteed or endorsed by the publisher.
Supplementary material
The Supplementary material for this article can be found online at: https://www.frontiersin.org/articles/10.3389/fclim.2024.1345258/full#supplementary-material
Footnotes
1. ^https://floodlist.com/australia/1-dead-hundreds-evacuated-vanuatu-record-rainfall
2. ^https://www.isimip.org/about/#simulation-rounds
4. ^https://www.unitar.org/sustainable-development-goals/united-nations-satellite-centre-unosat/our-portfolio/commonsensing-building-climate-resilience-small-island-nations
References
Abebe, Y. A., Ghorbani, A., Nikolic, I., Vojinovic, Z., and Sanchez, A. (2019a). A coupled flood-agent-institution modelling (CLAIM) framework for urban flood risk management. Environ. Model Softw. 111, 483–492. doi: 10.1016/j.envsoft.2018.10.015
Abebe, Y. A., Ghorbani, A., Nikolic, I., Vojinovic, Z., and Sanchez, A. (2019b). Flood risk management in Sint Maarten – A coupled agent-based and flood modelling method. J. Environ. Manag. 248:109317. doi: 10.1016/j.jenvman.2019.109317
Aerts, J. P. M., Hut, R. W., van de Giesen, N. C., Drost, N., van Verseveld, W. J., Weerts, A. H., et al. (2022). Large-sample assessment of varying spatial resolution on the streamflow estimates of the wflow_sbm hydrological model. HESS 26, 4407–4430. doi: 10.5194/hess-26-4407-2022
Agenais, A. L., Grelot, F., Brémond, P., and Erdlenbruch, K. (2013). Dommages des inondations au secteur agricole. Guide méthodologique et fonctions nationales, IRSTEA, UMR G-EAU «Gestion de l’Eau, Acteurs et Usages», Montpellier, France. Available at: https://hal.inrae.fr/hal-02600061
Ahmad, D., and Afzal, M. (2021). Flood hazards, human displacement and food insecurity in rural riverine areas of Punjab, Pakistan: policy implications. Environ. Sci. Pollut. Res. 28, 10125–10139. doi: 10.1007/s11356-020-11430-7
Alfieri, L., Campo, L., Gabellani, S., Ghizzoni, T., Herold, C., Libertino, A., et al. (2023). The GIRI global flood hazard model (global infrastructure resilience 2023 position paper 2.1). CIMA Foundation: Italy.
Anzellini, V., Desai, B., Fung, V., Ginnetti, J., Milano, L., Montadon, R., et al. (2017). Global disaster displacement risk. A baseline for future work. Geneva, Switzerland: IDMC.
Arcorace, M., Masoero, A., Gabellani, S., Boni, G., and Basso, V. (2019). Evaluating a novel 2D hydro-morphological modelling approach for a rapid estimation of flood extent and water depth: the REFLEX model. 2019th edn. Vienna: Geophysical Research Abstract.
Armah, F. A., Yawson, D. O., Yengoh, G. T., Odoi, J. O., and Afrifa, E. K. A. (2010). Impact of floods on livelihoods and vulnerability of natural resource dependent communities in northern Ghana. Water 2, 120–139. doi: 10.3390/w2020120
Arrighi, C., Rossi, L., Trasforini, E., Rudari, R., Ferraris, L., Brugioni, M., et al. (2018). Quantification of flood risk mitigation benefits: a building-scale damage assessment through the RASOR platform. J. Environ. Manag. 207, 92–104. doi: 10.1016/j.jenvman.2017.11.017
Barrett, S., Steinbach, D., and Addison, S. (2021). Assessing vulnerabilities to disaster displacement: a good practice review. IIED, London.
Birkmann, J., Cardona, O. D., Carreño, M. L., Barbat, A. H., Pelling, M., Schneiderbauer, S., et al. (2013). Framing vulnerability, risk and societal responses: the MOVE framework. Nat. Hazards 67, 193–211. doi: 10.1007/s11069-013-0558-5
Black, R., Adger, W. N., Arnell, N. W., Dercon, S., Geddes, A., and Thomas, D. (2011). The effect of environmental change on human migration. Global Environ. Change. 21, S3–S11. doi: 10.1016/j.gloenvcha.2011.10.001
Bondarenko, M., Kerr, D., Sorichetta, A., and Tatem, A. J. (2020). Census/projectiondisaggregated gridded population datasets, adjusted to match the corresponding UNPD 2020 estimates, for 183 countries in 2020 using built-settlement growth model (BSGM) outputs. WorldPop, University of Southampton. Available at: https://eprints.soton.ac.uk/444005/ (Accessed April 4, 2024).
Cardona, O. D., Ordaz, M., Reinoso, E., Yamín, L. E., and Barbat, A. H. (2012). CAPRA–comprehensive approach to probabilistic risk assessment: international initiative for risk management effectiveness. 15th world conference on earthquake engineering, Lisbon, Portugal.
Chen, Y., Gönül, G., and Wade, H. (2015). Vanuatu renewables readiness assessment. International Renewable Energy Agency. Available at: https://www.irena.org/publications/2015/Jul/Renewables-Readiness-Assessment-Vanuatu
CIESIN (2016). Facebook Connectivity Lab and Center for International Earth Science Information Network–CIESIN–Columbia University. Available at: https://www.ciesin.columbia.edu/data/hrsl/ (Accessed June 30, 2023).
Corugedo, E. F., Gonzalez, A., and Guerson, A. D. (2023). The macroeconomic returns of Investment in Resilience to natural disasters under climate change: A DSGE approach. IMF Working Pap. 2023:A001. doi: 10.5089/9798400243004.001.A001
Cucchi, M., Weedon, G. P., Amici, A., Bellouin, N., Lange, S., Müller Schmied, H., et al. (2020). WFDE5: bias-adjusted ERA5 reanalysis data for impact studies. Earth Syst. Sci. Data 12, 2097–2120. doi: 10.5194/essd-12-2097-2020
Danish Refugee Council. (2023). Global displacement forecast 2023. Available at: https://pro.drc.ngo/media/4c5hxa5c/230310_global_displacement_forecast_report_2023.pdf
Dottori, F., Alfieri, L., Rossi, L., Rudari, R., Ward, P. J., and Zhao, F. (2021). “Global drought and flood: observation, modeling, and prediction” in In the global drought and flood: observation, modeling, and prediction. eds. H. Wu, D. P. Lettenmaier, Q. Tang, and P. J. Ward (Hoboken, United States of America: John Wiley & Sons), 253–270.
European Space Agency. (2017). Climate Change Initiative (ESA-CCI) V2.0.7. European Space Agency. Available at: https://maps.elie.ucl.ac.be/CCI/viewer/download.php
Federal Emergency Management Agency (2010). Dept. of Homeland Security, Mitigation Division, Hazus®-MH Technical Manual. Available at: https://www.fema.gov/sites/default/files/2020-09/fema_hazus_flood-model_technical-manual_2.1.pdf
Fiji Bureau of Statistics (2017). Fiji population and housing census: administration report, Fiji Bureau of Statistics. Suva, Fiji, 2018.. Available at: https://www.statsfiji.gov.fj/index.php/census-2017/894-census-release-3-2018 (Accessed April 4, 2024).
Fӧrster, S., Kuhlmann, B., Lindenschmidt, K.-E., and Bronstert, A. (2008). Assessing flood risk for a rural detention area. Nat. Hazards Earth Syst. Sci. 8, 311–322. doi: 10.5194/nhess-8-311-2008
Ginnetti, J. (2015). Disaster-related displacement risk: Measuring the risk and addressing its drivers, Internal Displacement Monitoring Centre: Norwegian Refugee Council.
Grünthal, G. (1998). “European macroseismic scale 1998 (EMS-98) European seismological commission, sub commission on engineering seismology, working group macroseismic scales” in Conseil de l’Europe, Cahiers du Centre Européen de Géodynamique et de Séismologie, vol. 15 (Luxembourg).
Hawker, L., Uhe, P., Paulo, L., Sosa, J., Savage, J., Sampson, C., et al. (2022). A 30 m global map of elevation with forests and buildings removed. Environ. Res. Lett. 17:024016. doi: 10.1088/1748-9326/ac4d4f
Hengl, T., Mendes de Jesus, J., Heuvelink, G. B., Ruiperez Gonzalez, M., Kilibarda, M., Blagotić, A., et al. (2017). SoilGrids250m: global gridded soil information based on machine learning. PLoS One 12:e0169748. doi: 10.1371/journal.pone.0169748
Hersbach, H., Bell, B., Berrisford, P., Hirahara, S., Horányi, A., Muñoz-Sabater, J., et al. (2020). The ERA5 global reanalysis. Q. J. R. Meteorol. Soc. 146, 1999–2049. doi: 10.1002/qj.3803
Hossain, B., Shi, G., Ajiang, C., Sarker, N. I., Sohel, S., Sun, Z., et al. (2022). Climate change induced human displacement in Bangladesh: implications on the livelihood of displaced riverine island dwellers and their adaptation strategies. Front. Psychol. 13:964648. doi: 10.3389/fpsyg.2022.964648
Huizinga, H. J. (2007). Flood damage functions for EU member states. HKV consultants, implemented in the framework of the contract #382442-F1SC awarded by the European Commission–Joint Research Centre.
Huizinga, J., De Moel, H., and Szewczyk, W. (2017). Global flood depth-damage functions: Methodology and the database with guidelines, EUR 28552 EN, Publications Office of the European Union, Luxembourg, 2017.
Intergovernmental Panel on Climate Change (2012). Glossary of terms. In Managing the Risks of Extreme Events and Disasters to Advance Climate Change Adaptation. Available at: http://goo.gl/WszLzM, A Special Report of Working Groups I and II of the IPCC, pp. 555–564.
Intergovernmental Panel on Climate Change (2023). “Climate change 2023: synthesis report” in A report of the intergovernmental panel on climate change. Contribution of working groups I, II and III to the sixth assessment report of the intergovernmental panel on climate change. eds. C. W. Team, H. Lee, and J. Romero (Geneva, Switzerland: IPCC).
Internal Displacement Monitoring Centre (2017). Global disaster displacement risk – a baseline for future work, Thematic Report, 2017. Available at: https://www.internal-displacement.org/publications/global-disaster-displacement-risk-a-baseline-for-future-work
Internal Displacement Monitoring Centre (2019). Disaster Displacement. A global review, 2008–2018, Thematic Report. Geneva, Switzerland. Available at: https://api.internal-displacement.org/sites/default/files/publications/documents/201905-disaster-displacement-global-review-2008-2018.pdf (Accessed April 4, 2024).
Internal Displacement Monitoring Centre (2020). Pacific Displacement: Fiji Sudden-Onset Disasters and Displacement Risk. Available at: https://reliefweb.int/report/fiji/pacific-displacement-fiji-sudden-onset-disasters-and-displacement-risk (Accessed November 21, 2023).
Internal Displacement Monitoring Centre (2022). GRID 2022 – Global Report on Internal Displacement, 2022. Available at: https://www.internal-displacement.org/global-report/grid2022/
Internal Displacement Monitoring Centre (2023). Global Internal Displacement Database. Available at: https://www.internal-displacement.org/database/displacement-data (Accessed October 1, 2022).
International Labour Organization. (2022) “ILO modelled estimates database” ILOSTAT. Available at: https://ilostat.ilo.org/data/.
International Organization for Migration (IOM) (2022). Displacement Tracking Matrix. Available at: https://dtm.iom.int/.
Kam, P. M., Aznar-Siguan, G., Schewe, J., Milano, L., Ginnetti, J., Willner, S., et al. (2021). Global warming and population change both heighten future risk of human displacement due to river floods. Environ. Res. Lett. 16:044026. doi: 10.1088/1748-9326/abd26c
Kam, P. M., Ponserre, S., Kropf, C. M., and Bresch, D. N. (2023). Risk modelling for human displacement: what we’ve learnt and what’s next? Abstract in EGU Gen. Assembly 2023, 24–28. doi: 10.5194/egusphere-egu23-13206
Kniveton, D., Smith, C., and Wood, S. (2011). Agent-based model simulations of future changes in migration flows for Burkina Faso, global environmental change 21, S34–S40. doi: 10.1016/j.gloenvcha.2011.09.006
Kuleshov, Y., Gregory, P., Watkins, A. B., and Fawcett, R. J. B. (2020). Tropical cyclone early warnings for the regions of the southern hemisphere: strengthening resilience to tropical cyclones in small island developing states and least developed countries. Nat. Hazards 104, 1295–1313. doi: 10.1007/s11069-020-04214-2
Lagomarsino, S., and Giovinazzi, S. (2006). Macroseismic and mechanical models for the vulnerability and damage assessment of current buildings. Bull. Earthq. Eng. 4, 415–443. doi: 10.1007/s10518-006-9024-z
Lange, S. (2019): WFDE5 over land merged with ERA5 over the ocean (W5E5). V. 1.0. GFZ Data Services.
Li, J., Chen, H., Xu, C. Y., Li, L., Zhao, H., Huo, R., et al. (2022). Joint effects of the DEM resolution and the computational cell size on the routing methods in hydrological modelling. Water 14:797. doi: 10.3390/w14050797
Li, A., Toll, M., and Bentley, R. (2023). Mapping social vulnerability indicators to understand the health impacts of climate change: a scoping review. Lancet Planet. Health. 7, E925–E937. doi: 10.1016/S2542-5196(23)00216-4
Malgwi, M. B., Fuchs, S., and Keiler, M. (2020). A generic physical vulnerability model for floods: review and concept for data-scarce regions. Nat. Hazards Earth Syst. Sci. 20, 2067–2090. doi: 10.5194/nhess-20-2067-2020
Martin, S., Singh, L., Taylor, A., and Wahedi, L. (2021). Dynamic model of displacement. PsyArXiv. doi: 10.31234/osf.io/mb9zt
Mazzorana, B., Simoni, S., Scherer, C., Gems, B., Fuchs, S., and Keiler, M. (2014). A physical approach on flood risk vulnerability 810 of buildings, Hydrol. Earth Syst. Sci. 18, 3817–3836. doi: 10.5194/hess-18-3817-2014
Mester, B., Frieler, K., and Schewe, J. (2023). Human displacements, fatalities, and economic damages linked to remotely observed floods. Sci Data 10:482. doi: 10.1038/s41597-023-02376-9
Mühlhofer, E., Koks, E. E., Kropf, C. M., Sansavini, G., and Bresch, D. N. (2023). A generalized natural hazard risk modelling framework for infrastructure failure cascades. Reliability Eng. Syst. Saf. 234:109194. doi: 10.1016/j.ress.2023.109194
Nobre, A. D., Cuartas, L. A., Hodnett, M., Rennó, C. D., Rodrigues, G., Silveira, A., et al. (2011). Height Above the Nearest Drainage – a hydrologically relevant new terrain model. J. Hydrol. 404, 13–29, doi: 10.1016/j.jhydrol.2011.03.051
OCHA (2022). Humanitarian Data Exchange. Available at: https://data.humdata.org/.
OpenStreetMap (OSM). (2020). Available at: https://www.openstreetmap.org/ (Accessed January 8, 2022).
Pacific Catastrophe Risk Assessment and Financing Initiative. (2015). Fiji and Vanuatu country note. Available at: https://pcric.org/where-we-work/countrynotes/
Pekel, J., Cottam, A., Gorelick, N., and Belward, A. (2016). Global surface water-data access. Nature. 418–422. doi: 10.1038/nature20584
Přívara, A., and Přívarová, M. (2019). Nexus between Climate Change, Displacement and Conflict: Afghanistan Case. Sustainability 11:5586. doi: 10.3390/su11205586
Romali, N. S., Sulaiman, M. A. K., Yusop, Z., and Ismail, Z. (2015). “Flood damage assessment: a review of flood stage–damage function curve” in ISFRAM 2014. eds. S. Abu Bakar, W. Tahir, M. Wahid, S. Mohd Nasir, and R. Hassan (Singapore: Springer).
Rossi, L., Wens, M., De Moel, H., Cotti, D., Sabino Siemons, A.-S., Toreti, A., et al. (2023). Barbosa P.-European drought risk atlas, publications Office of the European Union, Luxembourg, JRC135215. doi: 10.2760/608737
Rudari, R., Silvestro, F., Campo, L., Rebora, N., Boni, G., and Herold, C. (2015). Improvement of the global flood model for the GAR (Global Assessment Report) 2015, Geneva, Switzerland: UN Publication. Available at: https://www.undrr.org/publication/improvement-global-food-model-gar-2015 (Accessed April 4, 2024).
Schiavina, M., Melchiorri, M., and Pesaresi, M. (2022). GHS-SMOD R2022A-GHS settlement layers, application of the degree of urbanisation methodology (stage I) to GHS-POP R2022A and GHS-BUILT-S R2022A, multitemporal (1975-2030) - OBSOLETE RELEASE. European Commission, Joint Research Centre (JRC) [Dataset]. Available at: http://data.europa.eu/89h/4606d58a-dc08-463c-86a9-d49ef461c47f (Accessed October 1, 2022).
Shrestha, B. B., Akiyuki Kawasaki, A., and Zin, W. W. (2021). Development of flood damage functions for agricultural crops and their applicability in regions of Asia. J. Hydrol. 36:100872. doi: 10.1016/j.ejrh.2021.100872
Silvestro, F., Ercolani, G., Gabellani, S., Giordano, P., and Falzacappa, M. (2021). Improving real-time operational streamflow simulations using discharge data to update state variables of a distributed hydrological model. Hydrol. Res. 52, 1239–1260. doi: 10.2166/nh.2021.162
Silvestro, F., Gabellani, S., Delogu, F., Rudari, R., and Boni, G. (2013). Exploiting remote sensing land surface temperature in distributed hydrological modelling: the example of the continuum model. Hydrol. Earth Syst. Sci. 17, 39–62. doi: 10.5194/hess-17-39-2013
Smith, C. D. (2014). Modelling migration futures: development and testing of the rainfalls agent-based migration model–Tanzania. Clim. Dev. 6, 77–91. doi: 10.1080/17565529.2013.872593
Thalheimer, L., and Oh, W. S. (2023). An inventory tool to assess displacement data in the context of weather and climate-related events. Clim. Risk Manag. 40:100509. doi: 10.1016/j.crm.2023.100509
The NANSEN Initiative (2015): Agenda for the protection of cross-border displaced persons in the context of disasters and climate change. Available at: https://disasterdisplacement.org/wp-content/uploads/2015/02/PROTECTION-AGENDA-VOLUME-1.pdf
Tyagunov, S., Grünthal, G., Wahlström, R., Stempniewski, L., and Zschau, J. (2006). Seismic risk mapping for Germany. Nat. Hazards Earth Syst. Sci. 6, 573–586. doi: 10.5194/nhess-6-573-2006
UNGA (2016). United Nations general assembly, report of the open-ended intergovernmental expert working group on indicators and terminology relating to disaster risk reduction, 2016, seventy-first session, Agenda Item 19. Available at: https://digitallibrary.un.org/record/852089?ln=en
UNHCR (2022). United Nations High Commissioner for Refugees (UNHCR), Global Trends – Forced Displacement in 2022. Available at: https://www.unhcr.org/global-trends-report-2022 (Accessed January 8, 2024).
United Nations, Department of Economic and Social Affairs, Population Division (2017). Household Size and Composition Around the World 2017 – Data Booklet (ST/ESA/SER.A/405). United Nations, New York: Working Paper.
United Nations Office for Disaster Risk Reduction (2015). Sendai Framework for Disaster Risk Reduction 2015–2030. Available at: https://www.undrr.org/publication/sendai-framework-disaster-risk-reduction-2015-2030 (Accessed June 1, 2023).
Vanuatu National Statistics Office (2020). Secretariat of the Pacific community (SPC), United Nations Population Fund (UNFPA). Vanuatu population and housing census 2020.
Vestby, J., Schutte, S., Tollefsen, A. F., and Buhaug, H. (2024). Societal determinants of flood-induced displacement. PNAS 121:e2206188120. doi: 10.1073/pnas.2206188120
Ward, P. J., Jongman, B., Salamon, P., Simpson, A., Bates, P., De Groeve, T., et al. (2015). Usefulness and limitations of global flood risk models. Nat. Clim. Chang. 5, 712–715. doi: 10.1038/nclimate2742
Weedon, G. P., Balsamo, G., Bellouin, N., Gomes, S., Best, M. J., and Viterbo, P. (2014). The WFDEI meteorological forcing data set: WATCH forcing data methodology applied to ERA-interim reanalysis data. Water Resour. Res. 50, 7505–7514. doi: 10.1002/2014wr015638
Weir, T., Kumar, R., and Ngari, A. (2021). Interdecadal modulation of the effect of ENSO on rainfall in the southwestern Pacific. J. Southern Hemisphere Earth Syst. Sci. 71, 53–65. doi: 10.1071/ES19053
World Bank (2022). World Development Indicators. http://data.worldbank.org/data-catalog/world-development-indicators
World Health Organization (2009). World Health Organization guidelines for indoor air quality: dampness and mould. Available at: https://www.who.int/publications/i/item/9789289041683
You, L., Wood, S., Wood-Sichra, U., and Wu, W. (2014). Generating global crop distribution maps: from census to grid. Agric. Syst. 127, 53–60. doi: 10.1016/j.agsy.2014.01.002
Keywords: probabilistic risk assessment, flood displacement, displacement risk, displacement vulnerability, Fiji and Vanuatu
Citation: Rossi L, Ponserre S, Trasforini E, Ottonelli D, Campo L, Libertino A, Panizza E and Rudari R (2024) A new methodology for probabilistic flood displacement risk assessment: the case of Fiji and Vanuatu. Front. Clim. 6:1345258. doi: 10.3389/fclim.2024.1345258
Edited by:
Gabriele Standardi, Ca’ Foscari University of Venice, ItalyReviewed by:
Jeremy Pal, Ca’ Foscari University of Venice, ItalyLukas Riedel, ETH Zürich, Switzerland
Copyright © 2024 Rossi, Ponserre, Trasforini, Ottonelli, Campo, Libertino, Panizza and Rudari. This is an open-access article distributed under the terms of the Creative Commons Attribution License (CC BY). The use, distribution or reproduction in other forums is permitted, provided the original author(s) and the copyright owner(s) are credited and that the original publication in this journal is cited, in accordance with accepted academic practice. No use, distribution or reproduction is permitted which does not comply with these terms.
*Correspondence: Lauro Rossi, bGF1cm8ucm9zc2lAY2ltYWZvdW5kYXRpb24ub3Jn