 Fernando Esteves
 Edmundo Molina-Perez
 Nidhi Kalra3
 James Syme
 Adrien Vogt-Schilb
- 1Pardee RAND Graduate School, Santa Monica, CA, United States
- 2Tecnologico de Monterrey, Escuela de Ciencias Sociales y Gobierno, Monterrey, Mexico
- 3RAND Corporation, Santa Monica, CA, United States
- 4Inter-American Development Bank, Washington, DC, United States
This study employs an Input–Output simulation model to assess the potential employment effects resulting from investments in 40 sector-specific decarbonization transformations across Latin America and the Caribbean. Using a Multi-region Input–Output framework (Eora26), our findings indicate that investments in energy production and buildings sectors offer promising job creation opportunities, averaging 5.5 total jobs per $1 million invested. Similarly, in the waste, industry and agriculture, forestry, and land use sectors demonstrate significant potential, yielding approximately 5 total jobs per $1 million. The analysis models investments as demand vectors, producing results for 17 countries in the region. These estimates endogenize the diverse economic structure and state of development of these countries. We argue that country-level analysis is needed to identify climate strategies that maximize job creation while achieving net-zero emissions.
1 Introduction
Latin America and the Caribbean (LAC) region should undertake significant economic adjustments across all sectors to align with the goals of the Paris Agreement and achieve net-zero greenhouse gas (GHG) emissions by 2050. Climate change is already inflicting substantial economic losses in the region, marked by an increasing incidence of floods, prolonged droughts, coastal erosion, and other environmental imbalances (Reyer et al., 2017; Brassiolo et al., 2023). These phenomena are likely to worsen without coordinated mitigation efforts within and between countries. Moreover, factors such as poor air quality, healthcare costs, disaster displacement, and heatwaves are already impacting millions of people worldwide. These issues are part of a broader spectrum of climate change costs associated with GHG emissions, disproportionately affecting disadvantaged groups.
To shed light on the additional economic benefits of decarbonizing the economies in Latin America and the Caribbean (LAC) and provide insights to policymakers regarding climate investment strategies, this paper focuses on the estimation of country-level direct and indirect employment effects through shifting public and private investments to a set of decarbonization actions (transformations). These transformations are defined within SiSePuede,1 a greenhouse gas emission, cost, and benefit analytical framework, which integrates Decision Making Under Deep Uncertainty (DMDU) methods to evaluate the robustness of different future scenarios (Kalra et al., 2023). The transformations are grouped following the UN IPCC economic sector classification.2 Our approach draws from Garrett-Peltier’s (2017) alternative method of constructing demand vectors to model the economic effects of investments, applied within the Eora26 global Multi-Region Input–Output table (MRIO) framework, which provides extensive data on products and services flows within and between countries.
Our findings suggest there is potential for inclusive economic transformation through decarbonization strategies in the Latin America and the Caribbean region, with job creation as a key benefit of transitioning to a net-zero economy. On average, investments in policy transformations linked to energy production and buildings are the most promising in terms of job generation potential in the region (5.5 total jobs/$1 million). These are followed by sectoral actions in the waste, industry, and agriculture, forestry, and land use sectors (~5 total jobs/$1 million). Although the region’s average employment multipliers for all groups are quite similar and fall below the threshold of 6 total jobs per $1 million, the range of estimates reveals how policy transformations can yield diverse outcomes due to varying economic structures and industrial sector dynamics across countries in Latin America and the Caribbean. While prior research has investigated the employment implications of increased spending on decarbonization initiatives in Latin America and the Caribbean (IDB, DDPLAC, 2019; Saget et al., 2020), as well as sector-specific impact assessments in other regions (Dell’Anna, 2021; Kim and Mohommad, 2022), this paper focuses on providing country-specific estimates of medium and short-term employment gains within the context of integrated climate strategies in LAC. Given the diverse economic structures and internal capacities of countries in the region, country-level inputs are required to tailor national decarbonization strategies.
This study seeks to provide insights into the job creation potential of decarbonizing the economies in the region, rather than focusing on precise employment multiplier estimations. The findings of this paper provide new country-specific insights into the potential synergies between economic growth and the climate agenda, which is a valuable tool for navigating the complex political economy surrounding the climate initiatives (Furceri et al., 2023) and laying the groundwork for essential reforms in Latin American countries. However, the main limitation of our results is the inherent assumptions of static economic structure within Input–Output models, rendering them more suitable for medium and short-term projections. These conditions may limit the coordination of actions to address traditional development challenges, alongside climate goals. The paper is structured as follows: Section 2 details the I-O analysis, the alternative approach utilized, and the Multi-Region Input–Output table dataset; Section 3 discusses the employment multiplier results and the differences across sectors and economic structures; and section 4 presents the study’s discussions and conclusions.
2 Materials and methods
2.1 Input–output analysis and data
Input–output (I-O) analysis is an established analytical framework in quantitative economic research. Building on the seminal works of Leontief (1936, 1941), it comprises a system of linear equations that offers a structured and comprehensive overview of how different sectors of an economy are interrelated (Miller and Blair, 2022). It can map the flows of products and services at multiple levels of sector and geographical disaggregation (e.g., nation, state) in the economy for a given year, along with their utilization as inputs by other industries or consumption by final demand (e.g., household consumption, net exports). Non-industrial inputs to production, such as wages and interest on capital, are also accounted for in the Value-Added block. The widespread use and popularity of I-O models as economic analysis tools can be attributed to their minimal assumptions, ease of use, replicability, and transparency, as well as their reliance on national accounts and statistics.
The increased challenge of modeling spatially separated consumption and production and the necessity to account for the multiple transactions between trade partners with distinct production technologies, led to the development of Multi-Region Input–Output table (MRIO) frameworks. Moreover, the growing relevance for international climate policy to quantify the economic and environmental trade connections between countries and supporting the consumption-base accounting3 perspective (Peters, 2008; Peters and Hertwich, 2008; Wiedmann, 2009) prompted the development of several MRIO data sets with specific methodological characteristics, properties, and limitations (e.g., Eora, GTAP, and WIOD).4
This paper relies on a 26-sector harmonized MRIO model (Eora26)5 to calculate both the direct and indirect employment effects resulting from shifting investments to the transformations proposed in 17 out of 18 Latin American countries covered in SiSePuede.6 The standardized sector classification allows for cross-country comparisons, contributing to one of the primary objectives of this study: to estimate heterogenous impacts based on different economic structures and, consequently, informing the most promising strategies for job creation in each country. However, we acknowledge an anticipated loss of information in the aggregation process when transitioning from the higher sectoral resolution of the full Eora database7 (which is not comparable across countries) to Eora26.
Eora26’s Supply-use tables8 (SUTs) offer a detailed overview of the transactions involving goods and services among industries and final use in 189 countries covered. Through a series of algebraic transformations, we extract critical input–output (I-O) tables for our analysis. These tables include the ‘direct requirements’ table (A) and the ‘total requirements’ table (L). The former reveals the production recipes by each sector, indicating the amount of intermediate inputs required to produce $1 worth of output in a sector. The latter, also known as the “Leontief Inverse matrix,” illustrates the backward linkages or output multiplier for each industry, showing how the production in one industry depends on suppliers in other industries (Bivens, 2019). It’s important to note that the SUTs and associated data are sourced from 2016 and are presented in basic prices.
2.2 SiSePuede transformations and employment multipliers
SiSePuede is a greenhouse gas emissions, cost, and benefit simulation model (Kalra et al., 2023). It defines and assesses the impact of 70 policy transformations addressing sectoral and country-specific measures, considering the social costs, benefits, and a range of implementation levels. The economic sectors considered are based on the United Nations Intergovernmental Panel on Climate Change (IPCC) methodology (IPCC, 2006, 2019), and includes agriculture, industry, buildings, transport, waste, and energy production. By constructing and simulating multiple scenarios that encompass various future possibilities and uncertainties, the outputs of SiSePuede provide valuable insights for informing climate policy. These insights are grounded in the assessment of the robustness and feasibility of decarbonization strategies designed to achieve net-zero emissions in the Latin America and the Caribbean region by 2050.
The transformations in agriculture, forests, and other land use reduce emissions through a range of actions. These include halting deforestation, enhancing crop production practices (e.g., efficient fertilizer application, increase productivity), rehabilitating degraded areas, and the adoption of new livestock management practices (e.g., manure management). Additionally, by boosting agricultural productivity while decreasing demand of animal-based products (primarily beef), the actions are expected to reduce the need for cropland and pastureland and facilitate their restoration to forests over time. In industry, the transformations involve enhancing materials efficiency, especially in cement and steel production, substituting materials (e.g., waste for virgin materials), improving industrial energy efficiency, and transitioning from fossil fuels to electricity and hydrogen derived from renewables. Efforts are also directed toward capturing and eliminating remaining emissions (e.g., HFCs, PFCs, nitrous oxide). In transport, decarbonization initiatives in the transportation sector include shifting road transport, rail, and maritime shipping to electricity and hydrogen, alongside promoting increased public transit usage for passenger transport.
In the waste sector, emission reductions result from improvements in domestic and industrial solid waste management, expanding industrial and domestic wastewater treatment and sanitation access, and increased biogas capture from waste facilities. Building emission reductions are achieved by enhancing residential, commercial, and municipal buildings’ energy efficiency (e.g., building shells that require less heating/cooling), and fuel switching to electricity from renewable grids. Lastly, in energy production, transformations involve transitioning electricity and hydrogen production to renewable sources, minimizing fugitive emissions and gas leaks, while other sectors improve energy efficiency and phase out fossil fuels.
To shed light on additional economic benefits of the policy transformations defined in SiSePuede, we explore and estimate country-level direct and indirect employment effects resulting from reallocating private and public investments toward these actions. We outline the procedures employed to construct the demand vectors used for modeling investments in this context and explain the methodology for calculating the corresponding employment multipliers. Following Garrett-Peltier’s (2017) approach,9 we define these transformations as weighted averages of the 26 sectors within Eora26’s I-O tables, referred to as ‘synthetic industries’.
The weights are derived from the cost structures present in the climate literature and technical reports’ analyses. The underlying assumption is that the economic activities and input requirements for each transformation are implicitly represented in the Input–Output accounts, enabling this alternative method to capture the economic impacts under specific model assumptions. For instance, in estimating the employment impacts of improving urban wastewater treatment, the demand vector weights are derived from the cost structure of a centralized sewer-based system.10 These weights are determined by the cost distribution of inputs purchased and their respective economic sectors. In this example, the weights are mapped as follows: Electrical & Machinery (39%), Construction (39%), Electricity, Gas and Water (11%), Education, Health, and Other Services (11%).11 For a complete description of all weights used and their corresponding references, please refer to the Appendix A and Supplementary material (Figure 1).12
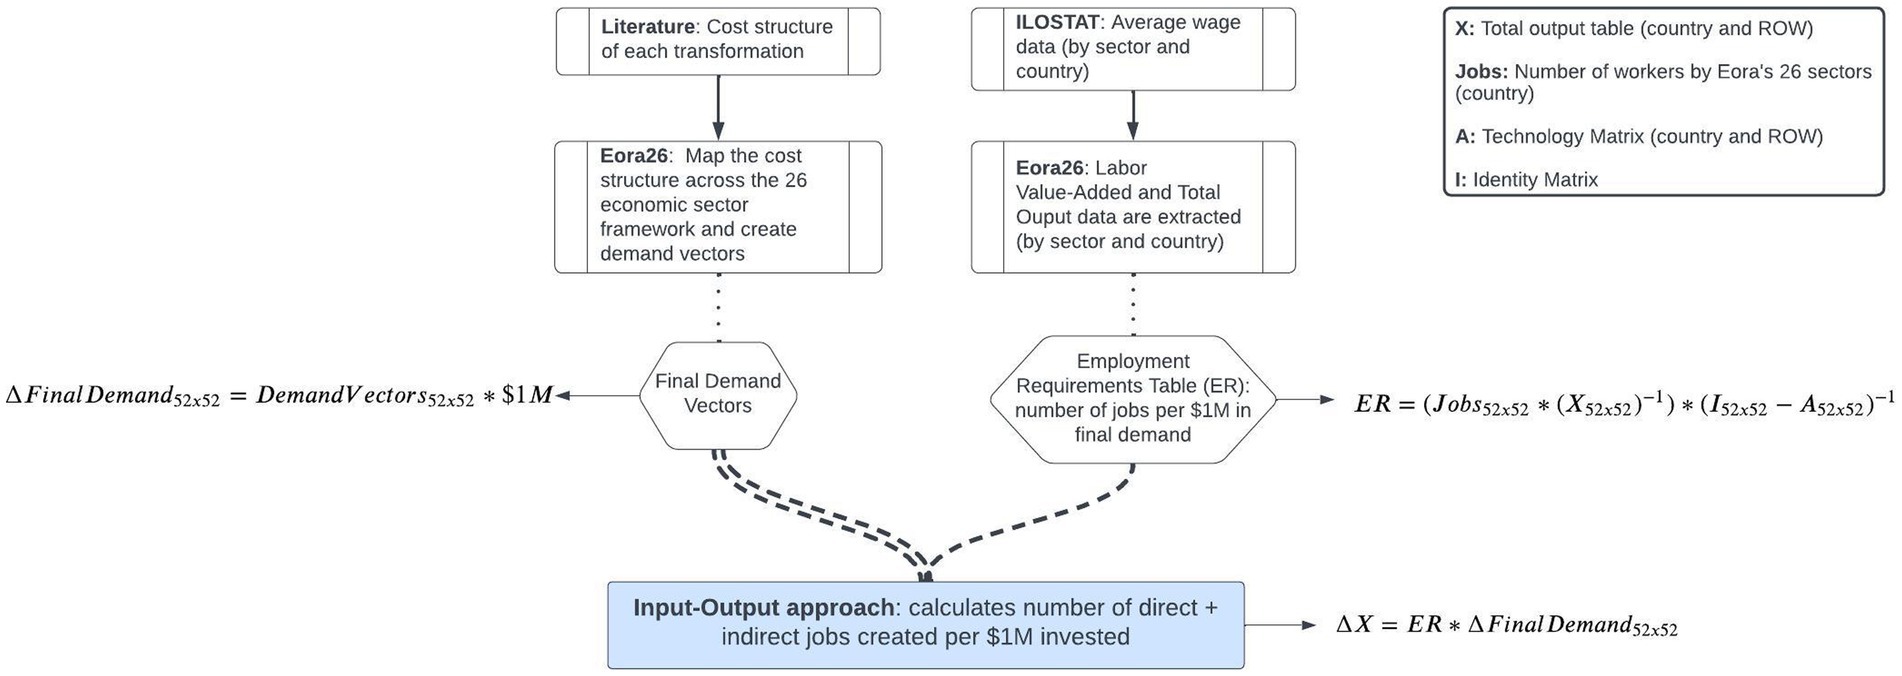
Figure 1. Employment multipliers calculation steps. Source: Developed by the authors.
To compute the employment multipliers in each country, the I-O tables are structured in two blocks, each containing 26 sectors: the domestic market of interest and Rest of the World (ROW) – an aggregate of the country’s trade partners. Equation 1 represents the basic I-O equation and captures the effects on output ( ) resulting from an exogenous variation in final demand ( ). To generate our results in terms of the number of jobs, we create an Employment Requirement (ER) table by post-multiplying Equation 1 with an employment-output matrix, which represents the ratio of the number of workers per unit of output by each country’s industry (Equation 2):
Final demand variation measured in output (Equation 1).
Final demand variation measured in employments (Equation 2)
Source: The authors developed based on Miller and Blair (2022) textbook.
The ER table shows the employment generated directly and indirectly across all industries by $1 million dollars in production of a given industry’s product. As Eora26 does not include workforce data used in its estimations, we combine the labor value-added (compensation of employees) from the I-O tables with average wage data reported by the International Labor Organization (ILO) for each country’s sector. Due to differences in industrial sector classification between Eora26 and ILO, we do not report employment multipliers as full-time equivalents, which is a limitation of our estimates. To ensure transparency and reproducibility, all I-O table procedures, including manipulations and employment multiplier calculations, were documented using the open-source statistical software R and made available in the Supplementary material.
Three primary economic mechanisms influence the magnitude of the Input–Output employment multipliers: (i) labor intensity (ii) wage levels, and (iii) import rates. Labor intensity is associated with the share of labor in value added, which distinguishes job-intensive sectors from capital-intensive ones, as shown in the employment-output matrix. Sectors with higher labor participation in their activities are expected to employ more workers when facing increased demand.13 Regarding wage levels, for a given level of final demand and total payroll, lower average workers’ salaries in an industry increase the ability to expand the workforce, inflating I-O employment multipliers. Imports rates among industries impact the domestic value added by increased output production, both by the primary industry and national supply chain businesses, thereby affecting the magnitude of the domestic economy employment multipliers. All else equal, industries with higher labor intensity, lower average wages, and lower import rates are expected to yield higher employment multipliers in our model. For instance, consider the actions aimed at improving building and appliance efficiency. This transformation is closely associated with the Construction sector, a labor-intensive and heavy material user sector in the Latin America region. Therefore, it yields the highest average job multiplier in the region, according to the results to be presented ahead.
Regarding the Leontief production function employed, several key assumptions are made. These include fixed technical coefficients, fixed proportion of inputs, and fixed prices. The first assumption entails fixed relationships between a sector’s output and its inputs, indicating the absence of economies of scale or presenting constant returns to scale, as formally defined. In short, doubling all inputs results in a doubling of the output. The second assumption establishes that inputs are perfect complements and does not allow for factor substitution. This contrasts with computable general equilibrium (CGE) models that allow for substitution mechanisms based on relative prices. For a given technology, the fixed proportion assumption implies that the industry consistently employs the same ‘recipe’ to generate its output. Finally, the assumption of fixed prices suggests that all production factors are available at a constant price (e.g., input and output prices, wages).14
3 Results
In this section, we present the employment multiplier estimates resulting from the reallocation of investments toward the proposed decarbonization strategies in SiSePuede. We also explore the potential policy implications and opportunities within the Latin America and the Caribbean region (LAC). It is crucial to emphasize that these multipliers are associated with jobs that occur up-front in the investment cycle,15 which primarily drives increased demand within the Construction and Electrical & Machinery sectors (Garrett-Peltier, 2017). We further categorize and discuss the results based on policy transformation groups, subgroups, and individual practices of the 40 actions (including their variations).16 Following SiSePuede’s sector classification, they are divided as follows: agriculture, forestry, and land use, industry, buildings, transport, waste, and energy production–as outlined in Table 1.
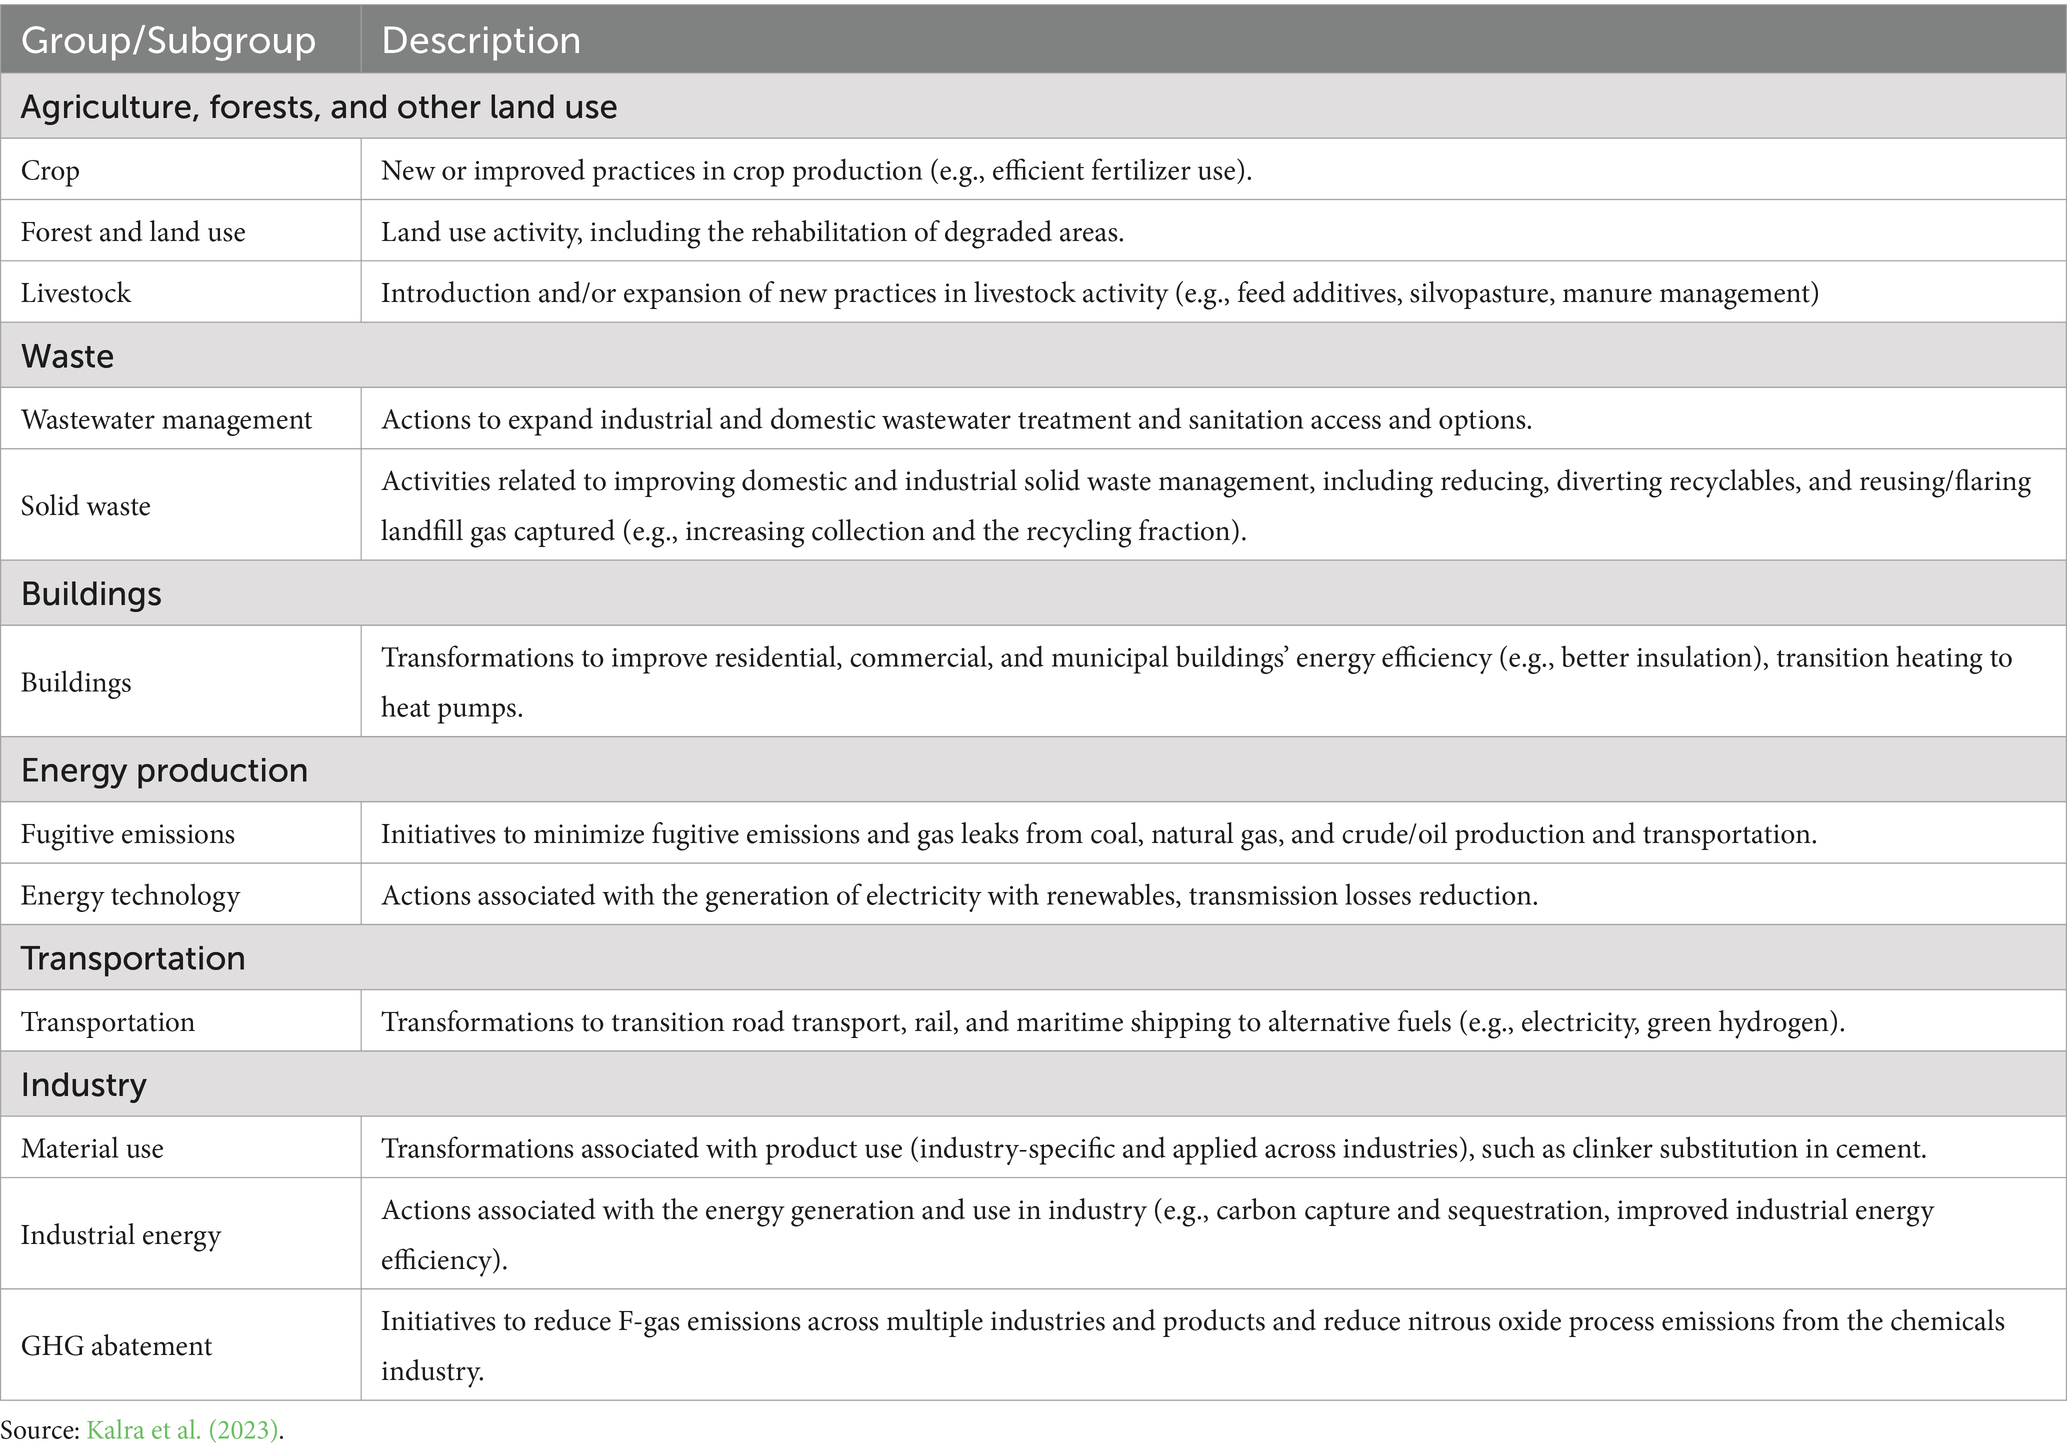
Table 1. SiSePuede policy transformations modeled.
3.1 Employment multipliers and overall results
Our analysis suggests that, on average, investments in the policy transformations linked to energy production and buildings sectors show the most promise in terms of job generation potential in the region (5.5 total jobs/$1 million). These are closely followed by sectoral actions in the waste, industry, and agriculture, forestry, and land use (~5 total jobs/$1 million) – see Chart 1. Although the region’s average employment multipliers for all sectors are quite similar and fall below the 6 total jobs/$1 million threshold, the estimates’ range in Chart 1 reveals how policy transformations can play out differently within the context of considerable heterogeneity in economic structures and industrial sector dynamics across countries in the Latin America region. The high labor intensity and relatively lower wage levels help explain the overall higher average job multipliers estimated in Central America countries within our sample. We describe some of the key findings in the following subsections. Further details and references are available in Appendix A.
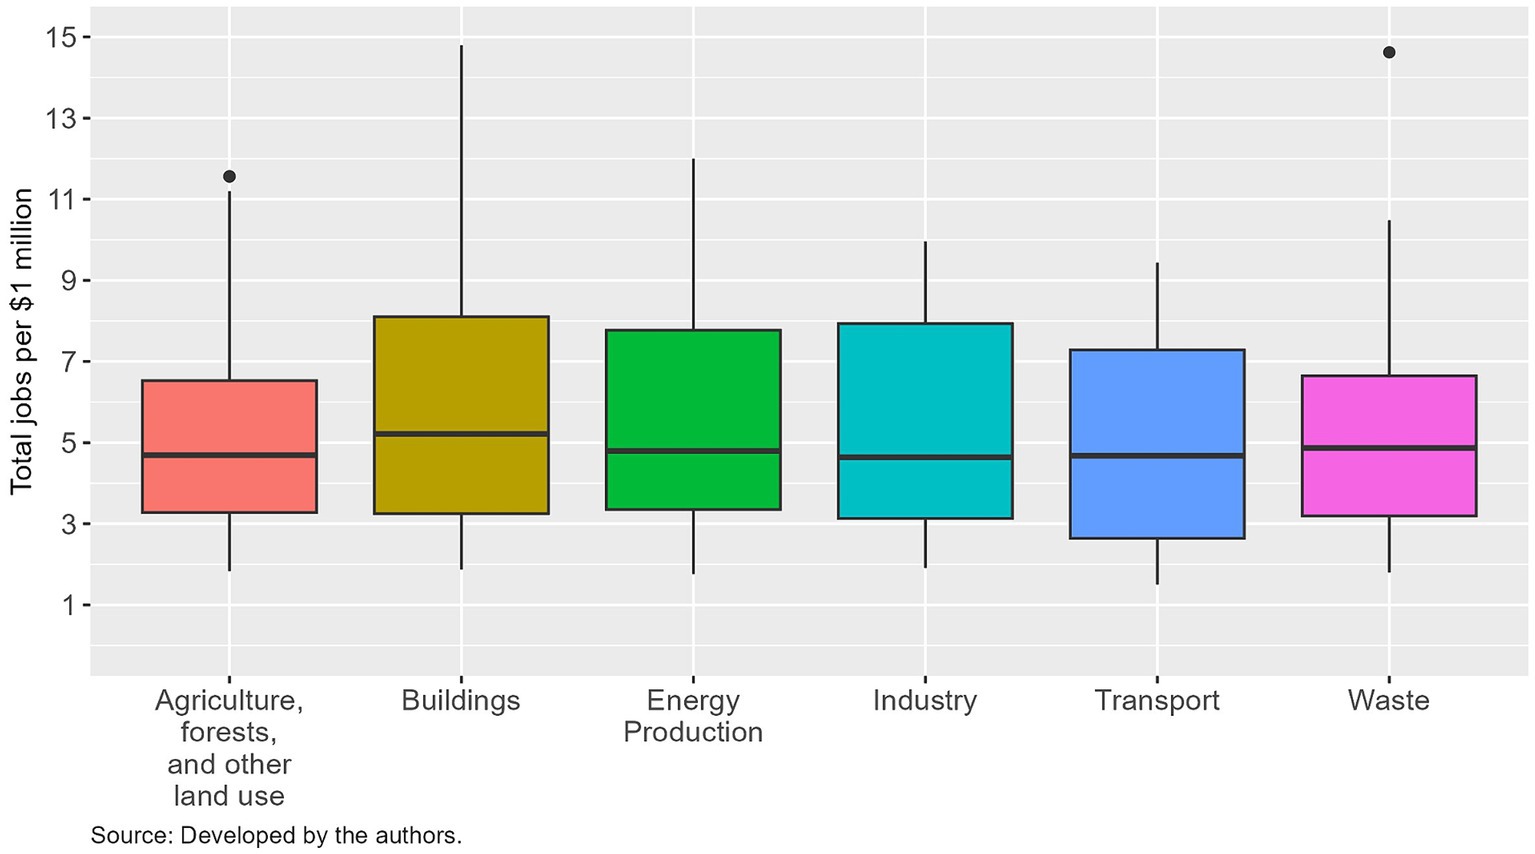
Chart 1. Average employment multipliers in Latin America and the Caribbean.
3.1.1 Agriculture, forests, and other land use
In the modeled transformations, Colombia, Honduras, and Bolivia take on prominent roles in most of the actions. The allocation of resources toward expanding conservation agriculture,17 improving crop productivity, and enhancing rice-growing practices primarily involves investments in the Agriculture and Electrical and Machinery (E&M) sectors within these countries. This allocation holds the potential to create an average of 8.5 total jobs per $1 million. In forest and land use, Brazil joins this group of promising countries, particularly in actions involving the rehabilitation of degraded land and halting deforestation. Collectively, these four countries present a job creation potential averaging 9.4 total jobs per $1 million invested.
Initiatives within livestock, such as reducing enteric fermentation and improving feed conversion, also generate average employment multipliers of 9 total jobs per $1 million within this group. However, countries relying more heavily on imported production inputs, particularly in the E&M sector (e.g., Costa Rica and Panama), tend to yield lower-than-average employment multipliers across the three subcategories previously discussed. Overall, while our model captures lower economic ripple effects in the Agricultural sector compared to E&M, implying fewer indirect jobs stemming from direct ones, the employment potential estimates underscore the region’s competitive agribusiness and its strategic role in fostering sustainable growth. Lastly, while the employment multipliers for Latin America and the Caribbean18 (referred to as “LAC” in Chart 2) appear similar across the three subgroups presented, they vary by country, indicating the distinct impacts based on their economic structure. This underscores one of the key contributions of this paper of providing country-specific estimates that allow for more accurate and individualized policy applications.
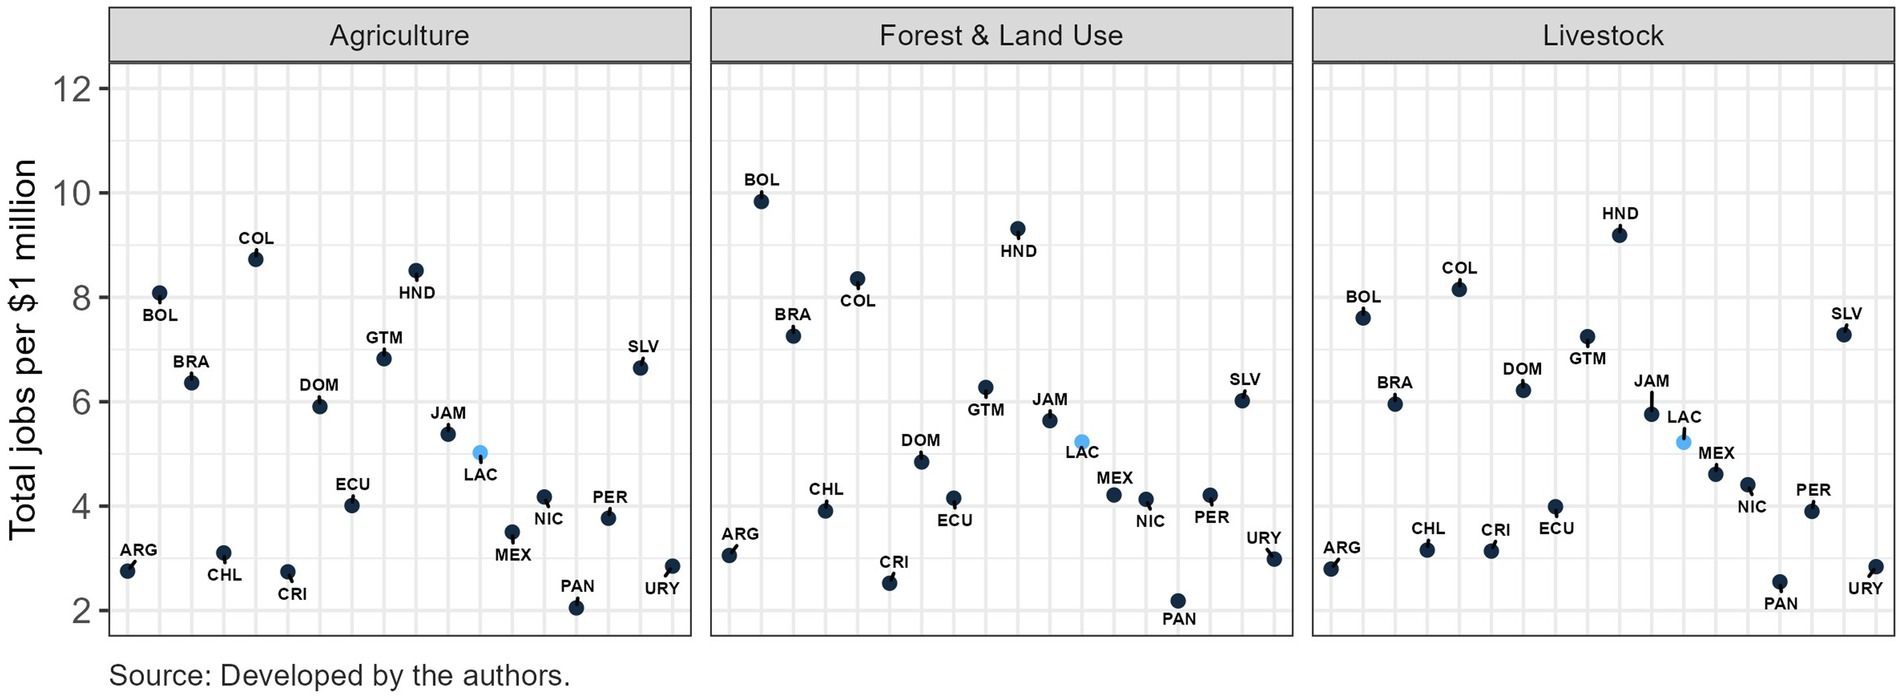
Chart 2. Average employment multipliers: agriculture; forests, and other land use; and livestock.
3.1.2 Waste
Wastewater management emerges as one of the most promising areas in terms of job creation potential across countries in Latin America and the Caribbean. SiSePuede outlines five distinct levels of treatment systems for industrial and domestic wastewater.19 The highest employment multipliers are associated with the enhancement of industrial and domestic wastewater treatment infrastructure, particularly in countries such as Honduras, El Salvador, Guatemala, and Dominican Republic, where the average multiplier stands at 9.3 total jobs per $1 million. Initiatives focused on expanding centralized sewer-based systems and service coverage, especially those aimed at increasing the proportion of wastewater treated to secondary and tertiary levels, represent good opportunities for job creation. Similarly, employment multipliers arising from the development of safe domestic sanitation for both urban and rural population (improved septic tanks and sewerage with proper treatment) yield similar average multipliers (9.2 total jobs/$1 million). Mexico and Honduras present a favorable scenario for job creation, particularly concerning the capture of biogas from wastewater treatment facilities for energy production (7.5 total jobs/$1 million).
The transformations related to solid waste management also offer significant potential for economic dynamism in Latin America and the Caribbean (Correal et al., 2023). Key outcomes include minimizing open dumping and open burning through improved collection service coverage and enhancements to landfills, allowing for methane recovery and increased composting. This leads to average employment multipliers of 7.9 direct and indirect jobs per $1 million invested in countries like Mexico, Honduras, El Salvador, and Brazil. Notably, Brazil demonstrates strong job creation potential due to robust backward linkages within the domestic recycling industry, resulting in 20.4 direct and indirect jobs per $1 million invested (Chart 3).
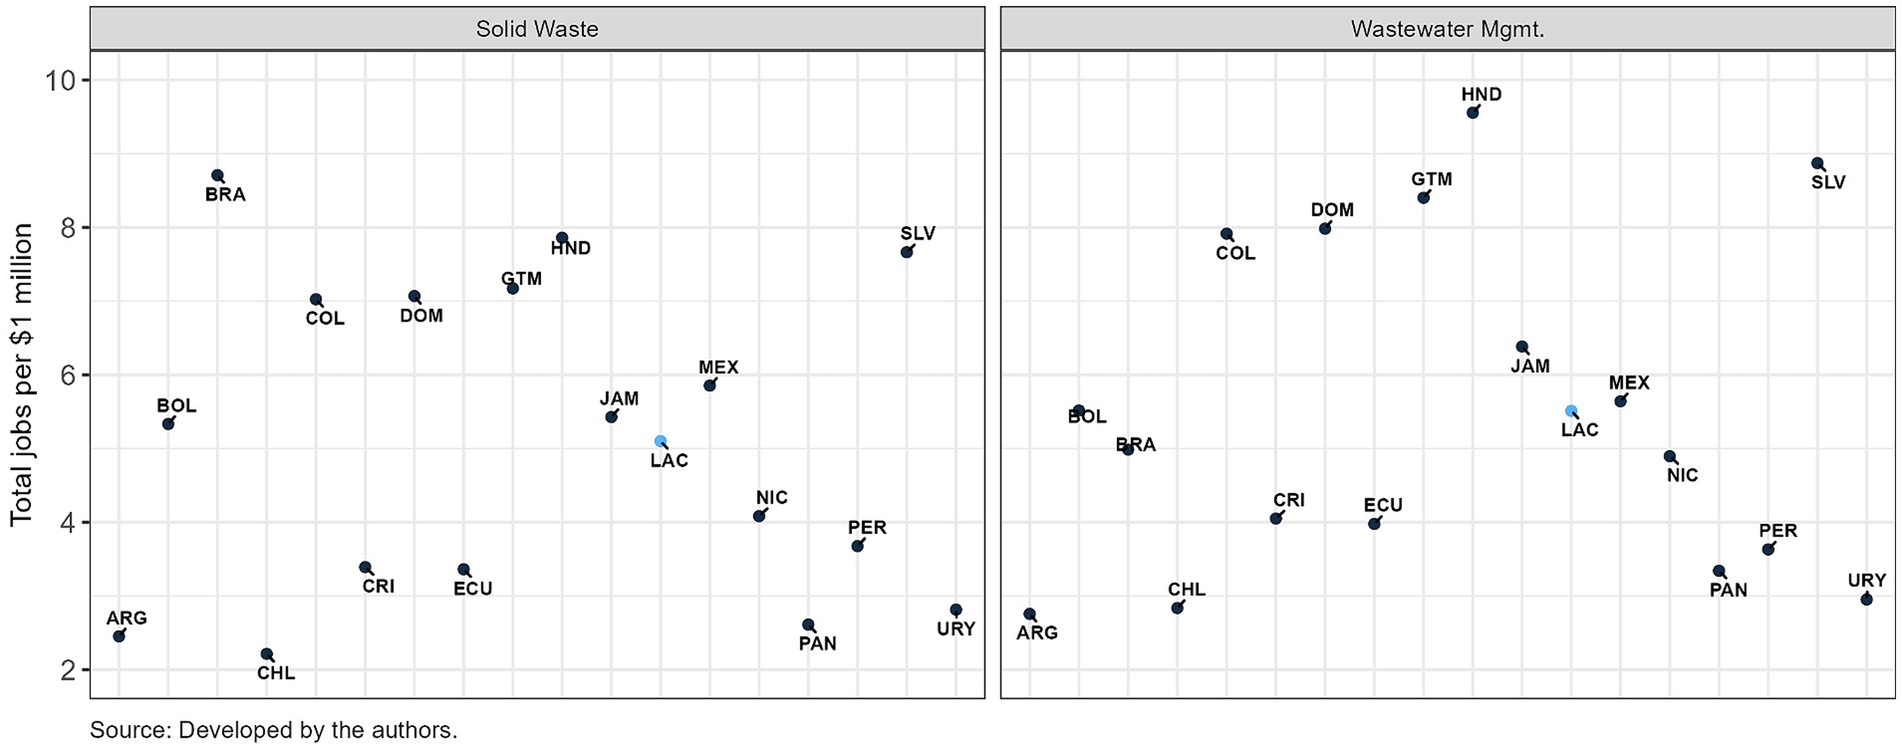
Chart 3. Average employment multipliers: waste.
3.1.3 Buildings
The policy transformations intended to reduce end-use demand for heat energy by enhancing building insulation and transitioning to electrical heating through retrofitting (e.g., electric stoves) yield strong average employment multipliers. This is especially relevant for connections with the Construction Sector, a major contributor to both direct and indirect job opportunities. Driven by labor intensity and relatively lower wage levels, most Central American countries in our sample exhibit high average job multipliers, averaging approximately 10 total jobs per $1 million. Bolivia and Colombia also demonstrate substantial potential for job creation, with average multipliers of 6 and 8 total jobs per $1 million across different actions, respectively. Appendix A contains additional information on job multipliers in the sector (Chart 4).
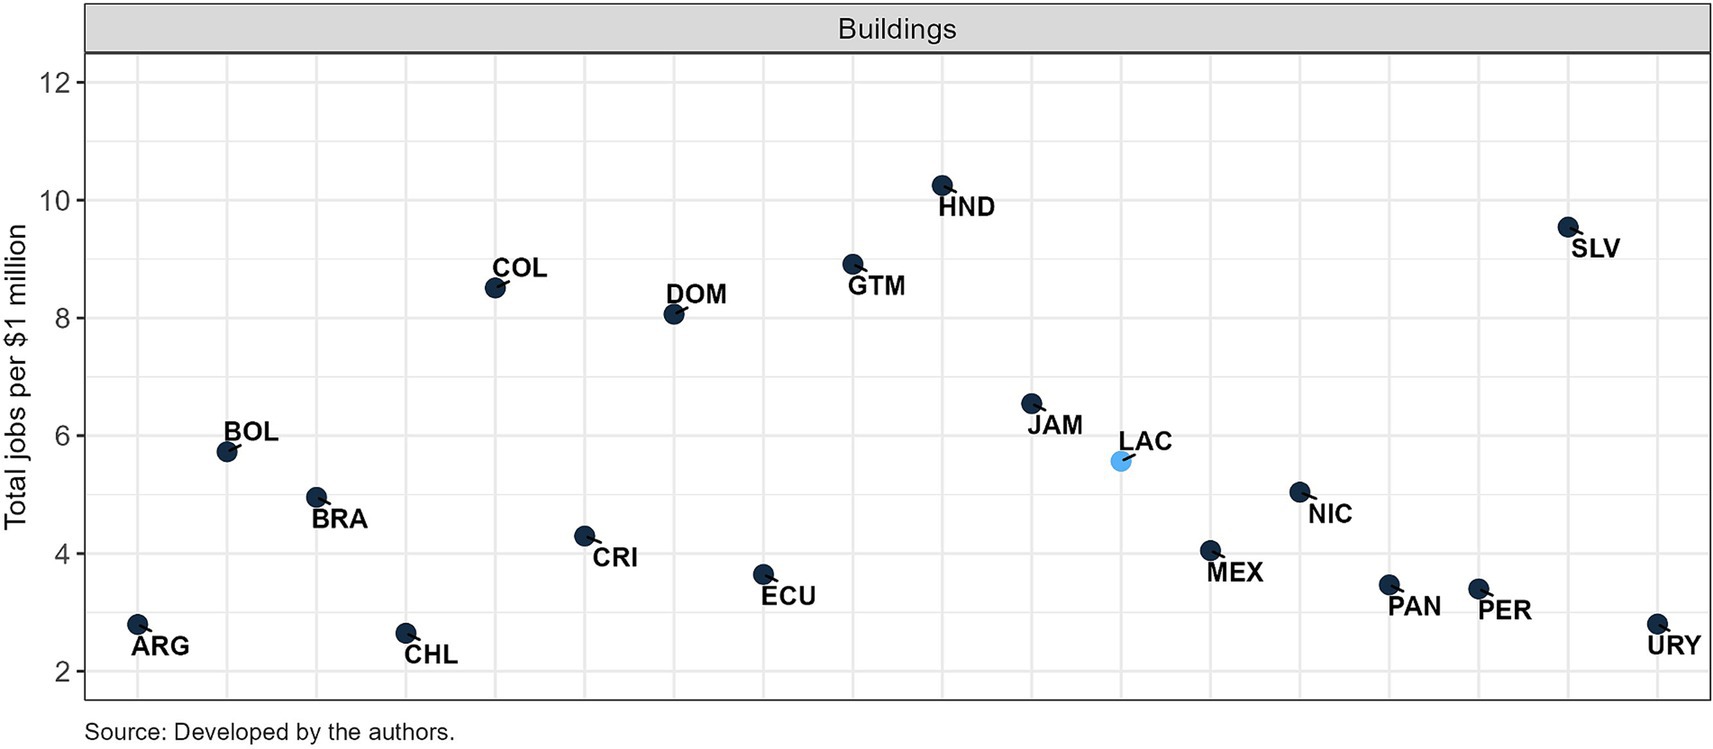
Chart 4. Average employment multipliers: buildings.
3.1.4 Energy production
The energy sector, a key driver in the global decarbonization effort (IEA, 2023b), presents numerous opportunities to advance the climate agenda through the policy transformations outlined in SiSePuede. Within energy technology, activities focusing on reducing transmission losses involve the upgrade and enhancement of transmission and distribution infrastructure. These investments primarily concentrate within the Electrical & Machinery (E&M) sector, resulting in average multipliers of 7 total jobs per $1 million within the upper half of the 17 countries in our sample. The transformations designed to minimize and flaring fugitive emissions from fossil fuel operations represent another notable opportunity for job creation. Existing practices, including the upgrade of leaky equipment and leak detection programs, can be effectively implemented. Countries such as Colombia, Bolivia, Honduras, and El Salvador exhibit average multipliers of 8 direct and indirect jobs per $1 million invested. In general, our model identifies a mixed potential for job creation in electrification powered by renewables or the current energy grid. Based on the magnitude of the multipliers, it does not suggest a dominant employment strategy. Appendix A section provides further details on the remaining job multipliers estimated for this sector (Chart 5).
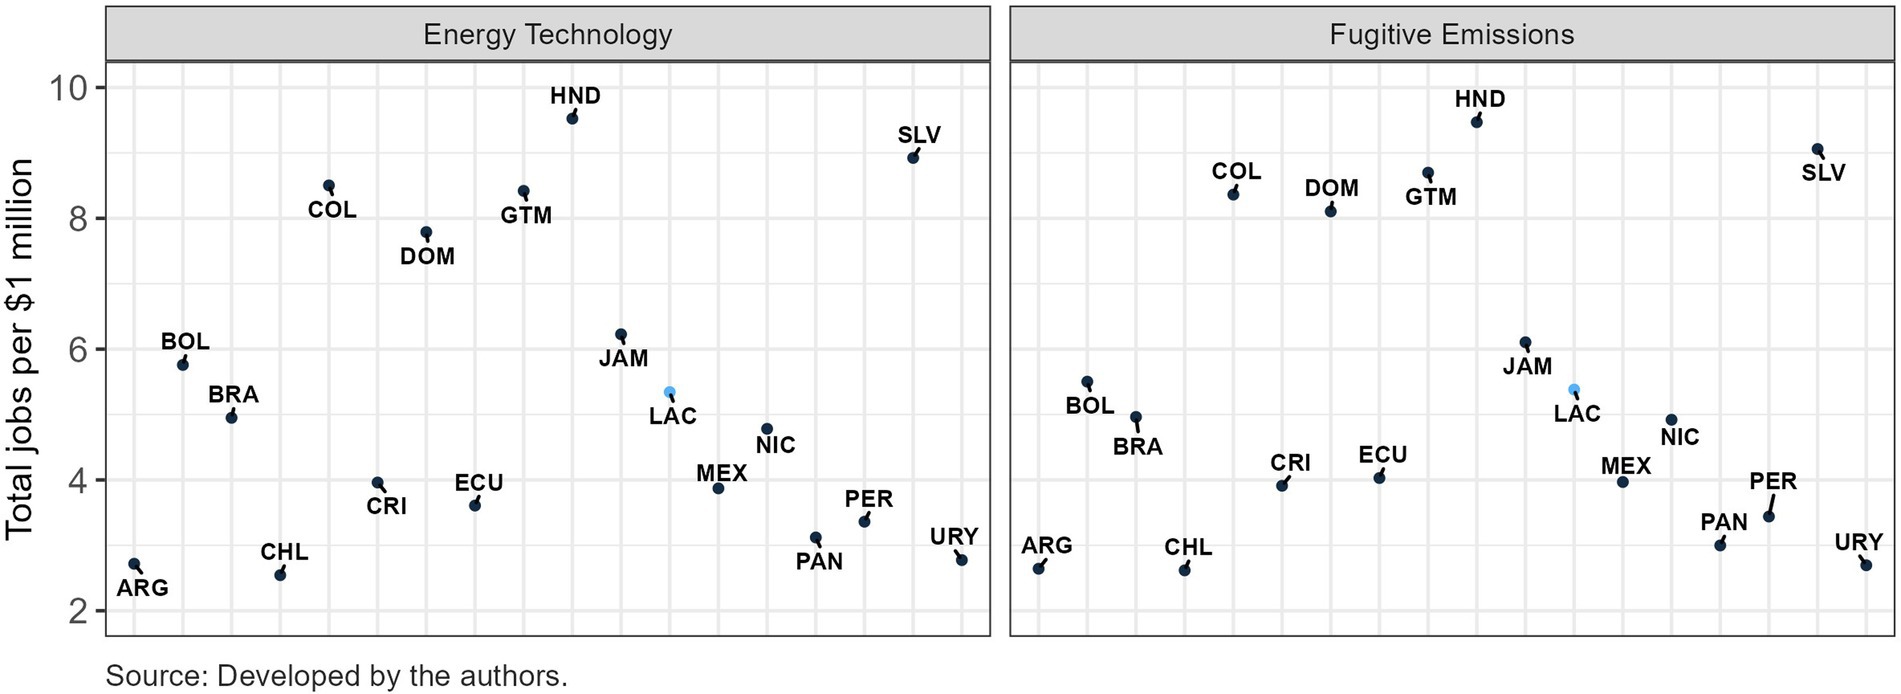
Chart 5. Average employment multipliers: energy production.
3.1.5 Transportation
The energy decarbonization pathways for transportation, as analyzed in this study, primarily relate to transition road transport, rail, and maritime shipping to alternative fuels. Notably, transitioning from fossil fuels to electricity in light-duty vehicles and adopting a combination of electricity and hydrogen to power medium and heavy-duty trucks offer significant promise for climate mitigation and job creation. These actions generate average multipliers of 7 direct and indirect jobs per $1 million invested in 8 out of the 17 considered countries. It is worth emphasizing that Latin America has the potential to play a strategic role in lithium-ion battery manufacturing, as approximately half of the world’s lithium reserves are in Argentina, Bolivia, and Chile (Barandiarán, 2019; Quinteros-Condoretty et al., 2020; Chart 6).
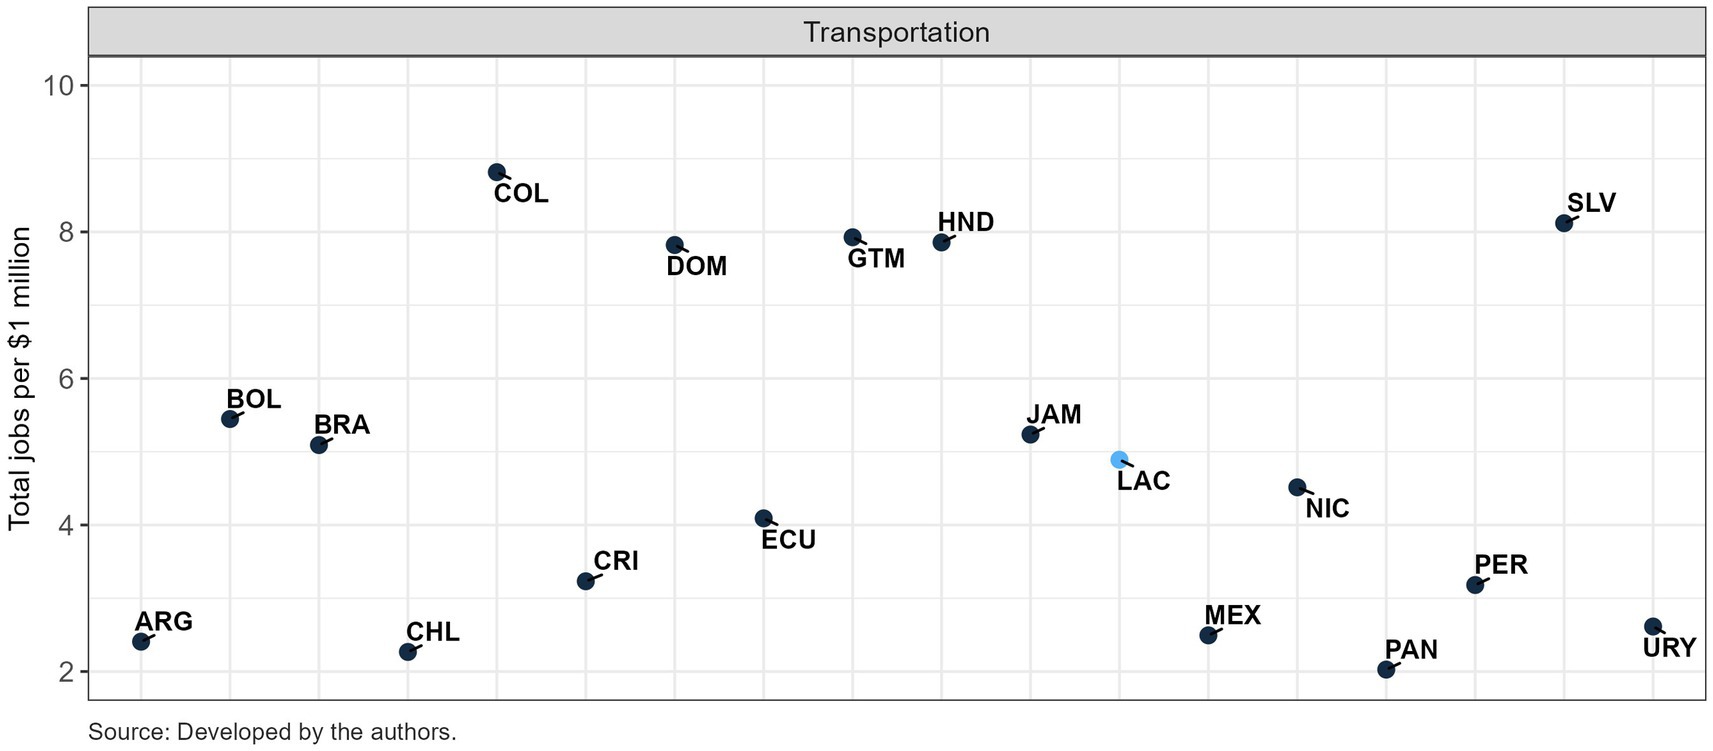
Chart 6. Average employment multipliers: transportation.
3.1.6 Industry
The policy transformations in the industry sector encompass industry-specific and general actions involving enhancing materials efficiency, especially in cement and steel production, substituting materials (e.g., waste for virgin materials), improving industrial energy efficiency, and transitioning from fossil fuels to electricity and hydrogen derived from renewables. Efforts are also directed toward capturing and eliminating remaining emissions (e.g., HFCs, PFCs, nitrous oxide). One primary pathway for emissions reduction in this segment involves clinker substitution, a key material used in cement manufacturing. By reusing byproducts of other industrial and energy processes (e.g., fly ash), this approach reduces the demand for clinker in cement production (Kajaste and Hurme, 2016). Investments in this policy transformation hold the potential to generate, on average, 4.7 direct and indirect jobs per $1 million spent in countries in Latin America and the Caribbean (LAC), with figures exceeding 7.5 total jobs in three countries within our sample.
Within industrial energy, the transition from fossil-fuel combustion to cleaner alternatives for industrial heat, spanning all temperature levels, holds significant potential for job creation in countries in Latin America and the Caribbean. Actions aimed at supporting direct electrification using heat pumps for low-temperature heat, as well as medium and high-temperature heat powered by electricity and hydrogen (e.g., for steel and cement production), are estimated to generate an average of 7.5 total jobs per $1 million invested in several Central and South American countries. Notably, Bolivia, Colombia, Honduras, and El Salvador are among the countries poised to benefit from these transformations. Furthermore, abatement measures aimed at reducing F-Gas and nitrous oxide (N2O) emissions (e.g., byproduct destruction and chemical substitution) are estimated to generate an average of 5.5 total jobs per $1 million invested across all countries considered. Similar average job creation potential is observed for actions targeting the reduction of fluorinated compounds and the limitation of HFCs and PFCs in industrial processes and products (Chart 7).
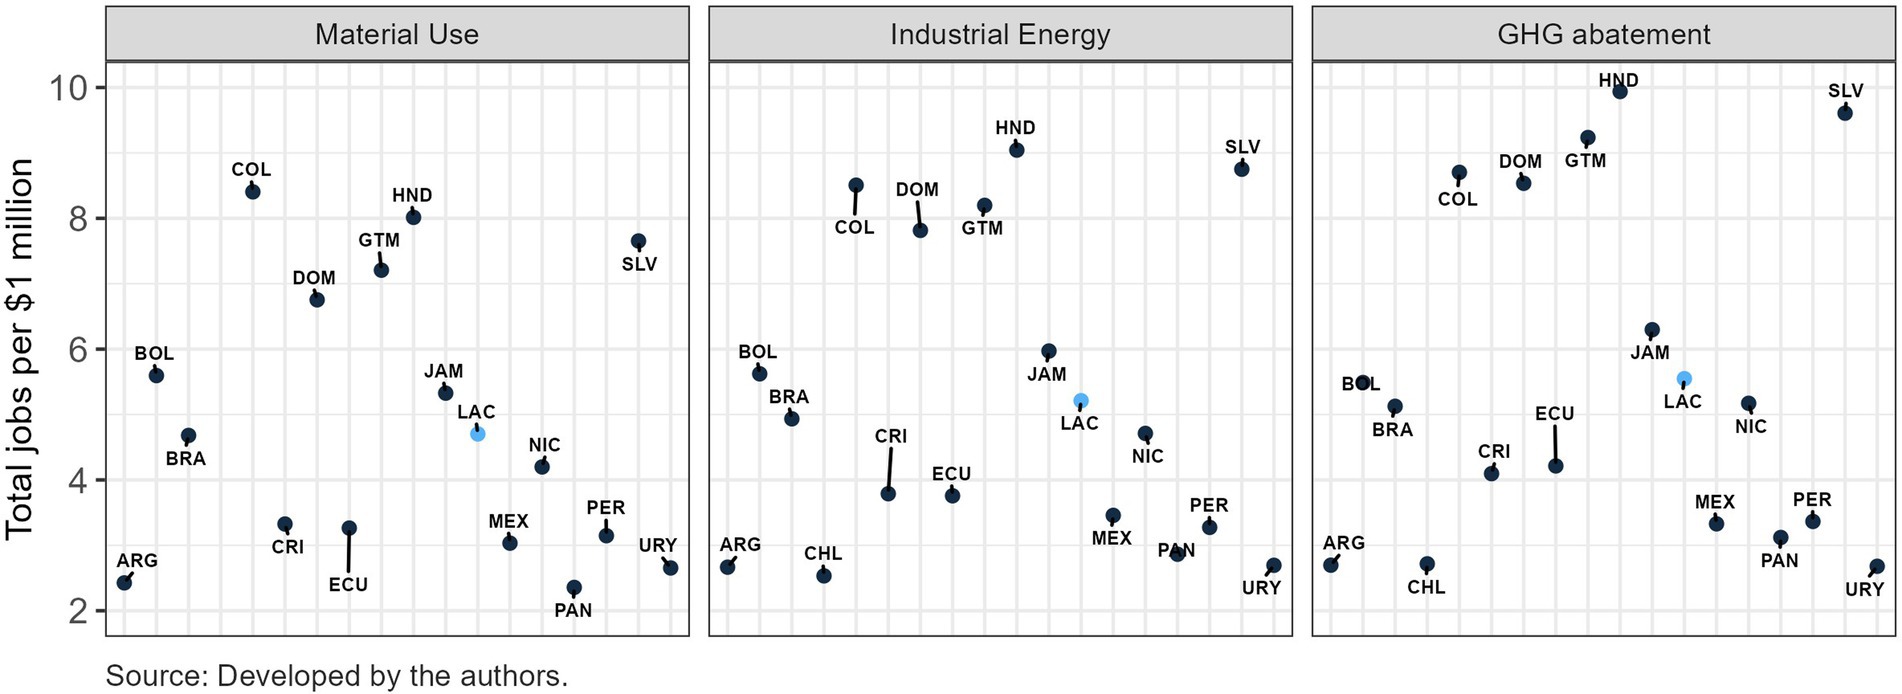
Chart 7. Average employment multipliers: industry.
4 Discussion and conclusions
The findings of this study highlight the potential for inclusive economic transformation through decarbonization strategies in the Latin America and the Caribbean (LAC) region, with job creation as a key benefit of transitioning to a net-zero economy. This aligns with prior studies in the literature exploring job creation opportunities within decarbonization strategies in LAC (Pollin, 2016; IDB, DDPLAC, 2019; Saget et al., 2020) and across different regions (Garrett-Peltier, 2017; Bivens, 2019; Dell’Anna, 2021). As concluded by Kalra et al. (2023), reaching net-zero emissions by 2050 in Latin America and the Caribbean is technically doable and offer an array of potential benefits. Pathways to this goal vary and are dependent on country-specific characteristics, such as the reliance on fossil fuels in electricity generation and transportation and the economic relevance of animal-based food industries (e.g., beef production). Nonetheless, we can identify key recommendations for transformations that yield solid employment multipliers across countries: reducing end-use demand for heat energy building shell improvements (7 total jobs per $1 M invested), increasing the share of renewables (e.g., wind, solar, bioenergy) in electricity generation (6 total jobs per $1 M invested), and enhancing urban and industrial wastewater treatment (6 total jobs per $1 M invested).
The estimates presented across sectors and countries, hold value in complementing the cost–benefit analysis of decarbonization in the region (Kalra et al., 2023) and contribute to guiding ex-ante evaluation of decarbonization strategies, illustrating how climate and development are intertwined based on consistent and transparent model assumptions. Maximizing synergies with other socioeconomic objectives, including addressing unemployment and systemic inequalities, are fundamental pillars of an effective approach to transitioning to a low-carbon economy in the Latin America and the Caribbean region. To navigate the challenges of the political economy surrounding the climate agenda, policies should ensure that workers, firms, and communities negatively affected by these transitions are adequately supported and enabled to integrate into the green economy. Future research should advance the dynamic component and the sources of uncertainty of the employment multipliers estimates, incorporate operations and maintenance jobs that occur over the operating life of projects, the quality of jobs generated, among other considerations.
Data availability statement
Publicly available datasets were analyzed in this study. This data can be found at: https://worldmrio.com/eora26/.
Author contributions
FE: Conceptualization, Data curation, Formal analysis, Investigation, Methodology, Software, Validation, Visualization, Writing – original draft, Writing – review & editing. EM-P: Conceptualization, Formal analysis, Funding acquisition, Investigation, Methodology, Project administration, Resources, Supervision, Validation, Visualization, Writing – review & editing. NK: Conceptualization, Formal analysis, Funding acquisition, Investigation, Project administration, Resources, Supervision, Validation, Writing – review & editing. JS: Conceptualization, Data curation, Formal analysis, Investigation, Methodology, Supervision, Writing – review & editing. AV-S: Conceptualization, Formal analysis, Funding acquisition, Investigation, Methodology, Resources, Supervision, Validation, Writing – review & editing.
Funding
The author(s) declare that financial support was received for the research, authorship, and/or publication of this article. This work was made possible by a research grant from Tecnológico de Monterrey, awarded to Edmundo Molina to support academic exploration of the impacts of climate mitigation and adaptation.
Conflict of interest
The authors declare that the research was conducted in the absence of any commercial or financial relationships that could be construed as a potential conflict of interest.
Publisher’s note
All claims expressed in this article are solely those of the authors and do not necessarily represent those of their affiliated organizations, or those of the publisher, the editors and the reviewers. Any product that may be evaluated in this article, or claim that may be made by its manufacturer, is not guaranteed or endorsed by the publisher.
Author Disclaimer
FE is a PhD candidate at the Pardee RAND Graduate School. NK is a Senior Information Scientist at the RAND Corporation. Their thoughts do not necessarily reflect those of the RAND Corporation, Pardee RAND, or RAND’s research sponsors.
Supplementary material
The Supplementary material for this article can be found online at: https://www.frontiersin.org/articles/10.3389/fclim.2024.1339877/full#supplementary-material
Footnotes
1. ^Simulation of Sectoral Pathways and Uncertainty Exploration for Decarbonization (Kalra et al., 2023).
2. ^United Nations Intergovernmental Panel on Climate Change (IPCC) methodology (IPCC, 2006; 2019).
3. ^The relocation of emissions along the supply chains to the final consumers.
4. ^Moran and Wood (2014) conducted tests to assess the convergence of main MRIO models (Eora, WIOD, EXIOBASE, and the GTAP-based OpenEU). Their findings revealed potential roadblocks to comparability. The main results indicated disagreements of up to 10–20%, which were associated with different definitions of the economic structure and the environmental stressor used. The authors advocate the need to reconcile these disagreements to enhance the overall reliability and consistency of MRIO models.
5. ^Database available for download: https://worldmrio.com/eora26/.
6. ^Except for Paraguay, which is excluded due to data limitations, this paper covers all countries present in SiSePuede, including Argentina, Bolivia, Brazil, Chile, Colombia, Costa Rica, Dominican Republic, Ecuador, El Salvador, Guatemala, Honduras, Jamaica, Mexico, Nicaragua, Panama, Peru, and Uruguay.
7. ^The Full Eora Global Supply Chain database documents the inter-sectoral transfers across 15,900 sectors in 190 countries between 1990 and 2022. It also includes environmental indicators (e.g., GHG emissions, land occupation), labor inputs, and primary inputs to agriculture (https://worldmrio.com/). Detailed information about Eora can be found in Lenzen et al. (2012, 2013).
8. ^The supply table displays the total values of what is produced and imported by the covered industries, while the use table presents the values of intermediate inputs used in the production process and the final uses (e.g., household consumption, changes in inventories; https://www.oecd.org/sdd/na/supply-and-use-tables-database.htm).
9. ^Miller and Blair (2022) present this I-O method to assess the impacts of a new industry (Chapter 14). The authors acknowledge that estimates are considered conservative, as the introduction of a new sector would potentially promote more profound changes in the technical structure of the economy.
11. ^In this example, the total jobs multiplier estimated would account for investments of $390,000 in activities in Electrical & Machinery and Construction sectors each, along with $110,000 in each of the two remaining sectors described (Gas and Water, and Education, Health, and Other Services).
12. ^Supplementary materials available on https://github.com/fhesteves/Job-Creation-and-Decarbonization-Synergies-in-Latin-America.
13. ^Evidence by both I-O models and computable general equilibrium (CGE) models suggest that a shift in investment towards more job-intensive sectors contributes to job creation, albeit through distinct mechanisms (Perrier and Quirrion, 2018).
14. ^DMDU methods (Groves et al., 2019) can be used to study how variations in technical coefficients, proportion of inputs, and prices influence the magnitude of the employment multipliers.
15. ^Operations and maintenance jobs that occur over the expected operating life of a power plant or utility, for instance, are not included in this analysis.
16. ^SiSePuede defines 45 different policy transformations. In our paper, transformations, such as those related to behavior change (e.g., shifting diets to reduce meat consumption, increasing occupancy of private vehicles) and sectoral productivity gains (e.g., improving agricultural and livestock productivity), were not included.
17. ^Farming system that prevents losses of arable land and promotes the regeneration of degraded lands through minimum tillage, maintenance of permanent soil cover, and diversification of plant species (FAO, 2023).
18. ^LAC estimates represent the average employment multiplier across the 17 countries included in our sample for each subgroup, as detailed in Table 1.
19. ^Wastewater treatment systems in SiSePuede: No Treatment (wastewater discharged untreated in the environment), Primary Treatment (removal of variety of solids in treatment plant), Secondary Treatment (Primary + impurities removal using bacterial processes), Tertiary Treatment (Secondary + aerobic/anaerobic advanced treatment).
References
Barandiarán, J. (2019). Lithium and development imaginaries in Chile, Argentina and Bolivia. World Dev. 113, 381–391. doi: 10.1016/j.worlddev.2018.09.019
Bivens, J. (2019). Updated employment multipliers for the US economy. Report, Economic Policy Institute, August.
Brassiolo, P., Estrada, R., Vicuña, S., Odriozola, J., Toledo, M., Juncosa, F., et al. (2023). Global challenges, regional solutions: Latin America and the Caribbean in the face of the climate and biodiversity crisis.
Correal, M., Rihm, A., and Zambrano, M. (2023). Sostenibilidad financiera de la gestión de residuos sólidos en América Latina y el Caribe.
De Souza Oliveira, Y. E., Oliveira, D. Q., and Saavedra, O. R. (2022). A review on challenges for the dissemination of battery electric vehicles in Brazilian market. In: 2022 IEEE PES Generation, Transmission and Distribution Conference and Exposition–Latin America (IEEE PES GTD Latin America, IEEE, pp. 1–7.
Dell’Anna, F. (2021). Green jobs and energy efficiency as strategies for economic growth and the reduction of environmental impacts. Energy Policy 149:112031. doi: 10.1016/j.enpol.2020.112031
Dodane, P. H., Mbéguéré, M., Sow, O., and Strande, L. (2012). Capital and operating costs of full-scale fecal sludge management and wastewater treatment systems in Dakar, Senegal. Environ. Sci. Technol. 46, 3705–3711. doi: 10.1021/es2045234
EPA (2019). Global non-CO2 Greenhouse gas Emission Projections and Marginal Abatement Cost Analysis: methodology documentation.
FAO (2023). Three principles of Conservation Agriculture. Available at: https://www.fao.org/conservation-agriculture/en/.
Fargione, J., Haase, D. L., Burney, O. T., Kildisheva, O. A., Edge, G., Cook-Patton, S. C., et al. (2021). Challenges to the reforestation pipeline in the United States. Front. Forests Glob. Change 4:629198. doi: 10.3389/ffgc.2021.629198
Furceri, D., Ganslmeier, M., and Ostry, J. (2023). Are climate change policies politically costly? Energy Policy 178:113575. doi: 10.1016/j.enpol.2023.113575
Gardarsdottir, S. O., De Lena, E., Romano, M., Roussanaly, S., Voldsund, M., Pérez-Calvo, J. F., et al. (2019). Comparison of technologies for CO2 capture from cement production–part 2: cost analysis. Energies 12:542. doi: 10.3390/en12030542
Garrett-Peltier, H. (2017). Green versus brown: comparing the employment impacts of energy efficiency, renewable energy, and fossil fuels using an input-output model. Econ. Model. 61, 439–447. doi: 10.1016/j.econmod.2016.11.012
Gholami, F., Tomas, M., Gholami, Z., and Vakili, M. (2020). Technologies for the nitrogen oxides reduction from flue gas: a review. Sci. Total Environ. 714:136712. doi: 10.1016/j.scitotenv.2020.136712
Groves, D. G., Molina-Perez, E., Bloom, E., and Fischbach, J. R. (2019). “Robust decision making (RDM): application to water planning and climate policy” in Decision making under deep uncertainty: From theory to practice. ed. D. G. Groves (Cham: Springer International Publishing), 135–163.
Howland, B., and Karszes, J. (2014). Manure application cost study New York state spring. Available at: https://ecommons.cornell.edu/handle/1813/38736.
IDB, DDPLAC (2019). Getting to net-zero emissions: lessons from Latin America and the Caribbean. Inter- American development Bank and deep Decarbonization pathways for Latin America and the Caribbean, Washington, DC.
IPCC (2019). Refinement to the 2006 IPCC guidelines for National Greenhouse gas Inventories. Geneva, Switzerland: IPCC.
Kajaste, R., and Hurme, M. (2016). Cement industry greenhouse gas emissions–management options and abatement cost. J. Clean. Prod. 112, 4041–4052. doi: 10.1016/j.jclepro.2015.07.055
Kalra, N., Molina-Pérez, E., Syme, J., Esteves, F., Cortés, H., Rodríguez-Cervantes, M. T., et al. (2023). The benefits and costs of reaching net zero emissions in Latin America and the Caribbean. Washington, DC: Inter-American Development Bank.
Kim, J., and Mohommad, M. A. (2022). Jobs impact of green energy (No. 2022–2101). International Monetary Fund.
Krantz, R., Søgaard, K., and Smith, T. (2020). The scale of investment needed to decarbonize international shipping. Getting to zero coalition insight series,(January), pp. 3–6.
Lampayan, R. M., Rejesus, R. M., Singleton, G. R., and Bouman, B. A. (2015). Adoption and economics of alternate wetting and drying water management for irrigated lowland rice. Field Crop Res. 170, 95–108. doi: 10.1016/j.fcr.2014.10.013
Lebeau, P., Macharis, C., and Van Mierlo, J. (2019). How to improve the total cost of ownership of electric vehicles: an analysis of the light commercial vehicle segment. World Electr. Vehicle J. 10:90. doi: 10.3390/wevj10040090
Lee, S. J., Ryu, I. S., Jeon, S. G., and Moon, S. H. (2017). Emission sources and mitigation of fluorinated non-CO2 greenhouse gas in registered CDM projects. Greenhouse Gases 170, 95–108.
Lenzen, M., Kanemoto, K., Moran, D., and Geschke, A. (2012). Mapping the structure of the world economy. Environ. Sci. Technol. 46, 8374–8381. doi: 10.1021/es300171x
Lenzen, M., Moran, D., Kanemoto, K., and Geschke, A. (2013). Building Eora: a global multi-region input–output database at high country and sector resolution. Econ. Syst. Res. 25, 20–49. doi: 10.1080/09535314.2013.769938
Leontief, W. (1936). “Quantitative input–output relations in the economic system of the United States,” review of economics and statistics. Rev. Econ. Stat 18, 105–125. doi: 10.2307/1927837
Leontief, W. (1941). The structure of American economy 1919–1939. New York: Oxford University Press.
Miller, R. E., and Blair, P. D. (2022). Input-output analysis: Foundations and extensions. 3rd Edn. Cambridge, UK: Cambridge University Press.
Moran, D., and Wood, R. (2014). Convergence between the Eora, WIOD, EXIOBASE, and OpenEU's consumption-based carbon accounts. Econ. Syst. Res. 26, 245–261. doi: 10.1080/09535314.2014.935298
Perrier, Q., and Quirion, P. (2018). How shifting investment towards low-carbon sectors impacts employment: three determinants under scrutiny. Energy Econ. 75, 464–483.
Peters, G. P. (2008). From production-based to consumption-based national emission inventories. Ecol. Econ. 65, 13–23. doi: 10.1016/j.ecolecon.2007.10.014
Peters, G. P., and Hertwich, E. G. (2008). CO2 embodied in international trade with implications for global climate policy. Environ Sci Technol 42, 1401–1407. doi: 10.1021/es072023k
Pollin, R. (2016). Global green growth for human development. Background paper for human development Report.
Quinteros-Condoretty, A. R., Albareda, L., Barbiellini, B., and Soyer, A. (2020). A socio-technical transition of sustainable lithium industry in Latin America. Proc. Manuf. 51, 1737–1747. doi: 10.1016/j.promfg.2020.10.242
Reyer, C. P., Adams, S., Albrecht, T., Baarsch, F., Boit, A., Canales Trujillo, N., et al. (2017). Climate change impacts in Latin America and the Caribbean and their implications for development. Reg. Environ. Chang. 17, 1601–1621. doi: 10.1007/s10113-015-0854-6
Rissman, J., Lu, H., Armendariz, A., Imperative, C., and Zhang, Q. (2022). Decarbonizing industry in the us and China.
Saget, C., Vogt-Schilb, A., and Luu, T. (2020). Jobs in a net-zero emissions future in Latin America and the Caribbean. Washington DC, Geneva: Inter-American Development Bank and International Labour Organization.
Sánchez-Martín, L., Ortega Romero, M., Llamas, B., Suárez Rodríguez, M. D. C., and Mora, P. (2022). Cost model for biogas and biomethane production in anaerobic digestion and upgrading. Case study: castile and Leon. Materials 16:359. doi: 10.3390/ma16010359
USDA (2023). Marginal abatement cost curves for greenhouse gas mitigation on U.S. Farms and Ranches.
Wiedmann, T. (2009). A review of recent multi-region input–output models used for consumption-based emission and resource accounting. Ecol. Econ. 69, 211–222. doi: 10.1016/j.ecolecon.2009.08.026
Keywords: employment, labor markets, climate change, decarbonization, Latin America and Caribbean
Citation: Esteves F, Molina-Perez E, Kalra N, Syme J and Vogt-Schilb A (2024) Job creation and decarbonization synergies in Latin America: a simulation-based exploratory modeling analysis. Front. Clim. 6:1339877. doi: 10.3389/fclim.2024.1339877
Edited by:
Marco Verweij, Constructor University, GermanyReviewed by:
Dilip Khatiwada, Royal Institute of Technology, SwedenM. Bruce Beck, International Institute for Applied Systems Analysis, Austria
Copyright © 2024 Esteves, Molina-Perez, Kalra, Syme and Vogt-Schilb. This is an open-access article distributed under the terms of the Creative Commons Attribution License (CC BY). The use, distribution or reproduction in other forums is permitted, provided the original author(s) and the copyright owner(s) are credited and that the original publication in this journal is cited, in accordance with accepted academic practice. No use, distribution or reproduction is permitted which does not comply with these terms.
*Correspondence: Fernando Esteves, ZmVzdGV2ZXNAcGFyZGVlcmFuZC5lZHU=; Edmundo Molina-Perez, ZWRtdW5kby5tb2xpbmFAdGVjLm14