
95% of researchers rate our articles as excellent or good
Learn more about the work of our research integrity team to safeguard the quality of each article we publish.
Find out more
ORIGINAL RESEARCH article
Front. Clim. , 02 February 2024
Sec. Carbon Dioxide Removal
Volume 6 - 2024 | https://doi.org/10.3389/fclim.2024.1338556
This article is part of the Research Topic Quantifying Carbon Removal by Negative Emissions Technologies View all 11 articles
 Michael Fuhr1*
 Klaus Wallmann1
 Andrew W. Dale1
 Habeeb Thanveer Kalapurakkal1
 Mark Schmidt1
 Stefan Sommer1
 Christian Deusner1
 Timo Spiegel1
 Jannes Kowalski2Sonja Geilert1,3
Recent studies have begun to explore the potential of enhanced benthic weathering (EBW) in the Baltic Sea as a measure for climate change mitigation. To augment the understanding of EBW under seasonally changing conditions, this study aims to investigate weathering processes under anoxia to hypoxia in corrosive bottom waters, which reflect late summer conditions in the Baltic Sea. Dunite and calcite were added to sediment cores retrieved from Eckernförde Bay (Western Baltic Sea) with a constant flow-through of deoxygenated, CO2-enriched Baltic Sea bottom water. The addition of both materials increased benthic alkalinity release by 2.94 μmol cm−2 d−1 (calcite) and 1.12 μmol cm−2 d−1 (dunite), compared to the unamended control experiment. These excess fluxes are significantly higher than those obtained under winter conditions. The comparison with bottom water oxygen concentrations emphasizes that highest fluxes of alkalinity were associated with anoxic phases of the experiment. An increase in Ca and Si fluxes showed that the enhanced alkalinity fluxes could be attributed to calcite and dunite weathering. First order rate constants calculated based on these data were close to rates published in previous studies conducted under different conditions. This highlights the suitability of these proxies for mineral dissolution and justifies the use of these rate constants in modeling studies investigating EBW in the Baltic Sea and areas with similar chemical conditions. Generally stable pH profiles over the course of the experiment, together with the fact that the added minerals remained on the sediment surface, suggest that corrosive bottom waters were the main driving factor for the dissolution of the added minerals. These factors have important implications for the choice of mineral and timing for EBW as a possible marine carbon dioxide removal method in seasonally hypoxic to anoxic regions of the Baltic Sea.
In recent years, the pressing need to limit global warming to levels below 2°C compared to preindustrial times has prompted extensive discussions about the imperative role of Carbon Dioxide Removal (CDR) strategies (Feng et al., 2017; Fuss et al., 2018; Beuttler et al., 2019; IPCC, 2021; Campbell et al., 2022; Foteinis et al., 2023). In the pursuit of innovative strategies to mitigate the profound consequences of rising atmospheric carbon dioxide (CO2) levels and the imminent climate crisis, Ocean Alkalinity Enhancement (OAE) through enhanced weathering has emerged as a promising avenue. This strategy aims to enhance CO2 storage capacity within the surface ocean, possibly presenting an economical and efficient pathway for CDR (Oelkers, 2001; Hartmann and Kempe, 2008; Montserrat et al., 2017; Renforth and Henderson, 2017; Caserini et al., 2021; Campbell et al., 2022).
Materials used for this approach on the one hand need to consume protons upon dissolution and on the other hand must dissolve rapidly under the conditions found in the environment where OAE is applied. Two promising minerals are olivine [(Mg,Fe)2SiO4], a fast dissolving nesosilicate, with the two endmembers forsterite (Mg2SiO4) and fayalite (Fe2SiO4), and calcite, a highly abundant calcium carbonate (CaCO3; Rimstidt et al., 2012; Subhas et al., 2015; Renforth and Henderson, 2017; Kremer et al., 2019). Since olivine is the major component of dunite, an ultramafic, igneous rock, and the purification of the mineral is cost intense, dunite instead of olivine would be used in an application scenario (Hochstetter, 1859; Rigopoulos et al., 2018; Fuhr et al., 2023). Still, olivine is the fastest dissolving component of dunite, which is why for the efficiency and efficacy of enhanced dunite weathering, olivine dissolution is the key process (Palandri and Kharaka, 2004; Rimstidt et al., 2012). Understanding the kinetics of the dissolution reactions of forsterite, the most abundant variety of olivine, and calcite is central to the effectiveness of Enhanced Benthic Weathering (EBW). These reactions can be summarized as follows:
To date, much of the research on OAE and mineral dissolution in sea water has mainly focused on laboratory environments with well-defined chemical and hydrological characteristics (Walter and Morse, 1985; Rimstidt et al., 2012; Subhas et al., 2015; Montserrat et al., 2017; Naviaux et al., 2019; Fuhr et al., 2022; Flipkens et al., 2023). These studies have revealed complexities, including the potential release of toxicants like nickel during olivine dissolution (Montserrat et al., 2017; Flipkens et al., 2021) and the formation of secondary minerals such as CaCO3 and phyllosilicates, which can hinder CO2 uptake (Burton and Walter, 1987; Sternbeck and Sohlenius, 1997; Lein, 2004; Béarat et al., 2006; E. King et al., 2010; Rigopoulos et al., 2018; Fuhr et al., 2022; Moras et al., 2022; Hartmann et al., 2023). Importantly, these secondary minerals can alter the overall stoichiometry of the dissolution process, leading to disparities between calculated and actual dissolution kinetics (Fuhr et al., 2022). Furthermore, recent studies using sediments from the Baltic Sea have illuminated the distinctive challenges that arise under conditions closer to the natural system (Fuhr et al., 2023).
In the Baltic Sea, distinguishing between natural and EBW is difficult, given the substantial benthic background fluxes driven by natural CaCO3 input from continental erosion for calcium and diatom dissolution for silica that can overshadow potential fluxes induced by enhanced benthic weathering (Gasiunaite et al., 2005; Borawska et al., 2022; Wallmann et al., 2022; Fuhr et al., 2023). Furthermore, the dissolution kinetics of both calcite and olivine remain largely unexplored in the brackish waters of the Baltic Sea, introducing uncertainty whether dissolution rates assumed in modeling studies based on standard seawater (Feng et al., 2017; Griffioen, 2017; Fakhraee et al., 2023) can be applied in this specific region. Despite these challenges, the high organic-rich sediments releasing up to 80 Tg yr−1 of dissolved inorganic carbon (DIC) in the Baltic Sea make it an intriguing setting for EBW studies (Nilsson et al., 2019).
Modeling plays a pivotal role in assessing the feasibility and impact of OAE through EBW as a marine carbon dioxide removal (mCDR) strategy. Currently existing models rely on dissolution kinetics derived from studies conducted in marine environments that do not align with the unique chemical and hydrological properties of the Baltic Sea, where the partly seasonal, partly perennial seasonal stratification of the brackish water body, combined with limited deep water renewal leads to very low pH values in bottom waters (Melzner et al., 2013; Meier et al., 2019). This disconnect between the assumptions underlying many modeling efforts and the specific conditions of the Baltic Sea creates a critical need for empirical investigations of mineral dissolution kinetics, which can, in turn, inform more accurate and regionally tailored modeling efforts.
By investigating the efficiency of EBW under conditions of hypoxia to anoxia as well as CO2 enrichment, this study complements a previous study, where calcite and dunite were added to Baltic Sea sediments exposed to oxic, calcite-oversaturated bottom waters (Fuhr et al., 2023). To this end, sediment cores were retrieved from Boknis Eck, a shallow, seasonally hypoxic to anoxic depocenter in Eckernförde Bay in the southwestern Baltic Sea, amended with calcite and dunite and exposed to calcite-undersaturated bottom waters under controlled laboratory conditions with the aim to simulate conditions prevailing during late summer in this part of the Baltic Sea (Melzner et al., 2013). The study not only contributes to our understanding of benthic weathering in the Baltic Sea but also enhances the accuracy and reliability of modeling approaches for assessing the potential of EBW as a mCDR strategy.
On 26 October, 2022, a total of nine sediment cores (60 cm long) were retrieved from Boknis Eck with a multiple-corer from a water depth of 27 m with the research vessel FK Littorina. Alongside the sediment cores, 500 l of bottom water were also collected. The sediment cores contained 20–24 cm of surface sediment. Immediately after recovery, the cores were sealed at the top and bottom with rubber bungs, maintained in an upright position, and transported to a temperature-controlled laboratory at 12.5°C, which reflects natural summer conditions in the study area (Melzner et al., 2013). One of the cores was sliced for subsequent pore water and sediment analyses to determine initial natural background conditions. The results of these measurements are reported in Supplementary Figure 4.
For the incubation experiments, a total of eight cores were selected. Two different alkaline materials, dunite and calcite, were added to assess their effectiveness in OAE. The dunite (olivine AFS 80) used was sourced from quarries in Årheim, Norway, and the 20–30 μm fraction was isolated through sieving. The mineralogical composition of the dunite is reported in Supplementary Table 1. The calcite used was ground limestone provided by the German Limestone Association, with a calcium carbonate content exceeding 99% (Supplementary Table 2) and grain sizes below 0.12 mm. Prior to the experiment, the calcite was rinsed with deionized water with a conductivity of 18.2 MΩ cm−1. To eliminate the fine fraction of the material, the calcite was mixed with deionized water in a settling column (20 cm height), and particles that remained in suspension after 20 s were decanted. This process was repeated until the supernatant water became clear after 20 s. As a result, all particles were expected to settle on the sediment surface within a few minutes after adding the calcite to the sediment cores. Grain size distribution and median grain size after washing are reported in Supplementary Table 1 and Supplementary Figure 1.
Since the majority of studies used the geometrical surface assuming spherical grains to determine olivine dissolution (Rimstidt et al., 2012), the surface of dunite grains was determined likewise, assuming a grain size of 25 μm (Table 1).
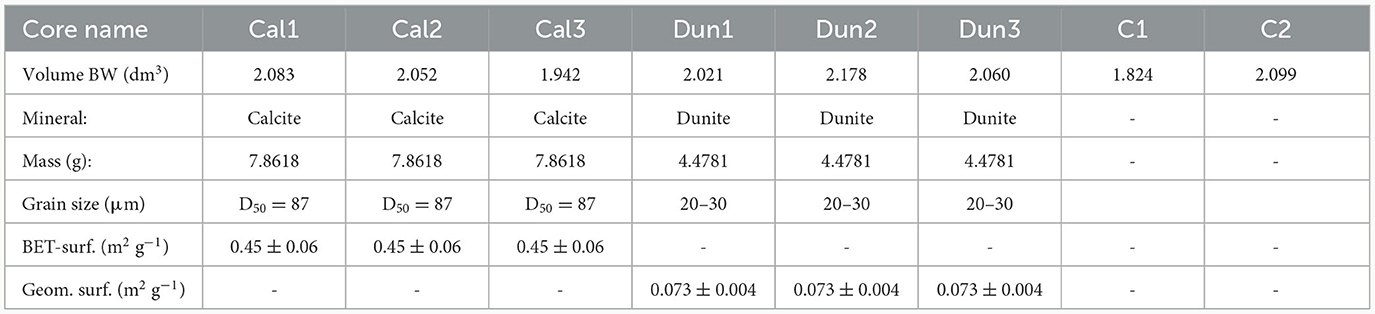
Table 1. Overview on materials used in the experiment, including bottom water (BW) volumes, treatments (Cal = calcite, Dun = dunite, C = control), BET surface area of calcite (measured) and geometrical surface area of dunite grains, calculated for an average grain size of 25 μm.
The reactive surface of calcite grains was determined via gas adsorption following the Brunauer-Emmett-Teller (BET) method after Brunauer et al. (1938) on a StöhleinTM AREA-Meter II.
The findings from the measurements and calculations are presented in Table 1.
Eight sediment cores were positioned vertically in a rack. Since the sediment surface was slightly oxidized by the bottom water (~125 μmol l−1 upon recovery), the cores were left plugged on the top for 13 days to settle after recovery until the sediment surface was anoxic. To achieve chemical conditions that are expected in the natural system (Melzner et al., 2013), 500 l of retrieved sea water were degassed via bubbling with pure dinitrogen gas in batches of 100 l. Afterwards, between 50 and 60 l were transferred into an evacuated gas tight bag. After the transfer, pH and total alkalinity (TA) were measured to determine the DIC of the water. Afterwards the DIC was increased via adding pure CO2 until a CO2 partial pressure (pCO2) of ~2,300–~3,300 μatm was established mimicking conditions prevailing in Boknis Eck during summer (Melzner et al., 2013). This mixture is hereafter referred to as modified bottom water. The pCO2 was slightly increased in the reservoir over time to compensate for alkalinity increases in the water overlying the cores due to benthic anaerobic degradation of organic matter and maintain calcite undersaturation.
Stirring heads were installed on the cores, allowing for the insertion of optodes for continuous measurements of bottom water pH and oxygen (PyroscienceTM PHROBSC-PK8 and OXROB3-SUB, respectively). The logging was done on a self-constructed 16 channel device for O2 and pH (each parameter 8 channels). For the measurement of O2 and pH for each channel, the underwater OEM O2 meter PICO-O2-SUB (Pyroscience) and the underwater OEM pH meter PICO-PH-SUB (Pyroscience) were used, respectively. Calibration was carried out according to the manufacturer's instructions. For brackish bottom water conditions, all pH probes including micro-sensors (Section 2.6) were calibrated using three TRIS-buffers (Pratt, 2014; Müller et al., 2018). Thus, pH values reported in this study refer to the total pH scale (pHT, Dickson, 1993). The equilibrium constants for further calculations were chosen accordingly.
To prevent the development of oxic conditions, it was ensured that as little gas phase as possible was left in the cores. Elimination of pelagic autotrophs, heterotrophs, and suspended particles was achieved by flushing the cores with modified bottom water for 2 days with a flow rate of 1.5 mml min−1. Afterwards, a continuous throughflow of 700 μl min−1 from the reservoir of modified bottom water was applied, leading to a residence time of ~2.1 days inside the cores.
For the experimental incubations, six cores received additions of alkaline materials, three with calcite (Cal1 - Cal3) and three cores with dunite (Dun1 - Dun3), leading to three replicates per treatment. Two control cores remained untreated (C1, C2). The amount of added substrate was based on the rain rate of particulate organic carbon observed in Boknis Eck (0.5 mmol cm−2 a Dale et al., 2011), the proton consumption of each substrate (Equations 1, 2) and then doubled to achieve a resolvable weathering signal. A detailed parameter description of each experiment can be found in Table 1. Prior to mineral addition, the cores were monitored untreated for 6 days to establish a natural baseline. The incubation lasted for 25 days. The volume of water in each core was determined at the end of the experiment via measuring the height of the water column after removing the stirring heads.
Bottom water samples (12 ml) were collected from the outflow of each core, over several minutes. Sampling was conducted daily for the first 2 weeks and then every 2 days till the end of the experiment. All samples were filtered using a 0.2 μm cellulose membrane filter and stored refrigerated in Exetainer® 12 ml Vials. TA samples (1 ml) were titrated with 0.02N HCl following the method described by Ivanenkov and Lyakhin (1978), with titration ending upon the appearance of a stable purple color. During titration, continuous nitrogen bubbling degassed the sample to eliminate any generated CO2 and H2S. The procedure was calibrated using an IAPSO seawater standard. Anion element concentrations (SO, Cl−, Br−) were determined using ion chromatography (IC, METROHM 761 Compact, conductivity mode). Acidified sub-samples (3 ml sample and 30 μl suprapure HNO) were prepared for major and trace element analyses (Si, Na, K, Li, B, Mg, Ca, Sr, Mn, Ni, and Fe) using inductively coupled plasma optical emission spectroscopy (ICP-OES, Varian 720-ES).
At the end of the experiments, bottom water was removed via suction, and the cores were sliced for analysis of pore water and solid phases. Pore waters were obtained by centrifuging each sediment layer in 50 ml Falcon tubes at 3,000 rpm for 10 min. The resulting supernatant water was filtered (0.2 μm regenerated cellulose syringe filters) and transferred to polyethylene vials within an oxygen-free glove bag environment. Additional parameters, such as H2S and Fe were analyzed in the pore waters. For dissolved Fe2+ analysis, 1 ml sub-samples (1 ml) were stabilized with ascorbic acid and complexed with Ferrozin within 30 min inside the glove bag. H2S measurements involved diluting an aliquot of pore water with oxygen-free artificial seawater and fixing of H2S through immediate addition of zinc acetate gelatin solution. Further details on these procedures can be found in Dale et al. (2014) and Dale et al. (2016). Bottom water solute concentrations are reported in the Supplementary material.
Freeze-dried and ground sediment samples were subjected to flash combustion using the EuroEA 3000 element analyzer (EuroVector, Pavia, Italy) to measure total carbon (TC), total organic carbon (TOC), total nitrogen (TN), and total sulfur (TS). The total inorganic carbon (TIC) content was determined by subtracting the TOC value from the TC measurement. Method blanks and two reference standards, namely 2.5-Bis(5-tert-butyl-2-benzo-oxazol-2-yl)thiophene (BBOT, HEKAteckTM), and an internal sediment standard, were employed to evaluate the accuracy of the analytical method.
To conduct sediment micro-profiling, a motorized UnisenseTM micromanipulator (MMS) was employed. Oxygen, pH, and H2S profiles were measured using UnisenseTM micro-sensors Ox-50, pH-100, and SULPH-100, respectively. The vertical step sizes were adjusted based on the sensor specifications (at least twice the needle diameter) and the desired measurement resolution to minimize profiling time (100 μm for O2 profiles, 300 μm for pH and H2S profiles). Sensor calibration followed the manufacturer's recommendations, with the UnisenseTM calibration kit used for SULPH-100 at a calibration concentration of 109 μmol l−1.
Following the acquisition of H2S and pH profiles, the total dissolved sulfide concentration was calculated according to UnisenseTM guidelines based on the work of Millero et al. (1988) and Jeroschewski et al. (1996). Unless specified otherwise, the term H2S refers to the total dissolved sulfide concentration (≈ H2S + HS−). Micro-profiles were obtained at the beginning of the experiment (t = −6 d), directly before the addition of substrates (t = 0 d) and at the end of the experiment (t = 19 d). Results of these measurements are presented in the Supplementary material.
Solute fluxes across the sediment surface were determined by applying the following calculations, which consider the concentrations of an element in the inflow and outflow:
Fe represents the element flux across the entire sediment surface (mol cm−2 d−1), denotes the rate of concentration change of the specific element over a defined time (mol l−1 d−1), kw represents the water exchange rate in d−1, Cout signifies the concentration in the outflow (mol l−1), Cin represents the concentration in the inflow (mol l−1), VMUC denotes the volume of bottom water (l) in each core, and Ased (cm2) signifies the surface area of the incubated sediment cores.
The rate of calcite dissolution, R, is dependent on its saturation state (Ωcal; Walter and Morse, 1985 and references therein) following:
where k is an empirical rate constant (μmol g−1 hr−1) and n is the reaction order. The Ωcal values are a function of Ca2+ and CO concentrations, where the latter is a function of the carbonate system equilibria (Zeebe and Wolf-Gladrow, 2001). In this study, CO and hence Ωcal were calculated using measured pH and TA pore and bottom water values, following:
where [Ca] and [CO] are the concentrations of dissolved calcium and carbonate, respectively, and Kscal is the solubility product of calcite at the respective salinity, temperature and pressure (Zeebe and Wolf-Gladrow, 2001). Due to the experimental set-up, TA and Ca2+ concentrations in pore waters could not be measured over time. Therefore, only initial and final values for both parameters were used and interpolated linearly for each depth layer between the initial and final concentrations. We recognize the uncertainty associated with this approach.
Further properties of the carbonate system (pCO2, DIC) were calculated as described by Zeebe and Wolf-Gladrow (2001).
Bottom water TA concentrations averaged over each treatment remained relatively stable around the reservoir value (2.08 mmol l−1) in all treatments before the addition of alkaline materials (Figure 1A). After mineral addition, TA increased in all cores to values between 2.35 ± 0.1 mmol l−1 [control cores (C)] and 2.45 ± 0.1 mmol l−1 [dunite treated cores (Dun)]. After 5 days, TA values were equal within error in all treatments. After day five, values dropped to ~2.25 ± 0.1 mmol l−1 in dunite treated cores and to ~2.15 ± 0.1 mmol l−1 in the control experiments while they remained elevated in calcite treated cores. For the rest of the experiment, TA concentrations remained relatively stable at values of ~2.39 ± 0.05 mmol l−1 [calcite treated cores (Cal)], ~2.27 ± 0.06 mmol l−1 (dun) and 2.16 ± 0.03 mmol l−1 (C). These changes are reflected in corresponding TA fluxes (Figure 1B). Before the addition of alkaline minerals, fluxes varied around ~0.3 ± 1 μmol cm−2 d−1 within error in all treatments. The addition of alkaline minerals led to an immediate increase in TA fluxes for the calcite- and dunite-treated cores to values around 6 ± 2 μmol cm−2 d−1 on day one. In the reference cores, fluxes also increased at the time of addition and peaked at values of ~5 ± 1 μmol cm−2 d−1 on day 3. Toward the end of the experiment, the system approached a steady state with relatively constant fluxes for each set of the equally treated cores. The highest values (~3.8 ± 0.5 μmol cm−2 d−1) at that point in time were observed in calcite treated cores followed by dunite treated cores (~1.9 ± 0.1 μmol cm−2 d−1). Lowest final values were observed in the control experiment with ~0.6 ± 0.1 μmol cm−2 d−1.
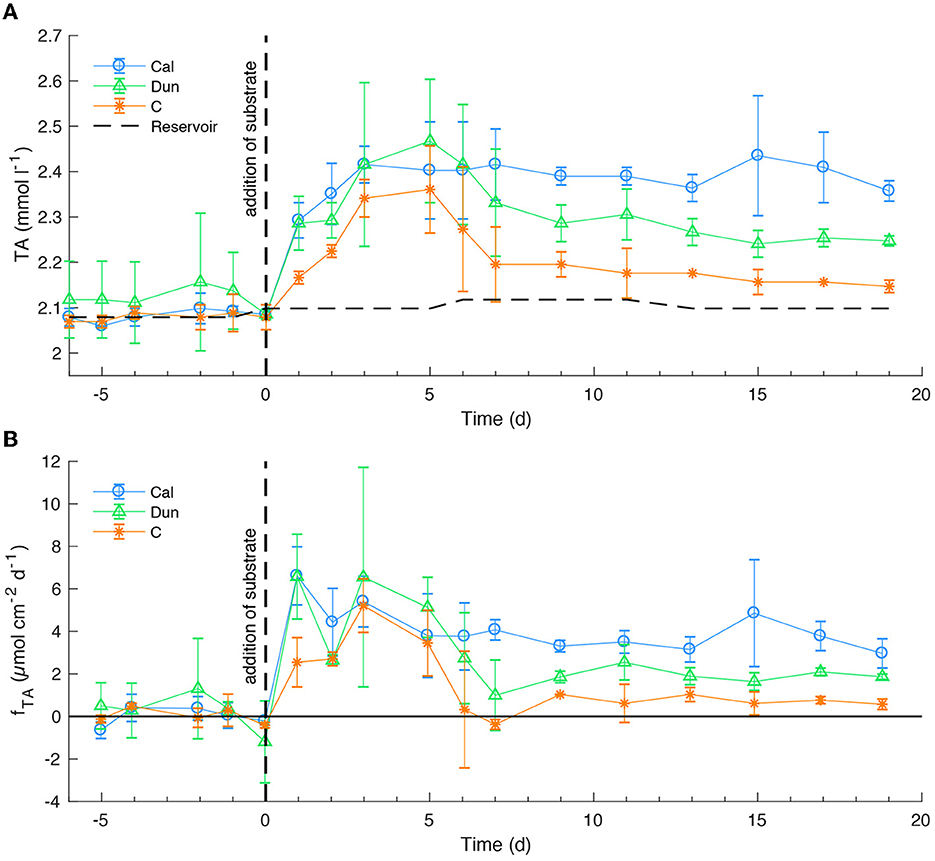
Figure 1. TA concentrations in bottom waters (A) and fluxes at the sediment surface (B) averaged over the different treatments. Positive fluxes denote a flux from the sediment to the bottom water and negative fluxes vice versa. Horizontal dashed line in a) shows concentration in the reservoir. Dashed vertical lines indicate the addition of substrates. Changes in the reservoir concentration denote the times a new reservoir was used. Time is given in days relative to mineral addition. Solid horizontal line denotes fTA = 0. Error bars denote one standard deviation (SD) from the average of the replicates. Fluxes were calculated from bottom water concentrations (Equation 3).
Dissolved silicon (Si) concentrations (Figure 2A) increased in all treatments during the early stage of the experiment to peak values between ~65 ± 10 μmol l−1 (Cal) and ~77 ± 15 μmol l−1 (Dun). Just before the addition, Si levels decreased to ~52 ± 12 μmol l−1 (Cal) and ~65 ± 3 μmol l−1 (C). After the addition of alkaline substrates, concentrations increased to slightly higher values in dunite treated cores compared to the other treatments. Overall, large error bars indicate strong variability within the different treatments, obscuring clear trends. Over the course of the experiment, bottom water concentrations varied slightly between ~50 ± 3 μmol l−1 (Cal) and ~70 ± 5 μmol l−1 (Dun) with one clear peak in all treatments around day 11. During the entire experiment, highest Si concentrations were observed in dunite treated cores. This difference became clearer toward the end of the experiment. The corresponding fluxes (Figure 2B) averaged between 0.45 ± 0.1 μmol cm−2 d−1 and 0.75 ± 0.6 μmol cm−2 d−1 before addition of substrates. Afterwards, fluxes were overall lower, ranging between 0 ± 0.1 μmol l−1 and 0.55 ± 0.3 μmol l−1, with decreasing fluctuations and error bars toward the end of the experiment. Again, highest values at a given time were observed in dunite treated cores with clearly higher values compared to the other treatments toward the end of the experiment.
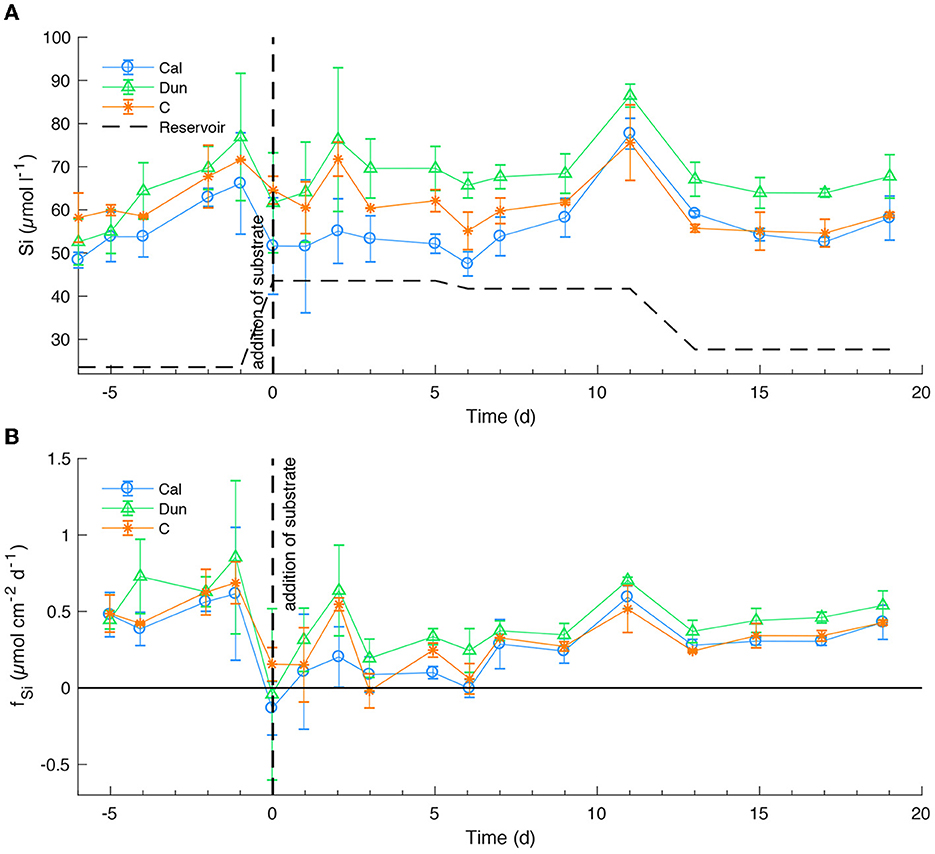
Figure 2. Si concentrations in bottom waters (A) and fluxes at the sediment surface (B) averaged over the different treatments. See Figure 1 for further information.
Dissolved calcium (Ca) concentrations averaged over each treatment (Figure 3A) showed clearer trends than Si concentrations. Ca concentrations remained fairly constant around ~7.1 ± 0.5 mmol l−1 and thus slightly above reservoir concentrations before the addition of substrates. After the addition, values significantly increased in calcite treated cores to concentrations around ~7.17 ± 0.05 mmol l−1 whereas in the other treatments, values dropped slightly and tracked the concentrations in the reservoir. After day 5 the reservoir concentrations increased to 7.23 mmol l−1. This increase is also visible in bottom water concentrations in all treatments. On day 11, concentrations in dunite treated cores and the control cores averaged around ~7.24 ± 0.06 mmol l−1 while concentrations in calcite treated cores reached up to ~7.32 ± 0.02 mmol l−1. Toward the end of the experiment lower reservoir concentrations of 6.94 mmol l−1 led to lower bottom water concentrations that stabilized at ~7.11 ± 0.01 mmol l−1 in calcite treated cores compared to ~7.02 ± 0.01 mmol l−1 in the other two treatments.

Figure 3. Ca concentrations in bottom waters (A) and fluxes at the sediment surface (B) averaged over the different treatments. See Figure 1 for further information.
This development is reflected in Ca fluxes. Between day−5 and day 0, values averaged around ~0.5 ± 1.5 μmol cm−2 d−1, but remained fairly stable within error. Directly after the addition, the fluxes in calcite treated cores peaked at values around ~2.7 ± 0.8 μmol cm−2 d−1. Until day 6 values then decreased to 0.2 ± 0.9 cm−2 d−1 to stabilize around 1.2 ± 0.2 μmol cm−2 d−1 toward the end of the experiment. In the other two treatments, values fluctuated between −0.1 ± 0.05 and 1.1 ± 1.0 μmol cm−2 d−1 with final values around 0 ± 0.2 μmol cm−2 d−1 with a tendency toward slightly negative values in dunite treated cores.
Throughout the experiment, nickel concentrations stayed below detection limit (~0.2 μmol l−1) both in pore waters and in bottom waters.
Oxygen concentrations in bottom waters (Figure 4) stayed at ~0 μmol l−1 in cores Cal1, Dun3, and C1 over the course of the experiment. They varied widely in the other cores. At the beginning of the incubation, oxygen concentrations were ~0 μmol l−1 in all cores except C1 where concentrations were close to the reservoir concentration of 20 μmol l−1, but increased to values between 120 μmol l−1 (Dun1) and 23 μmol l−1 (Cal2). Between day 0 and day 3 in Cal3 concentrations peaked at ~25 μmol l−1 on day two and at 140 μmol l−1 in Cal2 around day 5. Between days 6 and 11, reservoir concentrations of 40 μmol l−1 were accompanied by overall higher bottom water concentration of up to 150 μmol l−1 in Dun1. Until day 15, concentrations decreased back to ~0 μmol l−1 in C1, Dun1, and Dun2 but remained between 120 μmol l−1 and 130 μmol l−1 in Cal2 and Cal 3. Toward the end of the experiment concentrations had decreased back to values below 2 μmol l−1 in all cores except from C1, where for the only time during the experiment concentrations had increased to ~80 μmol l−1 during the last day of the incubation.
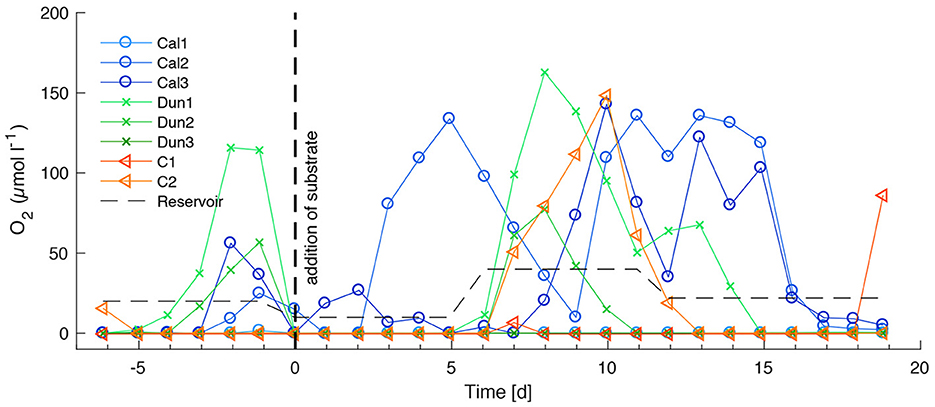
Figure 4. Oxygen concentrations in bottom waters over the entire time of the experiment for calcite treated cores (blue circles), dunite treated cores (green crosses), and control experiments (orange triangles). Measuring accuracy is 0.3 μmol l−1, resolution is 0.15 μmol l−1 (according to manufacturer). Vertical dashed line indicates time of addition of alkaline substrates. Thin dashed, horizontal line denotes oxygen concentrations in the reservoir tank. Changes in the reservoir concentration denote the times a new reservoir was used.
Due to a failure of the pH logging system, bottom water pH values are only available each time a micro-profile was obtained. To calculate the bottom water carbonate system properties, these pH values were interpolated linearly between the three obtained data points in each core. Before the addition of substrates, the calculated pCO2 values in all cores fluctuated around the reservoir value (~2,350 μatm) with a decreasing trend in all cores (Figure 5A). Lowest values just before the addition were observed in dunite treated cores (~2,000 μatm), with highest values (~2,400 μatm) in the two control cores. At the time the substrates were added, the new reservoir pCO2 was higher (~2,950 μatm) than the first batch. Subsequently, pCO2 in all cores increased with highest values of ~2,800 μatm in the two control cores, ~2,400 μatm in dunite and calcite treated cores. After the reservoir was changed, they decreased again to ~2,300 μatm such that the values in dunite and calcite treated cores were the same after ~5 days. For the rest of the experiment pCO2 remained relatively stable in dunite treated cores at ~2,100 μatm while values in calcite treated cores continuously decreased to ~1,850 μatm on day 19. The highest pCO2 at the end of the experiment was observed in control cores (~2,500 μatm).
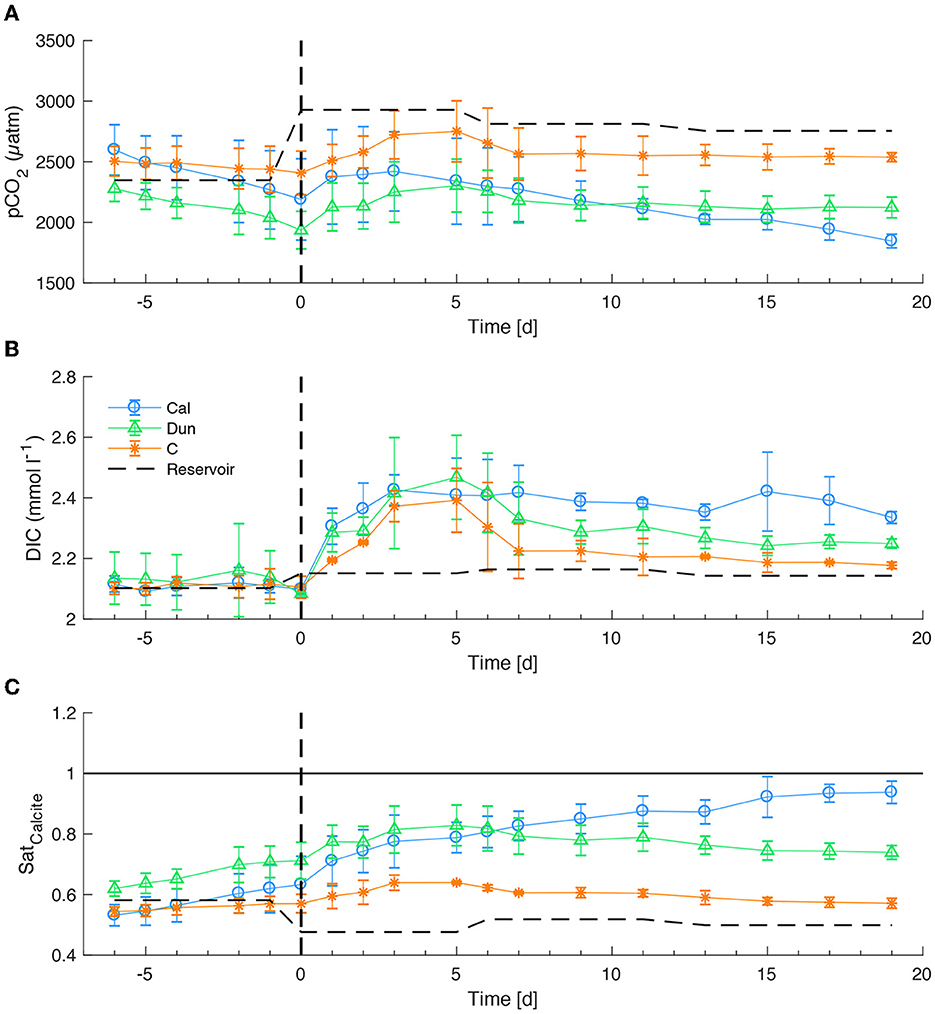
Figure 5. pCO2 (A), DIC (B), and SatCalcite (C) values in bottom waters over the entire course of the experiment. Values are reported as average of each treatment. Error bars report 1 SD of the averaged values. Vertical dashed lines denote the time of addition of substrates. The horizontal line in c denotes the saturation with respect to calcite.
Before the addition of substrates, calculated DIC values remained stable within the error around the reservoir value of ~2.1 mmol l−1 (Figure 5B). After the addition, values increased in all cores until day 5 to values of ~2.4 mmol l−1. After the reservoir was changed between days 5 and 6, DIC decreased to 2.2 mmol l−1 in control cores and 2.3 mmol l−1 in dunite treated cores. In calcite treated cores, values remained significantly higher around ~2.4 mmol l−1. Toward the end of the experiment, reservoir values of around ~2.15 mmol l−1 led to final values of ~2.16 mmol l−1 in the control cores, ~2.25 mmol l−1 in dunite treated cores and ~2.35 mmol l−1 in calcite treated cores.
Saturation with respect to calcite remained below 1, implying corrosive bottom waters in all cores over the entire course of the experiment (Figure 5C). Overall these values mirrored the pCO2 values. Before addition of substrates they were close to the reservoir value of ~0.6. Until the second reservoir change between day 5 and 6, they increased to values around ~0.8 in calcite and dunite treated cores and ~0.63 in the control cores. After day 6 in calcite treated cores, values increased continuously to ~0.93. In all other treatments (dunite and controls) values decreased to ~0.76 in dunite treated cores and 0.6 in control cores, thus only slightly above the reservoir value of ~0.5.
After mineral addition, calcite and dunite covered the sediment surface as an ~0.5 mm thick layer. This layer remained at the surface throughout the experiment with only very minor visible changes (Supplementary Figure 2).
In the initially sampled core (black line and crosses in Figure 6), TIC content varied between ~0.3 and ~ 3.2 wt.% in depths below 2.5 cm. Above this depth to the sediment surface, values increased progressively to ~9.7 wt.%. In calcite-treated cores, TIC content at the surface was increased up to 28 % in the uppermost sample (0.5 cm). Directly below this depth (1.5 cm) and further downcore the TIC content varied between ~0 and ~8 wt.% in all cores. At the surface, TIC levels in dunite-treated and control cores were significantly lower compared to the initially sampled core and ranged between ~0 and ~4 wt.%.
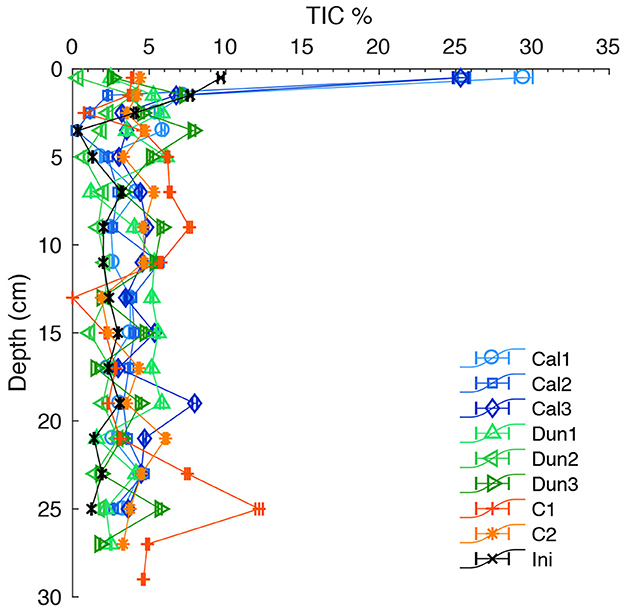
Figure 6. TIC content in the solid phase of all cores. Colored markers indicate contents in each core at the end of the experiment. Black crosses indicate the contents in the initial core. Error bars report analytical precision.
The data showed a consistent trend between all sediment cores. The cores behaved very similarly, until the addition of substrates, followed by a phase with more dynamic developments in bottom water chemistry. Afterwards, the different cores approached a quasi-steady state with similar trends between equally treated cores. The pore water solute concentrations, as well as the pore water pH profiles (Supplementary Figures 3, 4), did not change significantly over the course of the experiment, which indicates that sediments were not significantly altered by the incubation. Slightly enhanced Ca concentrations in the upper sediment of Cal2 and Cal3, compared to all other cores, point either toward diffusion into the sediment or toward entrainment of calcite grains into the surface sediment and subsequent sedimentary dissolution in the corrosive porewaters in the upper millimeters, especially in Cal2 (Supplementary Figure 5). The uniformity of pore water solute concentrations in most cores with the initially sampled core suggests that deviations observed in C1 and Dun1 reflect the spatial inhomogeneity of the sediment composition, despite the close proximity of coring locations. In previous experiments conducted under oxic conditions, drastic changes were observed in porewater composition over the course of the experiments (Fuhr et al., 2023). These changes did not occur in the experiments in the present study which is most likely a consequence of the shorter incubation time and the fact that the cores were recovered at an ambient temperature of 10.2°C, thus closer to the laboratory conditions (12.5°C), compared to 6.9°C in the former experiment. The shift in the pore water pH profiles in Cal2 and Cal3, however, appears very similar to changes observed in sediments from the same location under oxic conditions (Fuhr et al., 2023). In general, pH shifts in all cores were low and had a comparably minor impact on sedimentary fluxes and bottom water chemistry. The stable pore waters combined with the steady state attained at the end of the experiment, allows for a straightforward interpretation of the data.
For the assessment of TA that derives from EBW, it is necessary to consider the oxidation state of bottom waters, which controls the benthic release of reduced substances such as H2S, NH, Fe2+, Mn2+, and PO generated during anaerobic organic matter degradation including denitrification (Hiscock and Millero, 2006).
In order to assess the correlation between oxygen and TA concentrations in bottom waters, TA measured in individual cores (Supplementary Figure 6) was plotted as function of the respective oxygen concentrations (Figure 7). Oxygen concentrations in all cores varied between 0 μmol l−1 (C1 and Dun3) and 150 μmol l−1 in Dun1 on day 8. These variations are driven by the supply of oxygen from the reservoir via the throughflow, invasion of oxygen into the cores along the joints of the stirring heads and oxygen consumption in bottom waters as well as in the sediments. The reservoir oxygen concentrations slightly varied as a complete deoxygenation was technically not possible, and minor oxygen invasion during the transfer into the gastight reservoir bag was inevitable. H2S was not measured in bottom waters or the reservoir over time. Nevertheless, a sulfidic smell in collected samples indicated its presence in several cores during phases with very low oxygen concentrations. Furthermore, H2S was detected in bottom waters of Dun3 during the initial micro-profiling and in Cal2 during the profile obtained just before the addition of substrates (Supplementary Figure 7).
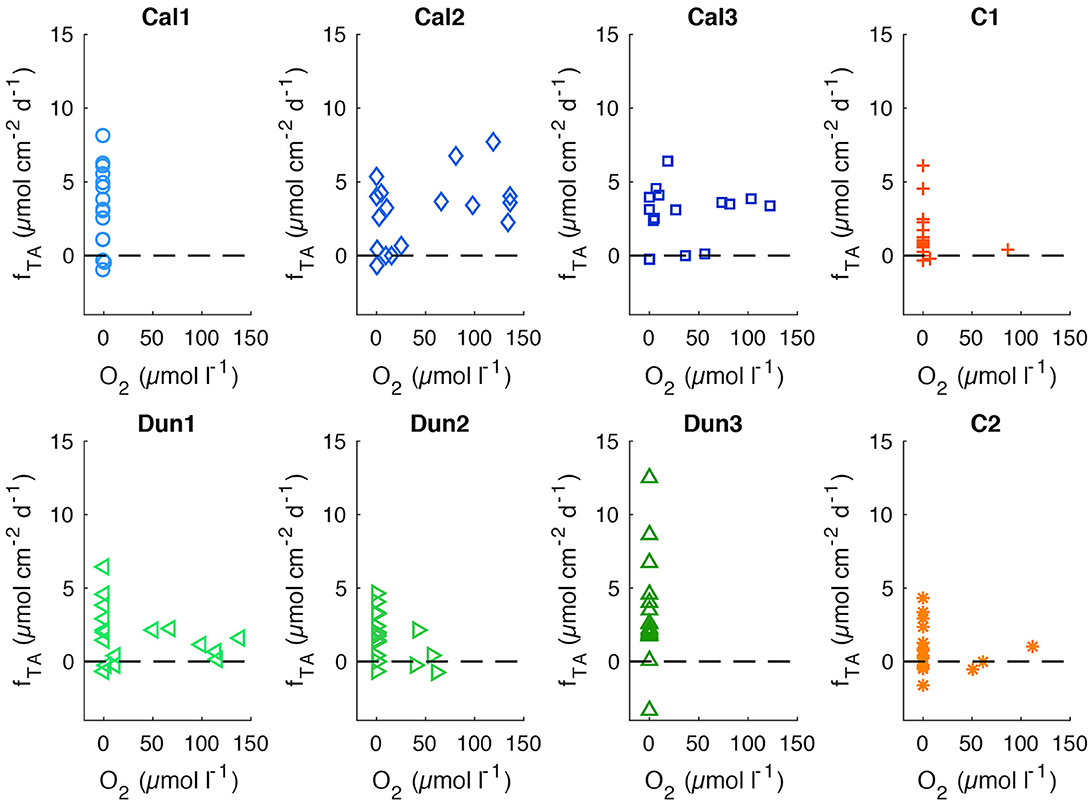
Figure 7. TA fluxes (fTA) over oxygen concentrations in bottom waters. Horizontal dashed line denotes fTA= 0. Analytical precision (~0.5 μmol cm−2 d−1 for fTA and ~2 μmol l−1 for O2) are not shown for clarity.
Additionally, a control measurement on day 5 revealed H2S in the overlying water in cores Cal1, Dun2, Dun3, and C1 during a phase with very low oxygen concentrations in the reservoir and bottom waters (Figure 4). Increased TA fluxes during this anoxic phase together with the increased TA concentrations in Dun3 before addition of substrates suggests that during anoxic phases, as soon as the available oxygen had been completely consumed, reduced species such as H2S were released into the bottom waters, and thus contributed to TA. The reoxidation of these species during phases with higher oxygen availability subsequently consumed TA (Figure 7). During phases with higher oxygen content in bottom waters, considerable TA fluxes were only observed in calcite and to a lesser degree in dunite amended cores. In most other cores, higher fluxes only occurred during anoxia.
The most important limitation for interpreting the bottom water carbonate system is the interpolation of pH values between the three obtained pH profiles (see Section 3.1). The consequence is that possible pH changes due to temporal TA changes (Figure 1) are not considered. It is, hence, possible that the pCO2 and DIC values (Figures 5A, B) were lower between day 0 and day 5 in cores where TA was presumably released from the sediment due to very low oxygen concentrations, whereas ΩCal values were higher (Figure 5C). This hypothesis is underpinned by the fact that the calculated DIC values increased in all cores during that phase and remained elevated on that higher level in calcite treated cores whereas they decreased in the dunite treated and control cores. The decrease of DIC in dunite treated cores is difficult to reasonably explain by known chemical processes, since the reservoir as well as the cores were very limited in exchange with ambient air. Therefore, the phase between days 0 and 7 will not be considered in further discussions. In contrast, the calculated bottom water carbonate system properties are more reliable toward the end of the experiment and less influenced by errors induced due to interpolated pH values. Furthermore, in a steady state situation, as reflected in TA concentrations and fluxes (Figure 1B), the entire carbonate system should be relatively constant as the reservoir and sedimentary fluxes are the only sources for DIC.
The low bottom water pCO2 (Figure 5A) and the corresponding elevated DIC in calcite treated cores suggest contribution of DIC via CaCO3 dissolution and a subsequent conversion of dissolved CO2 to HCO. The most important indicator for calcite dissolution is the ΩCal, especially in the calcite treated cores. Despite the fact that the interpolated pH values might lead to an underestimation of ΩCal values between days 0 and 5, the final values of ~0.94 (Figure 5C) suggest that in these cores the bottom waters remained corrosive throughout the experiment, which is important for evaluating the dissolution kinetics and mechanisms in this study.
Despite the aforementioned uncertainties associated with the calculated carbonate system properties over time, the development of a steady state in the cores toward the end of the experiment implies that it is reasonable to focus on the last 5 days of the experiment to disentangle natural and enhanced weathering. For these days, sedimentary fluxes of corresponding weathering products (TA, Ca and Si) were averaged and compared (Table 2).
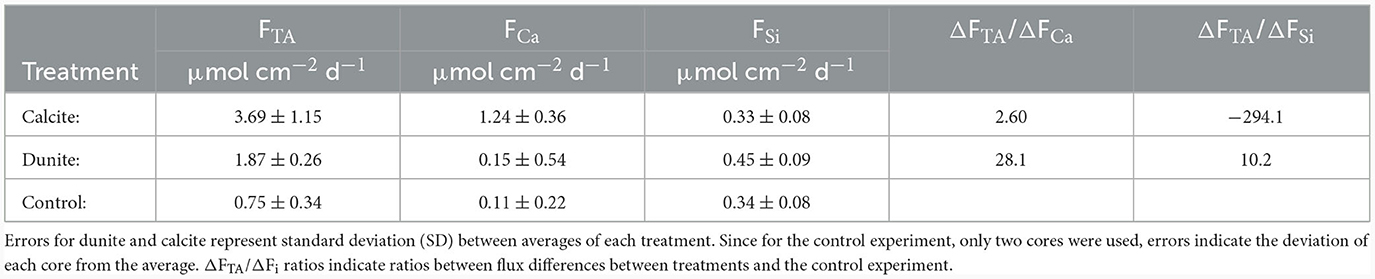
Table 2. TA, Ca, and Si fluxes in different cores averaged for different treatments over the last 5 days of the experiment.
If TA is generated via CaCO3 dissolution, the ratio of FTA:FCa is expected to be 2:1 (Equation 2). In the calcite treated cores the uncorrected ratio was ~2.97:1 (not shown in Table 2). This ratio is higher than the expected ratio, since it results from a combination of natural and enhanced weathering as well as TA fluxes that derive from metabolic processes. The natural background fluxes were considered by subtracting TA and Ca fluxes of the untreated control cores from the cores with mineral addition (ΔFTA = FTA treated core – FTA (control), ΔFCa = FCa (treated core) – FCa (control), likewise for ΔFSi), resulting in a corrected ratio of ΔFTA/ΔFCa = 2.60:1 (Table 2). The remaining excess TA indicates that an additional TA flux of ~1.21 μmol d−1 cm−2 was possibly not directly driven by CaCO3 dissolution. Thus, it is important to understand potential mechanisms that can lead to these elevated TA fluxes. In a previous study investigating weathering on sediments from the same location under fully oxic conditions (Fuhr et al., 2023), similar excess TA fluxes were possibly driven by microbial metabolism, which could, in principle, also explain additional TA fluxes from the sediment in cores Cal2 and Cal3. At the same time, these two cores also showed enhanced Ca2+ pore water concentrations in the upper 3 – 4 cm of the sediment (Supplementary Figure 4). This elevation is not visible in pore water TA values of the same cores (Supplementary Figure 4). It may be possible that the higher diffusion coefficient of HCO compared to Ca2+ (Boudreau, 1997), caused HCO to diffuse out of the very upper sediment before Ca2+, as proposed by Fuhr et al. (2023). The difference between the excess TA flux observed in controls (~0.53 μmol d−1 cm−2) and calcite treated cores (~1.21 μmol d−1 cm−2) is ~0.68 μmol d−1 cm−2. The depth-integrated excess dissolved Ca2+ in the upper pore water of these cores (Supplementary Figure 4) is ~1.1 μmol cm−2, which would be an equivalent of ~2.2 μmol cm−2 of TA. Given that these values were obtained over the last 5 days of the experiment, this diffusive time lag would explain an additional ~0.43 μmol d−1 cm−2 TA flux and therefore a significant fraction of the elevated TA:Ca ratio.
With regards to ΩCal profiles (Supplementary Figure 5), the upper millimeters of the incubated cores were much less undersaturated with respect to calcite than those previously incubated under oxic conditions (Fuhr et al., 2023). Hence, dissolution within the sediment is unlikely to significantly contribute to calcite weathering. This, together with Ωcal values in bottom waters (Figure 5C), implies that the driver for calcite dissolution under hypoxic to anoxic conditions is the corrosive bottom water (Equations 4, 5). This hypothesis is corroborated by the very low Ca2+ fluxes in dunite treated and control cores (Figure 3B, Table 2), despite TIC contents of 3–5% in the sediment solid phase (Figure 6).
With this weathering mechanism in mind, it is reasonable to use only Ca2+ concentrations and fluxes to quantify enhanced CaCO3 dissolution and not both TA and Ca2+ as proposed by Fuhr et al. (2023) for oxic conditions. This approach avoids uncertainties induced by potential natural benthic weathering and other processes that may have induced additional TA fluxes. The enhanced Ca2+ flux and thus the rate of enhanced weathering (Rew) can then be described as:
where FCa(Cal) is the calculated average flux in the calcite treated core and FCa(C) is the calculated average flux in the control cores.
This calculation leads to an enhanced Ca flux and Rew of 1.12 ± 0.40 μmol cm−2 d−1 in the calcite treated cores. Based on this number and the amount of CaCO3, it is now possible to estimate a first order dissolution rate constant (kr) following:
where Rdiss is the dissolution rate over the entire surface of the sediment of one core (RDiss = Rew × sediment surface area) and ACal is the reactive surface of the calcite added on the sediment (BET-surf., Table 1).
This leads to a rate constant krCa of 0.0025 ± 0.0008 μmol cm2 d−1 and subsequently to a Log10(krCa) of −13.54 ± 0.12 mol cm−2 s−1 for a mean ΩCal value of 0.9 (Figure 5C). These values are in line with values reported by Naviaux et al. (2019) of −13.5 ± 0.4 for 0.8< ΩCal < 1 for in situ dissolution in the North Pacific Ocean. The conformity of these rate constants estimates implies that the kinetic constant and rate law for calcite dissolution assessed in previous studies can be employed to calculate and simulate the dissolution rates of calcite added to Baltic Sea surface sediments that are exposed to undersaturated bottom waters.
The high olivine content of over 90% in dunite (Hochstetter, 1859), justifies the assumption that olivine dissolution is representative for dunite dissolution. The dunite dissolution rate can be described as a function of temperature and pH (Rimstidt et al., 2012).
The high Mg2+ content in Baltic Sea water (~36 ± 0.72 mmol l−1) excludes its use as a proxy for olivine dissolution due to the analytical resolution. Thus, excess TA and/or dissolved Si might be reasonable proxies.
In all cores, background fluxes of Si were observed, which are presumably induced by diatom dissolution (Rickert, 2000; Gasiunaite et al., 2005; Dale et al., 2021; Fuhr et al., 2023). As performed for calcite treated cores, these background fluxes for both TA and Si were subtracted from the average fluxes in the dunite treated cores (Table 2). Additionally, the TA flux induced by CaCO3 dissolution was subtracted (twice FCa). This led to a residual FTA:FSi ratio of 7.52. Following Equation 1, this ratio should be 4 if the olivine dissolution was the only source of excess TA in dunite treated cores. This suggests that either ~0.39 μmol d−1 cm−2 of additional TA was released from the sediments, or that the overall stoichiometry of the dissolution process was altered due to either secondary mineral formation (Fuhr et al., 2022) or incongruent weathering (e.g., preferential release of Si over Mg or vice versa; Montserrat et al., 2017). The latter cannot be assessed in the frame of this study and will therefore be accepted as a possible explanation, but not discussed further. The formation of secondary minerals would explain lower dissolved Si fluxes, but at the same time also diminished TA fluxes (Fuhr et al., 2022). Additionally, results from studies on olivine dissolution in an open system (Flipkens et al., 2023) suggest that even when grains are not in suspension, as in the present study, and in higher saline water, the formation of secondary minerals is very unlikely to occur. Hence, it can be assumed that the altered FTA:FSi ratios derived from additional sedimentary TA fluxes are not linked to olivine weathering or CaCO3 dissolution, but rather sedimentary fluxes of reduced species (see Section 4.2).
With these assumptions in mind, the dissolution kinetics of olivine can be estimated following Equations 6, 7, with Si as a candidate proxy, assuming congruent weathering. Considering the amount and geometric surface area of the added dunite (Table 1), the first order rate constant for olivine dissolution can be calculated by normalizing the mean observed Si release rate over the last 5 days of the incubations (RDiss = 7.17 × 10⁻¹¹ to 1.48 × 10⁻¹⁰ mol s−1) with the available dunite surface area (0.574 m2, Equation 7). The result is a krSi of 1.822·10−10 mol m−2 s−1 and subsequent Log10(krSi) of −9.76 ± 0.16 [−9.90 < Log10(krSi) < −9.59]. This value is close to values suggested by Rimstidt et al. (2012) whose rate law yields Log10(krSi) = −9.96 for the temperature and pH values prevailing during our experiments (12.5°C, pH = 7.44). The slightly higher observed values may result from the calculations of the reactive surface or enhanced dissolution along highly reactive sights on the grains (Fuhr et al., 2022). Alternatively, the non-dunite related Si fluxes might have been slightly higher in dunite treated cores than in the control cores that were employed to calculate excess fluxes. Still, the conformity of krSi values suggests that the sedimentary excess Si flux largely derives from dunite (olivine) dissolution and that the kinetic constant and rate law for dunite dissolution assessed in previous studies (Rimstidt et al., 2012) can be employed to calculate and simulate the dissolution rates of dunite added to Baltic Sea surface sediments.
The evaluation of enhanced fluxes and the fate of the added substrates in this study has revealed that during anoxic to hypoxic phases the added alkaline minerals remained directly on the sediment surface due to minimal bioturbation and are dissolved by undersaturated bottom waters. Under oxic conditions (Fuhr et al., 2023), the substrates were quickly worked into the sediment by bioturbation such that dissolution was governed by intra-sedimentary processes and the resulting chemical conditions of the pore waters. Dissolution under oxic conditions appears to be slower as the transport of weathering products is driven by diffusion, whereas dissolution on the sediment implies a fast removal of weathering products directly to the bottom water. Furthermore, intra-sedimentary dissolution is only possible in the zone where ΩCal values fall below 1 (Fuhr et al., 2023). When the added material is worked into the sediment, it might not be completely exposed to corrosive pore waters. In contrast, the presented results suggest that minerals located on top of the sediment and exposed to corrosive bottom waters are more likely to completely dissolve. These differences lead to excess TA fluxes (Figure 8) that were ~2.5 times higher under anoxic to hypoxic conditions (2.48 ± 1.15 μmol cm−2d−1) compared to oxic bottom waters (0.968 ± 0.096 μmol cm−2d−1, Fuhr et al., 2023) in calcite treated cores.

Figure 8. Comparison of enhanced fluxes under oxic (Fuhr et al., 2023) and anoxic to hypoxic conditions (this study) in calcite (blue) and dunite (green) treated cores. Fluxes under anoxic/hypoxic conditions were calculated based on excess Ca and Si fluxes. For oxic conditions fluxes were calculated based on excess Ca flux in calcite treated cores and based on excess TA for dunite treated cores. Error bars denote SD of the respective calculations.
At the same time, the enhanced TA fluxes induced by the materials are different. Despite the fact that olivine weathering is 4 times more efficient with regards to TA release compared to calcite weathering (Equations 1, 2), the actual TA fluxes were 4.4 (oxic) to 5.6 (anoxic/hypoxic) times higher in calcite treated cores than those in the dunite treatments. The reason for these large differences is based on the different dissolution kinetics of both materials. Given that the average grainsize of the applied dunite was much smaller than that of the added calcite (Table 1) and that the temperature of 12.5°C constitutes the uppermost temperature that can be expected in the natural system at Boknis Eck (Melzner et al., 2013), this raises the question whether usage of olivine as a material for EBW is sensible in the Baltic Sea. It is possible, though, that under the confined laboratory conditions the benthic “weathering engine” (Meysman and Montserrat, 2017) was not as efficient as it might be under natural conditions. Nevertheless, these differences in condition and material-based efficiency are crucial findings of this study. They suggest that calcite addition is a more efficient method of EBW than dunite amendment for most seafloor areas in the Baltic Sea.
In combination with recently investigated EBW under oxic conditions (Fuhr et al., 2023), it becomes apparent that in the relatively cold Baltic Sea, calcite addition leads to significant excess TA fluxes which makes it the candidate material for OAE in this region.
Based on the assessment of different weathering mechanisms and the subsequently much higher excess TA fluxes under anoxic to hypoxic conditions, the ideal timing for addition of substrates for enhanced weathering in Boknis Eck would probably be at the beginning of anoxic to hypoxic phases. This would maximize the time that the added material is exposed to corrosive bottom waters and maximize weathering. Based on long-term observations in Boknis Eck (Melzner et al., 2013) the best time for addition would therefore be between June and early September, depending on the onset of anoxia.
Furthermore, the results of the present study reveal that under anoxic to hypoxic conditions the weathering of calcite and dunite can be traced and quantified based on dissolved Ca and Si, respectively. The concentration increase for both species was high enough to be detected and distinguishable from the background flux despite the higher flow rate in this experiment compared to the previous experiments carried out by Fuhr et al. (2023). This is also due to the fact that under anoxic to hypoxic conditions, limited macrofaunal activity allows natural and enhanced fluxes of weathering products to be more easily distinguished. As a consequence, these conditions would facilitate the monitoring during a field application for example via benthic flux chambers.
The highest TA fluxes were observed during highly anoxic periods of the experiment but were not accompanied by Ca or Si fluxes which suggests that during these strictly anoxic phases high TA background fluxes may increase pH values and thus reduce or, in the case of calcite, possibly inhibit dissolution. At the same, in an open natural system, the dilution and dispersal of the released TA is likely much larger than in laboratory incubations. Combined with the high concentrations of metabolically formed CO2, this may lead to seasonal and possibly persistent undersaturation with respect to calcite in strictly anoxic basins (Lass and Matthäus, 2008, Lencina Avila and Rehder, pers. communication). This would enhance the total area of sediments suitable for enhanced benthic weathering in the Baltic Sea (Carman and Cederwall, 2001).
An important finding of this study is the fact that the first order rate constants derived from sedimentary fluxes of dissolved Ca and Si were very close to values that were obtained in other laboratory and field studies (Rimstidt et al., 2012; Naviaux et al., 2019). This implies that these kinetic constants and the corresponding rate laws can be employed to simulate EBW and investigate the uptake of atmospheric CO2 induced by OAE in the Baltic Sea and presumably other anoxic to hypoxic ocean basins.
The present study investigates EBW of calcite and dunite on organic rich sediments from Boknis Eck in the Eckernförde Bay covered by CO2 enriched and de-oxygenated bottom waters, to assess the potential of these minerals for alkalinity enhancement and thus mCDR. For this purpose, sediment cores were amended with calcite and dunite and subsequently incubated for 19 days. The bottom water in the cores was subjected to a constant throughflow from a gas tight reservoir with deoxygenated Baltic Sea water with a defined pCO2. The addition of both materials led to an increase on weathering products such as TA, dissolved Ca and dissolved Si compared to untreated control experiments. These fluxes could be attributed to different sedimentary processes and thus the enhanced fluxes identified and quantified. The first order rate constants that were calculated based on these enhanced fluxes fit very well to the rate constants and corresponding rate laws previously published for calcite and olivine dissolution which underlines the inference that the enhanced fluxes derive from the dissolution of added calcite dunite (olivine) directly at the sediment-water interface in contact with undersaturated bottom waters.
The fact that excess TA fluxes were ~3 times higher under anoxic to hypoxic conditions compared to oxic bottom waters, allows narrowing down the ideal timing for a possible application of especially calcite on seasonally hypoxic sediments of the Baltic Sea. A highlight of this study is the congruence of observed and previously published dissolution rate constants which underpins the usability of these constants for modeling approaches toward large scale assessment of EBW as a climate change mitigation measure.
The results of this study suggest that benthic weathering of dunite and calcite can lead to significantly increased TA fluxes with higher efficiencies observed for calcite. The latter is therefore the candidate material for EBW on organic rich sediments in seasonally anoxic to hypoxic regions in the Baltic Sea. Despite the fact that biohazardous elements such as nickel were below detection limit in both bottom and pore waters in this study, more applied research using larger benthocosms or in situ field experiments will be needed to exclude negative side effects of dunite addition on the fragile ecosystem in the Baltic Sea. Such studies would also augment the understanding of natural and enhanced weathering in a close-to-natural system compared to the laboratory conditions under which these processes were investigated in this study.
The original contributions presented in the study are included in the article/Supplementary material, further inquiries can be directed to the corresponding author.
MF: Writing—original draft. KW: Supervision, Writing—review & editing. AD: Data curation, Writing—review & editing. HK: Data curation, Writing—review & editing. MS: Methodology, Writing—review & editing. SS: Data curation, Methodology, Writing—review & editing. CD: Methodology, Writing—review & editing. TS: Writing—review & editing. JK: Data curation, Writing—review & editing. SG: Conceptualization, Funding acquisition, Project administration, Supervision, Writing—review & editing.
The author(s) declare financial support was received for the research, authorship, and/or publication of this article. This study was funded by the Bundesministerium für Bildung und Forschung (BMBF; Project RETAKE, granted to SG) in the framework of the Deutsche Allianz für Meeresforschung (DAM) mission: CDRmare.
We would like to thank Anke Bleyer, Bettina Domeyer, and Regina Surberg for their help with technical and analytical procedures in the GEOMAR laboratory. Additionally, we thank the crew of FK Littorina for their support during recovery of sediment cores.
The authors declare that the research was conducted in the absence of any commercial or financial relationships that could be construed as a potential conflict of interest.
All claims expressed in this article are solely those of the authors and do not necessarily represent those of their affiliated organizations, or those of the publisher, the editors and the reviewers. Any product that may be evaluated in this article, or claim that may be made by its manufacturer, is not guaranteed or endorsed by the publisher.
The Supplementary Material for this article can be found online at: https://www.frontiersin.org/articles/10.3389/fclim.2024.1338556/full#supplementary-material
Béarat, H. J., McKelvy, M. V. G., Chizmeshya, A., Gormley, D., Nunez, R. W., Carpenter, R., et al. (2006). Carbon sequestration via aqueous olivine mineral carbonation: role of passivating layer formation. Environ. Sci. Technol. 40, 4802–4808. doi: 10.1021/es0523340
Beuttler, C., Charles, L., and Wurzbacher, J. (2019). The role of direct air capture in mitigation of anthropogenic greenhouse gas emissions. Front. Clim. 2019:10. doi: 10.3389/fclim.2019.00010
Borawska, Z., Szymczycha, B., Silberberger, M. J., Koziorowska-Makuch, K., Szczepanek, M., and Kedra, M. (2022). Benthic fluxes of dissolved silica are an important component of the marine Si cycle in the coastal zone. Estuar. Coast. Shelf Sci. 273:107880. doi: 10.1016/j.ecss.2022.107880
Brunauer, S., Emmett, P. H., and Teller, E. (1938). Adsorption of gases in multimolecular layers. J. Am. Chem. Soc. 60, 309–319. doi: 10.1021/ja01269a023
Burton, E. A., and Walter, L. M. (1987). Relative precipitation rates of aragonite and Mg calcite from seawater: temperature or carbonate ion control? Geology 15, 111–114. doi: 10.1130/0091-7613(1987)15<111:RPROAA>2.0.CO;2
Campbell, J. S., Foteinis, S., Furey, V., Hawrot, O., Pike, D., Aeschlimann, S., et al. (2022). Geochemical negative emissions technologies: part I. Review. Front. Clim. 4:879133. doi: 10.3389/fclim.2022.879133
Carman, R., and Cederwall, H. (2001). “Sediments and Macrofauna in the Baltic Sea-characteristics, nutrient contents and distribution,” in A Systems Analysis of the Baltic Sea, eds F. V. Wulff, L.A. Rahm, and P. Larsson (Berlin; Heidelberg: Springer Berlin Heidelberg), 289–327.
Caserini, S., Cappello, G., Righi, D., Raos, G., Campo, F., De Marco, S., et al. (2021). Buffered accelerated weathering of limestone for storing CO2: chemical background. Int. J. Greenh. Gas Control 112:103517. doi: 10.1016/j.ijggc.2021.103517
Dale, A. W., Paul, K. M., Clemens, D., Scholz, F., Schroller-Lomnitz, U., Wallmann, K., et al. (2021). Recycling and burial of biogenic silica in an open margin oxygen minimum zone. Glob. Biogeochem. Cycles 35:e2020GB006583. doi: 10.1029/2020GB006583
Dale, A. W., Sommer, S., Bohlen, L., Treude, T., Bertics, V. J., Bange, H. W., et al. (2011). Rates and regulation of nitrogen cycling in seasonally hypoxic sediments during winter (Boknis Eck, SW Baltic Sea): sensitivity to environmental variables. Estuar. Coast. Shelf Sci. 95, 14–28. doi: 10.1016/j.ecss.2011.05.016
Dale, A. W., Sommer, S., Lomnitz, U., Bourbonnais, A., and Wallmann, K. (2016). Biological nitrate transport in sediments on the Peruvian margin mitigates benthic sulfide emissions and drives pelagic N loss during stagnation events. Deep. Res. Part I Oceanogr. Res. Pap. 112, 123–136. doi: 10.1016/j.dsr.2016.02.013
Dale, A. W., Sommer, S., Ryabenko, E., Noffke, A., Bohlen, L., Wallmann, K., et al. (2014). Benthic nitrogen fluxes and fractionation of nitrate in the Mauritanian oxygen minimum zone (Eastern Tropical North Atlantic). Geochim. Cosmochim. Acta 134, 234–256. doi: 10.1016/j.gca.2014.02.026
Dickson, A. G. (1993). The measurement of sea water pH. Mar. Chem. 44, 131–142. doi: 10.1016/0304-4203(93)90198-W
E. King, H., Plümper, O., and Putnis, A. (2010). Effect of secondary phase formation on the carbonation of olivine. Environ. Sci. Technol. 44, 6503–6509. doi: 10.1021/es9038193
Fakhraee, M., Li, Z., Planavsky, N. J., and Reinhard, C. T. (2023). A biogeochemical model of mineral-based ocean alkalinity enhancement: impacts on the biological pump and ocean carbon uptake. Environ. Res. Lett. 18:44047. doi: 10.1088/1748-9326/acc9d4
Feng, E. Y., Koeve, W., Keller, D. P., and Oschlies, A. (2017). Model-based assessment of the CO2 sequestration potential of coastal ocean alkalinization. Earth's Futur. 5, 1252–1266. doi: 10.1002/2017EF000659
Flipkens, G., Blust, R., and Town, R. M. (2021). Deriving Nickel (Ni(II)) and Chromium (Cr(III)) based environmentally safe olivine guidelines for coastal enhanced silicate weathering. Environ. Sci. Technol. 55, 12362–12371. doi: 10.1021/acs.est.1c02974
Flipkens, G., Fuhr, M., Fiers, G., Meysman, F. J. R., Town, R. M., and Blust, R. (2023). Enhanced olivine dissolution in seawater through continuous grain collisions. Geochim. Cosmochim. Acta 359, 84–99. doi: 10.1016/j.gca.2023.09.002
Foteinis, S., Campbell, J. S., and Renforth, P. (2023). Life cycle assessment of coastal enhanced weathering for carbon dioxide removal from air. Environ. Sci. Technol. 57, 6169–6178. doi: 10.1021/acs.est.2c08633
Fuhr, M., Geilert, S., Schmidt, M., Liebetrau, V., Vogt, C., Ledwig, B., et al. (2022). Kinetics of olivine weathering in seawater: an experimental study. Front. Clim. 4:831587. doi: 10.3389/fclim.2022.831587
Fuhr, M., Wallmann, K., Dale, A. W., Diercks, I., Kalapurakkal, H. T., Schmidt, M., et al. (2023). Disentangling artificial and natural benthic weathering in organic rich Baltic Sea sediments. Front. Clim. 2023:1245580. doi: 10.3389/fclim.2023.1245580
Fuss, S., Lamb, W. F., Callaghan, M. W., Hilaire, J., Creutzig, F., Amann, T., et al. (2018). Negative emissions—part 2: costs, potentials and side effects. Environ. Res. Lett. 13:aabf9f. doi: 10.1088/1748-9326/aabf9f
Gasiunaite, Z. R., Cardoso, A. C., Heiskanen, A.-S., Henriksen, P., Kauppila, P., Olenina, I., et al. (2005). Seasonality of coastal phytoplankton in the Baltic Sea: influence of salinity and eutrophication. Estuar. Coast. Shelf Sci. 65, 239–252. doi: 10.1016/j.ecss.2005.05.018
Griffioen, J. (2017). Enhanced weathering of olivine in seawater: the efficiency as revealed by thermodynamic scenario analysis. Sci. Total Environ. 575, 536–544. doi: 10.1016/j.scitotenv.2016.09.008
Hartmann, J., and Kempe, S. (2008). What is the maximum potential for CO2 sequestration by “stimulated” weathering on the global scale? Naturwissenschaften 95, 1159–1164. doi: 10.1007/s00114-008-0434-4
Hartmann, J., Suitner, N., Lim, C., Schneider, J., Marín-Samper, L., Arístegui, J., et al. (2023). Stability of alkalinity in ocean alkalinity enhancement (OAE) approaches—consequences for durability of CO2 storage. Biogeosciences 20, 781–802. doi: 10.5194/bg-20-781-2023
Hiscock, W. T., and Millero, F. J. (2006). Alkalinity of the anoxic waters in the Western Black Sea. Deep Sea Res. II Top. Stud. Oceanogr. 53, 1787–1801. doi: 10.1016/j.dsr2.2006.05.020
Hochstetter, F. (1859). Lecture on the geology of the province of Nelson. New Zeal. Governemt Gaz. 7, 90–102.
IPCC (2021). “Climate change 2021: the physical science basis,” in Contribution of Working Group I to the Sixth Assessment Report of the Intergovernmental Panel on Climate Change, eds. V. Masson-Delmotte, P. Zhai, A. Pirani, S. L. Connors, C. Péan, S. Berger, et al. Cambridge: Cambridge University Press.
Ivanenkov, V. N., and Lyakhin, Y. I. (1978). Determination of the alkalinity of seawater. Methods Hydrochem. Stud. Ocean 1978, 110–115.
Jeroschewski, P., Steuckart, C., and Kühl, M. (1996). An amperometric microsensor for the determination of H2S in aquatic environments. Anal. Chem. 68, 4351–4357. doi: 10.1021/ac960091b
Kremer, D., Etzold, S., Boldt, J., Blaum, P., Hahn, K. M., Wotruba, H., et al. (2019). Geological mapping and characterization of possible primary input materials for the mineral sequestration of carbon dioxide in Europe. Minerals 9:80485. doi: 10.3390/min9080485
Lass, H. U., and Matthäus, W. (2008). General oceanography of the Baltic Sea. State Evol. Balt. Sea, 1952-2005 A Detail. 50-Year Surv. Meteorol. Clim. Phys. Chem. Biol. Mar. Environ. 2, 5–43. doi: 10.1002/9780470283134.ch2
Lein, A. Y. (2004). Authigenic carbonate formation in the ocean. Lithol. Miner. Resour. 39, 1–30. doi: 10.1023/B:LIMI.0000010767.52720.8f
Meier, H. E. M., Eilola, K., Almroth-Rosell, E., Schimanke, S., Kniebusch, M., Höglund, A., et al. (2019). Disentangling the impact of nutrient load and climate changes on Baltic Sea hypoxia and eutrophication since 1850. Clim. Dyn. 53, 1145–1166. doi: 10.1007/s00382-018-4296-y
Melzner, F., Thomsen, J., Koeve, W., Oschlies, A., Gutowska, M. A., Bange, H. W., et al. (2013). Future ocean acidification will be amplified by hypoxia in coastal habitats. Mar. Biol. 160, 1875–1888. doi: 10.1007/s00227-012-1954-1
Meysman, F. J. R., and Montserrat, F. (2017). Negative CO2 emissions via enhanced silicate weathering in coastal environments. Biol. Lett. 13:20160905. doi: 10.1098/rsbl.2016.0905
Millero, F. J., Plese, T., and Fernandez, M. (1988). The dissociation of hydrogen sulfide in seawater. Limnol. Oceanogr. 33, 269–274. doi: 10.4319/lo.1988.33.2.0269
Montserrat, F., Renforth, P., Hartmann, J., Leermakers, M., Knops, P., and Meysman, F. J. R. (2017). Olivine dissolution in seawater: implications for CO2 sequestration through enhanced weathering in coastal environments. Environ. Sci. Technol. 51, 3960–3972. doi: 10.1021/acs.est.6b05942
Moras, C. A., Bach, L. T., Cyronak, T., Joannes-Boyau, R., and Schulz, K. G. (2022). Ocean alkalinity enhancement – avoiding runaway CaCO3 precipitation during quick and hydrated lime dissolution. Biogeosciences 19, 3537–3557. doi: 10.5194/bg-19-3537-2022
Müller, J. D., Bastkowski, F., Sander, B., Seitz, S., Turner, D. R., Dickson, A. G., et al. (2018). Metrology for pH measurements in brackish waters-part 1: extending electrochemical pHT measurements of TRIS buffers to salinities 5-20. Front. Mar. Sci. 5, 1–12. doi: 10.3389/fmars.2018.00176
Naviaux, J. D., Subhas, A. V., Dong, S., Rollins, N. E., Liu, X., Byrne, R. H., et al. (2019). Calcite dissolution rates in seawater: lab vs. in-situ measurements and inhibition by organic matter. Mar. Chem. 215:103684. doi: 10.1016/j.marchem.2019.103684
Nilsson, M. M., Kononets, M., Ekeroth, N., Viktorsson, L., Hylén, A., Sommer, S., et al. (2019). Organic carbon recycling in Baltic Sea sediments—an integrated estimate on the system scale based on in situ measurements. Mar. Chem. 209, 81–93. doi: 10.1016/j.marchem.2018.11.004
Oelkers, E. H. (2001). An experimental study of forsterite dissolution rates as a function of temperature and aqueous Mg and Si concentrations. Chem. Geol. 175, 485–494. doi: 10.1016/S0009-2541(00)00352-1
Palandri, J. L., and Kharaka, Y. K. (2004). A compilation of rate parameters of water-mineral interaction kinetics for application to geochemical modeling, USGS Open File Report. doi: 10.3133/ofr20041068
Pratt, K. W. (2014). Measurement of pHT values of Tris buffers in artificial seawater at varying mole ratios of Tris: Tris·HCl. Mar. Chem. 162, 89–95. doi: 10.1016/j.marchem.2014.03.003
Renforth, P., and Henderson, G. (2017). Assessing ocean alkalinity for carbon sequestration. Rev. Geophys. 55, 636–674. doi: 10.1002/2016RG000533
Rickert, D. (2000). Dissolution kinetics of biogenic silica in marine environments= Lösungskinetik von biogenem Opal in marinen Systemen. Berichte zur Polarforsch. Reports Polar Res. 351.
Rigopoulos, I., Harrison, A. L., Delimitis, A., Ioannou, I., Efstathiou, A. M., Kyratsi, T., et al. (2018). Carbon sequestration via enhanced weathering of peridotites and basalts in seawater. Appl. Geochemistry 91, 197–207. doi: 10.1016/j.apgeochem.2017.11.001
Rimstidt, J. D., Brantley, S. L., and Olsen, A. A. (2012). Systematic review of forsterite dissolution rate data. Geochim. Cosmochim. Acta 99, 159–178. doi: 10.1016/j.gca.2012.09.019
Sternbeck, J., and Sohlenius, G. (1997). Authigenic sulfide and carbonate mineral formation in holocene sediments of the baltic sea. Chem. Geol. 135, 55–73. doi: 10.1016/S0009-2541(96)00104-0
Subhas, A. V., Rollins, N. E., Berelson, W. M., Dong, S., Erez, J., and Adkins, J. F. (2015). A novel determination of calcite dissolution kinetics in seawater. Geochim. Cosmochim. Acta 170, 51–68. doi: 10.1016/j.gca.2015.08.011
Wallmann, K., Diesing, M., Scholz, F., Rehder, G., Dale, A. W., Fuhr, M., et al. (2022). Erosion of carbonate-bearing sedimentary rocks may close the alkalinity budget of the Baltic Sea and support atmospheric CO2 uptake in coastal seas. Front. Mar. Sci. 9:968069. doi: 10.3389/fmars.2022.968069
Walter, L. M., and Morse, J. W. (1985). The dissolution kinetics of shallow marine carbonates in seawater: a laboratory study. Geochim. Cosmochim. Acta 49, 1503–1513. doi: 10.1016/0016-7037(85)90255-8
Zeebe, R. E., and Wolf-Gladrow, D. (2001). Chapter 1: Equilibrium, in: CO2 in Seawater: Equilibrium, Kinetics, Isotopes, Elsevier Oceanography Series. Amsterdam: Elsevier. Available online at: https://www.frontiersin.org/articles/10.3389/fclim.2023.1245580/full
Keywords: enhanced benthic weathering, carbon sequestration, dunite and carbonate dissolution, micro-profiles, anoxia, hypoxia
Citation: Fuhr M, Wallmann K, Dale AW, Kalapurakkal HT, Schmidt M, Sommer S, Deusner C, Spiegel T, Kowalski J and Geilert S (2024) Alkaline mineral addition to anoxic to hypoxic Baltic Sea sediments as a potentially efficient CO2-removal technique. Front. Clim. 6:1338556. doi: 10.3389/fclim.2024.1338556
Received: 14 November 2023; Accepted: 10 January 2024;
Published: 02 February 2024.
Edited by:
James Campbell, Heriot-Watt University, United KingdomReviewed by:
Davide Ciceri, AgroPlantae, United StatesCopyright © 2024 Fuhr, Wallmann, Dale, Kalapurakkal, Schmidt, Sommer, Deusner, Spiegel, Kowalski and Geilert. This is an open-access article distributed under the terms of the Creative Commons Attribution License (CC BY). The use, distribution or reproduction in other forums is permitted, provided the original author(s) and the copyright owner(s) are credited and that the original publication in this journal is cited, in accordance with accepted academic practice. No use, distribution or reproduction is permitted which does not comply with these terms.
*Correspondence: Michael Fuhr, bWZ1aHJAZ2VvbWFyLmRl
Disclaimer: All claims expressed in this article are solely those of the authors and do not necessarily represent those of their affiliated organizations, or those of the publisher, the editors and the reviewers. Any product that may be evaluated in this article or claim that may be made by its manufacturer is not guaranteed or endorsed by the publisher.
Research integrity at Frontiers
Learn more about the work of our research integrity team to safeguard the quality of each article we publish.