 Giusy Fedele
 Ilenia Manco1,2
 Giorgia Verri
 Paola Mercogliano
95% of researchers rate our articles as excellent or good
Learn more about the work of our research integrity team to safeguard the quality of each article we publish.
Find out more
ORIGINAL RESEARCH article
Front. Clim. , 28 February 2024
Sec. Predictions and Projections
Volume 6 - 2024 | https://doi.org/10.3389/fclim.2024.1330299
This article is part of the Research Topic Coastal Climate Monitoring and Downscaling for Adaptation Planning in the Adriatic Sea View all 12 articles
Increasing climate resilience to global warming is one of the main challenges of the last few decades. Effective local measures have to be adopted to provide concrete solutions to the current and expected impacts of climate change. This is the goal of the AdriaClim Italia-Croatia Interreg Project (https://www.italy-croatia.eu/web/adriaclim), aimed at supporting the development of regional and local climate change adaptation plans for the Adriatic coastal regions. For this purpose, an exhaustive number of atmospheric climate indicators have been identified and evaluated across nine pilot areas to assess the current and expected main climate hazards affecting these regions, considering the worst-case emissions scenario (Representative Concentration Pathway RCP 8.5). The proposed analyses are provided by the results of the regional climate atmospheric model developed within the AdriaClim Project. The selected climate indicators are used to assess the possible evolution of the climate hazard across the pilot areas, covering different hazards, such as thermal discomfort, drought, and hydrological instability. A site-dependent investigation of the atmospheric climate indicators is proposed to emphasize which regions are more affected than others by the investigated climate hazards, thus warranting more attention in defining and proposing new adaptation strategies. The results highlight increasing temperatures (up to +3°C) across the Adriatic coastal regions, with more emphasis on the Northern Adriatic, where the combined effect with the relevant decrease in precipitation (down to −2 mm/day) may lead to severe drought conditions in the coming decades. In contrast, precipitation-related diseases may hit more Central and South Italy than the Northern Adriatic, except for the Emilia-Romagna region, which is found to be highly sensitive to both hazard categories. Finally, it is relevant to emphasize that these analyses have to be carefully considered in supporting adaptation strategies due to the lack of uncertainty estimates representing a fundamental element for decision-makers.
The current climate emergency requires effective measures to improve resilience and adaptation to climate change (CC), overcome major challenges, and transform problems into effective solutions. The increase in global temperatures due to anthropic emissions is noticeable and has multiple impacts on the socioeconomic systems, such as agriculture, infrastructures, cultural heritage, tourism, energy, and health diseases (e.g., Doughty et al., 2015; Hermans and McLeman, 2021; Ahmed et al., 2022). Events associated with extreme weather can have a serious impact on the socioeconomic systems requiring the identification of interventions where resilience-building is the most effective. The Sixth Intergovernmental Panel on Climate Change (IPCC) Report AR6 (Allan et al., 2021) indicates a general consensus that anthropogenic CC is modifying the frequency and intensity of extreme events such as heatwaves, cold spells, storms, and floods. Extreme weather events are expected to become more frequent and disruptive. The IPCC highlights that, in the intermediate seasons, we will observe a large variability of rain associated with both tropical and extratropical storms and convective events, leading to an alteration of the hydrological cycle (Gordon et al., 2005; Bala et al., 2010; Pendergrass et al., 2017). These trends are expected to accelerate in the next few years if the carbon emissions are not reduced quickly (Trisos et al., 2020). Global warming exacerbates the severity of extreme rainfalls, droughts, and heat waves, with huge associated impacts, from local to wider scales. Among the regions more affected by CC, the Mediterranean basin is considered a hotspot (Cos et al., 2022), and the North-Eastern Adriatic basin is found to be more sensitive than other regions to CC (Straffelini and Tarolli, 2023). Summer heat waves are increasing in frequency and duration, and their impacts on mortality are remarkable. For instance, in the summer of 2022, heatwaves are considered the cause of death for thousands of people, and Italy is the country in the Mediterranean with the highest percentage of heat-related mortality (Ballester et al., 2023). The last CNR Periodic Report on the Risk posed to the Italian Population by Landslides and Floods1 reveals that there were 95 deaths due to hydrological instability over Italy during the period from 2018 to 2022 and 20 deaths between January and June 2023. For instance, events such as the floods in Marche and Ischia in September and November 2022, and those in Emilia-Romagna and Croatia in May 2023, were responsible for the destruction of entire villages, infrastructure, and heavy loss of lives. Those events are expected to increase due to global warming, and therefore, it is increasingly important to improve climate resilience, adopting adaptation plans, and mitigation measures, especially in regions under higher risk.
These are the objectives of the AdriaClim Italia-Croatia Interreg Project,2 devoted to supporting the development of science-based regional and local CC adaptation plans with a focus on the Adriatic coastal areas, which are recognized as one of the main CC hotspots in the Mediterranean region (e.g., Bucchignani et al., 2016; Straffelini and Tarolli, 2023). The objectives of this project were divided into three main steps: (i) to provide new accurate climate data at high spatial and temporal resolution, both installing new monitoring stations and also performing updated and integrated climate simulations; (ii) to provide more accurate CC indicators to be aware of the hazards related to the Adriatic regions; and then (iii) to settle new advanced regional adaptation plans and mitigation strategies based on the datasets developed within the project.
Taking advantage of the modeling data produced within phase (i), an exhaustive number of indicators have been designed at the Adriatic and local levels in phase (ii), covering the main climate hazards affecting the Adriatic coastal areas. From the integrated climate simulations, indicators have been computed over the Adriatic regions for atmosphere, sea state, hydrology, and biogeochemistry. They are freely accessible from the ERDDAP AdriaClim Project data server3 and geoportal.4 The full list of indicators developed within the project is also shown in its deliverable 4.2.1 (DOI: 10.13140/RG.2.2.32890.67524). In this study, the results coming from phase (ii) are described, with a focus only on the atmospheric-related hazards, by selecting a subset of relevant CC indicators (Table 1). It is worth mentioning that the latter has been designed with the aim of satisfying the local stakeholders’ needs and assessing climate change across the Adriatic region. They cover many climate hazards, such as extreme temperatures, thermal discomfort, drought, and hydrological instability. Discussions between project partners and local stakeholders were conducted within the project through technical meetings, devoted to defining the main hazards related to the pilot areas. Tailored climate indicators for each region were designed. Nevertheless, for simplicity, only the ones shared among the pilot area are analyzed in this study.
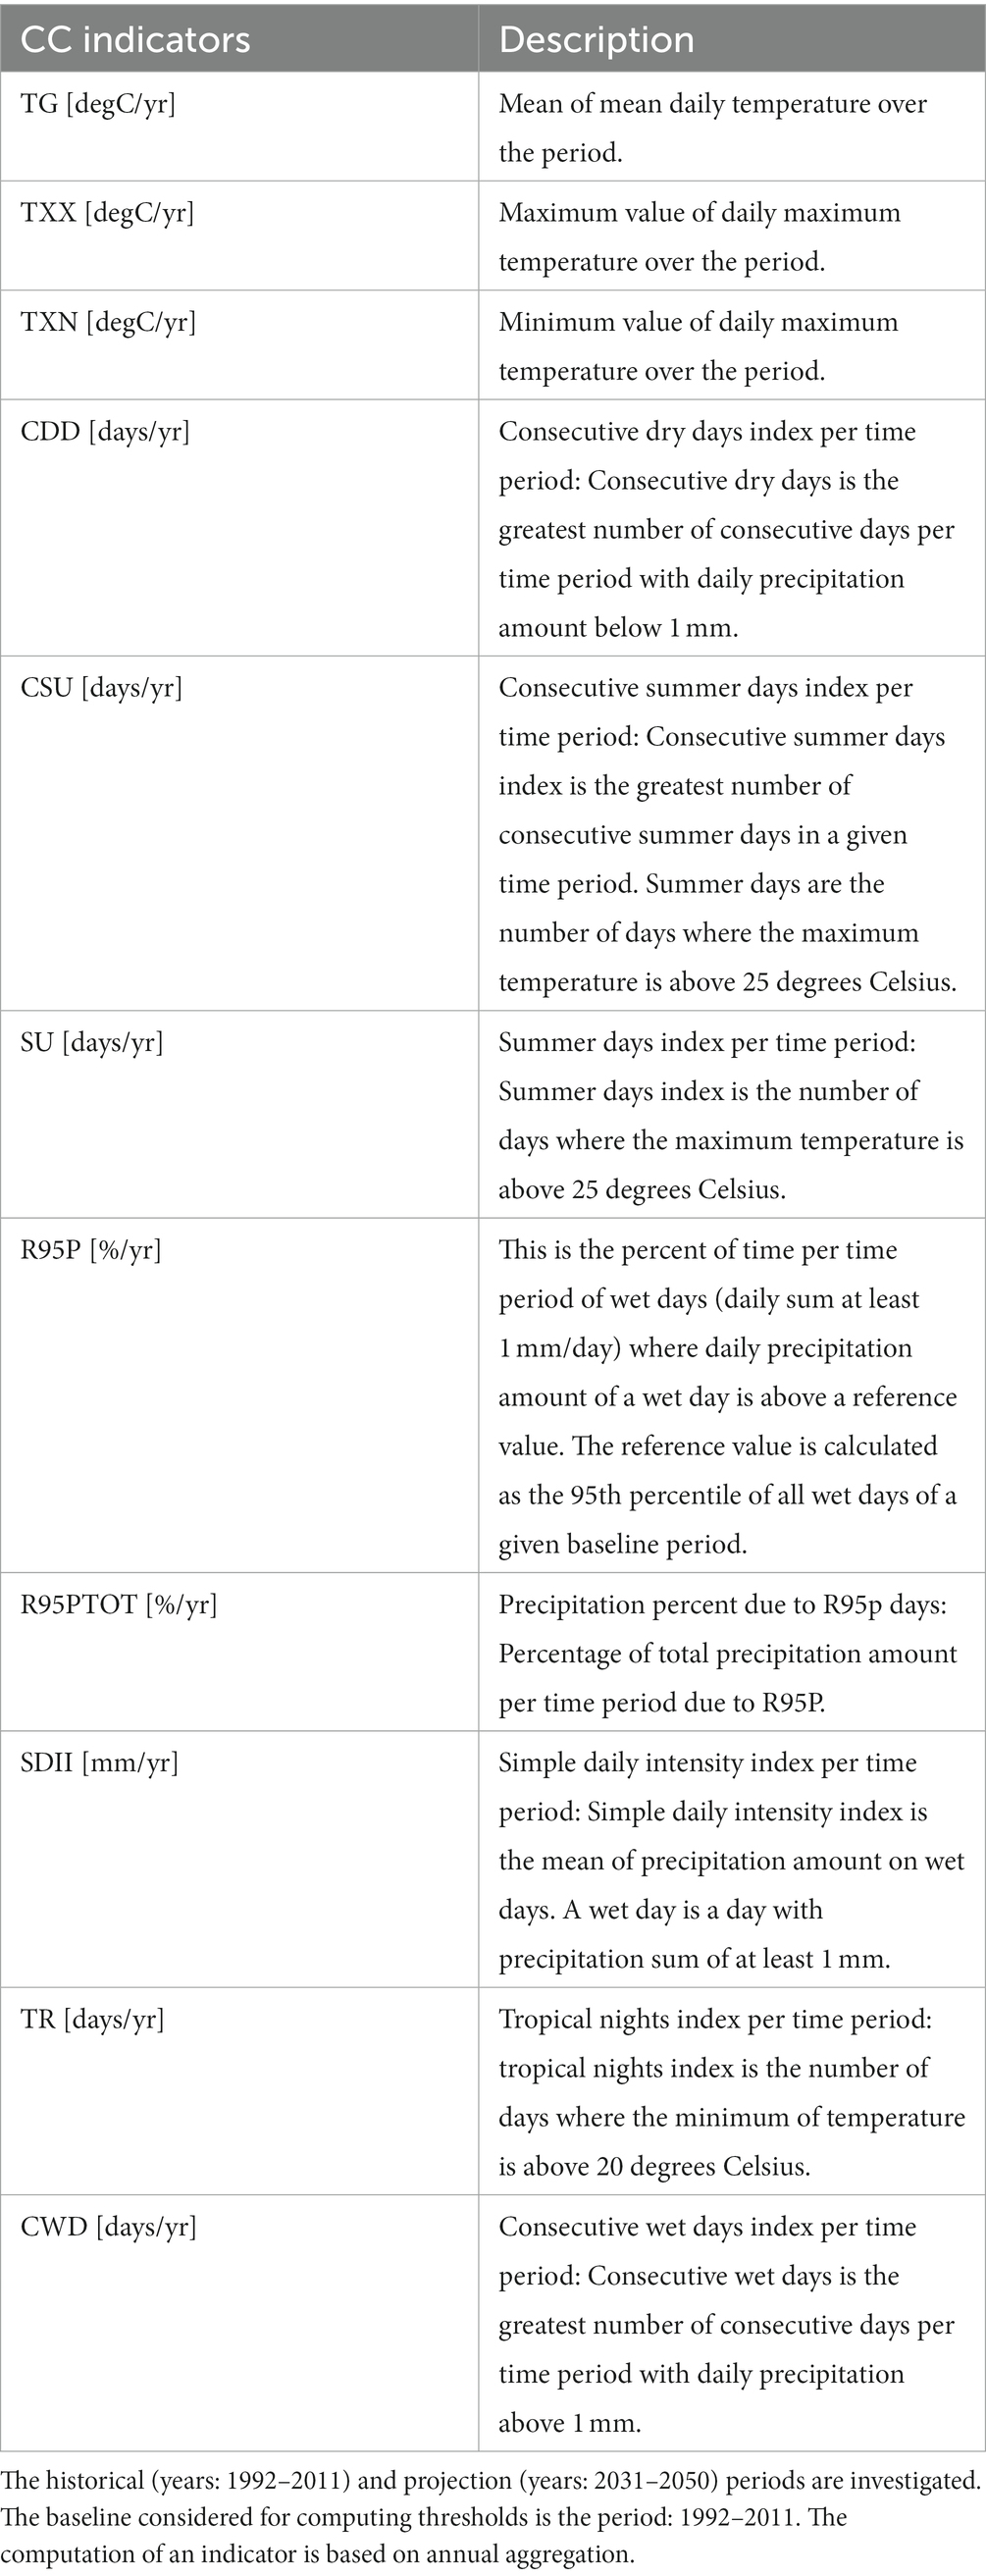
Table 1. Description of investigated indicators.
For their calculation, two variables are needed: temperature (T) and precipitation (PREC). Before computing the indicators, an initial phase was devoted to the investigation of the model performance in reproducing the historical climate. In this respect, the ERA5-Land re-analysis provided by the Copernicus Climate Change Service has been used as a reference (Muñoz Sabater, 2019) to evaluate the absolute values of the climate indicators over the period (1992–2011). Then, a detailed study was conducted on the role of the atmospheric hazards across the nine pilot areas designed within the Project and localized along the Adriatic coasts, providing statistical evidence of the role of CC in the inspected areas. The pilot areas designed are the following: Grado and Marano Lagoon and Gulf of Trieste, Venice Lagoon and Veneto coastal area, Emilia-Romagna coastal area, Puglia coastal area, Dubrovnik-Neretva estuary area, Split-Dalmatia coastal area, North-Eastern Adriatic Sea, Molise coastal area, and Marche coastal area. Nevertheless, as available data cover a much wider territory, hereafter we will refer to Puglia, Marche, Emilia-Romagna, Veneto, Molise, Friuli-Venezia Giulia, Dubrovnik-Neretva, Split-Dalmatia, Istria, and Primorje-Gorski Kotar. The site-dependent investigation of the atmospheric indicators is proposed to emphasize which regions are more affected than others by the investigated climate hazards, and therefore deserve more attention in defining and proposing new adaptation strategies.
The main goal of this study was to present the results achieved within phase (ii) of the AdriaClim Project, focusing on the designed atmospheric climate indicators. Therefore, the results shown in this study are not supported by uncertainty estimates, which are fundamental for developing robust adaptation strategies. Future investigations should consider a wider set of atmospheric climate simulations at high resolution available over Italy (e.g., Raffa et al., 2023), in order to estimate the model uncertainty.
The limited area model (LAM) developed within the AdriaClim Project consists of an integrated and high-resolution Earth system model at mesoscale resolution and high temporal frequency. It is made of five components: atmosphere (WRF), hydrology (WRF-Hydro), marine hydrodynamics (NEMO), waves (WW3), and biochemistry (BFM). A detailed description is available in Deliverable 3.2.1 of the AdriaClim Project.5 Moreover, the WRF model configuration used (Skamarock et al., 2008) is also comprehensive of a land-surface sub-model component provided by NOAH (Ek et al., 2003). The atmospheric and the land-surface components share the same computational domain centered over the Mediterranean Sea at approximately 6 km spatial resolution and 6 h time frequency. The hydrological–hydraulics modules of WRFHydro component prognostically solve the selected 145 catchments ending into the Adriatic Sea with 600 m resolution. The marine component (NEMO) has a 2-km resolution computational grid centered on the Adriatic basin, with simulated 2D/3D modeling outcomes at 3-h/1 day time frequency.
The AdriaClim LAM is dynamically downscaled within a fully coupled regional climate model RCM (LMDz-NEMOMED; L’Heveder et al., 2013) available in the framework of the Med-CORDEX initiative (Ruti et al., 2016) and representing the state-of-the-art for the climate studies across our area of interest with approximately 30 km horizontal resolution for the atmosphere and 10 km for the ocean. Two downscaled climate simulations, each spanning 30 years, have been conducted with the LAM components WRF and WRFHydro, coupled in a one-way mode with the marine component, which, in turn, is forced at the air–sea and land–sea interfaces by WRF and WRF-Hydro, respectively. The coupling among the Earth system components is a one-way mode to exploit the upgrades introduced with the bias correction approach.
The climate window covered by the downscaling experiment spans from 1990 to 2050 with reinitialization in 2020. The RCP 8.5 scenario is considered. The two time-slice simulations allow the hindcast experiment to learn from the use of bias correction. The starting years of the two time slices 1990–2020 and 2020–2050 are considered spin-up periods.
The grid spacings of the AdriaClim LAM ensure a proper resolution ratio of 1:5 for both atmosphere–land and marine downscaling. This combined with the time frequency considered here allows us to solve the mesoscale processes and the Earth system component interactions occurring at these scales. The atmospheric model component resolution of the AdriaClim LAM does not allow explicit solving of convection, but developing a higher resolution would mean a huge downscaling computational effort. Therefore, a compromise of 1:5 downscaling ratio was applied, and the Tiedtke parameterization scheme for convection was activated within WRF.
To our knowledge, this is the first attempt to provide nested climate simulation over the Adriatic Sea at a few kilometer resolution and with all the Earth system components interacting with each other. This is expected to offer a more comprehensive knowledge of the Adriatic past, present, and future climate.
This objective justified the use of a single downscaling experiment, which is still common in the climate downscaling framework (Drenkard et al., 2021), combined with other practical reasons: (i) the computational constraints of the high-resolution multi-model here proposed and (ii) the gaps of the stored datasets within regional climate modeling initiatives as Med-CORDEX which do not allow to perform further downscaling at local scales.
As the aim of this study was to evaluate the evolution of climate indicators over the Adriatic coasts, it is necessary first to assess the ability of the atmospheric climate simulation to reproduce the past climate. To achieve this aim, the ERA5-Land high spatial (0.1°x 0.1°, 9 km) and temporal resolution (hourly) global atmospheric re-analysis is used, which provides a view of the evolution of variables over land from January 1950 to the present (Muñoz Sabater, 2019). It has been produced by combining global observations with the ECMWF ERA5 climate re-analysis (~ 30 km resolution; Hersbach et al., 2023) through physical equations. It provides a huge set of atmospheric variables over land on a regular latitude–longitude grid freely available on the Copernicus Climate Change Service portal (C3S; 10.24381/cds.e2161bac; last access 13/09/2023). For these characteristics and its wide use in the literature, it has been chosen as a reference dataset to evaluate the model skills of the AdriaClim-WRF surface temperature (daily mean, maximum, and minimum values) and precipitation field at daily frequency, which are used for the computation of the climate indicators (Table 1) and describe the main hazards across the regions of interest.
In order to partially remove the simulation model bias (Maraun, 2016), both the T and PREC variables were bias-corrected. Many bias-correction methods exist with different levels of complexity. Preferring a specific bias adjustment method over another may lead to uncertainty within the results. In fact, in literature, it is a common practice to apply different bias-correction methodologies (Casanueva et al., 2020). In this study, Empirical Quantile Mapping (EQM) has been chosen for its wide use in literature and flexibility (e.g., Piani et al., 2010; Gudmundsson et al., 2012; Lafon et al., 2013). It consists of point-by-point extrapolation of the statistical relationships between the model and the reference dataset over a common time series (control period). Once these statistics are retrieved, the entire period of interest is corrected, mapping all the quantiles from the model output’s empirical CDF onto the corresponding reference distribution. By using constant extrapolation, values that lie outside the calibration range are adjusted (with first and last percentile corrections for values below and above the calibration range respectively, according to Themeßl et al., 2012). Moreover, uncertainties may be also related to the reference data used. In fact, the choice of a specific dataset, instead of another, may impact the results (Casanueva et al., 2020). In future studies, this approach could be extended to other bias-adjustment techniques, using different reference data for model calibration, and investigating the uncertainty associated with the chosen methodology and observations. Due to the model frequency and data availability, two re-analyses were used to bias-correct the atmospheric simulation: UERRA-MESCAN-SURFEX (Copernicus Climate Change Service, Climate Data Store, 2019) for the temperature field and ERA5 for the precipitation (Hersbach et al., 2023). UERRA has been chosen as it provides temperature data at a high spatial and temporal frequency (5.5 km and 1 h, respectively) over the domain of interest; meanwhile, it was not suitable for the precipitation field as the precipitation is available only at a daily frequency. Therefore, ERA5 was selected as it provides data over the entire territory, over both land and sea, at hourly frequency. Moreover, ERA5-Land was not taken into consideration as it provides land-only atmospheric data and the bias correction had to be applied over both land and sea.
For both the variables and datasets, a preliminary processing has been applied to make them comparable to each other, in terms of spatial/temporal coverage and temporal resolution. In this respect, T has been daily averaged from its native temporal resolution (6/1 hourly in WRF/ERA5-Land) for both datasets, while PREC has been cumulated at daily frequency. In addition, as this study is focused on the 9-AdriaClim Pilot Areas, the areas outside this domain are masked. Several diagnostics are used to evaluate the ability of the AdriaClim-WRF model to capture T and PREC: mean daily fields, probability density function (PDF), mean value (mean), and standard deviation (stdev) over the historical period from 1992 to 2011. The model spin-up for the historical run is neglected.
After the assessment of the model skills in reproducing T and PREC, the freely available CC atmospheric indicators obtained from these variables are investigated. The atmospheric indicators have been computed within the project activities taking advantage of the freely available CDO_ECA Tool,6 adapting the codes to the project purposes. The CDO_ECA Tool is based on the definitions provided by the Expert Team on Climate Change Detection and Indices (ETCCDI7) and by the European Climate Assessment (ECA8) projects. Eleven CC-relevant atmospheric indicators are chosen among those provided within the AdriaClim Project. Their description is available in Table 1. They are computed at annual aggregation on two time frames of the historical and projection periods, which are, respectively, 1992–2011 and 2031–2050. These periods are selected as they are found in good agreement with re-analyses for the five-model components (Deliverable 3.2.1; Verri et al., 2023, under revision; Mentaschi et al., 2024, under revision) and therefore are suitable for the purposes of this study. In particular, it has been found that the last 10 years of the historical experiment overestimated the wind intensity as the driving RCM and underestimated the river runoff for a few catchments, due to the shifted spatial distribution of the precipitation patterns. However, the first years of the projection simulation have been excluded to avoid any “step-like” numerical effect due to the new initialization of the climate model in 2020 with the RCP8.5 scenario forcing.
In order to provide a compact view of the properties of the 11 indicators over the nine pilot areas (Figure 1), boxplots are used to present the results. Moreover, Student’s t distribution has been applied to each indicator and pilot area (Pearson, 1895) to test the significance and detect the existing outliers. The bottom and top whiskers present the minimum and maximum significance values (with a ). Only values at a 95% level of significance are considered.
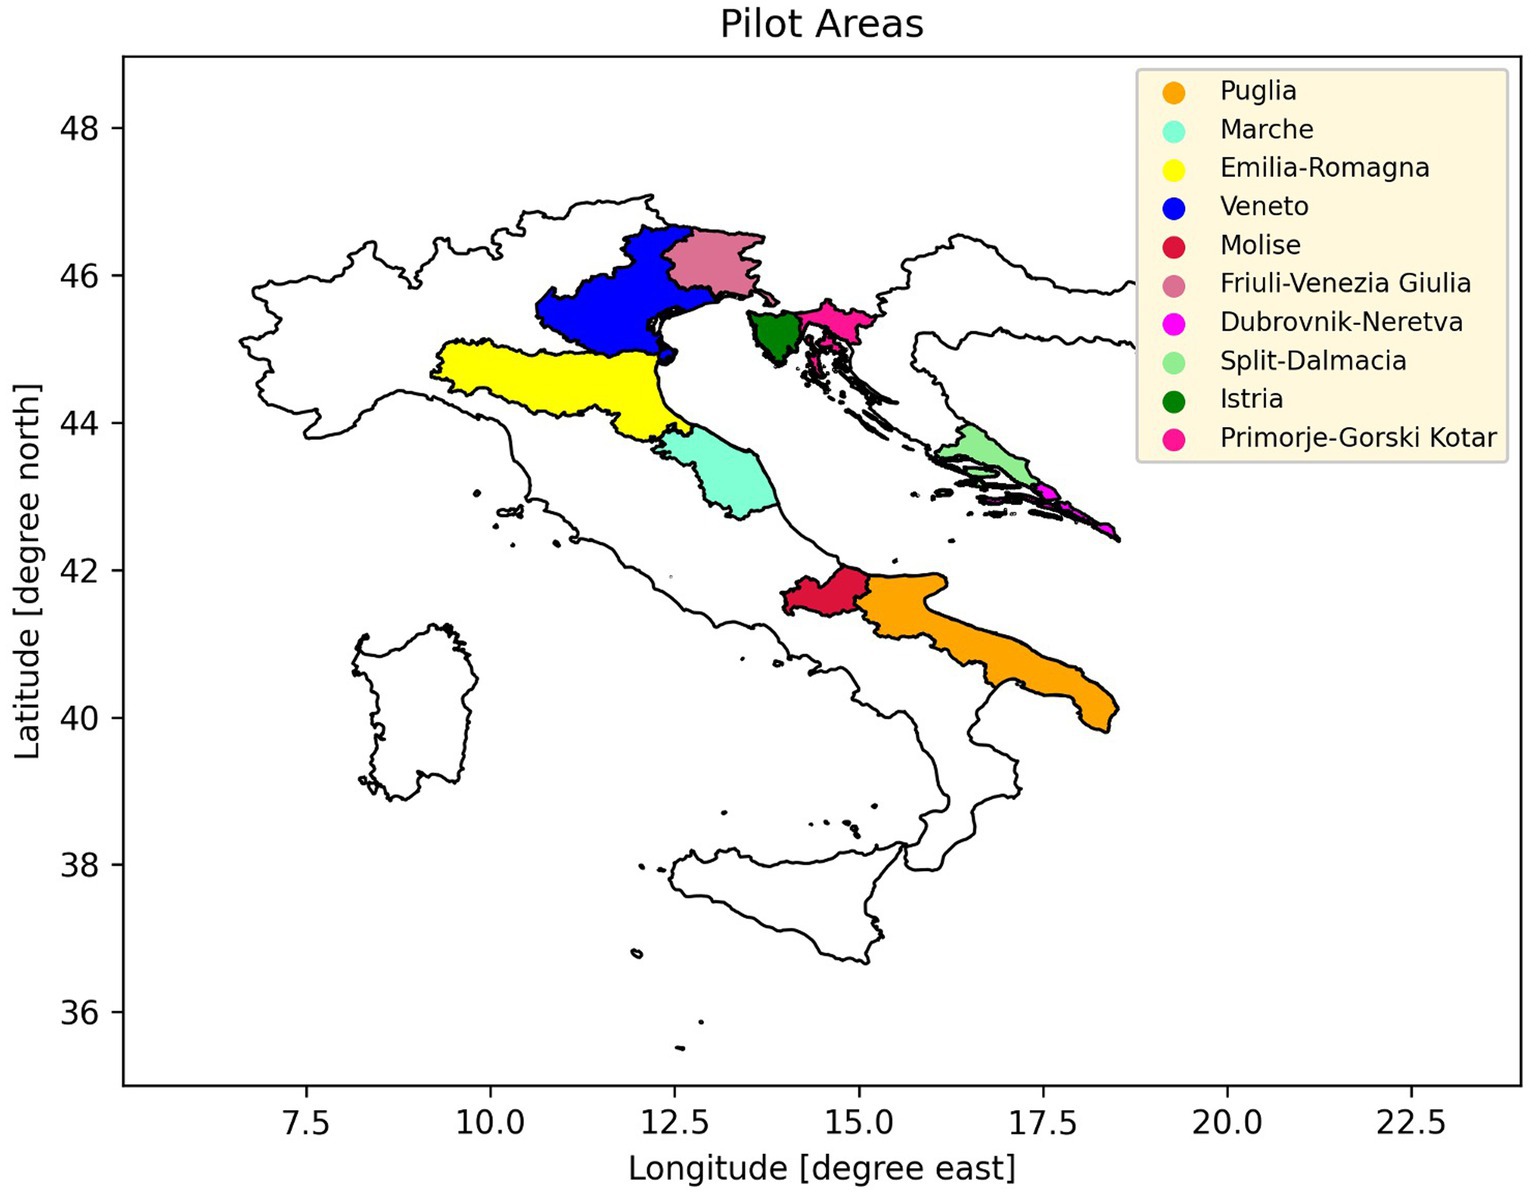
Figure 1. Investigated pilot areas over Italy and Croatia.
Taking advantage of the CC computed indicators (Table 1), differences among the mean state of the indicators in the projection and historical period are computed. The differences are obtained by subtracting the averaged value over the projection period from the respective averaged value over the historical one for each grid point of the domain. Those differences are computed both over the entire period and seasonal basis. For the latter, the seasons are extracted from the historical and projection periods, and then the difference is applied as described above.
Since, by construction, the AdriaClim-WRF historical and projection simulations differ only for the used climate forcing conditions, we assume that the differences between the scenario and historical baseline are mainly due to the RCP8.5 forcing.
In this section, we discuss the results of this study. In the first part, the model’s performance in reproducing the temperature and precipitation fields over the historical period was assessed by comparing it with the ERA5-Land re-analysis. Then, in the second part, the CC atmospheric indicators are shown and discussed for each pilot area.
The AdriaClim-WRF model is evaluated against ERA5-Land, investigating T and PREC. In Figure 1, the 2-m daily mean temperature (TMEAN) and mean daily cumulated precipitation (PREC) averaged over the period 1992–2011 are shown for AdriaClim-WRF (Figures 2A,C) and ERA5-Land (Figures 2B,D). By visual inspection, the main temperature patterns and associated values are accurately reproduced by the models over the pilot areas: Both show minimum temperature below ~7°C over the Alpine regions of Friuli-Venezia Giulia and Veneto, which gradually increases moving toward the sea reaching values of approximately 14°C (Figures 2A,B). The temperature gradient from the Alps to the marine areas appears slightly stronger in AdriaClim-WRF than in ERA5-Land. Higher mean temperature values are found along the coasts in all the regions, while lower values characterize the Apennines and internal Croatian counties. The maximum TMEAN values are localized over the Puglia region, with local minimum patterns over the Gargano regions and internal areas in both datasets. As noted for the temperature field, precipitation looks consistent among the datasets with the distribution of patterns and values comparable to each other (Figures 2C,D). Stronger precipitations are related to more internal regions of the Croatian counties, over the Alps and Apennines, while minimum precipitations are associated with the Puglia region.
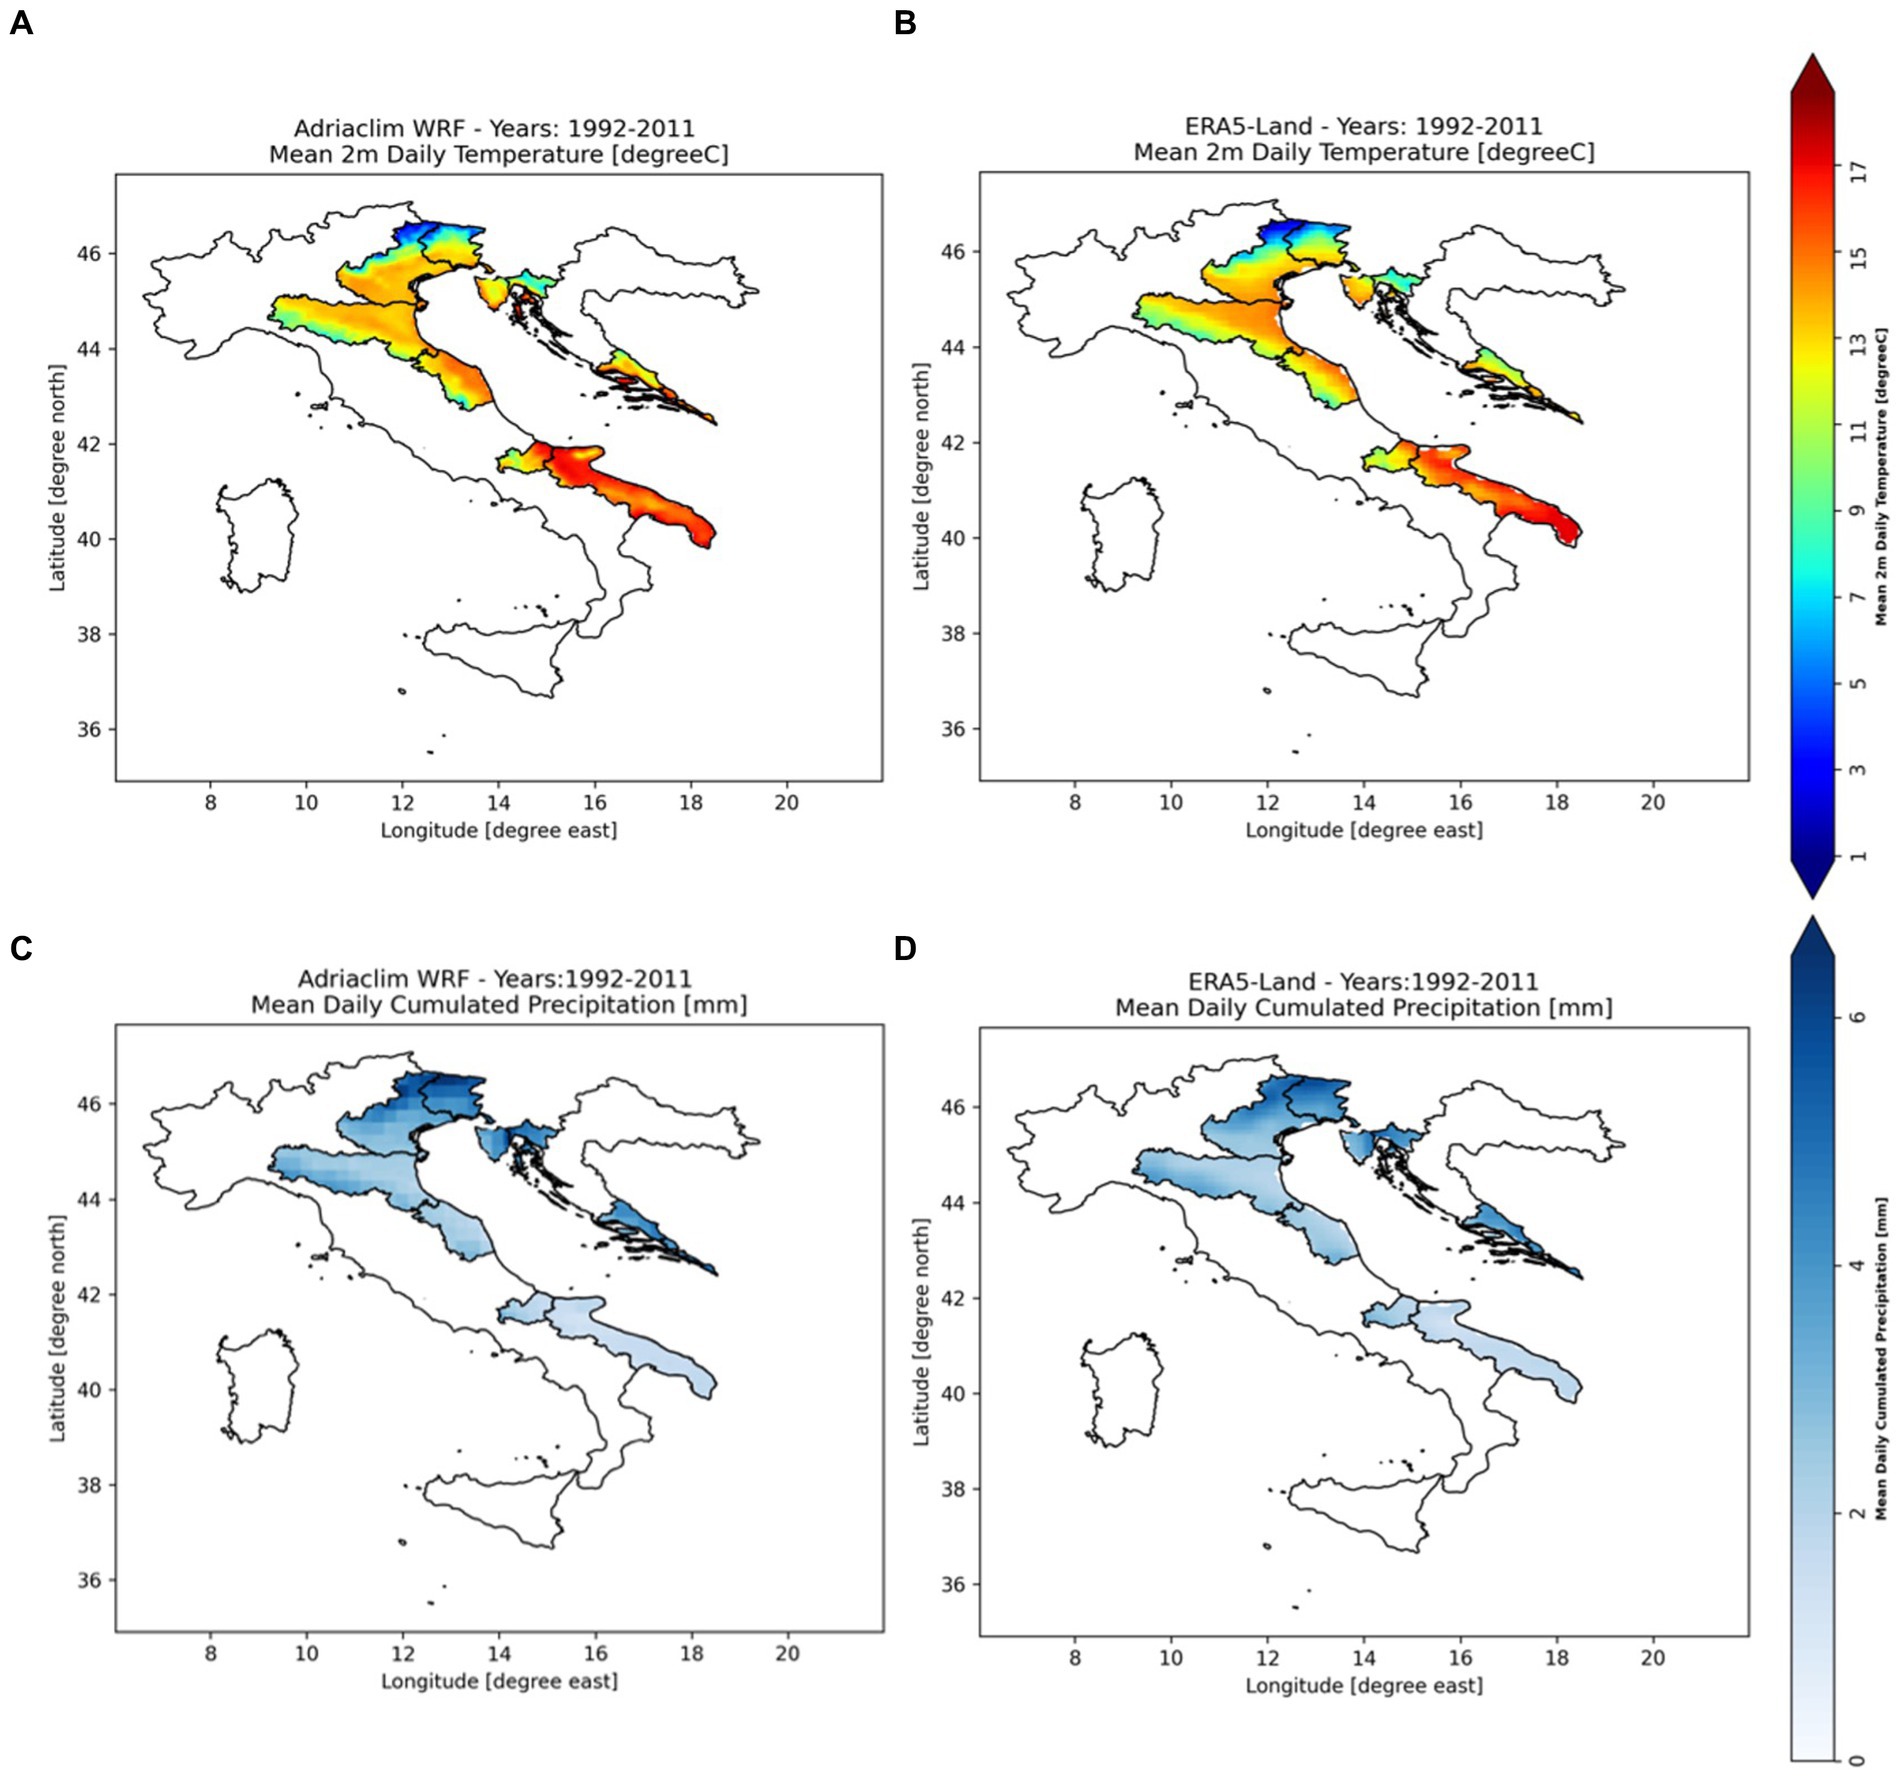
Figure 2. Averaged 2-m mean daily temperature over the historical baseline (1992–2011) in (A) AdriaClim-WRF and (B) ERA5-Land; averaged cumulative daily precipitation across the same period in (C) AdriaClim-WRF and (D) ERA5-Land.
A more quantitative assessment of the model performance for T and PREC can be provided by investigating their PDFs (Figure 3). In addition to the cumulated daily precipitation (Figure 3A) and mean daily temperature (Figure 3B), the maximum and minimum daily temperature are shown (TMAX, TMIN; Figures 3C,D, respectively).
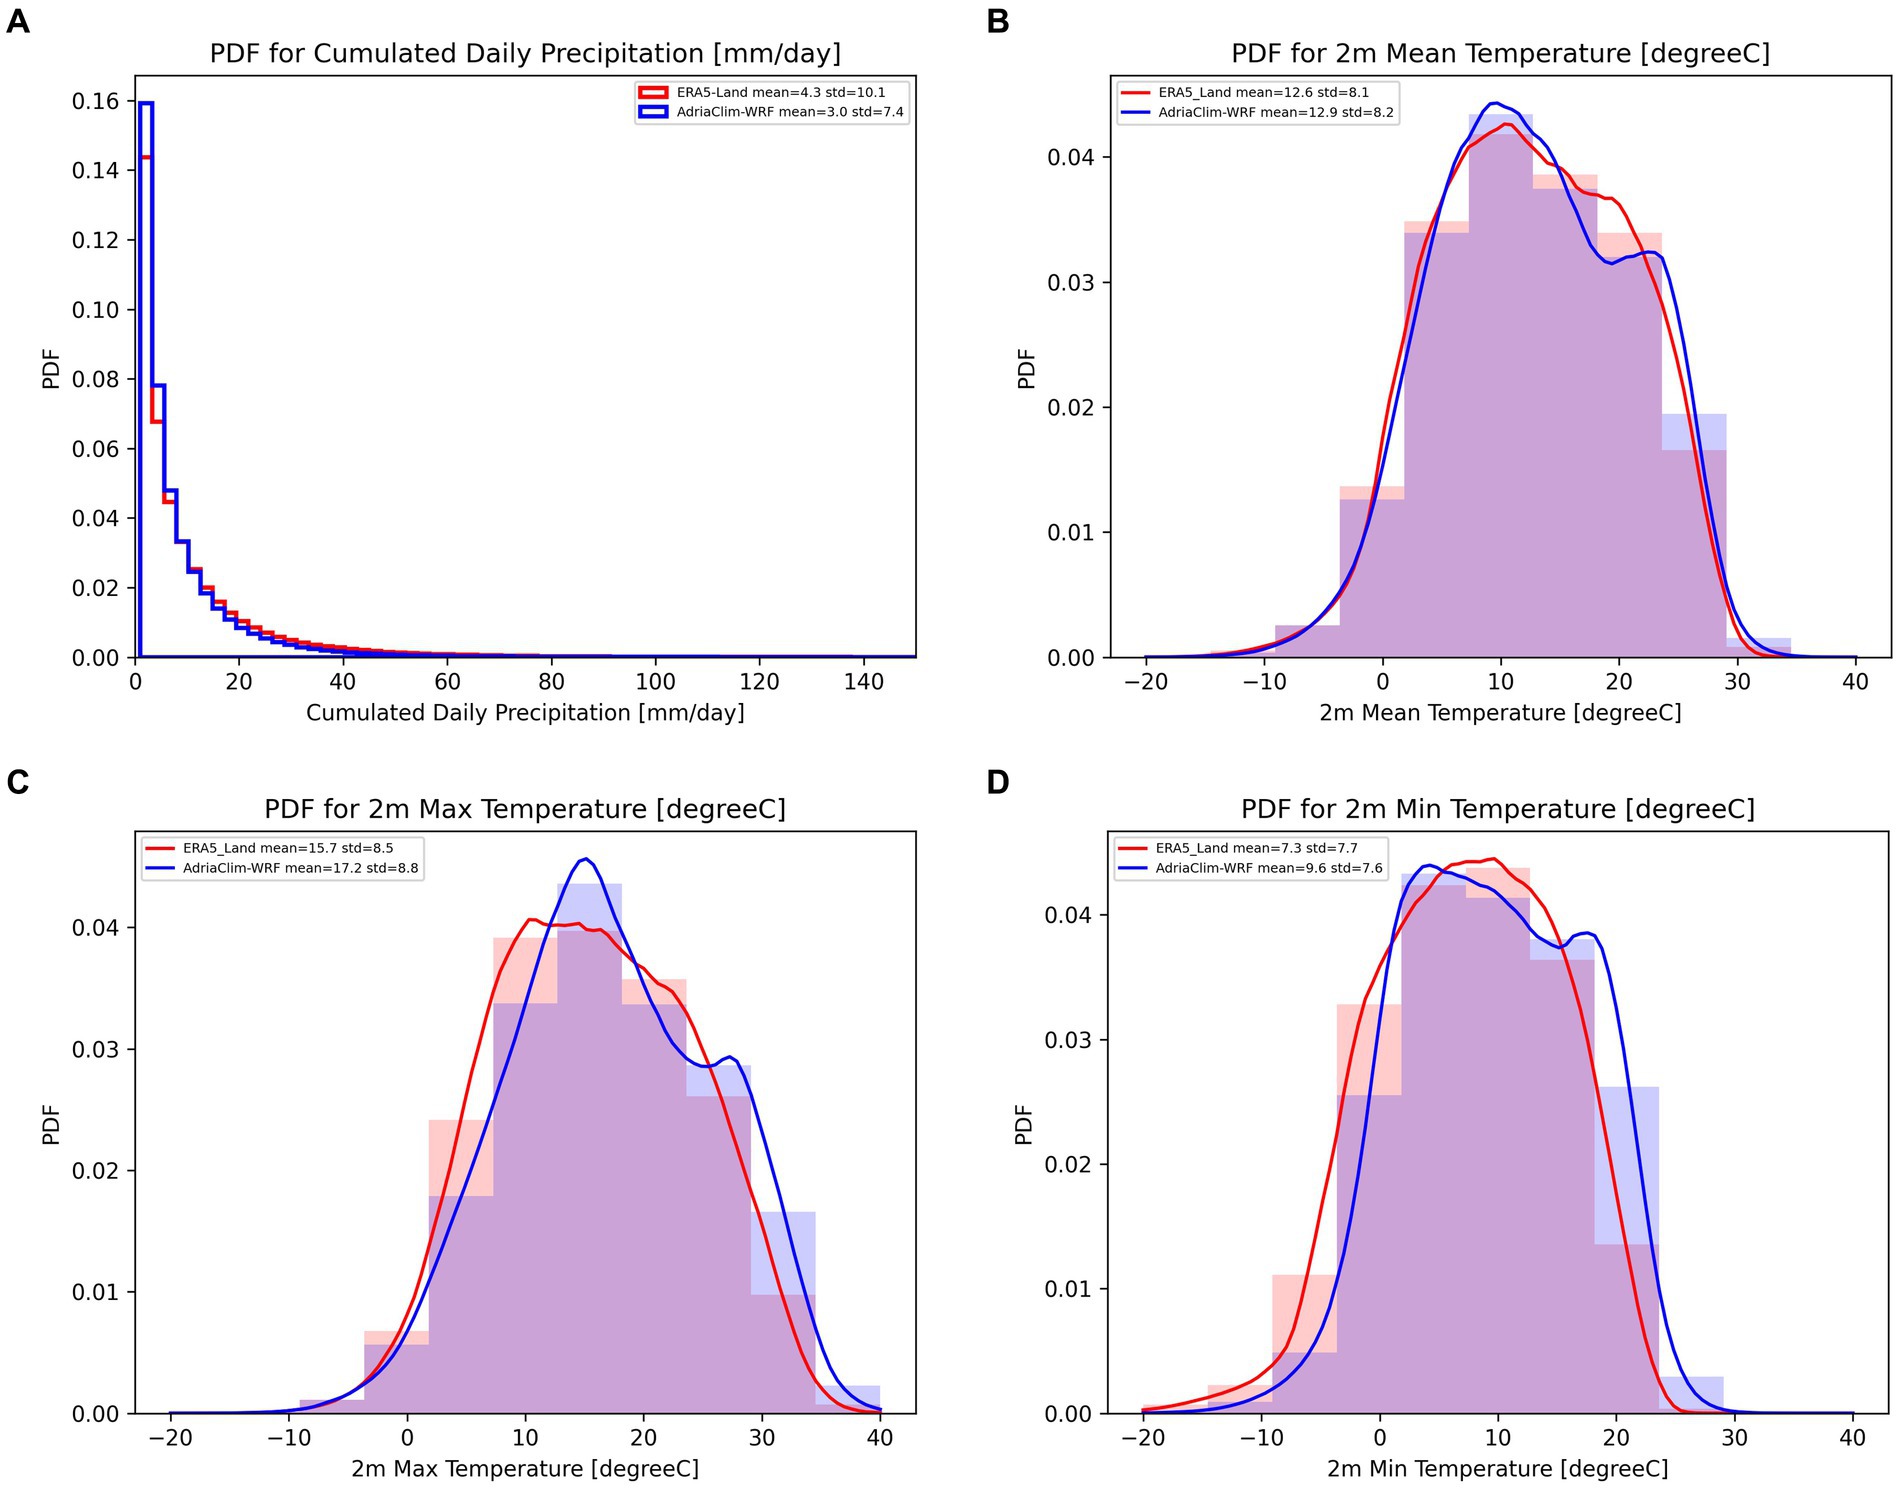
Figure 3. Probability density function (PDF) for the (A) cumulative daily precipitation, (B) 2-m mean daily temperature, (C) 2-m maximum daily temperature, and (D) 2-m min daily temperature for AdriaClim-WRF (in blue) and ERA5-Land (in red). For the precipitation fields, a histogram plot is used, while for the mean, minimum, and maximum temperatures, both histogram and interpolated curves are shown to better highlight the features of PDFs.
The normalized PREC PDFs (Figure 3A) highlight similarities and differences between the two datasets: Both share the same range of values, with similar skewness and kurtosis; nevertheless, AdriaClim-WRF compared to ERA5-Land underestimates the precipitation against ERA5-Land. In particular, it overestimates the number of events without precipitation and underestimates events between mm/day. This is better shown in the legend of Figure 2A, where the mean and stdev PREC values have been included. The AdriaClim-WRF model mean (3 mm/day) and stdev (7.4 mm/day) are lower than those found in ERA5-Land (4.3 mm/day, 10.1 mm/day, respectively). Figure 3B shows the PDFs for TMEAN in both the analyzed datasets. The curves accurately match each other, spanning over the same range of values ( °C), with similar mean and stdev values ( 8.2, °C in AdriaClim-WRF and ERA5-Land, respectively). Therefore, a slight shift toward higher temperature is found in the climate simulations, but it accurately represents the TMEAN mean state and variability of the re-analysis. The PDFs and related statistics (mean, stdev) for TMAX are shown in Figure 3C. Both the datasets cover the same range of values ( °C), but AdriaClim-WRF is slightly shifted toward higher temperatures, overestimating (compared to ERA5-Land) the events with temperatures higher than °C. Moreover, AdriaClim-WRF has a peak more pronounced approximately 15°C and a smaller number of events in the temperature ranges: and °C. The mean and stdev found for AdriaClim-WRF and ERA5-Land are 8.8 and 8.5°C, respectively. The similar stdev values highlight that even if AdriaClim-WRF slightly overestimates TMAX, it captures a variability comparable with the reference one. The last PDFs to be shown are those referred to as TMIN (Figure 3D). The two datasets share the range of values, capturing minimum temperatures spanning from ~ to ~ °C with the main mode centered at approximately °C in ERA5-Land and °C in AdriaClim-WRF. In the latter, a second less pronounced peak emerges at approximately °C. Nevertheless, the mean TMIN value is shifted toward higher temperatures with respect to the re-analysis (~9.6°C in AdriaClim-WRF and ~ 7.3°C in ERA5-Land). While in terms of stdev, they have similar values: 7.6 in AdriaClim-WRF against 7.7°C in ERA5-Land. Therefore, on the basis of the results shown in this paragraph, we can assess that good performance in simulating the temperature and precipitation mean fields and variability over the historical period characterizes AdriaClim-WRF with respect to the reference, and as a consequence, it can be used to investigate climate change indicators over the nine pilot areas.
The CC atmospheric indicators chosen for the nine pilot areas around the Adriatic Sea are based on the TMEAN, TMAX, TMIN, and PREC variables, whose performance has been assessed in the previous section. In this paragraph, we first investigate the difference among the mean state over the future and past climate for each of these variables at a daily frequency. Then, we describe the CC indicators yearly aggregated through a site-dependent investigation to emphasize which ones are more affected than others by the investigated climate hazards (temperature disease and hydrological instability) and therefore deserve more attention in defining and proposing new adaptation strategies.
Figure 4A shows the TMEAN difference map over the nine pilot areas (see Section 2). The temperature difference over the map is positive over the entire domain, with values spanning from 0 to 2.3°C. This indicates that the increase in the mean temperature over the domain of interest, driven by the RCP8.5 scenario conditions, is captured by AdriaClim-WRF. The highest values are reached in Northern Italy, with local maximum peaks over the Veneto and Friuli-Venezia Giulia regions (mean differences exceeding 1.7°C). As the latter, the TMEAN differences are also enhanced in the Emilia-Romagna region, where they exceed 1.5°C, reaching stronger values on the west side. Furthermore, the Croatian Counties, especially the northeastern Adriatic sector and the southernmost pilot area (Split-Dalmatia), have temperature peaks reaching temperatures approximately 1.5°C higher than the historical period. Lower positive differences characterize central Italy and the northern Puglia region. In the latter, the TMEAN differences exacerbate in the southernmost part, reaching temperatures even higher than 1.5°C.
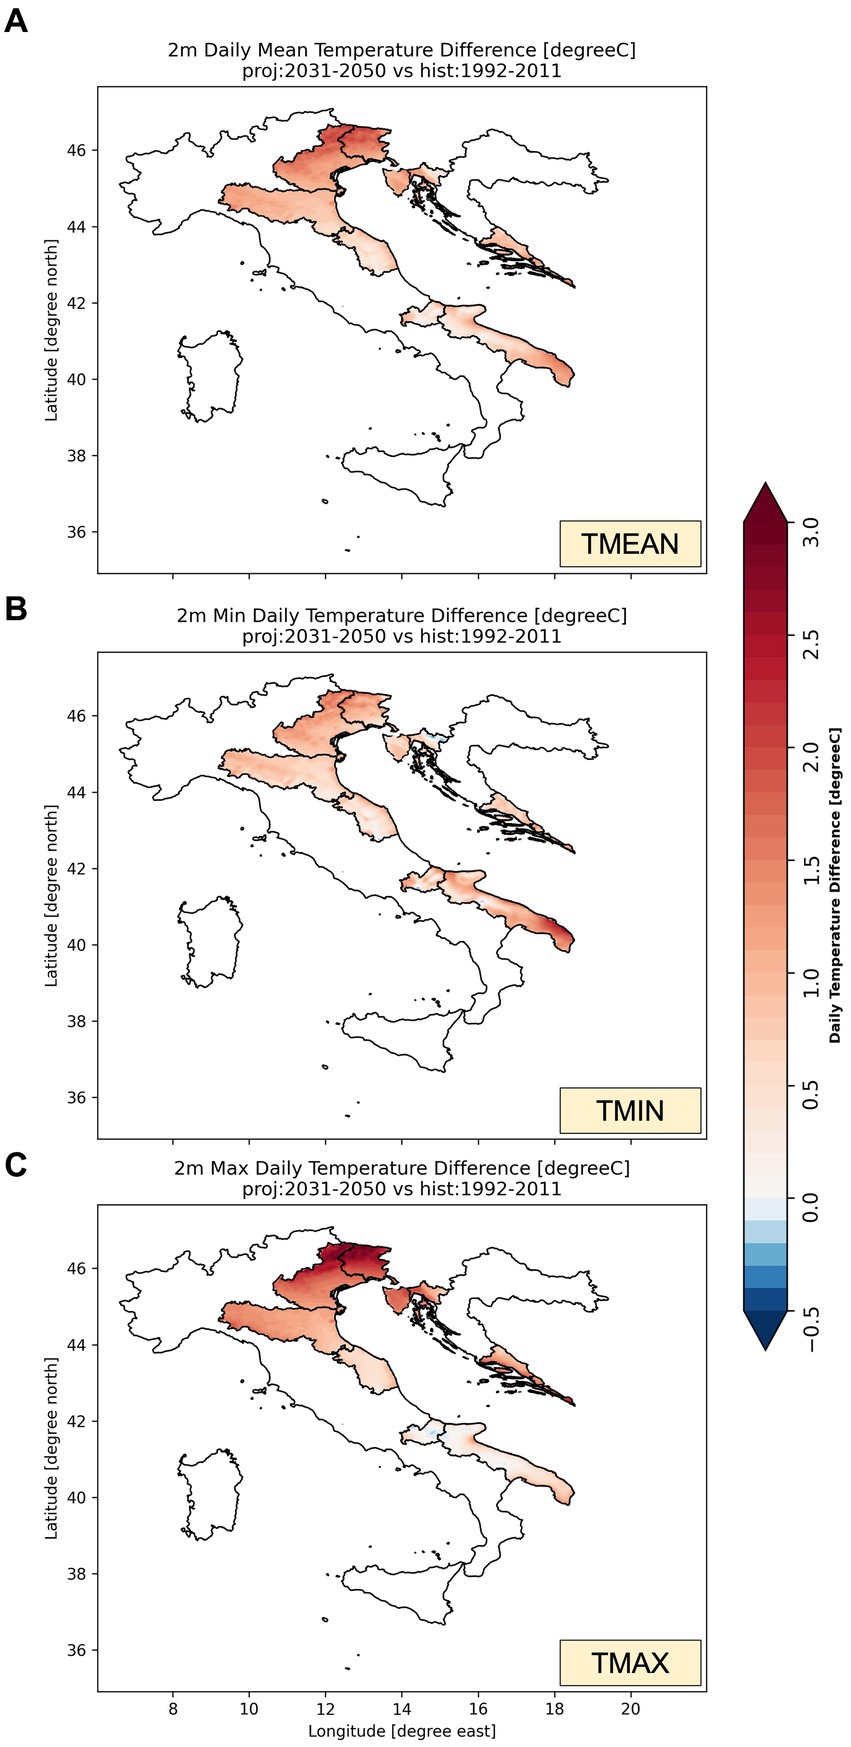
Figure 4. Difference between the mean states over the scenario (2031–2050) with respect to the mean state over the historical period (1992–2011) for the following variables: 2 m (A) mean, (B) minimum, and (C) maximum temperatures.
Investigating the TMIN difference map (Figure 4B), different patterns emerge. A general positive increase in the minimum daily temperature is captured by most of the areas. However, more localized negative values ( °C) appear on the North-Eastern Adriatic Sea, Marche, Molise, and north-central Puglia region. The higher minimum temperatures are localized over the Puglia region, with peaks centered on Otranto ( °C). However, for the remaining regions, the TMIN values oscillate between °C.
In Figure 4C, the TMAX difference map is shown. As discussed for the TMEAN, the regions more affected by the highest temperatures are those in Northern Italy. The highest TMAX peaks are localized over the Alps regions (Veneto and FVG; values up to 2.5°C), followed by the Northern Croatian regions (~1.5°C). In contrast, a decrease of TMAX ( °, C) compared to the past is found in the central and east-central sectors of the Molise region and in Puglia over the Gargano and Central sectors. Lower positive anomalies surround the negative differences with values of approximately 0.5°C.
On the basis of this visual investigation of mean, minimum, and maximum temperature difference between future and past climate, the stronger increase in temperature affects the northern regions of Italy in agreement with several studies (e.g., Appiotti et al., 2014; Bucchignani et al., 2016; Straffelini and Tarolli, 2023).
The impact of the RCP8.5 scenario with respect to the historical period on the precipitation patterns is presented in Figure 5, where the PREC difference is shown. By visual inspection, as highlighted in Figure 5, the Croatian-designed pilot areas are all affected by a decrease in cumulated daily precipitation, especially in the southern regions. In contrast, a non-homogeneous pattern of PREC differences over the Italian pilot areas is captured: in the northern sector (FVG, Veneto, and ER), a huge decrease in precipitation (negative differences) is observed (values spanning between mm/day), while the southernmost regions (Marche, Molise, and Puglia) are affected by a precipitation increase over most of the territory (positive PREC differences; values spanning between mm/day). The Marche region is characterized by lower/higher precipitation in the northern/southern sector. The maximum PREC difference reaches ~1 mm/day. In the Molise region, the precipitations over almost the entire territory increase ( mm/day), but still present negative patterns over the Apennines. The Puglia region, in central Italy, is characterized by a slight precipitation decrease in some areas (~ mm/day) and a precipitation increase in others (up to 1 mm/day).
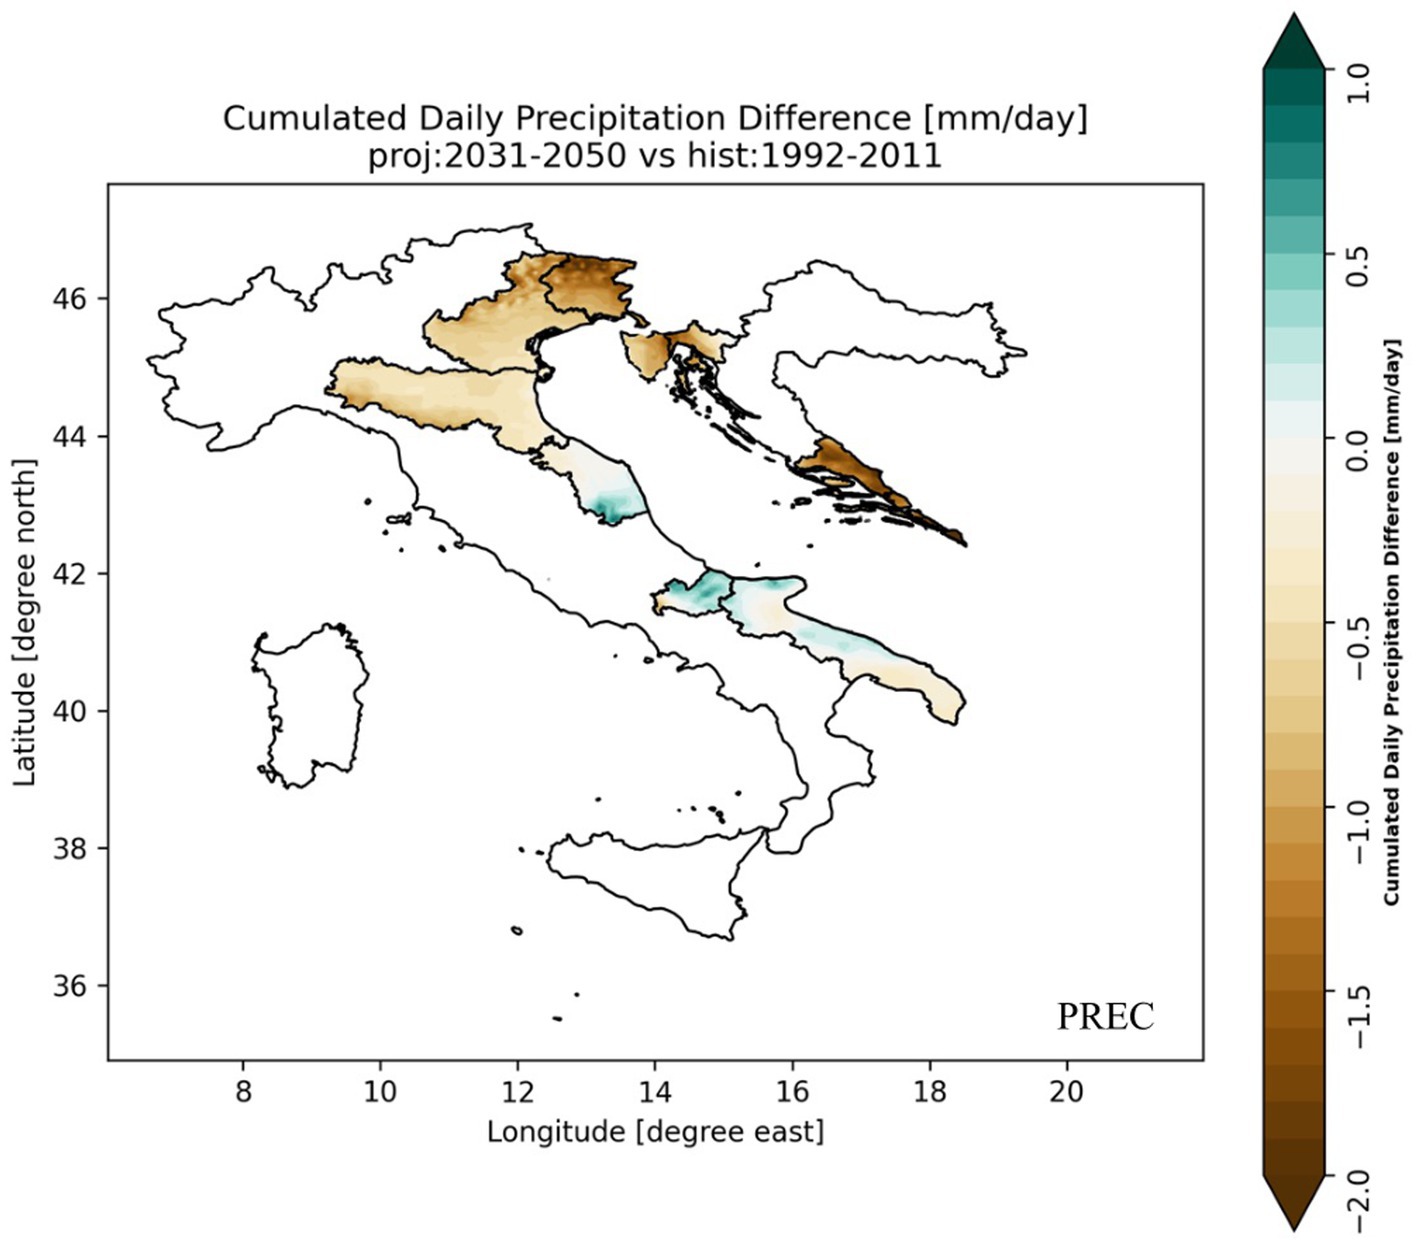
Figure 5. Difference between the mean states over the scenario (2031–2050) with respect to the mean state over the historical period (1992–2011) for the cumulative daily precipitation.
As a consequence, as an increase in the temperatures is expected, accompanied by a marked decrease in the precipitation over the Northern Italy and Croatia pilot areas, these regions may be highly impacted by droughts in the next decades.
An inspection on a seasonal basis of the TMEAN, TMIN, TMAX, and PREC differences between the future and past climate over the two periods considered is shown in Figures 6A–D, respectively.
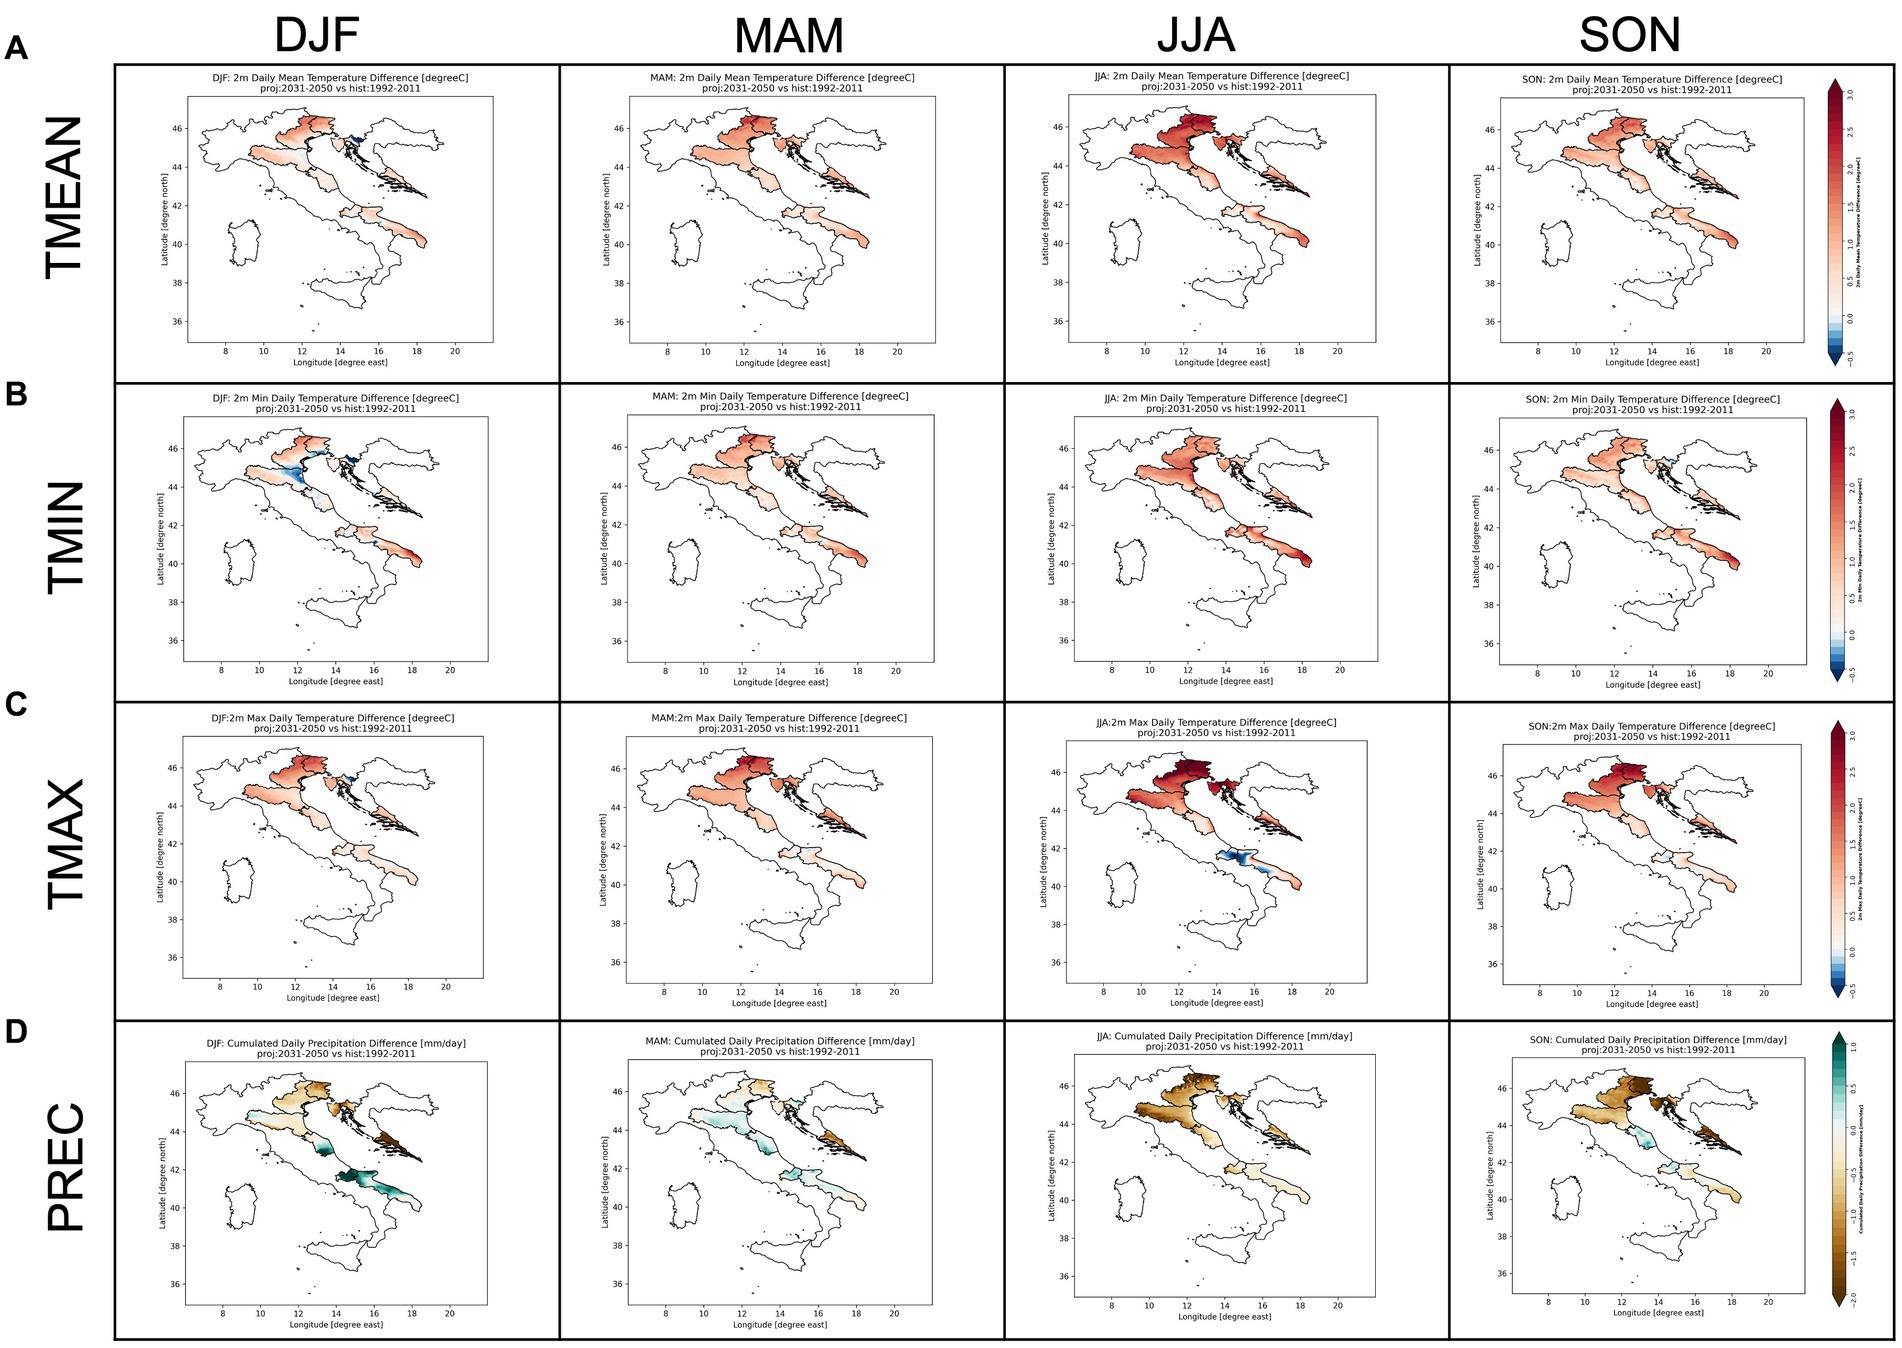
Figure 6. Seasonal difference (DJF, MAM, JJA, and SON) between the mean state over the scenario (2031–2050) with respect to the mean state over the historical period (1992–2011) for the (A) TMEAN, (B) TMIN, (C) TMAX, and (D) PREC.
During the winter season (from December to February—DJF), higher TMEAN values (Figure 6A) characterize most of the pilot areas, reaching values up to 2°C, with higher values over the Alps and southernmost Apulia region. High difference (~ +1.5°C) values are also found in the eastern side of the Emilia-Romagna region, inverting signs over the coasts, where weak negative values (−0.1°C) are found. In contrast with the general pattern found over these regions, negative differences (~ −0.5°C) characterize the northeastern Croatian territory. Weak negative peaks (~ −0.1°C) are also found in the Molise and Apulia regions in the more internal areas. During spring (from March to May—MAM), a quasi-homogeneous positive pattern of TMEAN differences (~ 1.4°C) is found over the pilot areas, with values exceeding 2°C in the Veneto and FVG regions. Those TMEAN differences are emphasized in the summer season (from June to August—JJA), exceeding +2.5°C in Veneto, FVG, and Northwestern Croatia. Moving toward lower latitudes, lower positive values are captured. Nevertheless, as seen for the northernmost territories, the Puglia region still reaches values up to +2°C in the southernmost area. A pattern similar to those found in summer is also captured in fall (from September to November—SON), with smoothed differences reaching up to +2°C. Analyzing the TMIN differences (Figure 6B) during winter the negative values found in the same period for the TMEAN are here exacerbated with negative peaks exceeding −0.5°C in Emilia-Romagna, Veneto, FVG, Croatia, and spotted peaks over Puglia and Molise. While TMIN differences higher than +2°C characterize the southern easternmost Puglia region. From spring to fall, positive TMIN differences are found over the pilot areas with higher values over Puglia, followed by Emilia-Romagna, Veneto, and FVG. Negative weak TMIN differences are captured only in narrow zones of Marche and Croatia in summer and fall, respectively. By investigating TMAX differences (Figure 6C) over the pilot areas, the Northeastern regions still present strong peaks in all the seasons, exceeding +3°C during summer. Negative values are instead captured in the internal northern Croatian areas during winter (> −0.5°C) and in Molise and Puglia from March to November with peaks exceeding −0.5°C during summer in the more internal regions. The analysis of the PREC differences (Figure 6D) over the same periods analyzed above highlights the seasonal change in precipitation in the future compared to the past. Differences span between high absolute negative (up to −2 mm/day) and positive values (~1 mm/day) over the pilot areas, showing a decrease in the precipitation amount especially in North Italy and Croatia. The latter would be affected by low values, especially during winter, summer, and fall. Moreover, an increase in precipitation may affect the Marche, Molise, and Puglia regions, with differences emphasized in winter. In spring, a slight PREC increase may interest most of the regions (highest values in Central Italy), while in summer a decrease in precipitation is expected in each pilot area. The northern regions (especially FVG and Veneto) are therefore expected to be affected by more temperature extremes and dry conditions, while the southern regions would be less warm than the northernmost but may be affected by more extreme precipitation.
In order to better evaluate the hydrological instability and thermal discomfort hazards over the nine pilot areas, 11 indicators at annual aggregation have been computed in each pilot in both the historical and projection periods. In Table 1, the CC atmospheric indicators are presented.
In this paragraph, we first describe the indicators depending on TMEAN, TMAX, and TMIN (Figure 7) and then discuss those depending on PREC (Figure 8).
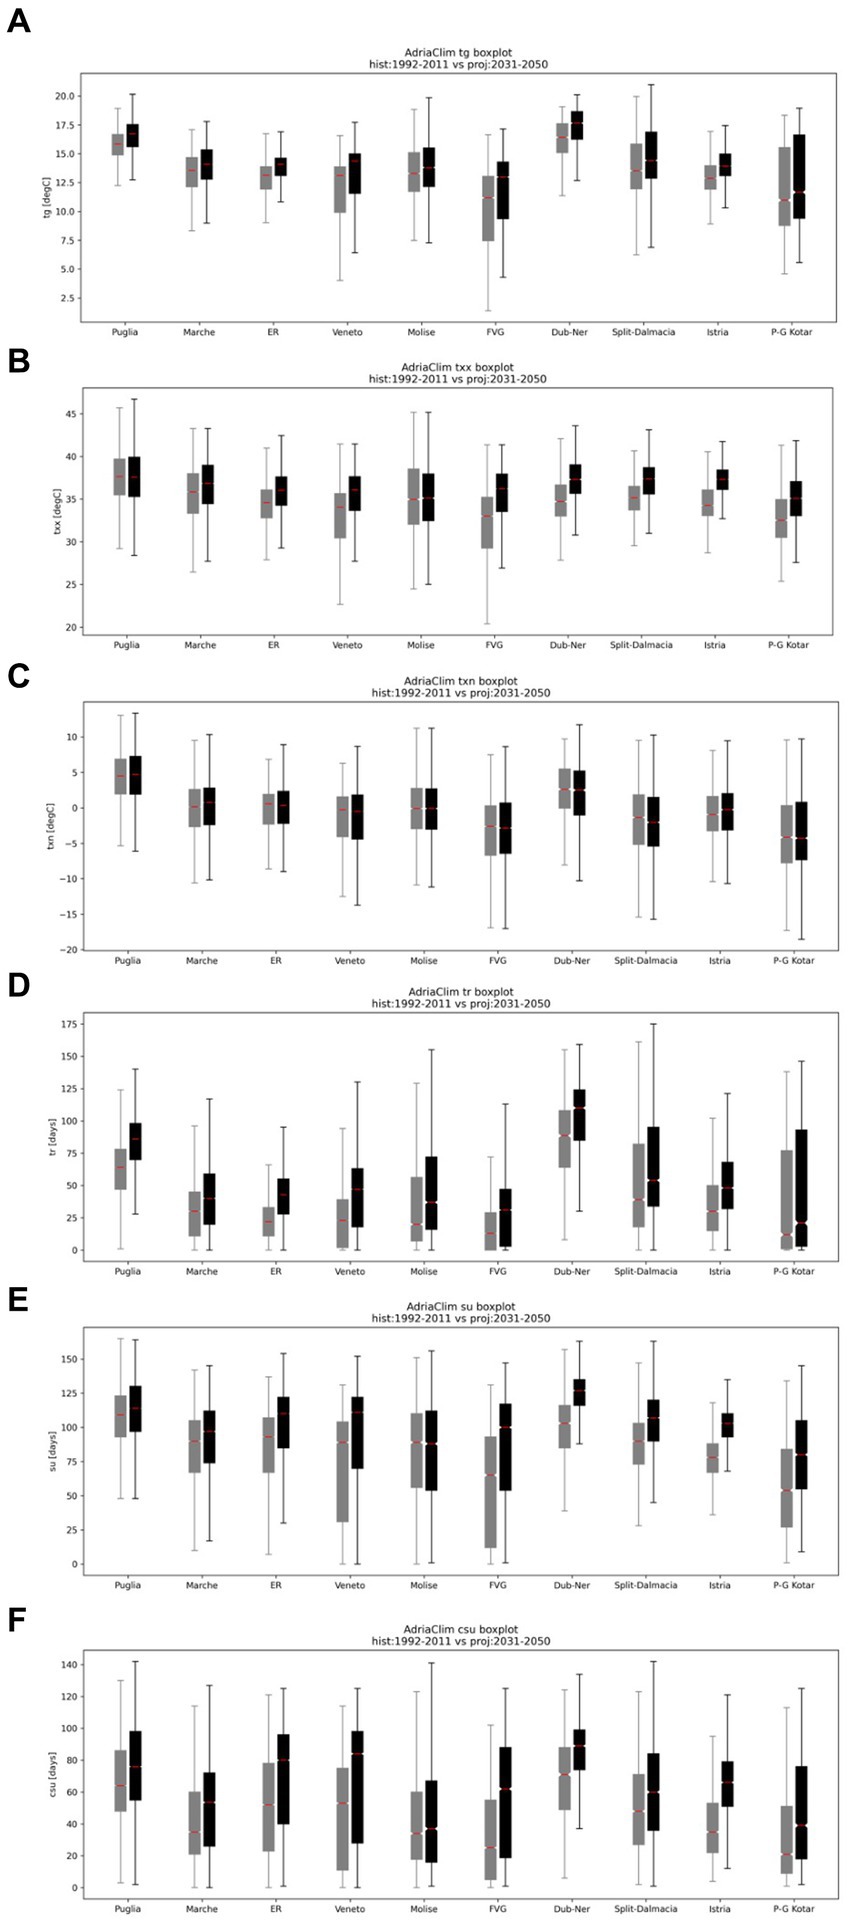
Figure 7. Boxplots for (A) tg, (B) txx, (C) txn, (D) tr, (E) su, and (F) csu for each pilot area (Figure 1) over the historical (1992–2011; in gray) and projection (2031–2050; in black) period. The whiskers include the minimum and maximum significant values with a value of p of 0.05. In red, the median is shown.
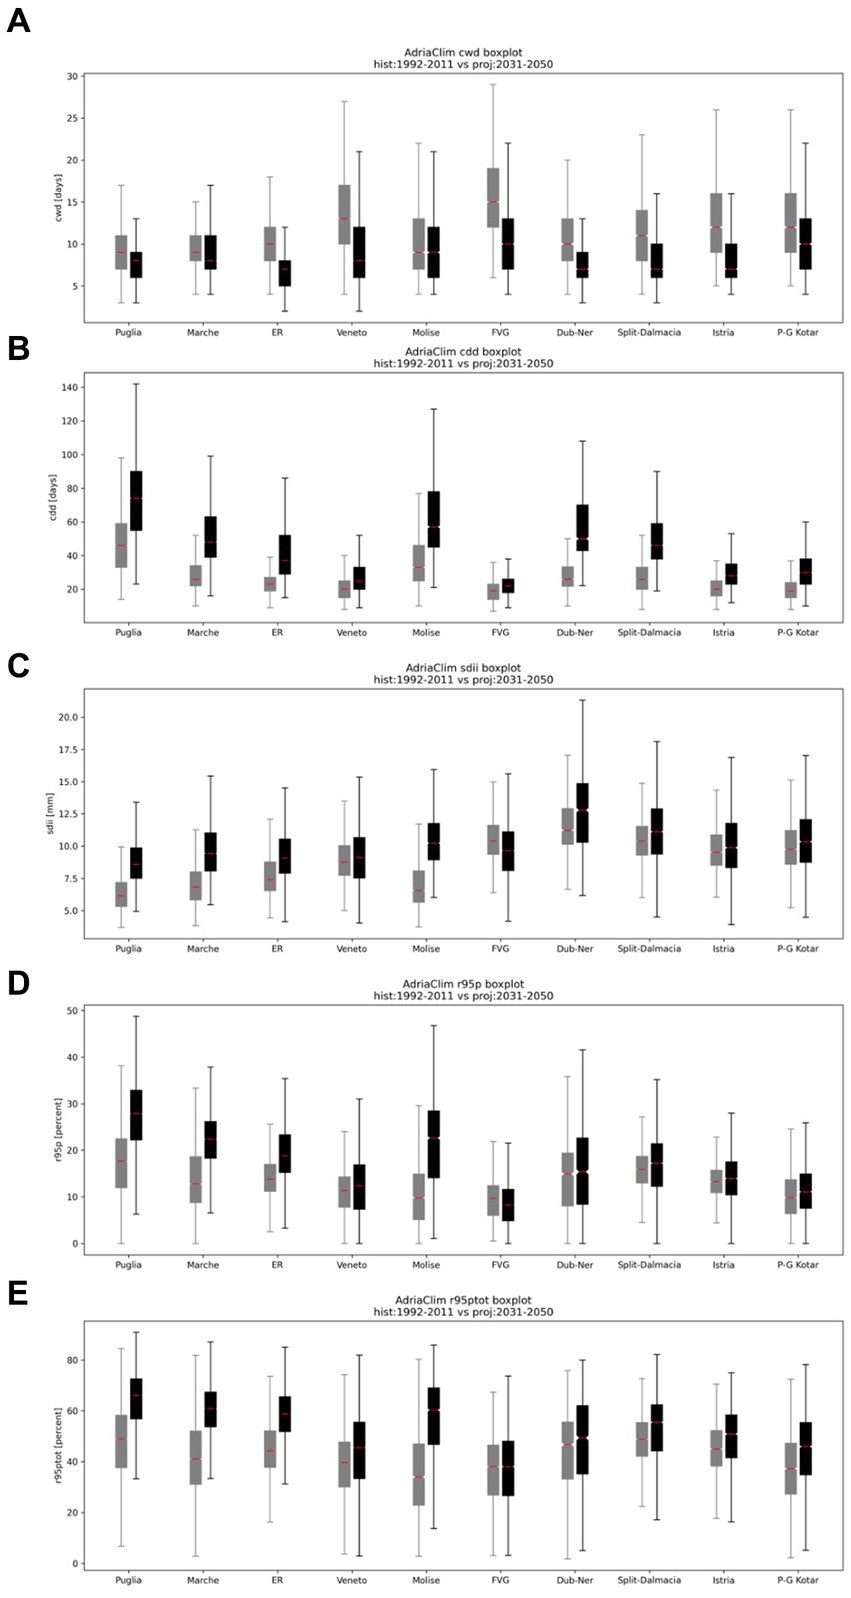
Figure 8. Boxplots for (A) cwd, (B) cdd, (C) sdii, (D) r95p, and (E) r95ptot for each pilot area (Figure 1) over the historical (1992–2011; in gray) and projection (2031–2050; in black) period. The whiskers include the minimum and maximum significant values with a value of p of 0.05. In red, the median is shown.
The first presented indicator is tg (Figure 7A), which is the mean of daily temperature over the period (based on annual aggregation). Here, tg (as the other indicators defined in Table 1) is computed for each year of the historical and projection time series. For each pilot area, the boxplots show a clear increase of tg in the future with respect to the past according to the RCP8.5 scenario forcing. For most of the pilot areas, there is a clear shift in the future toward higher values, both for the mean, minimum, and maximum tg values at a 95% level of significance. However, in the Molise Region, tg reaches higher mean and maximum values in the future, while the minimum temperature slightly decreases. The distributions in the Puglia, ER, Veneto, FVG, and Dubrovnik-Neretva are more skewed toward the higher values in the projection, suggesting that more extreme events are expected. In Table 2, the mean difference for each indicator over the pilot areas is presented. In particular, it is shown that tg has lower values over Central Italy (Molise and Marche regions: 0.5–0.6°C, respectively), which increase up to 1.2°C in Puglia, Primorje-Gorski Kotar, Emilia-Romagna, Split-Dalmatia, Istria, and Dubrovnik-Neretva (sorted by increasing value), up to exceeding 1.5°C in Veneto and FVG.
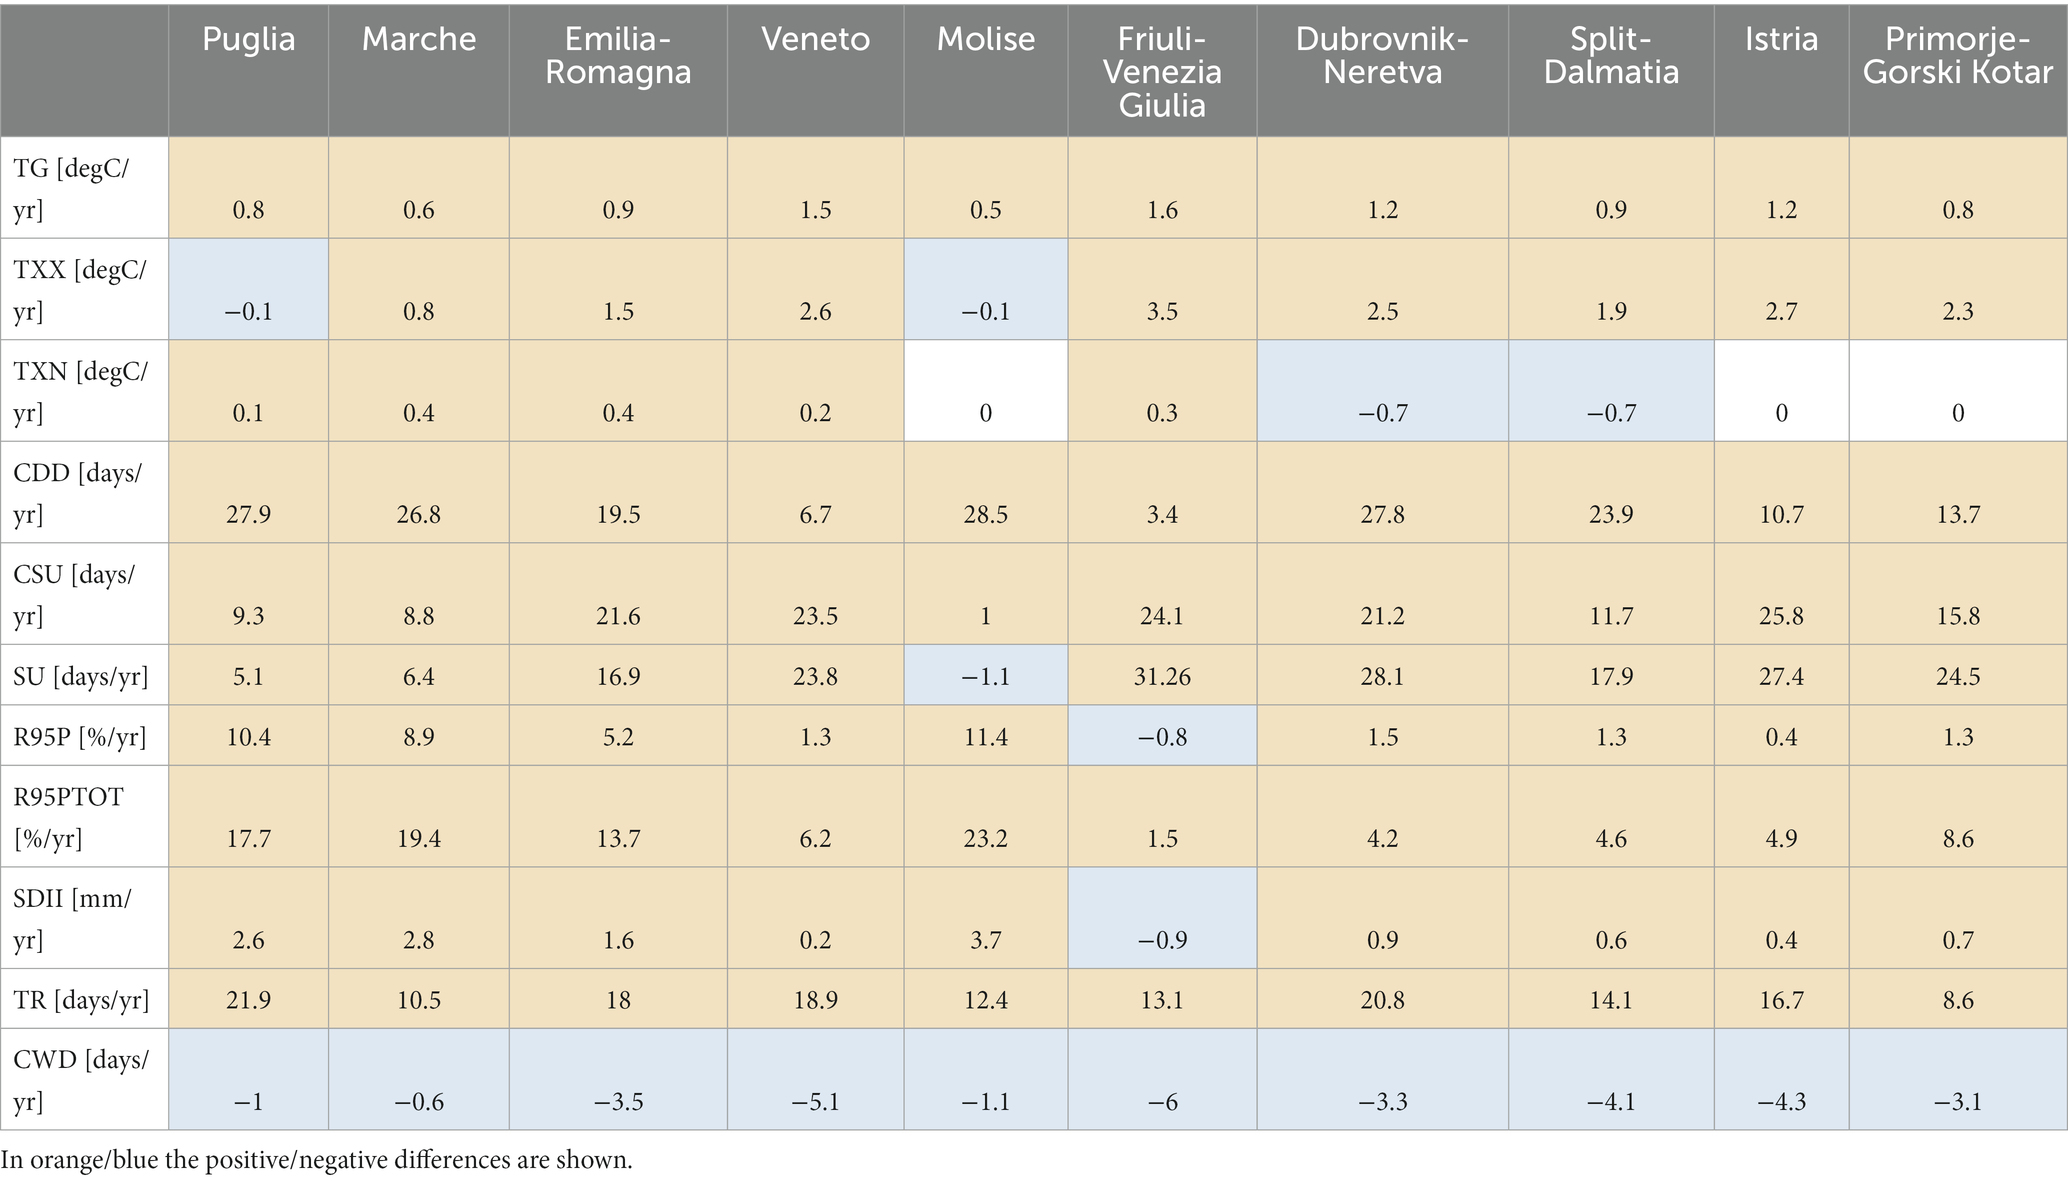
Table 2. AdriaClim-WRF differences between the projection (2031–2050) and historical (1992–2011) periods.
The second indicator to be presented is txx (Figure 7B), which is the maximum value of daily maximum temperature. In the projection period, the maximum txx significant ( ) value increases in most of the pilot areas, except for Marche, Veneto, Molise, and FVG where similar values with respect to the past are found. The range of txx within the future period is shifted toward higher temperatures in most of the regions. Both minimum and maximum txx reach higher values in the future in each pilot area, except Molise and Puglia. In the former, the distribution in the projection period is similar to that found in the past, in terms of both range and mean value. The only feature that looks more affected by the RCP8.5 scenario forcing is the variability, which may decrease (lower stdev found). In contrast, in the Puglia region, txx is predicted to span over a wider range of values and stdev, to reach more extreme minimum and maximum values. Significant positive differences from 0.8 to 3.5°C are found in the pilot areas, except for Puglia and Molise where it is slightly negative ( °C). The stronger differences, exceeding 2°C, are related to FVG, Istria, Veneto, and Dubrovnik-Neretva (3.5, 2.7, 2.6, and 2.5°C).
The third indicator to be analyzed is txn. By definition, it is obtained by taking the minimum value of the daily maximum temperature for each year. By inspecting Figure 7C, the range between the minimum and maximum significant txn values is wider in the projection period in most of the regions. In fact, the maximum txn shifts toward higher values in many pilot areas: Puglia, Marche, ER, Veneto, FVG, Dubrovnik-Neretva, Split-Dalmatia, and Istria. Moreover, lower values also characterize a few pilot areas in the projection period: Puglia, ER, Veneto, Molise, Dubrovnik-Neretva, and Primorje-Gorski Kotar. Positive txn differences (spanning between °C) are quantified in Table 2 in most of the regions. Only in Dubrovnik-Neretva and Split-Dalmatia negative differences are found (~ °C), while in Molise, Istria, and Primorje-Gorski Kotar, there are not relevant changes (as also shown by Figure 7).
The fourth indicator shown in Figure 7D is tr, which is the number of tropical nights per year. It consists of the number of days during which the minimum temperature is above 20°C (Table 1). It is highlighted in Figure 7D that the number of tropical nights will increase in the future. Some pilot areas are more sensitive than others, in fact, the average increase over the pilot areas spans between ~ and 22 (Table 2). The maximum differences are found in the Puglia region with 21.9 days more than in the past, while lower differences are found in the Primorje-Gorski Kotar County, where approximately more than in the past is found. High differences also impact the Dubrovnik-Neretva, Veneto, and ER regions ( ). Moreover, the median of the distribution over each pilot area (Figure 7D) is shifted toward higher values, indicating that the frequency of occurrence of tropical nights will increase. Therefore, years from 2031 to 2050 will be characterized by more extreme temperatures nights with respect to the period: 1992–2011.
The fifth indicator presented in Figure 7E is su, which represents the number of days where the maximum temperature is above 25°C. It is also known as the summer day index (Table 1). Positive differences over most of the pilot areas are captured in Figure 7E and quantified in Table 2. Only the Molise region in contrast with the others presents a low negative difference ( ), while positive values can reach up to in FVG. The negative difference found in Molise may be explained by the shift of the su 5th percentile value above a lower number of days. Nevertheless, the number of maximum su and its 95th percentile value is higher in the future with respect to the past. The increasing number of days associated with temperatures higher than the threshold (25°C) is consistent with results related to tg. Moreover, the minimum number of su increases toward higher values in Marche, ER, Dubrovnik-Neretva, Split-Dalmatia, and Istria. According to the minimum and maximum general increase of su in the future decades, also the median of the distributions is shifted toward higher values, suggesting that in the next decades, more years will be characterized by more extreme su, and the probability of occurrence of summer days in the next years will increase.
The sixth indicator to be analyzed is csu, which by construction depends on the previous one. In fact, it is the consecutive summer days index per time period. It is computed by taking the greatest number of consecutive summer days for each year (Table 1). As observed for su, also csu reaches a number of days higher in the future period for each pilot area. Moreover, both the 5th, 50th, and 95th percentile values are shifted toward higher values in most of the regions, indicating that the probability of having consecutive days with a maximum temperature exceeding 25°C is much higher in the future. The differences are quantified in Table 2. Positive differences are found in each pilot area, with minimum values in the Molise region ( ), which increase up to ~ in Istria. High differences also characterize Northern Italy with and in FVG, Veneto, and ER. However, in central and southern Italy, the differences are much lower, reaching values up to and in Puglia, Marche, and Molise, respectively. These results suggest that heat wave events may impact Northern Italy more than the southernmost pilot areas.
Additional indicators, based on the precipitation variable simulated by AdriaClim-WRF, are provided in Figure 8. These indicators have been computed starting from the daily cumulated precipitation aggregated on a yearly basis.
The first of these indicators is the cwd (Table 1), which is the number of consecutive wet days index per year, which consists of the greatest number of consecutive days per year with daily precipitation above 1 mm. In Figure 7A, a consistent decrease of cwd in the future period with respect to the past emerges in all the pilot study areas. The differences are quantified in Table 2. They span from in FVG, up to in the Marche region. The distributions are all shifted toward lower values with differences among the two periods emphasized in FVG and Veneto ( ). However, the regions less affected by changes in the cwd between the historical and projection periods are Marche, Molise, and Puglia regions with differences between (Table 2). Both the maximum and minimum number of cwd per year will decrease in the future. Moreover, the main mode shifts toward lower values, indicating that not only the cwd extremes are affected. The general decrease in consecutive wet days emphasizes the increasing emergency of drought conditions over the pilot areas.
The second indicator shown in Figure 8B is cdd, which indicates the greatest number of consecutive days per year with daily precipitation amount below 1 mm. If from one side the cwd is expected to decrease in the projection, cdd is expected to increase in all the pilot areas (Figure 8B; Table 2). The distributions are all shifted toward higher values. The differences are quantified and shown in Table 2. The highest number of cdd is reached in Molise, followed by Puglia, Dubrovnik-Neretva, Marche, and Split-Dalmatia. The remaining pilot areas still have positive differences but are less pronounced ( 14 ). Both the extremes (maximum and minimum significant cdd values per year) and median are shifted toward higher values. In the Dubrovnik-Neretva region, the cdd maximum is characterized by ~60 days/year more than the historical period, followed by Molise with ~50 days/year and Puglia with ~40 days/year. Huge differences in the maximum significant cdd values per year also emerge in Marche, ER, and Split-Dalmatia, while in the remaining areas, they are much less pronounced.
The third indicator to be investigated in Figure 8C is sdii, which is defined in Table 1 as the simple daily intensity index per year, which is the precipitation amount on wet days. The boxplots in Figure 8C highlight the increase of sdii in the future period with respect to the past in all the regions, except FVG (shown also in Table 2). Stronger differences between future and past periods are found in central and southern Italy with maxima in the Molise region, which has been classified as second for the increase of cdd among the nine pilot areas. Therefore, if the soil becomes drier due to the increased/decreased cdd/cwd, and increased temperatures in the nine pilot areas, we speculate that the rising of the precipitation daily amount may lead to severe flood conditions. Then, analyzing indicators related to precipitation extremes, such as r95p and r95ptot, is relevant in this study (Figures 8C,D).
In this respect, the fourth indicator to be investigated in Figure 8D is r95p. It consists of the percent of time per year of wet days (daily sum at least 1 mm/day) where the daily precipitation amount of a wet day is above a reference value (Table 1). The reference value is calculated as the 95th percentile of all wet days of a given baseline period (years: 1992–2011). As shown by the boxplots, in every region the differences are positive and may exceed up to 11.4% per year, except FVG where a low decrease in % per year is found (−0.8% yr.−1). These values therefore suggest a mean increase in extreme precipitation events over the Adriatic regions here considered.
Finally, the last indicator to be investigated is r95ptot (Figure 8E), which is the percentage of total precipitation amount per year due to r95p. As shown in Figure 8E and measured in Table 2, the differences in r95ptot between the projection and historical period are always positive. These differences are maximized in the Molise region, where higher r95p are captured (23.2% yr.−1), followed by Puglia, Marche, and Emilia-Romagna (17.7, 19.4, 13.7% yr.−1). The high percentages found indicate that not only the extreme event occurrence (r95p) will increase but also their intensity.
The availability of accurate information on the evolution of the climate in the next decades at the local level is fundamental to assessing the expected climate conditions, supporting adaptation strategies, and promoting local climate resilience actions. The AdriaClim Project goal is in line with this purpose, focusing on the Adriatic coastal areas, which are highly sensitive to global warming (e.g., Appiotti et al., 2014; Bucchignani et al., 2016; Straffelini and Tarolli, 2023). In this respect, the AdriaClim integrated regional model provides a unique framework to investigate the future climate in the Adriatic region. In fact, it is the first attempt to provide nested climate simulation over the Adriatic Sea at a resolution of a few kilometers, with all Earth system components interacting with each other (Verri et al., 2023, under revision).
The climate indicators provided within the project span from the atmospheric to the sea state, to the hydrological, up to the biogeochemical ones. Due to the huge amount of data produced, this study focuses only on the atmospheric indicators. However, Santos da Costa et al. (2023, under revision) and Mentaschi et al. (2024, under revision) investigated the marine and biogeochemical ones, respectively.
The atmospheric model component (AdriaClim-WRF) outputs were analyzed, inspecting the performance of AdriaClim-WRF against ERA5-Land over the historical baseline. Both the mean state and the variability over the past climate are investigated. Results from Figure 2 show good model skills in reproducing the mean patterns over the nine designed pilot areas, both for the 2-m mean daily temperature and mean daily cumulated precipitation. Moreover, by inspecting the mean state and variability over the historical period (Figure 3), we can conclude that the model accurately represents observations with some limitations: (i) It slightly underestimates the precipitation mean value and standard deviation; (ii) it accurately captures the mean state and standard deviation of the 2-m mean temperature; (iii) it tends to overestimate the temperature mean state and standard deviation of the 2-m max temperature; and (iv) it tends to overestimate the temperature mean state of the 2-m min temperature, while accurately capturing the standard deviation. Those differences are acceptable for climate model studies, and then, CC atmospheric indicators have been computed to assess the role of the main climate atmospheric hazards taking place. In particular, the hydrological instability and thermal discomfort are considered.
In the climate community, in order to estimate how the future climate will change with respect to the historical baseline, a common approach aims at analyzing the differences between the future and the past climate. Accordingly, we applied this methodology within this study, computing the differences for the precipitation and temperature variables (Figures 4, 5) between the future (2031–2050) and past (1992–2011) climate. Positive differences characterize most of the investigated domains, in both terms of TMIN, TMEAN, and TMAX. Temperature differences are maximized in North Adriatic, reaching maximum values up to ~3°C/day. Peaks in the mean and minimum daily temperature difference are also localized in Puglia, near the Otranto Gulf. In contrast, the precipitation difference is characterized by more locally dependent patterns over the Italian Peninsula, with a strong precipitation decrease in the North of Italy (down to ~ −2 mm/day) and an increase over the Marche, Molise, and Northern Puglia regions. However, over the Croatian counties considered in this study, a negative precipitation difference pattern is found. Stronger values may interest the southernmost regions (Split-Dalmatia and Dubrovnik-Neretva; Figure 5). By investigating the differences for each season other features emerge, the northern regions in each season (especially FVG and Veneto) are expected to be much warmer than the past in terms of TMEAN, TMIN, and TMAX (Figure 6) and drier, reaching the highest differences during summer. In contrast, the southernmost regions would be less affected by temperature increases but may be hit by more extreme precipitation, especially during winter (DJF).
A more detailed discussion is then conducted using the boxplot diagrams (Figures 7, 8) of the 11 CC atmospheric indicators computed over the nine pilot areas (Table 1), based on temperature and precipitation. Supported by quantified values of the differences over the historical and projection period (Table 2), they highlight the increase in temperatures over most of the region, coupled with a decrease in precipitation, leading to drought and flooding conditions in most of the regions. The results show that the northernmost regions (North Italy and Croatia pilot areas) are more sensitive to thermal discomfort. Moreover, the strong temperature combined with the huge decrease in the mean precipitation found over the projection period, favor severe drought conditions. In addition, even if the precipitation over the future decades tends to decrease (cwd/cdd decrease/increase), the amount of precipitation associated with the wet days increases (sdii), leading to more frequent and stronger extreme events (r95p, r95ptot). These conditions may lead to severe floods, with a strong impact on agriculture and food production (Straffelini and Tarolli, 2023).
As found for the northernmost regions, the Central and Southern Italian pilot areas are also characterized by the temperature increase, reaching higher peaks in the southernmost Puglia region. Nevertheless, even if the cwd/cdd decreases/increases as found over North Italy and Croatia, the amount of precipitation related to wet days strongly increases (sdii). Moreover, the extreme precipitation events occurrence and intensity (r95p, r95ptot) increase over these pilot areas in the next decades, leading to severe hydrological instability. This may explain why, even if fewer precipitation events occur over these areas, the mean precipitation difference is positive over most of the Marche, Molise, and Puglia regions (Figure 5), reaching values up to ~1 mm/day.
It is worth mentioning that these analyses should be carefully considered when supporting adaptation strategies due to the lack of uncertainty estimates. Future studies should consider a wider set of atmospheric simulations at high resolution available over Italy, such as Raffa et al. (2023), in order to estimate the model uncertainty.
The datasets presented in this study can be found in online repositories. The names of the repository/repositories and accession number(s) can be found at: https://erddap-adriaclim.cmcc-opa.eu/erddap/index.html.
GF: Conceptualization, Data curation, Formal analysis, Investigation, Methodology, Software, Validation, Visualization, Writing – original draft, Writing – review & editing. IM: Data curation, Software, Writing – review & editing. GB: Supervision, Writing – review & editing, Visualization. GV: Data curation, Software, Writing – review & editing. PM: Supervision, Visualization, Writing – review & editing.
The author(s) declare financial support was received for the research, authorship, and/or publication of this article. The research activity has received from the AdriaClim project, Italy (Climate change information, monitoring and management tools for adaptation strategies in Adriatic coastal areas; project ID 10252001).
The authors acknowledge the AdriaClim Italia-Croatia Interreg Project (https://www.italy-croatia.eu/web/adriaclim) for providing funds that supported this research study.
The authors declare that the research was conducted in the absence of any commercial or financial relationships that could be construed as a potential conflict of interest.
All claims expressed in this article are solely those of the authors and do not necessarily represent those of their affiliated organizations, or those of the publisher, the editors and the reviewers. Any product that may be evaluated in this article, or claim that may be made by its manufacturer, is not guaranteed or endorsed by the publisher.
1. ^https://polaris.irpi.cnr.it/report/last-report/; accessed September 19, 2023.
2. ^https://www.italy-croatia.eu/web/adriaclim
3. ^https://erddap-adriaclim.cmcc-opa.eu/erddap/
4. ^https://geoportale-adriaclim.datamb.it/
5. ^https://programming14-20.italy-croatia.eu/web/adriaclim/docs-and-tools
6. ^https://code.mpimet.mpg.de/projects/cdo/embedded/cdo_eca.pdf
Ahmed, Z., Ahmad, M., Rjoub, H., Kalugina, O., and Hussain, N. (2022). Economic growth, renewable energy consumption, and ecological footprint: Exploring the role of environmental regulations and democracy in sustainable development. Sustain. Develop. 30, 595–605. doi: 10.1002/sd.2251
Allan, R. P., Hawkins, E., Bellouin, N., and Collins, B.: IPCC, 2021: Summary for policymakers. (2021).
Appiotti, F., Krželj, M., Russo, A., Ferretti, M., Bastianini, M., and Marincioni, F. (2014). A multidisciplinary study on the effects of climate change in the northern Adriatic Sea and the Marche region (Central Italy). Reg. Environ. Chang. 14, 2007–2024. doi: 10.1007/s10113-013-0451-5
Bala, G., Caldeira, K., and Nemani, R. (2010). Fast versus slow response in climate change: implications for the global hydrological cycle. Clim. Dyn. 35, 423–434. doi: 10.1007/s00382-009-0583-y
Ballester, J., Quijal-Zamorano, M., Méndez Turrubiates, R. F., Pegenaute, F., Herrmann, F. R., Robine, J. M., et al. (2023). Heat-related mortality in Europe during the summer of 2022. Nat. Med. 29, 1857–1866. doi: 10.1038/s41591-023-02419-z
Bucchignani, E., Montesarchio, M., Zollo, A. L., and Mercogliano, P. (2016). Mercogliano high-resolution climate simulations with COSMO-CLM over Italy: performance evaluation and climate projections for the 21st century. Int. J. Climatol. 36, 735–756. doi: 10.1002/joc.4379
Casanueva, A., Herrera, S., Iturbide, M., Lange, S., Jury, M., Dosio, A., et al. (2020). Testing bias adjustment methods for regional climate change applications under observational uncertainty and resolution mismatch. Atmos. Sci. Lett. 21:e978. doi: 10.1002/asl.978
Copernicus Climate Change Service, Climate Data Store . (2019). Complete UERRA regional reanalysis for Europe from 1961 to 2019. Copernicus climate change service (C3S) climate data store (CDS). Available at: https://doi.org/10.24381/cds.dd7c6d66
Cos, J., Doblas-Reyes, F., Jury, M., Marcos, R., Bretonnière, P.-A., and Samsó, M. (2022). The Mediterranean climate change hotspot in the CMIP5 and CMIP6 projections. Earth Syst. Dynam. 13, 321–340. doi: 10.5194/esd-13-321-2022
Doughty, C. E., Metcalfe, D. B., Girardin, C. A. J., Amézquita, F. F., Cabrera, D. G., Huasco, W. H., et al. (2015). Drought impact on forest carbon dynamics and fluxes in Amazonia. Nature 519, 78–82. doi: 10.1038/nature14213
Drenkard, E. J., Stock, C., Ross, A. C., Dixon, K. W., Adcroft, A., Alexander, M., et al. (2021). Next-generation regional ocean projections for living marine resource management in a changing climate. J. Marine Sci. ICES. 78, 1969–1987. doi: 10.1093/icesjms/fsab100
Ek, M. B., Mitchell, K. E., Lin, Y., Rogers, E., Grunmann, P., Koren, V., et al. (2003). Implementation of Noah land surface model advances in the National Centers for environmental prediction operational mesoscale eta model. J. Geophys. Res. 108:8851. doi: 10.1029/2002JD003296
Gordon, L. J., Steffen, W., Jönsson, B. F., Folke, C., Falkenmark, M., and Johannessen, Å. (2005). Human modification of global water vapor flows from the land surface. Proc. Natl. Acad. Sci. 102, 7612–7617. doi: 10.1073/pnas.0500208102
Gudmundsson, L., Bremnes, J. B., Haugen, J. E., and Engen-Skaugen, T. (2012). Downscaling RCM precipitation to the station scale using statistical transformations–a comparison of methods. Hydrol. Earth Syst. Sci. 16, 3383–3390. doi: 10.5194/hess-16-3383-2012
Hermans, K., and McLeman, R. (2021). Climate change, drought, land degradation and migration: exploring the linkages. Curr. Opin. Environ. Sustain. 50, 236–244. doi: 10.1016/J.COSUST.2021.04.013
Hersbach, H., Bell, B., Berrisford, P., Biavati, G., Horányi, A., Muñoz Sabater, J., et al. (2023). ERA5 hourly data on single levels from 1940 to present. Copernicus Climate Change Service (C3S) Climate Data Store (CDS). Available at: https://doi.org/10.24381/cds.adbb2d47 (Accessed September 19, 2023)
L’Hévéder, B., Li, L., Sevault, F., and Somot, S. (2013). Interannual variability of deep convection in the northwestern Mediterranean simulated with a coupled AORCM. Clim. Dyn. 41, 937–960. doi: 10.1007/s00382-012-1527-5
Lafon, T., Dadson, S., Buys, G., and Prudhomme, C. (2013). Bias correction of daily precipitation simulated by a regional climate model: a comparison of methods. Int. J. Climatol. 33, 1367–1381. doi: 10.1002/joc.3518
Maraun, D. (2016). Bias correcting climate change simulations – a critical review. Curr. Clim. Chang. Rep. 2, 211–220. doi: 10.1007/s40641-016-0050-x
Mentaschi, L., Lovato, T., Butenschön, M., Alessandri, J., Aragão, L., Verri, G., et al. (2024). Projected climate oligotrophication of the Adriatic marine ecosystems. Front. Clim. 6:1338374. doi: 10.3389/fclim.2024.1338374
Muñoz Sabater, J. (2019). ERA5-Land hourly data from 1950 to present. Copernicus Climate Change Service (C3S) Climate Data Store (CDS). Available at: https://doi.org/10.24381/cds.e2161bac (Accessed September 19, 2023)
Pearson, K. (1895). Contributions to the mathematical theory of evolution. II. Skew variation in homogeneous material. Philos. T.R. Soc. A 186, 343–414. doi: 10.1098/rsta.1895.0010
Pendergrass, A. G., Knutti, R., Lehner, F., Deser, C., and Sanderson, B. M. (2017). Precipitation variability increases in a warmer climate. Sci. Rep. 7, 1–9. doi: 10.1038/s41598-017-17966-y
Piani, C., Haerter, J., and Coppola, E. (2010). Statistical bias correction for daily precipitation in regional climate models over Europe. Theor. Appl. Climatol. 99, 187–192. doi: 10.1007/s00704-009-0134-9
Raffa, M., Adinolfi, M., Reder, A., Marras, G. F., Mancini, M., Scipione, G., et al. (2023). Very high resolution projections over Italy under different CMIP5 IPCC scenarios. Sci Data 10:238. doi: 10.1038/s41597-023-02144-9
Ruti, P. M., Somot, S., Giorgi, F., Dubois, C., Flaounas, E., Obermann, A., et al. (2016). Med-CORDEX initiative for Mediterranean climate studies. Bull. Am. Meteorol. Soc. 97, 1187–1208. doi: 10.1175/BAMS-D-14-00176.1
Santos da Costa, V., Alessandri, J., Aragão, L., Verri, G., Mentaschi, L., Guerra, R., et al. (2023). Perspectives on climate change in the Adriatic Sea through sea state indicators. Front. Clim. Under revision
Skamarock, W. C., Klemp, J. B., Dudhia, J., Gill, D., Barker, D., Duda, M., et al. (2008). A description of the advanced research WRF Version 3, NCAR technical note NCAR/TN 475 STR, 125 pp.
Straffelini, E., and Tarolli, P. (2023). Climate change-induced aridity is affecting agriculture in Northeast Italy. Agric. Syst. 208:103647. doi: 10.1016/j.agsy.2023.103647
Themeßl, M. J., Gobiet, A., and Heinrich, G. (2012). Empirical-statistical downscaling and error correction of regional climate models and its impact on the climate change signal. Clim. Chang. 112, 449–468. doi: 10.1007/s10584-011-0224-4
Trisos, C. H., Merow, C., and Pigot, A. L. (2020). The projected timing of abrupt ecological disruption from climate change. Nature 580, 496–501. doi: 10.1038/s41586-020-2189-9
Keywords: climate change, atmospheric climate indicators, hazard assessment, high-resolution climate projections, AdriaClim Project
Citation: Fedele G, Manco I, Barbato G, Verri G and Mercogliano P (2024) Evaluation of atmospheric indicators in the Adriatic coastal areas: a multi-hazards approach for a better awareness of the current and future climate. Front. Clim. 6:1330299. doi: 10.3389/fclim.2024.1330299
Edited by:
Andrea Valentini, Regional Agency for Prevention, Environment and Energy of Emilia-Romagna (ARPAE), ItalyReviewed by:
Charles Galdies, University of Malta, MaltaCopyright © 2024 Fedele, Manco, Barbato, Verri and Mercogliano. This is an open-access article distributed under the terms of the Creative Commons Attribution License (CC BY). The use, distribution or reproduction in other forums is permitted, provided the original author(s) and the copyright owner(s) are credited and that the original publication in this journal is cited, in accordance with accepted academic practice. No use, distribution or reproduction is permitted which does not comply with these terms.
*Correspondence: Giusy Fedele, Z2l1c3kuZmVkZWxlQGNtY2MuaXQ=
Disclaimer: All claims expressed in this article are solely those of the authors and do not necessarily represent those of their affiliated organizations, or those of the publisher, the editors and the reviewers. Any product that may be evaluated in this article or claim that may be made by its manufacturer is not guaranteed or endorsed by the publisher.
Research integrity at Frontiers
Learn more about the work of our research integrity team to safeguard the quality of each article we publish.