 Yufeng Yao
 Zhejun Zhang
 Fan Meng
94% of researchers rate our articles as excellent or good
Learn more about the work of our research integrity team to safeguard the quality of each article we publish.
Find out more
ORIGINAL RESEARCH article
Front. Clim., 29 February 2024
Sec. Climate Adaptation
Volume 6 - 2024 | https://doi.org/10.3389/fclim.2024.1293651
This article is part of the Research TopicAdvancing Sustainability, Battling Climate ChangeView all 6 articles
Climate change is an increasingly severe global crisis, posing threats to ecosystems, economies, and human lives. To address these threats, different cities around the world have adopted various levels of adaptation strategies to cope with varying degrees of negative impact, such as increasing water efficiency and enhancing health response systems. Despite some progress, there is a spatial discrepancy among cities in terms of their vulnerability to climate change and their adaptation readiness. Uncovering the reasons behind this spatial discrepancy could help us formulate better policies to address climate issues. To this end, we conduct an empirical analysis using city response data from 2020, sourced from the Carbon Disclosure Project (CDP), focusing on a dataset that encompasses 421 cities worldwide. Specifically, we first formulate a “vulnerability index” to measure the propensity of cities to suffer negative effects in the event of climate hazards and a “readiness index” to represent their adaptation readiness level. Then we introduce the “discrepancy score” to quantify discrepancies across cities and discover the spatial distribution of the discrepancies through spatial visualization. Further, we employ a clustering analysis method named k-means to group different cities based on vulnerability index and readiness index. Finally, we perform Geographically Weighted Regression (GWR) to quantitatively analyze the spatial correlation between the economy and the discrepancy score of different cities. Our research mainly reveals several findings: (1) European cities tend to exhibit high levels of adaptation readiness with low degrees of vulnerability. In contrast, African cities consistently display heightened degrees of vulnerability combined with limited adaptation readiness. (2) Economic factors play a significant role in the spatial discrepancies between levels of adaptation readiness and degrees of vulnerability of cities; (3) The impact of the economy on the discrepancy scores exhibits significant spatial heterogeneity, with its influence being greater in European and African regions compared to other areas. Our study contributes both theoretically and practically to the comprehension of global climate change. It provides evidence-based support for the development of more effective climate change mitigation strategies and lays the foundation for fostering worldwide collaboration and initiatives.
Climate change is garnering global attention due to its increasing prevalence and impact (Zuccaro and Leone, 2021; Truong et al., 2022). With the continuous increase in greenhouse gas emissions, the Earth's average temperature has been escalating annually, resulting in heightened occurrences of extreme weather events, rising sea levels, and glacial melt (Piao and Wang, 2023). These environmental shifts damage ecosystems and affect the lives and economies of countless individuals (Nunn et al., 2021). Climate change manifests itself in food and water shortages, the emergence of ecological refugees, and biodiversity loss (Rahman and Hickey, 2019). To counter these impacts, city governments worldwide have begun implementing climate adaptation strategies (Swart et al., 2014). Adaptation to climate change is vital, serving as an adjustment mechanism for evolving or anticipated climatic conditions and their ramifications. Numerous regions have recently embraced such policies (Swart et al., 2014). In Asia, adaptation measures have been integrated into development planning, early warning systems, water resource management, and coastal zone management (Abbass et al., 2022). Similarly, in Europe, adaptation considerations now include environmental protection, coastal and water resource management, land planning, agricultural risk management, and disaster mitigation (Grafakos et al., 2020; Linares et al., 2020). Despite some progress, most observed adaptation strategies are unequally distributed across regions (Eriksen et al., 2021). Developed countries, with their access to advanced technologies and greater human and physical capital, are able to adopt more efficient and innovative strategies. In contrast, developing countries often rely on traditional or existing technologies, which could potentially limit the effectiveness and scope of their adaptation strategies (Saeed et al., 2023). Unfortunately, developing countries are more susceptible to climate change due to poor environments and weak socio-economic status (Hamidi et al., 2020). These disparities lead to a spatial discrepancy among cities in terms of their vulnerability to climate change and their adaptation readiness. In cities where the level of adaptation readiness is lower than the degree of vulnerability, there is an adaptation deficit, and the impact of climate change will be further exacerbated. Conversely, in cities where the level of adaptation readiness is higher than the degree of vulnerability, there is an adaptation surplus which could lead to a serious waste of resources (Amegavi et al., 2021). As climate change intensifies, this spatial discrepancy could precipitate risks such as significant population migrations, resource competitions, and regional tensions (Perch-Nielsen et al., 2008). In addition to these risks, such a spatial discrepancy could also exacerbate socio-economic inequalities (Islam and Winkel, 2017). Addressing this spatial discrepancy is thus of paramount importance.
Although it is essential to address the discrepancy between vulnerability and adaptation readiness, scientific literature on this topic remains limited. Existing studies about vulnerability and adaptation readiness to climate change can be broadly clustered into three main categories. The first category examines how well nations and cities are equipped for present and anticipated climate changes (Sarkodie and Strezov, 2019; Amegavi et al., 2021). Many researchers in this area utilized the Notre Dame Global Adaptation Initiative (ND-GAIN) data to establish indexes across the country or city level (Leal Filho et al., 2019; Halkos et al., 2020). The second category investigates the facilitation of adaptation readiness. Some scholars found that affluent cities typically exhibit robust social, governance, and economic readiness (Sarkodie et al., 2022). Meanwhile, Birchall et al. (2023) carried out a comparative qualitative analysis, identifying that the structural peculiarities of regional governments can either bolster or impede climate adaptation strategies. The third category interlinks adaptation readiness with vulnerability. For instance, some scholars have explored the nexus between adaptation readiness and climate vulnerability, deducing a substantial inverse relationship (Amegavi et al., 2021). Similarly, some scholars analyzed the interrelationship among climate change perceptions, vulnerability, and readiness across 17 Latin American nations (Azócar et al., 2021). They discovered that individuals' perceptions of climate risks can substantially impact urban readiness. In conclusion, most studies have explored the extent of vulnerability and adaptation readiness across various locales and identified underlying influential factors. They merely quantified vulnerability and readiness levels (Sarkodie and Strezov, 2019; Amegavi et al., 2021). While some studies investigate the interactive relationship between adaptation readiness and vulnerability, they often overlook the spatial discrepancy in these aspects (Amegavi et al., 2021; Azócar et al., 2021). Furthermore, these studies often focus only on local areas, which can lead to conclusions with certain limitations.
In an effort to bridge gaps in the literature and contribute a global context to climate change, we empirically study the spatial discrepancy among 421 global cities in terms of their vulnerability to climate change and their adaptation readiness. Firstly, we formulate vulnerability and readiness indexes based on the ND-GAIN framework (Chen et al., 2015), using city response data from 2020 sourced from the CDP. In line with previous literature (Allen Consulting, 2005; Azócar et al., 2021), we consider three aspects of vulnerability: exposure, sensitivity, and adaptive capacity. Vulnerability measures the propensity of cities to suffer negative effects in the event of climate hazards, while readiness assesses a city's potential capacity to adapt to these hazards (Ready and Collings, 2021). Then we introduce the “discrepancy score” to quantify discrepancies across cities. The discrepancy score is obtained by subtracting each city's rank in the vulnerability index from its rank in the readiness index across all the study samples. After calculating the above indices, we conduct a geographical visualization of the cities' vulnerability and readiness levels. Further, we employ a clustering analysis method named k-means to group different cities based on vulnerability index and readiness index. Through cluster analysis, we group all cities into four broad categories and focus on which cities have a discrepancy between vulnerability and readiness. Finally, we perform the GWR to quantitatively analyze the spatial correlation between the economy and the discrepancy score of different cities. Our research indicates that economic factors are a significant reason for the spatial discrepancies in the level of urban readiness and vulnerability. The impact of the economy on these discrepancies shows notable spatial heterogeneity, with its effects being more pronounced in the cities of Europe and Africa compared to other regions.
This paper is structured as follows: Firstly, Section 2 provides a review of existing literature on climate change vulnerability and adaptation readiness. In Section 3, we construct a conceptual framework for understanding climate adaptation. In Section 4, we outline our study area, data sources, variables, techniques, and the steps of our analysis. Section 5 presents the results of our empirical analysis. In Section 6, we conduct a detailed discussion of this study. In Section 7, we summarize the main findings, results, and viewpoints of this study.
In academia, there is a lack of consensus among scholars regarding the definition of vulnerability. However, vulnerability typically refers to the susceptibility or weaknesses of a system or individual when confronted with external pressures, risks, or changes (Li et al., 2022). Within the context of climate change, there has been a growing awareness of the varying impacts of climate change and adaptive capacity among different regions, social groups, and ecosystems. In particular, vulnerability refers to the extent to which a system is prone to adverse impacts, such as those stemming from climate change, and cannot effectively respond to these impacts (Leary et al., 2001). This concept is employed to address various aspects, including geological hazards, risk research, climate change, and land use alterations (Zhang et al., 2021). To more accurately describe the vulnerability of different regions and systems to climate change, scholars have gradually associated the concept of “vulnerability” with “climate change,” giving rise to the term “climate change vulnerability”. As research into the impacts of climate change has deepened, this term has progressively gained widespread usage in academic circles and policy formulation to characterize the climate change risks and challenges faced by diverse regions and populations (Judd et al., 2022).
Early scholars examined the influencing factors of vulnerability and delineated three theoretical streams. The first is the entitlement theory, which interprets vulnerability as interconnected economic and institutional factors. Entitlements are a source of achieved or potential welfare or income, which can be understood as a “bundle of alternative commodities that a person in a society can command with the totality of rights and opportunities he or she faces” (Zahran et al., 2006). Fundamentally, when people lack income and wealth, and previously held alternative funds collapse, their vulnerability to responding to natural disasters becomes amplified. In contrast, the second theoretical stream tends to explain vulnerability from a physical perspective. They believe that physically exposed factors influence the degree of vulnerability when facing disasters. For instance, it has been found that almost all types of natural disasters and various social and political disruptions have distinctly different impacts on different groups within a society (De Sherbinin et al., 2012). For many natural disasters, vulnerability hinges on where humans reside, how they utilize natural resources, and the resources they must contend with. Moreover, some scholars have synthesized economic and physical factors to propose the “human-ecological” theory. They attempt to analyze why individuals with lower economic income or those on the societal margins face a higher risk of natural disasters (Thuiller, 2007). For instance, it was discovered that individuals with poorer economic conditions often reside in areas with elevated risks, thereby exposing them to more significant risks of floods, diseases, and other chronic stresses, resulting in heightened vulnerability. In conclusion, climate vulnerability is closely interconnected with the affected cities' political, cultural, economic, and territorial conditions (Krellenberg et al., 2017). Climate change vulnerability assessment refers to the assessment activities aimed at determining the extent of climate vulnerability in a particular location to reduce related risks posed by climate change impacts (Schneider et al., 2001). In extensive research, vulnerability often comprises three crucial parameters: exposure, adaptability, and sensitivity (Smit and Wandel, 2006; Amegavi et al., 2021; Sarkodie et al., 2022). Among them, exposure refers to the extent to which a system or region is exposed to climate change. Exposure can be measured by considering the impacts of climate change, such as rising temperatures and changes in precipitation. Sensitivity refers to the degree to which a system or region reacts to climate change and the extent to which it is adversely affected. Depending on their specific characteristics and conditions, different systems and groups may have varying sensitivities to climate change.
The existing literature about vulnerability to climate change can be divided into four categories. The first category is about the influencing factors of climate change vulnerability, such as economy (Binita et al., 2015), geographical factors (Li et al., 2022), and social structure (Biermann and Pattberg, 2008). In a recent study, Sarkodie et al. (2022) concluded that the vulnerability to climate change is largely influenced by factors related to economics, society, and institutions. The second category is about the climate change vulnerability among different sectors and industries. Bedeke (2023) reviewed the climate change risks in agriculture in sub-Saharan Africa, people's vulnerability to these risks, and synthesizes different methodologies and models used to assess vulnerability and adaptation. The third category is about the vulnerability of natural ecosystems to climate change, such as biodiversity (Tournebize et al., 2022), ecosystem stability (Zhang et al., 2022), ecosystem services (Tran et al., 2022). The last category focuses on the vulnerability of specific regions or geographic locations. Most studies showed concern of climate change vulnerability for the Asian and African continents (Blekking et al., 2022; Onyeneke et al., 2023).
Climate change response primarily encompasses mitigation and adaptation strategies (Sarkodie et al., 2022). Mitigation primarily focuses on reducing global greenhouse gas emissions to address the overarching global climate issue, while adaptation involves a series of policies or measures to alleviate the adverse impacts of climate change (Füssel and Klein, 2006). Urban climate readiness aims to indicate potential signs of change and identify intervention measures to enhance readiness in various domains (Khan and Amelie, 2015). Climate readiness refers to a series of measures and policies adopted by a specific city, region, or country to address the impacts of climate change. These measures aim to enhance the adaptive capacity of social, economic, and ecological systems to mitigate the adverse effects of climate change. Climate readiness encompasses infrastructure upgrades, natural resource management, urban planning, social and economic policies, risk assessment and early warning systems, and technological innovations. The ultimate goal of climate readiness is to reduce vulnerability to climate change, increase the resilience of ecological and social systems, and achieve sustainable development. In general, readiness capacity often encompasses six factors: adaptive decision-making and stakeholder engagement, adequate scientific availability, political leadership, public support for adaptation, and institutional organization (Ford and King, 2015). Significant disparities exist in climate change readiness among different cities (de Sherbinin and Bardy, 2015; Romero-Lankao et al., 2016). These differences can be attributed to various factors, including geographical location, economic level, government policies, and societal awareness. Firstly, geographical location determines the potential climate change impacts a city might face. Coastal cities may be more vulnerable to threats such as rising sea levels and storm surges, while inland cities may be more susceptible to extreme climate events like floods and droughts. Secondly, the economic level influences a city's capacity to allocate resources for readiness efforts. Economically developed cities often have more financial resources to enhance infrastructure, establish early warning systems, and promote innovative technologies (Markantonis et al., 2019). Government policies also play a significant role in determining a city's level of readiness (Rickards et al., 2014). Some cities may adopt proactive climate policies encouraging sustainable development and emission reduction measures, while others may lack relevant policy support. Finally, societal awareness plays a pivotal role in a city's readiness level. Urban residents' climate awareness and behavioral habits can impact a city's readiness and response capabilities.
It is important to note that enhancing climate change readiness requires close collaboration among various sectors, including government, businesses, academia, and community organizations (Biermann and Pattberg, 2008; Jordan and Huitema, 2014). Intersectoral cooperation can facilitate resource integration, knowledge sharing, and the formulation of comprehensive response strategies. Firstly, governments play a pivotal role in policy and regulatory development. Establishing relevant departments and institutions, they coordinate interdepartmental collaboration and formulate holistic plans for climate change readiness. Secondly, active involvement from the business sector is equally crucial. Businesses can contribute financial resources and technology to promoting sustainable development and take an active role in reducing carbon emissions and driving green innovation. Academic research and innovation provide scientific foundations for formulating readiness strategies. Community organizations represent the interests of marginalized groups, ensuring their full consideration in the readiness process.
A close relationship exists between climate change vulnerability and readiness levels (Francini et al., 2020). Enhancing readiness will likely reduce people's vulnerability to climate change (Amegavi et al., 2021). Effective readiness measures can reduce a city's vulnerability to climate change events. For instance, investments in early warning systems, infrastructure improvements, and emergency response mechanisms can enhance the city's resilience during disasters. By establishing appropriate infrastructure, developing sustainable resource management strategies, enhancing the resilience of social and economic systems, and implementing measures such as emergency warning systems, a region can mitigate the damages it faces when confronted with climate change. The enhancement of climate readiness contributes to improving the ability of both society and ecosystems to respond to climate change, thereby reducing their vulnerability. Many scholars have begun to focus on the relationship between climate change readiness and vulnerability. For instance, based on panel data from 192 United Nations countries, Sarkodie and Strezov (2019) investigated the link between climate change vulnerability and adaptation readiness; Amegavi et al. (2021) studied 51 African countries and found significant adverse effects of adaptation readiness on climate change vulnerability in the region; Otto et al. (2021) examined climate change readiness in 104 cities in Germany and discovered variations in readiness across cities of different sizes; Saeed et al. (2023) researched countries with varying income levels using panel data from 1995 to 2020, revealing that countries with lower income levels are more susceptible to the impacts of climate change.
However, concerning the scope of research subjects, these studies predominantly focused more on the influence of climate change readiness between different sectors, countries, or within nations on climate change vulnerability without considering the spatial disparities in climate change vulnerability and readiness among different global cities. Although some studies have compared climate change vulnerabilities and readiness levels in some cities, larger-scale, comprehensive urban comparative investigations still need to be done. Such investigations would provide deeper insights into the disparities and similarities among global cities. Regarding research methodologies, these studies primarily employ quantitative statistical methods such as Ordinary Least Squares (OLS), Data Envelopment Analysis (DEA), and Panel Mean Group (PMG). Regarding research content, scholars primarily emphasize the influencing factors, with few addressing spatial disparities and the potential discrepancy between readiness and vulnerability. For instance, some cities may be located near coastlines, facing risks from rising sea levels and extreme weather events like hurricanes, potentially resulting in higher vulnerability.
Conversely, inland cities may encounter distinct challenges due to climate change impacts, such as droughts and water resource shortages. Additionally, the socio-economic status of a city can influence its readiness; cities in developed countries often possess more resources and technological capabilities to address climate change. Specifically, this study makes the following contributions: Firstly, it provides insights into the unique challenges and opportunities that different cities face by analyzing disparities in climate vulnerability and readiness on a global scale. This understanding can facilitate tailored policy recommendations for each city. Secondly, the study offers decision support to urban planners, environmental agencies, and social organizations. This support can lead to optimizing urban planning, resource allocation, and environmental measures, enhancing adaptation to climate change challenges. Thirdly, on a broader scale, by revealing diverse cities' vulnerabilities and readiness levels, the study contributes to achieving climate-related goals within the United Nations Sustainable Development Agenda. Consequently, it contributes to advancing global sustainability objectives.
To more effectively address the research questions, this section establishes a conceptual framework that clarifies the relationships among climate risk, adaptive capacity and vulnerability. According to the Intergovernmental Panel on Climate Change (IPCC), Climate risk is the potential for negative consequences for human or ecological systems from the impacts of climate change. In the context of climate change, vulnerability is defined as the propensity or predisposition to be adversely affected (Sarkodie et al., 2022). It comprises three components: exposure, sensitivity, adaptive capacity and it includes a variety of factors that determine a community's or system's ability to withstand the impacts of climate change. Adaptive capacity refers to the ability of individuals, communities, organizations, or nations to respond to and adapt to the impacts of climate change (IPCC, 2023). This includes mitigating the negative impacts of climate change and capitalizing on any potential positive effects. Drawing on the UNFCCC adaptation framework (Schipper, 2006) and ND-GAIN framework (Chen et al., 2015), we established a new framework to illustrate the relationship between climate risk, vulnerability, and adaptive capacity, as shown in Figure 1. In the climate change context, exposure and sensitivity together describe the potential impact that climate change can have on a system, and this potential impact is referred to as climate risk (Fellmann, 2012). Vulnerability takes into account not only exposure and sensitivity but also the adaptive capability. Therefore, it actually refers to the residual impact or risk that a system faces after making efforts to adapt to climate change (Allen Consulting, 2005). When facing climate change, relevant sectors will conduct vulnerability assessment, and then implement corresponding adaptation strategies. Vulnerability assessment helps understand the climate problem, while adaptation is the method of solving the problem. It is clear that these factors form a dynamic cycle. High climate risk can be a driver for increasing adaptation, which in turn can reduce vulnerability and hence lower climate risk. Conversely, high vulnerability can exacerbate the impacts of climate risk, highlighting the need for improved adaptive capacity.
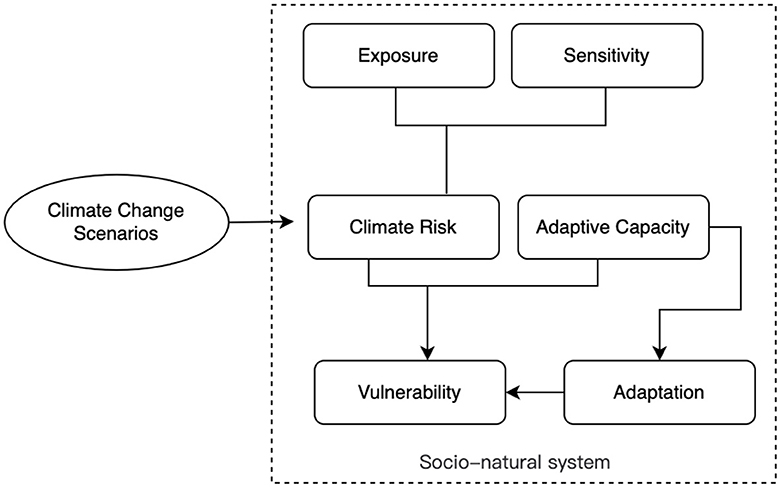
Figure 1. Conceptual framework. Source: Author's construction based on Allen Consulting (2005).
In this study, all the city samples analyzed were obtained from the 2020 CDP dataset. In 2020, CDP collected climate change information from a total of 566 cities. During the information gathering phase, certain cities exhibited a deficiency in available data. After excluding entries with missing information, we obtained a final sample of 421 cities. These cities span multiple countries and regions, representing a variety of cultural, economic, and geographical backgrounds. Specifically, the majority of the cities come from the Americas, Africa, and Europe.
To understand the foundational reasons for the spatial discrepancy among cities in terms of their vulnerability to climate change and their capabilities for adaptation, we utilized city response data from the Carbon Disclosure Project (CDP) to construct relevant indicators and indices. The CDP is a global non-profit organization that motivates companies and governments to curtail greenhouse gas emissions, conserve water resources, and preserve forests. Each year, CDP supports companies, cities, states, and regions in measuring and managing their risks and opportunities related to climate change. The information supplied during the annual reporting process is used to score companies and cities on their journey through disclosure. The CDP data is a survey data. As of the current date, the CDP has amassed a dataset encompassing climate change metrics spanning the years 2018 through 2020. However, the 2020 dataset stands out for its comprehensiveness, making it the focal year for our analysis. The city questionnaire of 2020 encompasses 11 sections that delve into the multifaceted aspects of cities' environmental and climate adaptation initiatives. The structure of the city questionnaire is elucidated in Table 1. For instance, in the first section, cities are encouraged to outline the most salient climate challenges they face and highlight factors that shape their adaptive capacities. The second section delineates the primary actions, strategies, and goal formulations initiated to counteract climate change and diminish associated risks and vulnerabilities. Other sections include descriptions related to food, energy, water resources, etc. All responses to the questions are either categorical or variables. The CDP dataset has been frequently cited in past research addressing environmental and social matters (Luo et al., 2012; Li et al., 2018). As this dataset expands annually to encompass a growing number of companies and cities, the potential for impactful data utilization correspondingly increases. Additionally, we incorporate the GNP index sourced from the Sustainable Development Goals (SDG) to represent a city's economic wealth (Sdg, 2019). Here, we selected the national-level GNP value to represent the economic level of these cities, which is used to roughly represent the relative economic level of the cities, consistent with prior research (Vittersø et al., 2002). The SDGs comprise a set of 17 global objectives aimed at tracking advancement toward diverse sustainability targets delineated by the United Nations 2030 Agenda, which includes goals such as “No Poverty,” “Clean Water and Sanitation,” and “Climate Action,” among others.
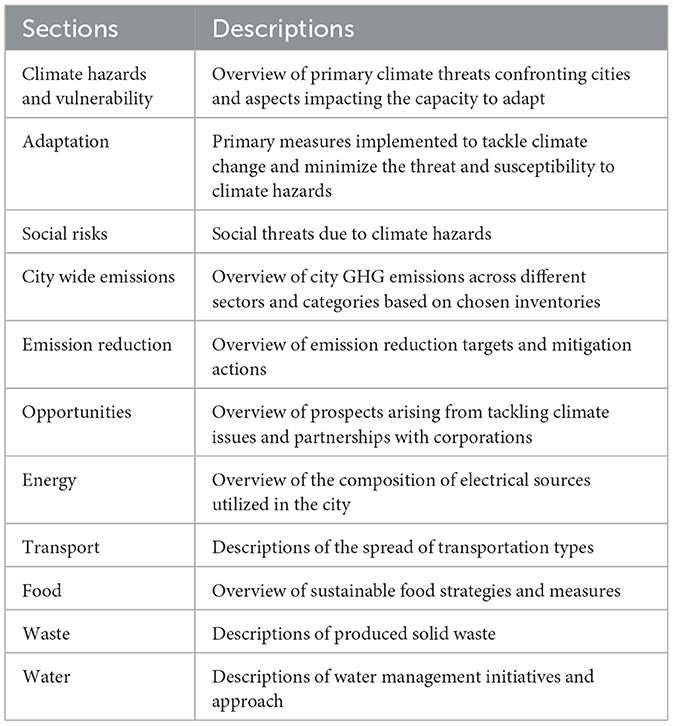
Table 1. Descriptions of the questionnaire.
In this study, we draw on the ND-GAIN framework (Chen et al., 2015) to establish the vulnerability index and readiness index. This framework has been widely used in climate change related literature research (Azócar et al., 2021; Sarkodie et al., 2022). Therefore, we divide the measure of vulnerability into three components: exposure, sensitivity, and adaptive capacity, following the ND-GAIN approach. When studying complex and multidimensional socio-environmental phenomena, building an indicator system is essential. In this section, we conduct an exploratory analysis of cities' answers to the 2020 cities questionnaire, aiming to identify indicators that reflect cities' vulnerability and adaptation readiness for climate change. These indicators are categorized into two groups: vulnerability and readiness. In alignment with previous study (Amegavi et al., 2021), we establish the “Hazards Exposure Level” indicator, computed as weighted sum of reported hazards and their associated probability. This indicator reflects the exposure level of cities, as they are asked to report the most significant climate hazards and assess their probability and magnitude in the questionnaire. Sensitivity is defined as a measure of population susceptibility to climate change (Azócar et al., 2021). In numerous studies (Amegavi et al., 2021; Azócar et al., 2021), health systems and water supply systems have been identified as crucial factors affecting susceptibility to climate change. In the questionnaire, cities report whether they face risks to public health systems associated with climate change and provide the percentage of the city's population with access to potable water supply services. Consequently, we introduce the “Health System Risk” and “Water Supply Service” indicators to reflect sensitivity levels. Subsequently, we develop the “Adaptive Capacity Level” indicator, reflecting cities' adaptive capacity for climate change. Drawing on the ND-GAIN framework (Chen et al., 2015). This adaptive capacity comprises eight dimensions: economic, health, education, habitat, infrastructure, social, environment, and governance. Finally, we construct ten indicators assessing cities' progress in implementing climate adaptation policies. These indicators are based on the number of relevant climate adaptation strategies employed by each city. Table 2 shows the categorization of city indicators.
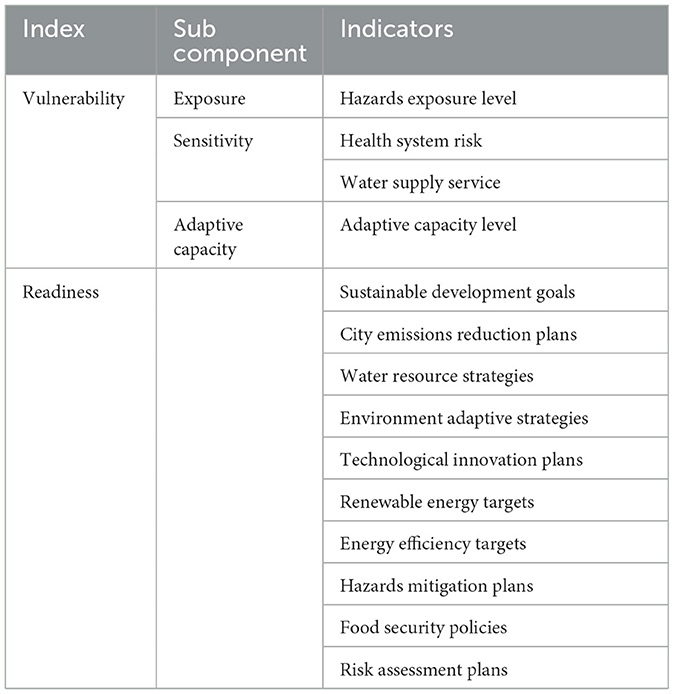
Table 2. Descriptions of indexes.
In this part, we calculated the vulnerability index. The Intergovernmental Panel on Climate Change (IPCC) is regarded as the authoritative institution for climate change research, and hence the definition of vulnerability in this study originates from it. According to the IPCC (2023), vulnerability in the context of climate change is referred to as the degree to which a system is susceptible to and unable to cope with the negative impacts of climate change, which includes the climate variability and extremes. Here, we establish the “vulnerability index” to measure the propensity of cities to suffer negative effects in the event of climate hazards. Based on ND-GAIN's framework we divided the vulnerability into three primary components: exposure, sensitivity, and adaptive capacity (Chen et al., 2015). First, we outlined the methodology used to calculate each component before integrating them into a single metric. We started by quantifying the three vulnerability indicators as follows.
Exposure refers to the degree to which a system, community, or asset faces climate-related stresses or shocks at a specific time and place (Chen et al., 2015). In line with previous studies, we use the climate disasters faced by the city and their severity to indicate the level of exposure (Adom and Amoani, 2021). In Section 2.1 of the questionnaire, cities are asked to identify the most critical climate hazards, assessing their probability and magnitude. These parameters are frequently employed in risk assessments to comprehend and quantify potential climate hazards impacts (Pourghasemi et al., 2019). Here, “probability” denotes the likelihood of a hazard occurring within a set timeframe, while “magnitude” gauges the hazard's severity or intensity. To establish the exposure level indicator, we integrate both the hazard probabilities and magnitudes. Initially, we allocate values to the categorical responses as follows: “High” as 5, “Medium High” as 4, “Medium” as 3, “Medium Low” as 2, “Low” as 1, and “Does not currently impact the city” as 0. Subsequently, the exposure level can be determined using the given formula:
In Equation (1), Ei represents the exposure level of different cities. In this context, i denotes the different climate hazards a city encounters, Mi indicates the magnitude of a specific climate hazard, and pi represent its probability. The symbol “n” corresponds to the total number of hazards experienced by the city. Subsequently, we normalized the resulting exposure score to a range between 0 and 1.
Sensitivity refers to the extent to which a system, community, or asset could be affected by, or respond to, climate variability and change (Chen et al., 2015). It essentially describes how susceptible a system is to harm from exposure to certain hazards or stressors. According to Section 4.3.1, we use the “Health System Risk” and “Water Supply Service” indicators to compute the sensitivity level. First, in Question 2.1 of the questionnaire, cities are asked whether they face risks to public health systems associated with climate change, with the possible answers being “Yes,” “No,” or “Do not know.” We assign a value of 1 to the answer “Yes”, and a value of 0 to both “No” and “Do not know”, thus obtaining the value for “Risk Assessment”. In Question 14.1 of the questionnaire, cities report the percentage of the city's population having potable water supply service. We calculate the indicator of “Water Supply Service” by subtracting this percentage from 100. Finally, we normalize these two indicators and compute their average to obtain the overall sensitivity level.
Adaptive capacity refers to the ability of a system, community, or asset to adjust, cope with, and recover from the effects of climate variability and change (Chen et al., 2015). It represents the potential or capability of a system to modify its characteristics or behaviors in order to better cope with existing and anticipated external stresses or pressures. The adaptive capacity is integral to effectively assessing cities vulnerability to climate hazards (Sarkodie and Strezov, 2019). In the Section 3 of the questionnaire, which focuses on adaptive capacity to climate change, cities were prompted to identify and describe their adaptive capacities. We consolidated the responses into eight primary aspects: economic, health, education, habitat, infrastructure, social, environmental, and governance. All the answers to relevant questions are numeric variables. Therefore, we first normalize these values to obtain the values of eight indicators. We then calculate the average of these eight normalized indicators to determine the “Adaptive Capacity Level”.
Drawing on previous research, vulnerability should take into account not only exposure and sensitivity but also the adaptive capability. It actually refers to the residual impact or risk that a system faces after making efforts to adapt to climate change (Luers et al., 2003; Allen Consulting, 2005). Therefore, the city vulnerability index is obtained by the sum of exposure and sensitivity minus adaptive capacity indices, using the following formula:
In Equation (2), Vi represents the vulnerability of individual cities, and Ei denotes the exposure level, illustrating the extent to which a city is subject to potential detrimental impacts from climate-related hazards. Si denotes the sensitivity of cities to climate hazards, reflecting how susceptible their infrastructure, economy, and population are to the adverse effects of such events. Ai represents the cities' adaptive capacity, highlighting cities' adaptive capacity.
Readiness typically refers to the level of readiness of a country, region, community, or system to address the challenges brought about by climate change. This includes the formulation and implementation of adaptation and mitigation strategies, as well as the ability to effectively utilize funds and other resources to realize these strategies (Amegavi et al., 2021; Sarkodie et al., 2022). In this study, we consider the implementation of urban climate change adaptation strategies. In the questionnaire, cities are surveyed about their primary adaptation measures against identified climate risks and vulnerabilities. Drawing on ND-GAIN's framework, we quantify all the actions taken by the city related to climate change adaptation to represent the level of readiness (Chen et al., 2015). An analysis of these responses revealed 10 distinct adaptation measures such as “Sustainable Development Goals,” “Risk Assessment Plans,” “Renewable Energy Targets,” and so on. We convert all the answers to the questions corresponding to these indicators into numerical variables. For example, cities are asked whether they have published a plan to reduce the greenhouse gas emissions, with the possible answers being “Yes,” “In progress,” “ Intending to undertake in the next 2 years,” “Not intending to undertake,” or “Do not know.” We assign these answers as 3, 2, 1, 0, 0 in turn. All indicators' calculation follows the same method. Therefore, we first normalize these values to obtain the values of 10 indicators. We then calculate the average of these 10 normalized indicators to determine the readiness index.
Based on the above steps, we calculated the vulnerability and readiness of each city. Subsequently, we introduced a new concept to “discrepancy score” metric to quantify the discrepancy between vulnerability and readiness. Drawing on ND-GAIN's framework (Chen et al., 2015), we firstly arranged each city's vulnerability and readiness indices in ascending order, granting us the relative positioning of each city's vulnerability and readiness within the entire dataset. The discrepancy score was calculated by subtracting the vulnerability rank from the readiness rank (Allen Consulting, 2005), as expressed in the following formula:
In Equation (3), Di denotes the discrepancy score across cities, Rri represents the readiness rank for specific cities, and Rvi denotes the rank of vulnerability for individual cities.
K-means clustering is an unsupervised machine learning algorithm that groups data into clusters. The core idea is that the similarity between data points can be estimated by the Euclidean distance (or other distance measures) between them, and similar data points should be classified into the same cluster (Na et al., 2010). It aims to segment data points into distinct clusters, maximizing intra-cluster similarity and minimizing inter-cluster similarity (Likas et al., 2003). Drawing on previous study, we conducted the k-means clustering analysis to categorize the 421 cities based on their vulnerability and readiness levels (Azócar et al., 2021). The objective of K-Means clustering is to minimize the sum of squared errors within clusters, represented by the following formula:
In Equation (4), Ci denotes the ith cluster, μi is the center of Ci, and ||.|| represents the Euclidean distance. Before performing a k-means clustering analysis, it's essential to determine the number of clusters. The elbow method is a commonly used approach for this purpose (Syakur et al., 2018). In this way, we ascertain four as the optimal number. This led to a typology comprising four distinct groups.
The spatial autocorrelation refers to whether a certain attribute of locations or regions in geographic space exhibits a degree of correlation in its spatial distribution (Dormann, 2007). In this study, it is used to describe the degree of association between the discrepancy score value of a region and the values in its neighboring regions. A significant spatial correlation between the spatial distributions of discrepancy scores is a prerequisite for applying the geographically weighted regression model (Zhu et al., 2020). In this study, the global Moran's I index was used to describe the global cluster characteristics of the value of discrepancy score (Mathur, 2015). The equation is expressed as follows:
In the Equation (5), n denotes the number of geographic units (the number of cities); w is the sum of all weights in the weight matrix and wij is the weight between geographic units i and j; xi and xj are the attribute values on geographical units a and b, respectively; represents the average of attribute values across all geographic units. Moran's I is a measure of spatial autocorrelation that ranges between −1 and 1: values close to 1 indicate positive spatial autocorrelation where similar values cluster together, values close to −1 signify negative spatial autocorrelation where different values are adjacent, and values near 0 suggest a random spatial distribution with no significant autocorrelation (Hu et al., 2021). In conclusion, when the value of Moran's I is significant and far away from 0, it indicates the existence of spatial autocorrelation.
To quantify the impacts of economic on the discrepancy among cities in terms of their vulnerability to climate change and their capabilities for adaptation, the OLS is the most commonly used method for analyzing the relationships between two or more variables (Zhu et al., 2020). However, the OLS model assumes that the relationship between the explanatory variable and the dependent variable is constant, ultimately estimating a global regression coefficient for the explanatory variable. Therefore, it cannot capture the phenomenon where the relationship between variables changes with geographical location (Wang et al., 2019). Therefore, in this study we employed the Geographically weighted regression (GWR) to provide a more detailed spatial information on the relationship between these variables (Lin and Wen, 2011). GWR considers the presence of spatial heterogeneity; it is a modified form of linear regression (Griffith, 2008). In addition to the original regression model, it incorporates the spatial coordinates of sample points as independent variables, constructs independent equations for each element in the dataset, and introduces a spatial weight matrix. Compared to ordinary regression models, its advantage lies in the ability to rapidly adjust spatial weights based on the spatial proximity and relative positions of the samples, thereby ensuring that the model coefficients more accurately reflect the differences and non-homogeneity of each element (Zhu et al., 2020). The model representation is as follows:
In Equation 6, yi denotes the discrepancy score of city i, (ui, vi) is the geographic coordinates of the city i, β0 is the intercept; xij represents the economic indicator, βj(ui, vi) is the local regression coefficient of xij, εi is the random error term.
In this study, we drew on previous research and used the Gaussian function to determine the weight (Zhu et al., 2020), while employing the Akaike Information Criterion (AIC) to ascertain the optimal bandwidth (Griffith, 2008). Before conducting geographic weighted regression, we standardized the economic indicators. The values of the discrepancy score can be positive or negative, and these signs represent different meanings. Therefore, we centralized it to preserve its positive and negative meanings.
From our preliminary analyses, we determined the vulnerability and readiness indices for each city. Our dataset encompassed 421 cities across five continents: North America, South America, Asia, Africa, and Europe. The cities ranking highest in vulnerability are Kisumu (0.81), Johannesburg (0.78), and Lagos (0.74). Conversely, the leading cities in readiness are Paris (0.94), Vancouver (0.91), and Lund (0.90). We initially performed the geographical visualization of vulnerability and readiness indices across all cities based on their longitude and latitude coordinates. Figure 2 illustrates the vulnerability index of various cities on a map, while Figure 3 presents the readiness index. On these maps, each point signifies a city; the color intensity denotes the value magnitude, and darker shades represent higher values. Cities in Europe and America tend to have lower vulnerability indices. In contrast, cities in Africa manifest greater vulnerability. Regarding the readiness index, European cities generally display high readiness, indicating their strong capability to tackle climate change. Conversely, despite their increased vulnerability, African cities manifest significantly lower readiness. These insights are consistent with findings from previous studies (Sarkodie and Strezov, 2019; Amegavi et al., 2021).
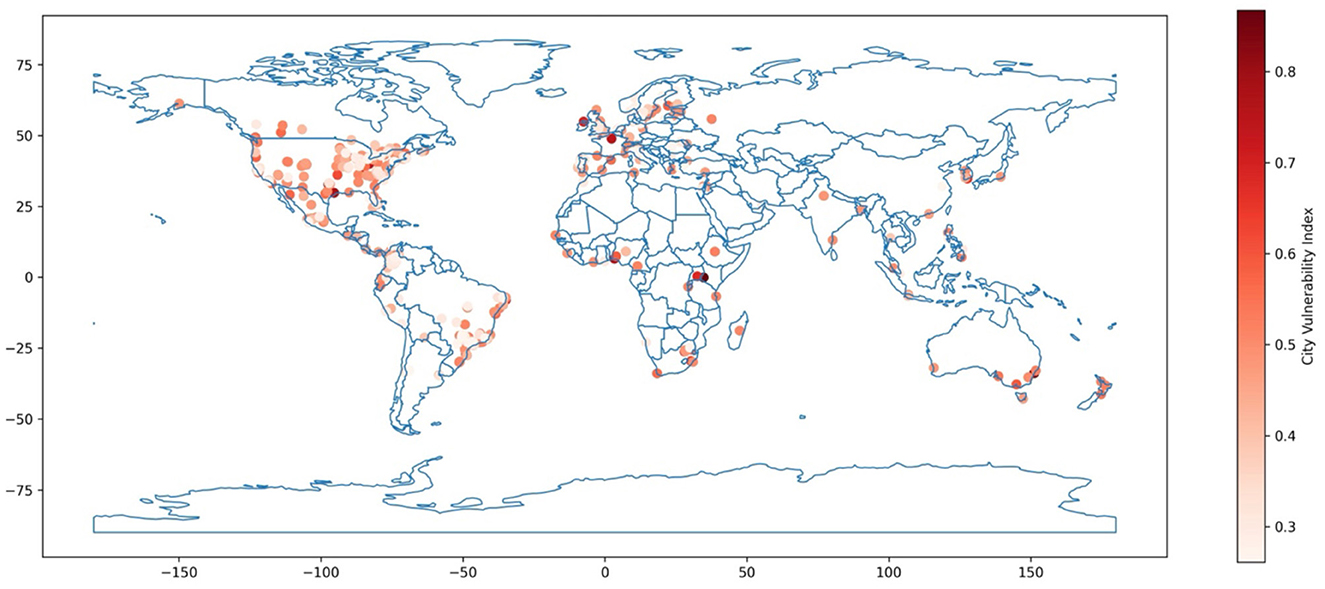
Figure 2. City vulnerability index distribution.

Figure 3. City readiness index distribution.
Utilizing previously obtained data, we conducted k-means clustering analysis to categorize the 421 cities based on their vulnerability and readiness levels. Figure 4 and Table 3 present the clustering results. As illustrated in Figure 4, cities fall into four categories: for instance, cities in the upper left corner exhibit low readiness and high vulnerability, whereas those in the lower right corner manifest high readiness and low vulnerability. Table 3 provides the mean readiness and vulnerability indices for each category. The scatter plot is divided into four areas: the bottom left is Cluster 2, the top left is Cluster 1, the bottom right is Cluster 0, and the top right is Cluster 3. The data conspicuously indicates a significant discrepancy between urban vulnerability and readiness. Notably, 93 cities display low readiness and high vulnerability, while 112 cities showcase high readiness and low vulnerability, warranting further attention.
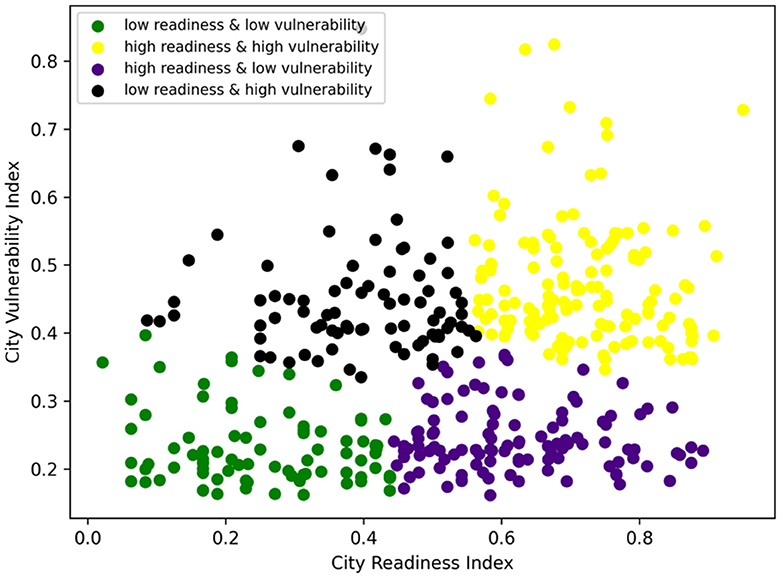
Figure 4. Clustering analysis.
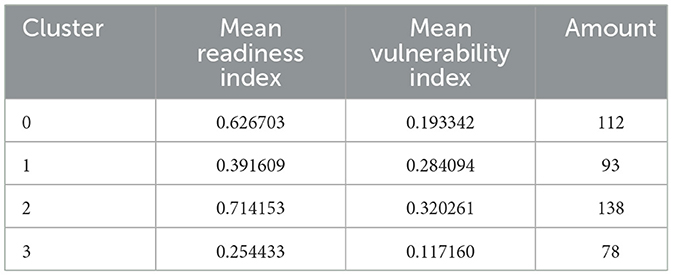
Table 3. Clustering results.
Drawing from the outcomes of prior cluster analyses, we mapped these discrepant cities based on their longitude and latitude, as depicted in Figure 5. Each point on the map symbolizes a city: orange points denote cities with high vulnerability and low readiness, while green dots highlight those with high readiness and low vulnerability. Notably, cities exhibiting high readiness and low vulnerability are predominantly found in Europe. In contrast, cities characterized by high vulnerability and low readiness are largely clustered in Africa, South America, and certain regions of North America.
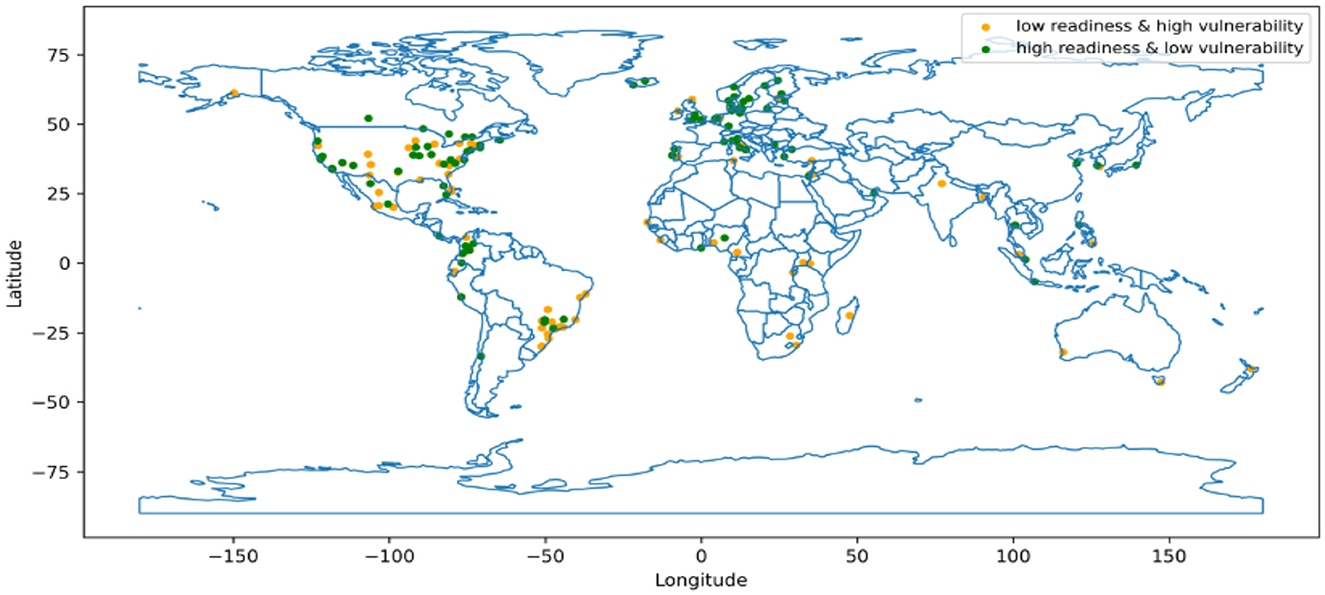
Figure 5. Distribution of discrepant cities.
Through spatial autocorrelation analysis, we obtained a Moran's I index of 0.63. This indicates that the discrepancy score exhibits a significant spatial correlation, which indicates regions with higher or lower discrepancy scores exhibit a clustered distribution. It is appropriate for applying the GWR model (Lin and Wen, 2011). Table 4 shows the final parameters in the GWR models. The model goodness-of-fit reaches 0.537. These results indicate that the GWR model can effectively explain the local variations in the impact of the economy on the discrepancy scores.

Table 4. Estimation parameters of the GWR models for discrepancy score.
As shown in Figure 6, there is indeed spatial variability in the economic impact on discrepancy scores. In the most European cities and some south American cities, the economy has a positive effective impact on the discrepancy of vulnerability and adaptation readiness and this impact is greater than that on other regions. This suggests that economic growth in these areas is particularly effective in enhancing the city's adaptation readiness and reducing vulnerability. It is noteworthy that in the African region, the local regression coefficients also show relatively high positive values, but since the difference scores in the African region are mostly negative, this indicates that in these areas, lower economic levels lead to vulnerability far exceeding the adaptation readiness, manifesting as an adaptation deficit. Besides, the impact of the economy on the discrepancy scores is not so evident in other regions.
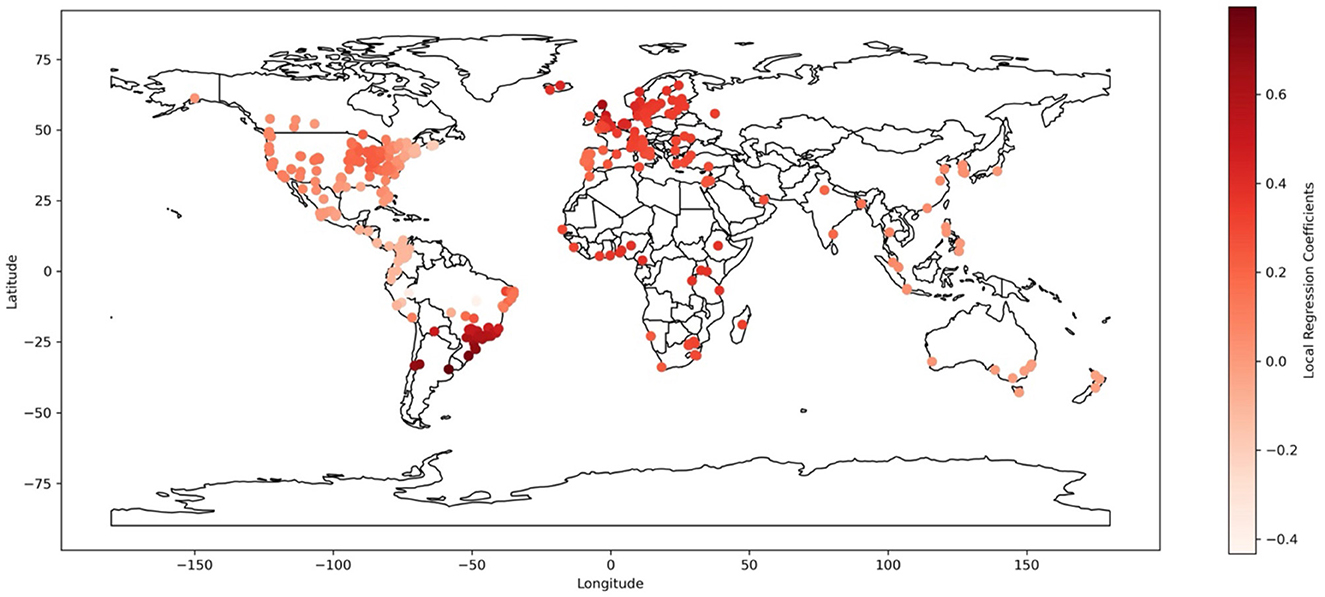
Figure 6. Local regression coefficients.
Climate change is exerting its impact on urban areas and populations across the world (Abbass et al., 2022). The escalation of global warming heightens the likelihood of extreme weather events, leading to disruptions in ecosystems, agricultural production, public health, and water management systems, profoundly affecting human habitat. Amid this overarching ecological crisis, diverse demographics experience consequences attributed to distinct physical environments and socio-economic circumstances (Hamidi et al., 2020). Similar dynamics apply to cities, where variations in geographical contexts and economic statuses result in divergent susceptibility to the detrimental effects of climate change and differing readiness. It is essential to address the discrepancy among cities in terms of their vulnerability to climate change and their adaptation readiness. Our research not only makes a theoretical contribution to the understanding of global climate change, but also has certain practical significance. It provides data support for formulating more effective strategies to address climate change and a basis for promoting cooperation and action on a global scale. Policy implementers need to adopt flexible and forward-looking strategies, based on scientific data and local conditions, through cross-sectoral cooperation and public participation, to enhance the city's adaptability and resilience.
However, it should be noted here that climate change is a highly complex issue. It is not merely an environmental issue, but a complex problem involving multiple aspects, including the interactions of social, economic, political, cultural, and ecological systems. We acknowledge that the complexity and uncertainty inherent in urban systems far exceed the simplifications made by our model. As highlighted by numerous studies, risks and vulnerabilities are nested and interconnected across sectors, manifesting as cascading effects that span spatial and temporal scales, revealing the profound complexity of coupled socio-ecological systems (Adger et al., 2009). When considering urban planning and climate change adaptation strategies, this complexity and uncertainty cannot be overlooked. For instance, adaptation measures in one sector might have unforeseen repercussions in another, reflecting the intricate interdependencies within urban systems (Eakin and Luers, 2006). Moreover, the dynamic nature of socio-ecological systems compounds the challenge of predicting future trends, increasing the uncertainty in formulating effective adaptation strategies. When considering urban planning and climate change adaptation strategies, this complexity and uncertainty cannot be overlooked. For instance, adaptation measures in one sector might have unforeseen repercussions in another, reflecting the intricate interdependencies within urban systems. Moreover, the dynamic nature of socio-ecological systems compounds the challenge of predicting future trends, increasing the uncertainty in formulating effective adaptation strategies. Thus, our study underscores the importance of systemic thinking in developing urban climate change adaptation strategies. This requires policymakers, planners, and researchers to not only focus on individual risks or vulnerabilities but to consider the interactions and feedback loops within the urban system comprehensively. For example, cross-sectoral collaboration and integrated management can better identify and mitigate potential cascading effects, enhancing the overall resilience of cities. Given this complexity and uncertainty, adopting scenario-based planning approaches might be more appropriate, exploring the effects of different adaptation measures across various potential future scenarios. Such approaches can help urban planners and decision-makers better prepare for an uncertain future, enhancing urban resilience through flexible and adaptive management strategies.
Finally, our study suggests that future research should delve deeper into the interactions and feedback mechanisms within urban systems and how these factors influence urban vulnerability and adaptive capacity in the context of climate change. In doing so, we can gain a more comprehensive understanding of the complexities faced by cities in addressing climate change challenges, providing a scientific basis for formulating more effective adaptation strategies.
The urgency of global climate change compels us to implement effective response measures. Despite some progress, there is a spatial discrepancy among cities in terms of their vulnerability to climate change and their adaptation readiness. As climate change intensifies, this spatial discrepancy could precipitate risks such as significant population migrations, resource competitions, and regional tensions. Addressing this spatial discrepancy is thus of paramount importance. To address this issue, we explored the spatial discrepancy among global cities in terms of their vulnerability to climate change and their adaptation readiness, using city response data from 2020 sourced from the Carbon Disclosure Project. Our research indicates that cities in Africa exhibit relatively higher vulnerability when compared to urban vulnerability indices in Europe and the Americas. Conversely, European cities tend to demonstrate a greater degree of readiness than their African counterparts. Economically, less-developed regions typically exhibit an adaptation deficit, whereas more-developed regions display an adaptation surplus, which further confirms the findings of previous research (Adom and Amoani, 2021; Saeed et al., 2023). More economically developed cities typically possess greater financial resources and technological capabilities (Saeed et al., 2023). This makes them more likely to allocate funds toward adaptive infrastructure, emergency response plans, and innovative technologies, thereby enhancing their readiness. We also conclude that economic factors play a significant role in the spatial discrepancies between levels of adaptation readiness and degrees of vulnerability in cities. Using geographically weighted regression, we found that the impact of the economy on the discrepancy scores shows significant spatial heterogeneity. Its influence is greater in European and African regions compared to other areas.
However, this study has specific limitations. Due to the uncertainty and complexity of climate change, we have not fully considered the complex relationships of the social-environmental system. Future research can develop more scientific and comprehensive models to address this issue.
The original contributions presented in the study are included in the article/supplementary material, further inquiries can be directed to the corresponding author.
YY: Conceptualization, Formal analysis, Methodology, Supervision, Visualization, Writing – original draft, Writing – review & editing, Data curation, Investigation. ZhZ: Writing – review & editing, Conceptualization, Investigation, Writing – original draft. ZuZ: Writing – original draft, Writing – review & editing. FM: Writing – review & editing, Project administration, Supervision, Validation.
The author(s) declare that no financial support was received for the research, authorship, and/or publication of this article.
The authors declare that the research was conducted in the absence of any commercial or financial relationships that could be construed as a potential conflict of interest.
All claims expressed in this article are solely those of the authors and do not necessarily represent those of their affiliated organizations, or those of the publisher, the editors and the reviewers. Any product that may be evaluated in this article, or claim that may be made by its manufacturer, is not guaranteed or endorsed by the publisher.
Abbass, K., Qasim, M. Z., Song, H., Murshed, M., Mahmood, H., and Younis, I. (2022). A review of the global climate change impacts, adaptation, and sustainable mitigation measures. Environ. Sci. Pollut. Res. 29, 42539–42559. doi: 10.1007/s11356-022-19718-6
Adger, W. N., Eakin, H., and Winkels, A. (2009). Nested and teleconnected vulnerabilities to environmental change. Front. Ecol. Environ. 7, 150–157. doi: 10.1890/070148
Adom, P. K., and Amoani, S. (2021). The role of climate adaptation readiness in economic growth and climate change relationship: an analysis of the output/income and productivity/institution channels. J. Environ. Manage. 293:112923. doi: 10.1016/j.jenvman.2021.112923
Allen Consulting (2005). Climate Change Risk and Vulnerability: Promoting an Efficient Adaptation Response in Australia. Canberra: Australian Greenhouse Office.
Amegavi, G. B., Langnel, Z., Ofori, J. J. Y., and Ofori, D. R. (2021). The impact of adaptation on climate vulnerability: is readiness relevant? Sustain. Cities Soc. 75:103325. doi: 10.1016/j.scs.2021.103325
Azócar, G., Billi, M., Calvo, R., Huneeus, N., Lagos, M., Sapiains, R., et al. (2021). Climate change perception, vulnerability, and readiness: inter-country variability and emerging patterns in Latin America. J. Environ. Stud. Sci. 11, 23–36. doi: 10.1007/s13412-020-00639-0
Bedeke, S. B. (2023). Climate change vulnerability and adaptation of crop producers in sub-Saharan Africa: a review on concepts, approaches and methods. Environ. Dev. Sustain. 25, 1017–1051. doi: 10.1007/s10668-022-02118-8
Biermann, F., and Pattberg, P. (2008). Global environmental governance: taking stock, moving forward. Annu. Rev. Environ. Resour. 33, 277–294. doi: 10.1146/annurev.environ.33.050707.085733
Binita, K., Shepherd, J. M., and Gaither, C. J. (2015). Climate change vulnerability assessment in Georgia. Appl. Geograp. 62, 62–74. doi: 10.1016/j.apgeog.2015.04.007
Birchall, S. J., Bonnett, N., and Kehler, S. (2023). The influence of governance structure on local resilience: enabling and constraining factors for climate change adaptation in practice. Urban Clim. 47:101348. doi: 10.1016/j.uclim.2022.101348
Blekking, J., Giroux, S., Waldman, K., Battersby, J., Tuholske, C., Robeson, S. M., et al. (2022). The impacts of climate change and urbanization on food retailers in urban sub-Saharan Africa. Curr. Opin. Environ. Sustain. 55:101169. doi: 10.1016/j.cosust.2022.101169
Chen, C., Noble, I., Hellmann, J., Coffee, J., Murillo, M., and Chawla, N. (2015). University of Notre Dame Global Adaptation Index. South Bend: University of Notre Dame.
de Sherbinin, A., and Bardy, G. (2015). Social vulnerability to floods in two coastal megacities: New York City and Mumbai. Vienna Yearb. Popul. Res. 13, 131–165. doi: 10.1553/populationyearbook2015s131
De Sherbinin, A., Schiller, A., and Pulsipher, A. (2012). “The vulnerability of global cities to climate hazards,” in Adapting Cities to Climate Change, eds J. Bicknell, D. Dodman, and D. Satterthwaite (London: Routledge), 129–157.
Dormann, C. F. (2007). Effects of incorporating spatial autocorrelation into the analysis of species distribution data. Glob. Ecol. Biogeogr. 16, 129–138. doi: 10.1111/j.1466-8238.2006.00279.x
Eakin, H., and Luers, A. L. (2006). Assessing the vulnerability of social-environmental systems. Annu. Rev. Environ. Resour. 31, 365–394. doi: 10.1146/annurev.energy.30.050504.144352
Eriksen, S., Schipper, E. L. F., Scoville-Simonds, M., Vincent, K., Adam, H. N., Brooks, N., et al. (2021). Adaptation interventions and their effect on vulnerability in developing countries: help, hindrance or irrelevance? World Dev. 141:105383. doi: 10.1016/j.worlddev.2020.105383
Fellmann, T. (2012). The assessment of climate change-related vulnerability in the agricultural sector: reviewing conceptual frameworks. Build. Resil. Adapt. Clim. Change Agric. Sect. 23:37.
Ford, J. D., and King, D. (2015). A framework for examining adaptation readiness. Mitigat. Adapt. Strat. Glob. Change 20, 505–526. doi: 10.1007/s11027-013-9505-8
Francini, M., Chieffallo, L., Palermo, A., and Viapiana, M. F. (2020). A method for the definition of local vulnerability domains to climate change and relate mapping. Two case studies in Southern Italy. Sustainability 12:9454. doi: 10.3390/su12229454
Füssel, H.-M., and Klein, R. J. (2006). Climate change vulnerability assessments: an evolution of conceptual thinking. Clim. Change 75, 301–329. doi: 10.1007/s10584-006-0329-3
Grafakos, S., Viero, G., Reckien, D., Trigg, K., Viguie, V., Sudmant, A., et al. (2020). Integration of mitigation and adaptation in urban climate change action plans in Europe: A systematic assessment. Renew. Sustain. Energy Rev. 121:109623. doi: 10.1016/j.rser.2019.109623
Griffith, D. A. (2008). Spatial-filtering-based contributions to a critique of geographically weighted regression (GWR). Environ. Plann. A 40, 2751–2769. doi: 10.1068/a38218
Halkos, G., Skouloudis, A., Malesios, C., and Jones, N. (2020). A hierarchical multilevel approach in assessing factors explaining country-level climate change vulnerability. Sustainability 12:4438. doi: 10.3390/su12114438
Hamidi, A. R., Zeng, Z., and Khan, M. A. (2020). Household vulnerability to floods and cyclones in Khyber Pakhtunkhwa, Pakistan. Int. J. Disast. Risk Reduct. 46:101496. doi: 10.1016/j.ijdrr.2020.101496
Hu, X., Ma, C., Huang, P., and Guo, X. (2021). Ecological vulnerability assessment based on AHP-PSR method and analysis of its single parameter sensitivity and spatial autocorrelation for ecological protection–A case of Weifang City, China. Ecol. Indic. 125:107464. doi: 10.1016/j.ecolind.2021.107464
IPCC (2023). Climate Change 2023: Synthesis Report. Contribution of Working Groups I, II and III to the Sixth Assessment Report of the Intergovernmental Panel on Climate Change. Jinggangshan.
Islam, N., and Winkel, J. (2017). Climate Change and Social Inequality. New York, NY: United Nations.
Jordan, A., and Huitema, D. (2014). Innovations in Climate Policy: The Politics of Invention, Diffusion, and Evaluation, Vol. 23. London Taylor and Francis, 715–734.
Judd, M., Bond, N., and Horne, A. C. (2022). The challenge of setting “climate ready” ecological targets for environmental flow planning. Front. Environ. Sci. 10:21. doi: 10.3389/fenvs.2022.714877
Khan, A., and Amelie, V. (2015). Assessing climate change readiness in Seychelles: implications for ecosystem-based adaptation mainstreaming and marine spatial planning. Reg. Environ. Change 15, 721–733. doi: 10.1007/s10113-014-0662-4
Krellenberg, K., Welz, J., Link, F., and Barth, K. (2017). Urban vulnerability and the contribution of socio-environmental fragmentation: Theoretical and methodological pathways. Prog. Hum. Geogr. 41, 408–431. doi: 10.1177/0309132516645959
Leal Filho, W., Balogun, A.-L., Olayide, O. E., Azeiteiro, U. M., Ayal, D. Y., Muñoz, P. D. C., et al. (2019). Assessing the impacts of climate change in cities and their adaptive capacity: Towards transformative approaches to climate change adaptation and poverty reduction in urban areas in a set of developing countries. Sci. Total Environ. 692, 1175–1190. doi: 10.1016/j.scitotenv.2019.07.227
Leary, N., Dokken, D., White, K., and Berger, A. (2001). Climate change 2001: impacts, adaptation, and vulnerability. Intergovern. Panel Clim. Change 301–305.
Li, D., Huang, M., Ren, S., Chen, X., and Ning, L. (2018). Environmental legitimacy, green innovation, and corporate carbon disclosure: evidence from CDP China 100. J. Bus. Ethics 150, 1089–1104. doi: 10.1007/s10551-016-3187-6
Li, N., Shi, B., Wu, L., Kang, R., and Gao, Q. (2022). Climate-related development finance, energy structure transformation and carbon emissions reduction: an analysis from the perspective of developing countries. Front. Environ. Sci. 9:778254. doi: 10.3389/fenvs.2021.778254
Likas, A., Vlassis, N., and Verbeek, J. J. (2003). The global k-means clustering algorithm. Pattern Recognit. 36, 451–461. doi: 10.1016/S0031-3203(02)00060-2
Lin, C.-H., and Wen, T.-H. (2011). Using geographically weighted regression (GWR) to explore spatial varying relationships of immature mosquitoes and human densities with the incidence of dengue. Int. J. Environ. Res. Public Health 8, 2798–2815. doi: 10.3390/ijerph8072798
Linares, C., Díaz, J., Negev, M., Martínez, G. S., Debono, R., and Paz, S. (2020). Impacts of climate change on the public health of the Mediterranean Basin population-current situation, projections, preparedness and adaptation. Environ. Res. 182:109107. doi: 10.1016/j.envres.2019.109107
Luers, A. L., Lobell, D. B., Sklar, L. S., Addams, C. L., and Matson, P. A. (2003). A method for quantifying vulnerability, applied to the agricultural system of the Yaqui Valley, Mexico. Glob. Environ. Change 13, 255–267. doi: 10.1016/S0959-3780(03)00054-2
Luo, L., Lan, Y. C., and Tang, Q. (2012). Corporate incentives to disclose carbon information: evidence from the CDP Global 500 report. J. Int. Finan. Manag. Account. 23, 93–120. doi: 10.1111/j.1467-646X.2012.01055.x
Markantonis, V., Reynaud, A., Karabulut, A., El Hajj, R., Altinbilek, D., Awad, I. M., et al. (2019). Can the implementation of the water-energy-food nexus support economic growth in the Mediterranean region? The current status and the way forward. Front. Environ. Sci. 7:84. doi: 10.3389/fenvs.2019.00084
Mathur, M. (2015). Spatial autocorrelation analysis in plant population: an overview. J. Appl. Nat. Sci. 7, 501–513. doi: 10.31018/jans.v7i1.639
Na, S., Xumin, L., and Yong, G. (2010). “Research on k-means clustering algorithm: an improved k-means clustering algorithm,” in 2010 Third International Symposium on Intelligent Information Technology and Security Informatics (Geneva), 63–67.
Nunn, P. D., Smith, T. F., and Elrick-Barr, C. (2021). Path dependency and future adaptation of coastal cities: examples from the Asia-Pacific. Front. Environ. Sci. 359:642385. doi: 10.3389/fenvs.2021.642385
Onyeneke, R. U., Osuji, E. E., Anugwa, I. Q., and Chidiebere-Mark, N. M. (2023). Impacts of biocapacity, climate change, food vulnerability, readiness and adaptive capacity on cereal crops yield: Evidence from Africa. Environ. Dev. Sustain. 25, 1–25. doi: 10.1007/s10668-023-03615-0
Otto, A., Göpfert, C., and Thieken, A. H. (2021). Are cities prepared for climate change? An analysis of adaptation readiness in 104 German cities. Mitigat. Adapt. Strat. Glob. Change 26:35. doi: 10.1007/s11027-021-09971-4
Perch-Nielsen, S. B., Bättig, M., and Imboden, D. (2008). Exploring the link between climate change and migration. Clim. Change 91, 375–393. doi: 10.1007/s10584-008-9416-y
Piao, S., and Wang, X. (2023). Biological systems under climate change: what do we learn from the IPCC AR6. Glob. Chang. Biol. 29, 5120–5121. doi: 10.1111/gcb.16857
Pourghasemi, H. R., Gayen, A., Panahi, M., Rezaie, F., and Blaschke, T. (2019). Multi-hazard probability assessment and mapping in Iran. Sci. Total Environ. 692, 556–571. doi: 10.1016/j.scitotenv.2019.07.203
Rahman, H. T., and Hickey, G. M. (2019). What does autonomous adaptation to climate change have to teach public policy and planning about avoiding the risks of maladaptation in Bangladesh? Front. Environ. Sci. 7:2. doi: 10.3389/fenvs.2019.00002
Ready, E., and Collings, P. (2021). “All the problems in the community are multifaceted and related to each other”: inuit concerns in an era of climate change. Am. J. Hum. Biol. 33, e23516. doi: 10.1002/ajhb.23516
Rickards, L., Wiseman, J., and Kashima, Y. (2014). Barriers to effective climate change mitigation: the case of senior government and business decision makers. Wiley Interdiscip. Rev. Clim. Change 5, 753–773. doi: 10.1002/wcc.305
Romero-Lankao, P., Gnatz, D. M., Wilhelmi, O., and Hayden, M. (2016). Urban sustainability and resilience: from theory to practice. Sustainability 8:1224. doi: 10.3390/su8121224
Saeed, S., Makhdum, M. S. A., Anwar, S., and Yaseen, M. R. (2023). Climate change vulnerability, adaptation, and feedback hypothesis: a comparison of lower-middle, upper-middle, and high-income countries. Sustainability 15:4145. doi: 10.3390/su15054145
Sarkodie, S. A., Ahmed, M. Y., and Owusu, P. A. (2022). Global adaptation readiness and income mitigate sectoral climate change vulnerabilities. Human. Soc. Sci. Commun. 9, 11–17. doi: 10.1057/s41599-022-01130-7
Sarkodie, S. A., and Strezov, V. (2019). Economic, social and governance adaptation readiness for mitigation of climate change vulnerability: evidence from 192 countries. Sci. Total Environ. 656, 150–164. doi: 10.1016/j.scitotenv.2018.11.349
Schipper, E. L. F. (2006). Conceptual history of adaptation in the UNFCCC process. Rev. Eur. Commun. Int. Environ. Law 15, 82–92. doi: 10.1111/j.1467-9388.2006.00501.x
Schneider, S., Sarukhan, J., Adejuwon, J., Azar, C., Baethgen, W., Hope, C., et al. (2001). Overview of impacts, adaptation, and vulnerability to climate change. Clim. Change 75–103.
Smit, B., and Wandel, J. (2006). Adaptation, adaptive capacity and vulnerability. Glob. Environ. Change 16, 282–292. doi: 10.1016/j.gloenvcha.2006.03.008
Swart, R., Biesbroek, R., and Lourenço, T. C. (2014). Science of adaptation to climate change and science for adaptation. Front. Environ. Sci. 2:29. doi: 10.3389/fenvs.2014.00029
Syakur, M. A., Khotimah, B. K., Rochman, E. M. S., and Satoto, B. D. (2018). “Integration k-means clustering method and elbow method for identification of the best customer profile cluster,” in IOP Conference Series: Materials Science and Engineering, Vol. 336 (Bristol: IOP Publishing), 012017.
Tournebize, R., Borner, L., Manel, S., Meynard, C. N., Vigouroux, Y., Crouzillat, D., et al. (2022). Ecological and genomic vulnerability to climate change across native populations of Robusta coffee (Coffea canephora). Glob. Change Biol. 28, 4124–4142. doi: 10.1111/gcb.16191
Tran, P. T., Vu, B. T., Ngo, S. T., Tran, V. D., and Ho, T. D. (2022). Climate change and livelihood vulnerability of the rice farmers in the North Central Region of Vietnam: a case study in Nghe An province, Vietnam. Environ. Challeng. 7:100460. doi: 10.1016/j.envc.2022.100460
Truong, D. D., Dat, T. T., Hang, N. D., and Huan, L. H. (2022). Vulnerability assessment of climate change in Vietnam: a case study of Binh Chanh District, Ho Chi Minh City. Front. Environ. Sci. 10:880254. doi: 10.3389/fenvs.2022.880254
Vittersø, J., Røysamb, E., and Diener, E. (2002). The Concept of Life Satisfaction Across Cultures: Exploring Its Diverse Meaning and Relation to Economic Wealth. The Universality of Subjective Wellbeing Indicators: A Multi-disciplinary and Multi-national Perspective (Boston, MA: Kluwer Academic Publishers), 81–103.
Wang, J., Zhou, W., Pickett, S. T., Yu, W., and Li, W. (2019). A multiscale analysis of urbanization effects on ecosystem services supply in an urban megaregion. Sci. Total Environ. 662, 824–833. doi: 10.1016/j.scitotenv.2019.01.260
Zahran, S., Brody, S. D., Grover, H., and Vedlitz, A. (2006). Climate change vulnerability and policy support. Soc. Nat. Resour. 19, 771–789. doi: 10.1080/08941920600835528
Zhang, Q., Yuan, R., Singh, V. P., Xu, C.-Y., Fan, K., Shen, Z., et al. (2022). Dynamic vulnerability of ecological systems to climate changes across the Qinghai-Tibet Plateau, China. Ecol. Indic. 134:108483. doi: 10.1016/j.ecolind.2021.108483
Zhang, Y., Pan, C.-L., and Liao, H.-T. (2021). Carbon neutrality policies and technologies: a scientometric analysis of social science disciplines. Front. Environ. Sci. 9:761736. doi: 10.3389/fenvs.2021.761736
Zhu, C., Zhang, X., Zhou, M., He, S., Gan, M., Yang, L., et al. (2020). Impacts of urbanization and landscape pattern on habitat quality using OLS and GWR models in Hangzhou, China. Ecol. Indic. 117, 106654. doi: 10.1016/j.ecolind.2020.106654
Keywords: climate change, vulnerability, readiness, adaptation, spatial discrepancy
Citation: Yao Y, Zhang Z, Zhang Z and Meng F (2024) Are cities ready for climate change? Exploring the spatial discrepancies between urban vulnerability and adaptation readiness. Front. Clim. 6:1293651. doi: 10.3389/fclim.2024.1293651
Received: 13 September 2023; Accepted: 15 February 2024;
Published: 29 February 2024.
Edited by:
Pau Chung Leng, University of Technology Malaysia, MalaysiaReviewed by:
Gabriel Hoh Teck Ling, University of Technology Malaysia, MalaysiaCopyright © 2024 Yao, Zhang, Zhang and Meng. This is an open-access article distributed under the terms of the Creative Commons Attribution License (CC BY). The use, distribution or reproduction in other forums is permitted, provided the original author(s) and the copyright owner(s) are credited and that the original publication in this journal is cited, in accordance with accepted academic practice. No use, distribution or reproduction is permitted which does not comply with these terms.
*Correspondence: Fan Meng, NzE5NDI5MjA1QHFxLmNvbQ==
Disclaimer: All claims expressed in this article are solely those of the authors and do not necessarily represent those of their affiliated organizations, or those of the publisher, the editors and the reviewers. Any product that may be evaluated in this article or claim that may be made by its manufacturer is not guaranteed or endorsed by the publisher.
Research integrity at Frontiers
Learn more about the work of our research integrity team to safeguard the quality of each article we publish.