 Tomohiro Kinoshita
 Taira Ozaki
95% of researchers rate our articles as excellent or good
Learn more about the work of our research integrity team to safeguard the quality of each article we publish.
Find out more
ORIGINAL RESEARCH article
Front. Clim. , 14 March 2024
Sec. Climate Adaptation
Volume 6 - 2024 | https://doi.org/10.3389/fclim.2024.1287386
This article is part of the Research Topic Climate Change Mitigation and Adaptation Policies in Local Communities View all 8 articles
Introduction: The objectives of this study are twofold. The first is to identify potential green infrastructure construction sites by building rooftops and sidewalks. The second is to analyze internal flooding for a wide range of drainage areas and to quantitatively evaluate the effectiveness of stormwater runoff control.
Methods: The target area has approximately 600 ha with a runoff coefficient of 0.71. Using Arc GIS Desktop 10.8.1, this study has identified green roofs and bioswales that would be highly beneficial in capturing large amounts of rainfall. In addition, Info Works ICM was used for the inundation analysis, which can simultaneously calculate the flow in sewer pipelines and above-ground inundation flow. Runoff coefficients were calculated for each land use using the urban land use subdivision mesh data with 100 m unit. This study targeted a 10-year probability rainfall (total rainfall: 86.3 mm, maximum hourly rainfall: 52.3 mm/h, duration: 3 h) with a middle concentrated rainfall waveform obtained from past experiments in the d4PDF database of ensemble climate prediction contributing to global warming.
Results: The amount of land availability for green roofs and bioswales was about 1 and 0.1% of the drainage area, respectively. The runoff coefficients for green roofs only, bioswales only, with and without introduction of both green roofs and bioswales were 70.34, 70.87, 70.28, and 70.93%, respectively. The difference in runoff coefficients was about 0.65 percentage points even when both were constructed. As a result of inundation analysis, the reduction was 2.5% for the maximum waterlogged area, 1.5% for the flooded area, and 0.7% for the average depth of waterlogging divided by the maximum waterlogged area. The construction of green roofs and bioswales in the same area or downstream of the area shows little mitigation effect when flooding occurs in an area near the downstream end of the sewer network.
Discussion: Although this study has mainly discussed the stormwater runoff control aspect, the most important feature of green infrastructure is its multifunctionality. In terms of utilizing and promoting green infrastructure, it is important to visualize its multifaceted effects and share them with many stakeholders.
The Sixth Assessment Report of the Intergovernmental Panel on Climate Change (IPCC) outlines that climate change will increase in all regions of the globe over the coming decades and that even with 1.5 °C of global warming, there will be increasing heat waves, longer warm seasons, and shorter cold seasons – which will become more intense at 2 °C of warming. It is predicted with a high degree of confidence that the probability of compound flooding (storm surges, extreme rainfall, and/or river flow) will continue to increase due to both sea-level rise and increases in heavy precipitation, including changes in precipitation intensity associated with tropical cyclones (Delmotte and Zhai, 2022). Several events have already been observed and heavily studied, such as, extreme rainfall events in the United Kingdom, heatwaves in Australia (National Climate Change Adaptation Research Facility, 2019), and Hurricane Harvey that hit Texas (National Weather Services, 2017).
In Japan, the annual frequency of rainfall events of 50 mm or more per hour has increased 1.5-fold in less than 50 years (226 events between 1976 and 1985, and 334 events between 2011 and 2020) (Japan Meteorological Agency, 2020). Based on this trend, rainfall of 50 mm or more per hour is expected to increase in the future.
Rainwater infiltrating into the ground and the increasing amount of water flowing into the sewage system increase the risk of internal flooding. The increase in impervious surfaces due to urbanization prevents rainwater from infiltrating into the ground, increasing the amount of water flowing into the sewers and increasing the risk of internal flooding. In addition, combined sewer overflows, which are a challenge to urban water issues, have resulted in water quality degradation and water environment degradation (Ogasawara et al., 2018).
In Europe and the United States, green infrastructure has been introduced as a stormwater management approach to mitigate urban flooding and additional runoff from areal pollution sources (American Rivers et al., 2008). The United States Environmental Protection Agency’s website introduces elemental technologies, including rain gardens, permeable pavement, bioswales and green roofs (United States Environmental Protection Agencies, 2023). In New York, runoff control measures were changed from conventional sewer maintenance to green infrastructure. The reason is that it is inexpensive, attractive to the landscape, quick to install, and can be installed various spaces such as streets, parking lots, and rooftops of houses (New York City Environmental Protection, 2010).
In the City of Portland, thousands of green streets are spread out like a web, spreading small green infrastructure throughout the city. Its unique feature is the use of green infrastructure to design a series of processes for rainfall on the ground to runoff downstream, combining sustainable management with green space. So far, individual green infrastructures have been developed, such as green roofs with temporary rainwater storage and infiltration functions, rain gardens, 1,600 green streets, green parking lots, and playgrounds in parks. In recent years, the number of green infrastructure projects at the city block scale has increased (Fukuoka, 2019).
In Japan, the publication of “Recommendations for the Use of Ecological Infrastructure in Reconstruction and National Land Resilience” triggered the launch of a research project on green infrastructure, consisting of researchers from diverse fields including civil engineering, architecture, landscape architecture, and economics. Research on a wide range of topics, including functional evaluation of green infrastructure, construction technology, and maintenance and management methods, is being conducted under a cross-disciplinary structure (Science Council of Japan, 2014).
In 2019, the Ministry of Land, Infrastructure, Transport and Tourism (MLIT) of Japan released the “Green Infrastructure Promotion Strategy,” which outlines specific measures and strategic directions toward green infrastructure for society [Ministry of Land, Infrastructure, Transport and Tourism (MLIT), 2019]. In 2020, the concept of basin-based flood control was born to enhance local disaster prevention and mitigation capabilities on a basin-by-basin basis and laws related to this concept were enacted and revised [Ministry of Land, Infrastructure, Transport and Tourism (MLIT), 2020]. In Japan, the concept of “River Basin Disaster Resilience and Sustainability by All (RBDRSA)” was developed and related laws were enacted and revised. RBDRSA is a measure in which all parties concerned, including the national government, local governments, businesses, and residents, cooperate in flood control efforts from a bird’s-eye view of the entire basin of the main river and its tributaries. These laws include strengthening rainwater harvesting measures in watersheds as one of the ways to prevent flooding. Green infrastructure with storage and infiltration functions has been the focus as one of the means to achieve this flood prevention.
This study defines green infrastructure as a concept for infrastructure development and land management through the wise use of nature’s diverse functions and supple resilience (Green Infrastructure Association, 2021). Green infrastructure supports various ecosystem functions for human socioeconomic activities, such as forest sediment runoff control, rainwater storage, recreational functions, wetland water recreation, and water purification skills.
Among these multifaceted functions, in Japan, efforts to address natural disasters beyond the expected scale, such as heavy rainfall disasters or stagnation of local communities and economies due to population decline are attracting attention (Nishida, 2019). Particularly in urban areas, the introduction of green infrastructure into urban areas is required to convert impervious surfaces into pervious surfaces and allow rainwater to soak into the ground, thereby contributing to the control of rainwater runoff.
This study has two objectives. The first is to identify potential green infrastructure construction sites by building rooftops and sidewalks. The second is to analyze internal flooding for a wide range of drainage areas and to quantitatively evaluate the effectiveness of stormwater runoff control.
There are many national and international studies on green infrastructure and nature-based solutions. Although the research foci are diverse, from the perspective of stormwater runoff control and flood prevention; studies targeting green infrastructure can be broadly categorized into three main areas. The main categories can be further divided into two or three sub categories. Typical previous studies in recent years are summarized as below.
Ebrahimian et al. (2019) investigates the role of evapotranspiration (ET) in runoff volume reduction of green roofs and rain gardens through a comprehensive literature review. To improve vegetated green stormwater infrastructure designs for runoff volume reduction, it was noted that the design methods should consider ET and infiltration processes concurrently.
Zheng et al. (2021) applied a statistical approach on a dataset of 2,375 original experimental samples associated with the runoff retention (RR) performance of green roofs observed across 21 countries, consolidated from 75 internationally peer-reviewed studies published from 2005–2020. The results show that the sampled RR rates (i.e., the proportion of rainfall retained on a per-event basis) range widely (0–100%), with an average of 62%. Rainfall intensity, substrate depth, green roofs surface coverage, climate type, vegetation type, and season type partially explain the variances in retention performance.
Vainik et al. (2022) used a synthesis approach to compile available information about urban stormwater retention capacity of the most common sustainable urban drainage systems (SUDS) in different climatic conditions. Those SUDS targeting stormwater management through water retention and removal solutions (mainly by infiltration, overland flow, and evapotranspiration), were addressed in that study. Selected SUDS were green roofs, bioretention systems (i.e., rain gardens), buffer and filter strips, vegetated swales, constructed wetlands, and water-pervious pavements.
Mobilia and Longobardi (2020) defined the accuracy of the three selected models for the simulation of the hydrological behavior of green roofs, particularly focusing on the precipitation pattern characteristics. The Nash cascade model, Storm Water Management Model (SWMM), and HYDRUS-1D models were selected and each model was calibrated over 24 rainfall-runoff events collected at the experimental site located in Southern Italy. As a result, SWMM and HYDRUS -1D models predicted with higher accuracy in the convective events while the Nash model appeared more suitable for stratiform events.
Kim et al. (2021) simulated the rainfall-runoff relationship within the green roof system by using the SEEP/W model and is verified the applicability of this model. That study simulated the green roof system by varying four factors (soil type, rainfall intensity, substrate depth, and green roof slope) to explore the hydrological performance through the peak discharge to rainfall intensity ratio and the rain water retention rate. The results showed that the SEEP/W model presents slightly faster and greater peak time and peak discharge values, respectively, as compared to the observational data and can be used to design green roof systems and evaluate their hydrological behavior because of its modeling efficiency.
Brunetti et al. (2020) provided a Bayesian comprehensive perspective of green roofs hydrological modeling, which includes a statistically rigorous Bayesian comparison of one conceptual and multiple Richards-based mechanistic green roofs models, and a probability assessment of the information content of different observations. The analysis of the marginal likelihoods revealed that the conceptual and the unimodal van Genuchten e Mualem models are the most appropriate parameterizations and that further layers of model complexity are not fully supported by the measurements.
Abdalla et al. (2021) examined the potential of using machine learning (ML) to simulate runoff from green roofs to estimate their hydrological performance. Four machine learning methods; artificial neural network (ANN), M5 model tree, long short-term memory (LSTM), and k nearest neighbor (kNN) were applied to simulate storm-water runoff from sixteen extensive green roofs located in four Norwegian cities across different climatic zones. The ML models yielded low volumetric errors that were comparable with the conceptual retention models, which indicates good performance in estimating annual retention. It was also shown that the variations in ML models’ performance between the cities was larger than that of the different configurations, which was attributed to the different climatic characteristics between the four cities.
Pirouz et al. (2021) proposed a new multipurpose green roof combined with fog and dew harvesting systems in order to improve the efficiency of conventional green roofs. It was shown that fog harvesting could provide the total water requirement of the green roofs, and that dew harvesting by photo-voltaic panels could provide 15 to 26% of the water requirements. The result suggested that the new green roof has a higher efficiency in stormwater management and less dependent on the urban water network.
Liu et al. (2020) analyzed the application potential of the green roof system (GRS) and the improved green roof system (IGRS) which were designed to divert overflowing water from green roofs to recharge groundwater in a densely developed city, Nanchang, China. The simulation results showed that GRS can retain about 41 to 75% of precipitation in a 2-h timescale and the flooding volumes in the GRS/IGRS region are 82 and 28% less than those of the traditional roof system in 10 and 100-year precipitation events, respectively.
Tan and Wang (2023) evaluated the effects of natural soils incorporated with two kinds of biochars (BC: prepared from agricultural waste biomass) on runoff retention capacity and roof thermal performance. Results indicated that the runoff reduction benefit of green roofs declines with the increase of rainfall. It was shown that adding BC into the substrates of green roofs also can achieve better hydrothermal properties, which is beneficial to the design optimization of green roofs.
Sahani et al. (2019) focused on three hydro meteorological hazards (HMHs), floods, droughts, and heatwaves, as well as their management by relevant nature-based solutions. Different methodologies related to the chosen HMHs were taken into the consideration with respect to exposure, vulnerability, and adaptation interaction of the elements at risk. Regarding flood risk assessment, two widely used methods are fuzzy logic (e.g., fuzzy analytic hierarchy process) and probabilistic methodology (e.g., univariate and multivariate probability distributions).
Tsatsou et al. (2023) explored eleven types of nature-based solutions that can contribute to circular systems for water reuse and resource recovery throughout cities in terms of their function, co-benefits, integration, and scaling-up in urban areas. Based on the scoping literature review of 68 peer-reviewed research articles, four key dimensions for the design and integration of circular water nature-based solutions in cities are identified: environmental technology, systems design, urban design, and urban planning.
Johnson et al. (2022) conducted a systematic review of systematic reviews on the topic of nature-based solutions for climate change adaptation (NBS-CCA), with the objective of mapping and analyzing these prior reviews. It was found that most of the prior systematic reviews had relatively narrow research focuses, typically focusing on a particular geographic context of NBS-CCA (mainly in urban and coastal areas) or on a particular aspect of NBS-CCA planning/implementation (mainly outcomes assessment and policy/governance issues).
Xu et al. (2023) conducts a review of urban stormwater management at meso-level (USM-M) with a view to research publication trends, citation analysis, geographic spread, and subject category, as well as content analysis, including temporal progression and research gaps. The Web of Science database and Cite Space are used for the bibliometric analysis of 66 articles from 2006 to 2021. The results showed that the number of USM-M topic articles generally had an upward trend over the years. The spatial layout optimization and multi-functional integration were suggested as potential research directions in terms of enhancing stormwater utilization and co-benefits of USM-M.
Kumar et al. (2021) integrated the knowledge of previous studies by reviewing and compiling the existing scientific literature on methods, including ground-based measurements (e.g., gauging stations and wireless sensor network) and remote sensing observations (e.g., from topographic LiDAR, multispectral, and radar sensors) that have been used and/or can be relevant to monitor the performance of nature-based solutions (NBS) against five hydro-meteorological risks (HMRs): floods, droughts, heatwaves, landslides, storm surges, and coastal erosion. It was found that the selection and application of monitoring methods mostly rely on the particular NBS being monitored, resource availability (e.g., time, budget, and space), and type of HMRs.
Jorgensen et al. (2022) investigated and broadened the discussion of nature-based climate adaptation for stormwater management and coastal flooding based on three Copenhagen cases of locally initiated innovative flagship projects and framed by governance & transition theory. The cases underscore the importance of nature awareness for the design of the project and the role of daily recreational users as crucial for project legitimacy.
Venter et al. (2021) explored the use of modern cloud computing technologies (Google Earth Engine) to facilitate public access to spatial multi-criteria decision analysis (MCDA) of ecosystem services from green infrastructure. Using the spatial prioritization of green roofs retrofitting in Oslo, Norway, as a case study, a web application which is a generalizable tool for engaging stakeholders in spatial planning of ecosystem restoration and NBS was presented. The application identified the relative importance of a suite of potential ecosystem services gained from retrofitting of green roofs, conditional on preference profiles expected by users of different building functional types. That study showed that the interactive spatial MCDA web application has potential when it comes to improving the planning process’ efficiency and in engaging stakeholders.
Sarwar and Alsaggaf (2020) obtained and analyzed the willingness and perception of residents of Lahore in Pakistan regarding the adaptation of green roof technology by a structured questionnaire and using statistical techniques. The result showed that an adaptation of green roofs is primarily linked with the four factors: (i) awareness of green roofs among all stakeholders, (ii) special provision in building regulation concerning green roofs, (iii) sustainable environmental consciousness, and (iv) subsidized cost of green roofs materials.
Kaur and Gupta (2022) developed a geospatial technology-based approach for the identification of blue-green infrastructure network by employing graph theory and gravity model for sustainable storm water management in the City of Ahmedabad, India. A replicable approach that integrates five key criteria (i.e., slope, drainage density, land cover, hydrologic soil group, and proximity to roads for suitability analysis), selecting core patches as nodes in a GIS environment, identifies corridors by employing the least cost path function followed by assessment of selected corridors using gravity model was introduced.
Rojas et al. (2022) analyzed the city model of an urban wetland in the Greater Concepcion area (Chile, South America), an area that has recently experienced urban sprawl. It was analyzed through the urban fabric and modelling of the urban variables of density, distance, roads, and green areas surrounding an inland wetlands. Then, accessibility to the wetland and its effect on plant composition using a biodiversity indicator was evaluated.
Pallathadka et al. (2021) explored the relationship between pluvial flood exposure and green infrastructure (GI) placement in three inland cities (Atlanta, Phoenix, and Portland) and analyzes the variation of sociodemographic variables in census block groups (CBG) located in pluvial flood zones. That study estimated areas of pluvial flooding in the CBGs by using the Arc-Malstrøm method and relating pluvial flood area to the density of GI in CBGs and assigning CBGs one of four classifications: (i) management, (ii) preparedness, (iii) vulnerability, and (iv) least concern and examined the proportionality of GI investment over time to pluvial flood area by using the historical GI data. It was found that relationships between GI density, flood area, ethnic and racial minority populations, age, educational attainment, and median household incomes that indicated inequalities and potential discrimination in flood risk management, but also some evidence of equitable and appropriate management given differences in flood risk.
Katagiri (2012) considered the current status and potential utilization of green networks, which can be viewed as an axis of irrigation and waterway networks that used to be the basis of production and livelihood in rural areas, utilizing river spaces as green infrastructure. Areas have been converted to roads, but open spaces with potential for use of green spaces were found to be “dead waterways,” “vacant lots,” and “assimilated into adjacent properties.”
Lama et al. (2021) evaluated the hydraulic efficiency of two green–blue scenarios in reducing flood hazards of an urban area crossed by a vegetated river located in Central Tuscany in Italy, named Morra Creek, for a return period of 200 years, by analyzing the flooding outcomes of 1D and 2D unsteady hydraulic simulations. It emerged that the first scenario (by considering an overall real-scale growth of common reed beds) is a valuable alternative to the more impactful second scenario (by preserving riverine vegetation and using a single vegetated flood control area), given the presence of a flood control area.
Arjenaki et al. (2021) simulated the collection network of surface runoff of Shahrekor, Iran in 2, 5, and 10-year return periods by using the SWMM. The results showed that green roofs, permeable pavement, and rain barrels reduced the volume and discharge peak runoff by 46, 21, and 25%, respectively, on average in the fourteen selected sub-catchments. It was concluded that increasing the rainfall period would increase the effectiveness of using these methods and the effect of using green roofs was greater than the alternatives.
Song et al. (2020) quantified the effects of urban green spaces (UGS) on surface runoff regulation and canopy interception capacity by using the modeling software i-Tree Hydro, in four simulated land-cover scenarios in the urban area, Luohe, China. It was shown that the existing UGS had a positive but limited contribution in runoff regulation, with similar responses in future scenarios with increased UGS coverage. As a result, the UGS had a relatively high interception performance under light and long duration rain events, but performed poorly under heavy and short rain events due to limited surface storage capacities.
Yao et al. (2015) simulated the stormwater mitigation performance of green roofs for twelve urbanized catchments in the built-up region of Beijing, China, which were assigned to different rainfall conditions by using a hydrological model. The results showed that the spatial variability of green roofs effected inherent influences on the runoff mitigation capacity in urbanized catchments.
Gao et al. (2018) analyzed the influence on the catchment outlet runoff because of the application of green roofs in the Calumet Drop Shaft-51 (CDS-51) catchment located in Dolton, Illinois in The United States, as a case using the model in two typical storms, considering different green roofs coverage ratios as well as runoff conditions. The results showed that green roofs have good water storage capacity, which can effectively decrease the catchment runoff in terms of peak discharge and volume.
Versini et al. (2015) developed a conceptual model and integrated it into the SWMM urban rainfall-runoff model to reproduce the hydrological behavior of two different types of green roofs based on observations on experimental green roofs. This methodology was applied to a long term series (18 years) to the Châtillon urban basin (Haut-de-Seine county, France) which has a history of frequently being affected by urban flooding. The results showed that green roofs, when they are widely implemented, can affect urban runoff in terms of peak discharge and volume, and avoid flooding in several cases.
Ogasawara et al. (2018) conducted an inundation simulation of the upper watershed of the Zempukuji River in Tokyo, Japan, and analyzed the effect of introducing green infrastructure, such as rain gardens that take advantage of soil infiltration capabilities, to urban areas in order to control stormwater runoff. It was assumed that the road pavement would be converted to permeable pavement and the planting strips would be converted to previous ones to infiltrate surface runoff. After the introduction of green infrastructure, the infiltration area was reduced to about 10%, the maximum flooding depth was generally less than 20 cm, and the total amount of flooding was reduced by 98%.
Iida et al. (2015) conducted a simulation analysis using a combined internal and external water inundation model for the upper Kanda River basin, assuming three scenarios: the current state of green spaces, a scenario with reduced green spaces, and a scenario with created green spaces. The scenario that reduced the amount of green spaces on privately owned land resulted in a 0.8-fold decrease in rainwater infiltration and a 1.2-fold increase in flooded area, while the scenario that created green spaces on both privately and publicly owned land resulted in a 1.3-fold increase in rainwater infiltration and a 0.7-fold decrease in flooded area. The study quantitatively showed that the creation of urban green spaces is effective in increasing rainwater infiltration and reducing internal flooding and clarified that the creation of green spaces on private land as well as on public land plays an important role in watershed protection.
Kajikawa et al. (2020) analyzed the effect of using sidewalk space as green infrastructure to control stormwater runoff. They estimated the amount of rainwater runoff by installing a water level gauge on a rainwater storage and infiltration infrastructure under a sidewalk in Toda City, Saitama Prefecture. The introduction of this infrastructure reduced the annual runoff of rainwater flowing into the combined sewer system by 94.7% and was found to be effective in controlling the maximum rainfall of 51 mm/h. The results showed that the introduction of the infrastructure was effective in controlling rainwater flow into the combined sewer system.
Ishimatsu (2020) visualized potential rain garden construction sites using GIS, Google map aerial photographs, and evaluation indicators such as elevation, slope, and groundwater level for the delta urban area of Hiroshima City. Yamada and Shibata (2017) quantitatively evaluated the rainfall-runoff effect of a rain garden in Kyoto Gakuen University’s Uzumasa campus, using the storage infiltration rate and runoff rate as indicators.
Many previous studies have conducted urban pluvial flooding analysis and evaluated the effectiveness of green infrastructure implementation in terms of runoff control effects. Previous studies have evaluated the performance of green infrastructure using elevation, slope, and runoff rate as indicators, but they did not distinguish the type of green infrastructure. In addition, very few of the studies that analyzed potential sites for green infrastructure implementation set their targets over a wide area, with the exception of Versini et al. (2015), who analyzed hydrologic effects at both basin and building roofs scales and Iida et al. (2015), who examined different scenarios for increasing and decreasing green spaces, with most covering a small area.
This study is positioned in categories 2.3.2 in the third typology because it sets up a certain target area, conducts a case study, and performs a spatial analysis of the effects of green infrastructure on stormwater runoff control. In Japan, water-related disasters occur every year. The unique feature of this study is that it distinguishes between different types of green infrastructure as well as targets a relatively wide area (several hundred hectares) to identify candidate sites for their introduction and analyze their effectiveness in reducing rainwater runoff.
This study targets Osho Drainage District in Amagasaki City, Hyogo Prefecture, Japan. Osho Drainage District has two national roads and railroads and is a residential area with convenient transportation (Figure 1). It has an area of approximately 600 ha and a runoff coefficient of 0.71, in which pumps are used to remove rainwater.
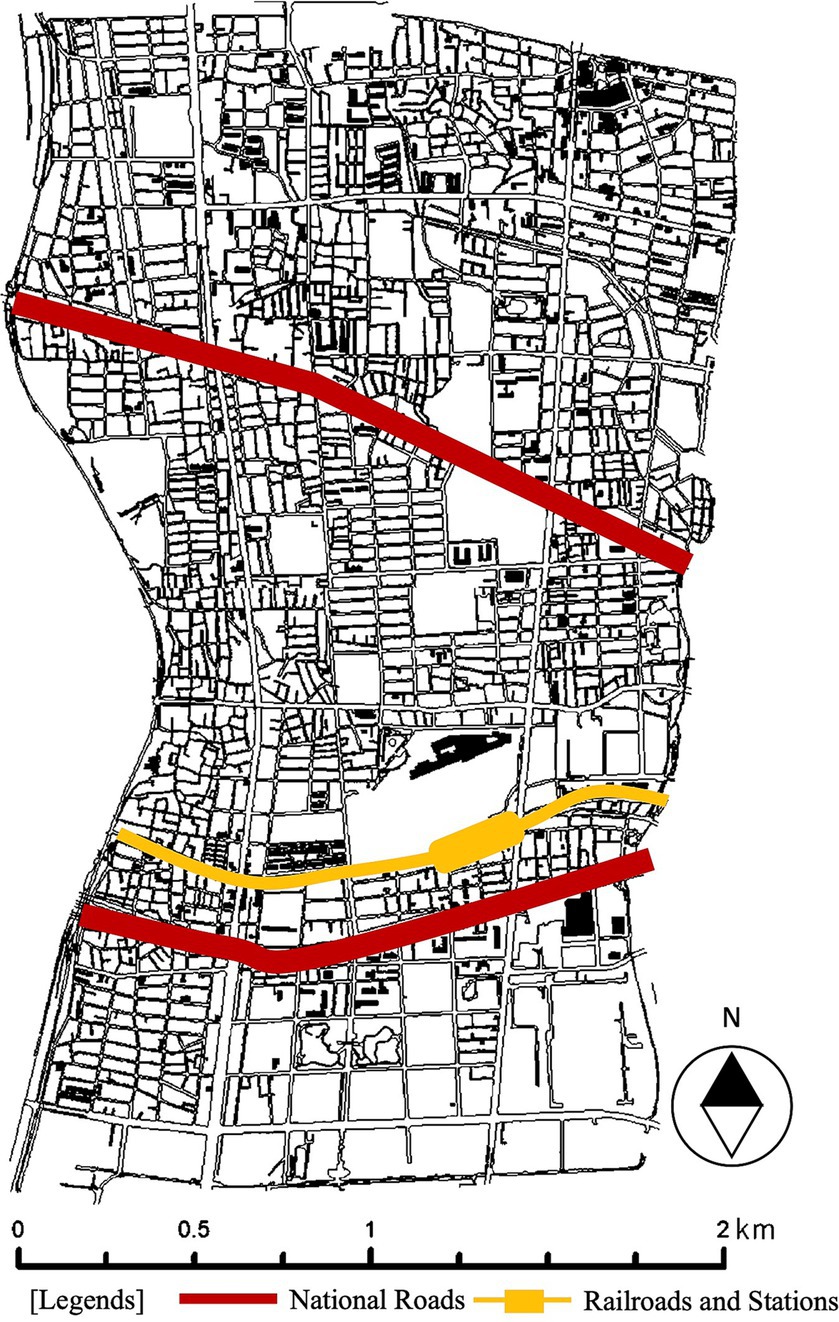
Figure 1. Target area (Osho Drainage District in Amagasaki City, Hyogo).
In Amagasaki City, the area of natural land such as mountains, forests, farmlands, and fields decreased from 3,616 km2 to 1,152 km2 between 1974 and 2008. On the other hand, the area of residential land increased from 10,369 km2 to 13,497 km2. According to the sewerage data of Amagasaki City, the planned runoff coefficient in 1965 was 0.57 and that in 2015 was 0.72, indicating that urbanization has increased the runoff coefficient. The amount of infiltration surface has decreased and the impervious surface has increased, which is a typical example of urbanization due to residential development that has reduced the urban stormwater runoff function.
In this study, green infrastructure was classified into nine categories based on the categories of urban green infrastructure used by previous case studies (Kato et al., 2017); urban (building) greening, parks/green spaces, gardens, urban agricultural land, greenways, roads, rivers, open spaces, and recreational ponds.
In Japan, many cities were formed through rapid urban development during the period of rapid economic growth in the 1970s and at the same time, many natural areas were lost. Currently, the infrastructure developed at that time has been aging and the population has begun to decline. In many cities, existing dilapidated buildings had been densely placed and their renovations has yet to progress, resulting in a rigid flow of material metabolism. As a result, spatially random sparse spaces are created in cities. This is called a “spongy urban area” and refers to the fact that the urban area has many vacant lots and houses (Ujihara et al., 2016). This background makes it difficult to create new large green spaces in existing urban areas, which are becoming overcrowded. Therefore, it is important to utilize small spaces to create green spaces and network them, including existing green spaces, to increase connectivity of services.
This study focuses on rooftops (building greening) and sidewalks (roads) scattered throughout the city as the few remaining lands that can be converted into green spaces in existing urban areas where spatial constraints are severe.
Green roofs and bioswales were selected as green infrastructure to be introduced on rooftops and sidewalks with the aim of improving the effectiveness of urban stormwater treatment. Green roofs are a vegetated roofing system that is functionally integrated into a roof area. Designs are site-specific, depending on climatic conditions, slope, access, structural capacity, and intended usage. The standard components are a tested waterproofing membrane, root barrier, drainage outlets, drainage layer, geofabric, grow media, vegetation, irrigation, and maintenance regime (World Green Infrastructure Network, 2021).
Bioswales are vegetated, shallow, landscaped depressions designed to capture, treat, and infiltrate stormwater runoff as it moves downstream. They are typically sized to treat the water quality event known as the “first flush,” which is the first and often most polluted volume of water resulting from a storm event (National Association of City Transportation Officials, 2013).
Roof types have also been determined by using an ortho-corrected GEOSPACE Aerial Photo 2,500 (25 cm resolution, taken in August 2020), building data (June 2019), and geospatial information (2014) from the Geographical Survey Institute. Building data and fundamental map information were used to create data for buildings with four or more floors. Then, it was combined with an orthorectified aerial photograph and the maximum RGB intensity was extracted for each building. Finally, they were converted to the brightness values and created a histogram.
Since the potential site for introducing rooftop greenery is a terrestrial roof, it is necessary to determine the type of the roof. However, aerial photographs and building data do not have information on the slope and type of roofs on individual buildings, this study use the difference in brightness of aerial photographs to determine roof type on an individual building basis. The intent is to determine whether individual building roofs are flat or sloped, not to measure exact slope.
In this study, convexity refers to the shape of the brightness distribution of the building. When the value of the brightness distribution is expressed as a histogram, one convexity appears in the case of a flat roof, while two or more convexities appear in the case of a sloping roof (Koo et al., 2007). Roof type was determined by utilizing the characteristic that flat roofs have less difference in brightness.
A sample area was established from the target district and 42 buildings in the area were utilized as training data for sensitivity analysis. The class width of the brightness histogram and the percentage of the target histogram’s class in the total (the criterion for convexity) were set. If the total number of pixels multiplied by the convexity criterion was larger than the sum of the maximum number of pixels in each class as well as the number of pixels in the class before and after it, the target building was estimated to have a flat roof. The estimated results were matched with the actual roof type to obtain the accuracy, precision, recall, f-measure, and false positive rate.
Each indicators are defined as follows
Accuracy: Percentage of correct predictions out of all predictions.
Precision: Percentage of the predictions that are actually flat roofs (positive) among those that are actually flat roofs (positive).
Recall: Percentage of correctly predicted to be flat roofs (positive) out of those that are actually flat roofs (positive).
F-measure: Harmonic mean of precision and recall.
False Positive Rate: Percentage of incorrectly predicted flat roofs (positive) that are actually sloped roofs (negative).
True Positive (TP): Cases where it is predicted to be a flat roof (positive), and is actually a flat roof (positive).
True Negative (TN): Cases where it is predicted to be a sloped roof (negative), and is actually a sloped roof (negative).
False Positive (FP): Cases where it is predicted to be a flat roof (positive), but is actually a sloped roof (negative).
False Negative (FN): Cases where it is predicted to be a sloped roof (negative), but is actually a flat roof (positive).
This study uses Arc GIS Desktop 10.8.1 to extract candidate sites for introducing green roofs and bioswales. The conditions for introducing green roofs were that the building must be at least four stories high, has a flat roof, and has a building area of at least 91 m2. The reason for setting the target at four stories and above is that it is basically difficult to introduce green roofs to single detached houses due to site size, facilities, and other restrictions. Also, detached houses in Japan are generally two or three stories high.
Similarly, the conditions for the introduction of bioswales were set to a sidewalk width of 3.5 m, on the rationale that 2.0 m is sufficient for wheelchair and bicycle users to pass each other, and 1.5 m, which is necessary for the introduction of a planting strip. The rooftop and sidewalk areas that fulfill the above conditions, excluding the building frontage, entrance to the site, pedestrian crossing, and bus stop areas, were selected as candidate sites for introduction.
Pluvial flooding analysis was conducted using Info Works ICM, which can simultaneously calculate the flow in sewer pipelines and above-ground inundation flow. Info Works ICM consists of four models: Effective Rainfall Model, Surface Runoff Model, In-Pipe Hydraulic Model, and Surface Flooding Calculation Model. The planned rainfall is used as input data and the effective rainfall is calculated for each surface (e.g., road, roof, and infiltration area).
The effective rainfall calculated by the Effective Rainfall Model flows over the ground surface and the inflow into manholes is calculated by the Surface Runoff Model which serves as input data for the In-Pipe Hydraulic Model. The pipe hydraulics is calculated using the Saint-Venent’s Equation (Cunge and Wegner, 1964; Willi et al., 2019) or the Preissmann Slot Model (Chaudhry, 1979; Horie et al., 2020) under pressure to analyze the flow in the manhole. The Surface Inundation Calculation Model uses the shallow water equation, a two-dimensional unstructured grid-based unsteady flow analysis, to analyze the flow of water overflowing from the sewer to the ground surface. The Rehbock weir formula (Rehbock, 1929; Oshima et al., 2013) is used for the overflow quantity from the manhole to the grid and the inflow quantity from the grid to the manhole. Pipe hydraulics and surface overflow are calculated in conjunction.
Runoff coefficients were calculated for each land use using the urban land use subdivision mesh (100 m unit); a kind of digital national land information from MLIT and the runoff coefficients for each land use which are based on the previous studies (Japan Highway Association, 2007; Table 1). The runoff coefficients for the lower catchment units were aggregated to obtain the runoff coefficient in 500 m mesh units for the entire Osho Drainage District. If the lower catchment crossed the 500 m unit’s boundary, the lower catchment was divided at the boundary line and the area was prorated. The areas of green roofs and bioswales were also divided proportionally, then the runoff coefficient for each lower catchment after the introduction of green infrastructure was calculated.

Table 1. Runoff coefficient set values by land use.
After the introduction of green roofs and bioswales, the runoff coefficients for buildings (Ci0 = 0.6–0.75) and roads (Ci0 = 0.85) were assumed to be replaced by its coefficient for green areas (Ca = C a = 0.20) and an inland water inundation analysis was conducted. Elevation data necessary for the inundation analysis was obtained using the basic map information (5 m unit) published by the Geospatial Information Authority of Japan. The roughness coefficient used in the inundation calculations was set to 0.043 for roads and 0.067 for streets based on previous research papers (Kawaike et al., 2002; Takeda et al., 2007).
The use of centralized rainfall waveforms as planned rainfall is most common in Japan and is indicated in the central government guidelines [Ministry of Land, Infrastructure, Transport, and Tourism (MLIT), 2005, 2023]. Centralized rainfall is designed so that each location in each basin with different flood arrival times experiences the same probability of rainfall, as determined by the rainfall intensity equation, in equal amounts. Using this rainfall, runoff calculations can reproduce peak flood flows for each river or waterway according to its flood arrival time (Shiga Prefectural Government, 2012).
This study targeted a 10-year probability rainfall (total rainfall: 86.3 mm, maximum hourly rainfall: 52.3 mm/h, duration: 3 h) with a middle concentrated rainfall waveform obtained from past experiments in the d4PDF database of ensemble climate prediction contributing to the global warming (Figure 2). The basis for setting the rainfall intensity is as follows. First, in Japan, the standard probability year used in rainfall exclusion plans is from 5 to 10 years [Ministry of Land, Infrastructure, Transport, and Tourism (MLIT), 2009]. Second, Hyogo Prefecture, including Amagasaki City, also uses a 5 to 10-year rainfall probability to promote the development of rainwater facilities through sewage systems (Hyogo Prefectural Government, 2022). Third, in Amagasaki City, maintenance for the 6-year probability rainfall (46.8 mm/h) has already been completed, but in recent years, heavy rains exceeding this level have been occurring more frequently (Amagasaki City Government, 2017).
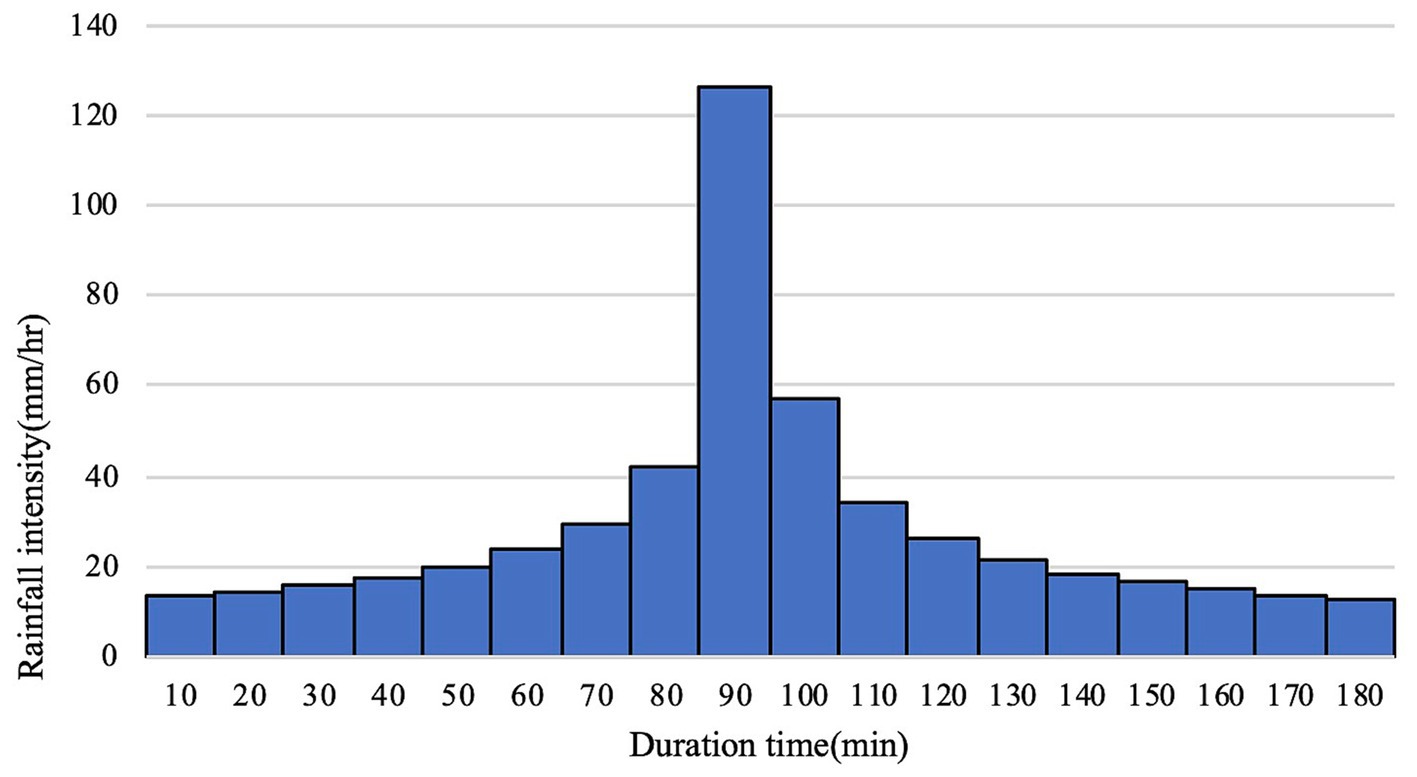
Figure 2. Hyetograph of target rainfall.
In order to set appropriate class widths and criteria for convexity, a sensitivity analysis was conducted using five indicators: accuracy, precision, recall, f-measure, and false positive rate. Three class ranges; 0.01, 0.025, and 0.05 were set and the convexity criterion was varied at 0.05 intervals to analyze the variation of each indicator value (Table 2).
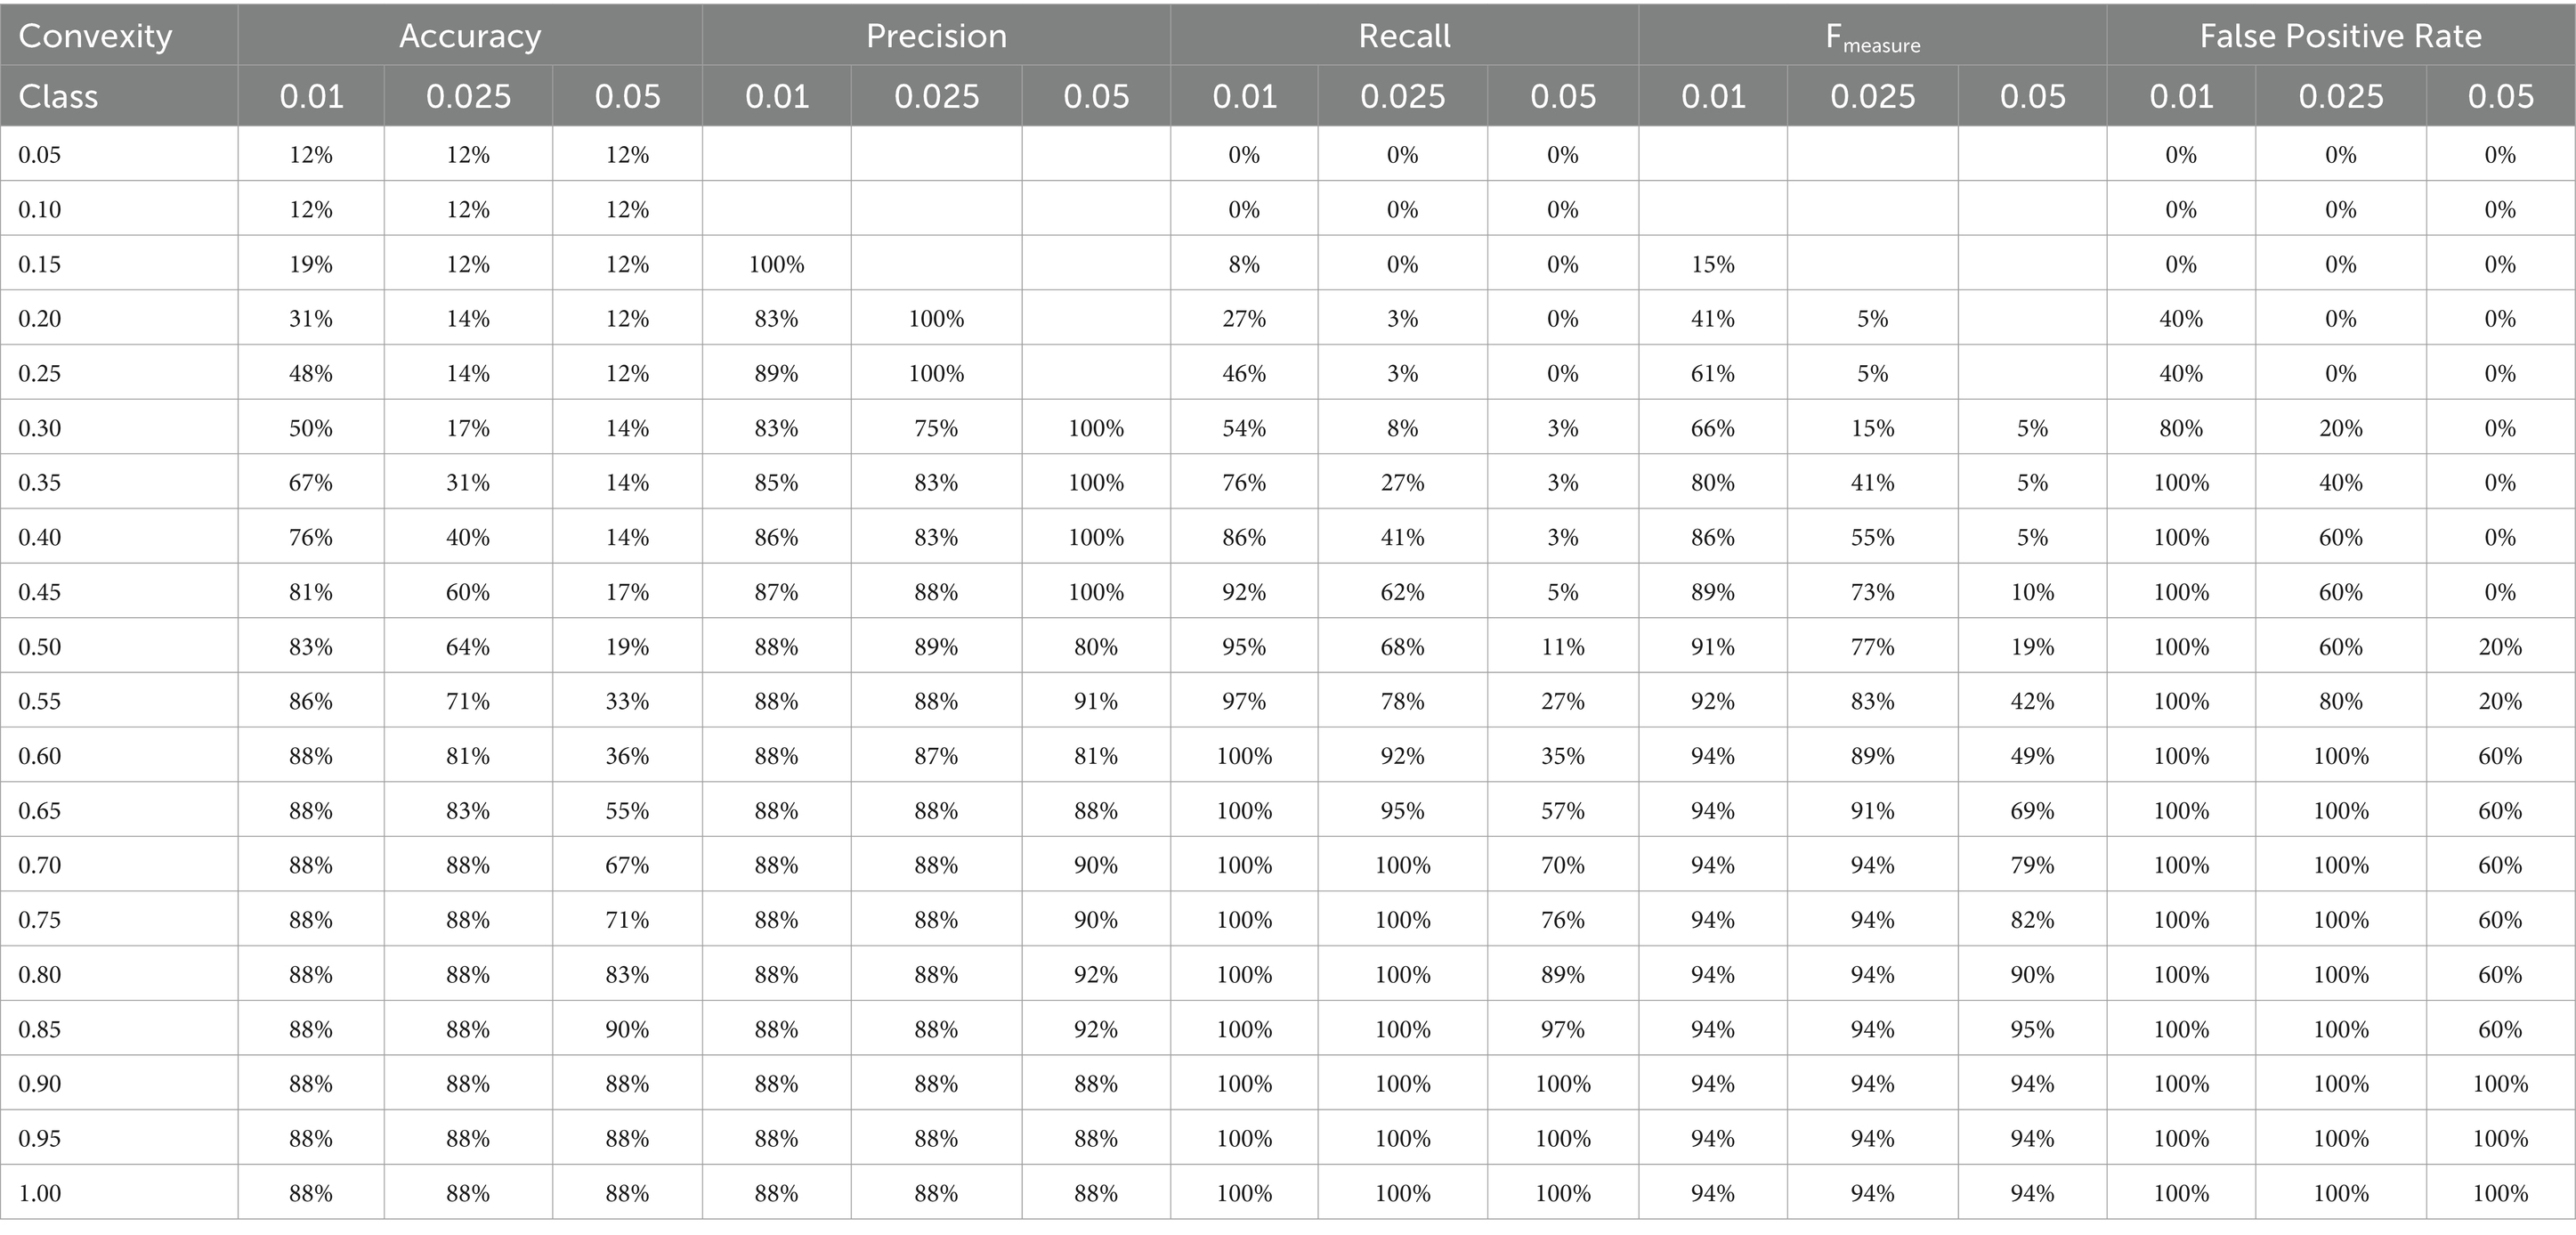
Table 2. Results of sensitivity analysis.
It was confirmed that the percentage of accuracy increased as the value of the convexity criterion increased; regardless of the class width and that the percentage of correct responses peaked at an earlier point in time when the class width was set smaller. When the class width was 0.05 and the convexity criterion was 0.85, accuracy was the highest at 90%. Precision decreased as the value of the convexity criterion exceeded a threshold value, with larger class widths giving higher threshold values. Recall increased with increasing values of the convexity criterion and peaked at an earlier point in time when the class width was set to a smaller value, similar to the behavior of the correctness rate. Also similar to the compliance rate, there was a threshold at which the reproducibility rate was 100% for all three class widths. F-measure exhibited behavior similar to that of the repeatability. When the class width was 0.05 and the convexity criterion was 0.85, the F-measure had a maximum value of 0.95. False positive rate exhibited a stair-step behavior, increasing and stagnating after a particular threshold value. The larger the step width was set, the larger the value of the convexity criterion, the lower the false positive rate, was observed.
Based on the above sensitivity analysis, the threshold values were set as the combination of a class width of 0.05 and a convexity criterion of 0.85, for which the correctness of each indicator was relatively good. Roof type was determined using these threshold values for buildings other than the 42 buildings, and candidate sites for the introduction of green roofs were extracted.
The results of the extraction of possible sites for green roofs and bioswales are shown in Figure 3.
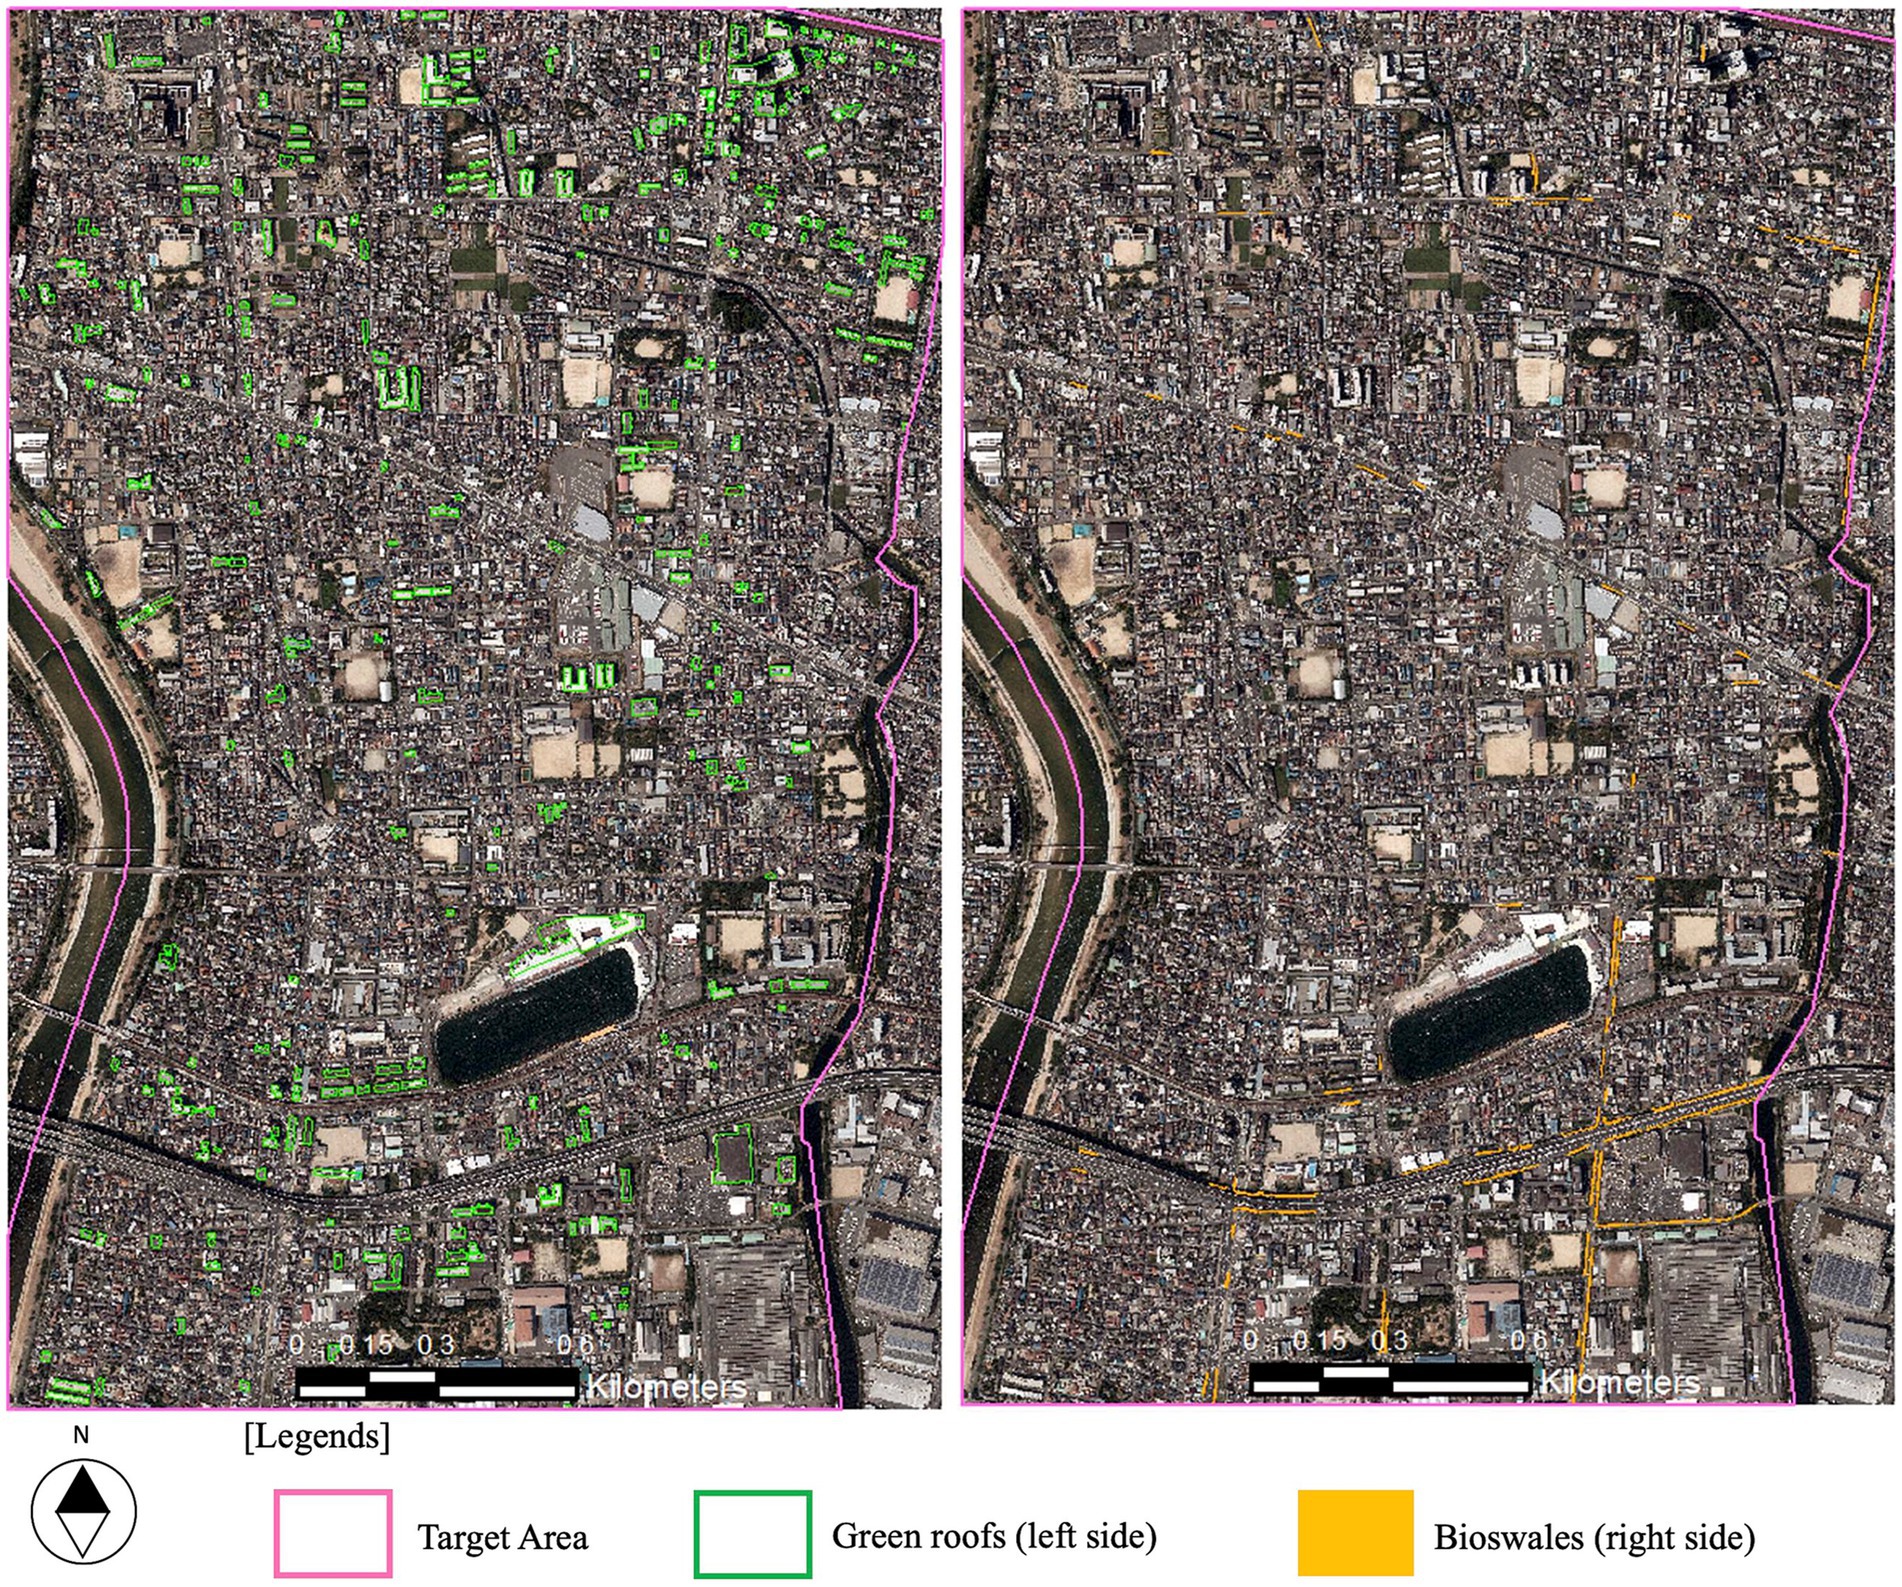
Figure 3. Potential sites for green infrastructure implementation.
Regarding green roofs, the total number of buildings in the target area was 14,564. Of these, 334 were buildings with four or more floors and 295 of them had flat roofs, with a total greenable area of 62,148 m2. While the maximum area of greenable space was 6,241 m2, the median was 137 m2, reaffirming the difficulty of large-scale greening in urban areas. Buildings that could be candidates are mostly distributed along two national highways, which are considered major arteries and near railroad stations. These are centers where district functions are gathered and in the event of flooding damage, the economic loss would be significant. If green roofs are introduced, in addition to reducing flood damage, it is expected to have a secondary effect of reducing economic damage as well.
Regarding the bioswales, the number of possible introduction sites was 272, with a total area of 6,510 m2. The maximum and median areas of possible introductions were 88 m2 and 22 m2, respectively. They were mostly distributed along the southern national road that runs east to west through the district and the north to south road that intersects it. These two roads were shown to have the potential to become the green axis in the district. Divided by 1.5 m in width, the total length of the green streets is 4,340 m.
Then, the runoff coefficients were determined for the introduction of green roofs and bioswales. The runoff coefficients for green roofs only, bioswales only, with and without introduction of both green roofs and bioswales were 70.34, 70.87, 70.28, and 70.93%, respectively. This means that about 1% of the area of the target drainage area is converted to green spaces from the introduced area. However, as can be seen from the change in the runoff coefficient, the difference in the runoff coefficient was only about 0.65 percentage points in the target area, even when both were introduced.
The target area was divided into a total of thirty-two 500 m meshes, and the runoff coefficients were calculated for the current situation (without) and when green infrastructure was installed (with). The runoff coefficients for each of the 16 meshes, divided into two groups, northern and southern parts, were compared. The maximum [85.36% (with), 86.00% (without)], minimum [63.31% (with), 64.16% (without)], and mean [74.52% (with), 75.02% (without)] runoff coefficients for the southern part with and without green infrastructure, all higher than the maximum [77.45% (with), 77.45% (without)], minimum [57.01% (with), 57.40% (without)], and mean [68.94% (with), 69.49% (without)] values for the northern part (Figure 4).

Figure 4. Results of runoff coefficients for 500 m mesh in the target area.
The parks and green spaces in the target area were examined. It was found that all parks excluding riverbeds were equivalent in size to Japanese city parks (standard area of 0.25 ha), and that the number of parks was relatively small, with 19 in the southern part, compared to with 24 in the northern part of the target area. In terms of park layout, in the northern part, 24 parks were dispersed, while in the southern part, 19 parks were placed proximity along rivers and roads. The mesh with just two quite small parks along the roads had the largest runoff coefficient (85.36% (with), 86.00% (without)). This indicates that it is important to consider the placement of existing park green space as well as the location of green infrastructure, in order to improve the effectiveness of runoff control.
From the perspective of landscape design, the design techniques in green space planning studies advocate the formation of a “green corridor” by forming a green axis along linear urban infrastructure such as roads and rivers (Guneroglu et al., 2013; Aini et al., 2022; Zhang et al., 2022). The results based on the analysis provide an opportunity to consider how to effectively arrange limited green spaces in cases where it is not possible to create a sufficient amount of new green spaces in overcrowded urban areas. Referring to the “green corridor” design approach, such as, it is expected not only to improve the runoff coefficient, but also to improve the proximity between green spaces by introducing green roofs in the district center, where various functions are concentrated, and to form a green street along the national highway, thus creating a belt-like green axis.
The results of the analysis of internal flooding are shown in Table 3. The reduction in stormwater runoff was calculated with a hypothetical rainfall of approximately 1% green spaces created for the area of the B drainage area. The reduction was 2.5% for the maximum waterlogged area, 1.5% for the flooded area, and 0.7% for the average depth of waterlogging divided by the maximum waterlogged area. In this case study, since the amount of bioswales installed was about 0.1% of the target drainage area, the effect of bioswales in reducing runoff was negligible and the effect of green roofs were dominant.

Table 3. Results of pluvial flooding analysis.
Next, the spatial distribution of the runoff reduction effect is reviewed. The red areas in Figure 5 indicate that the extent of inundation has been reduced. As a characteristic effect, the introduction of green roofs and bioswales at the upstream end of the sewer network where flooding occurs (Locations A and B) reduced the extent of flooding. Focusing on locations A and B in the red dashed circle, where the extent of inundation was reduced and based on the analysis, the changes in the water level in the sewer culvert and the flow quantity in the manhole are measurable.
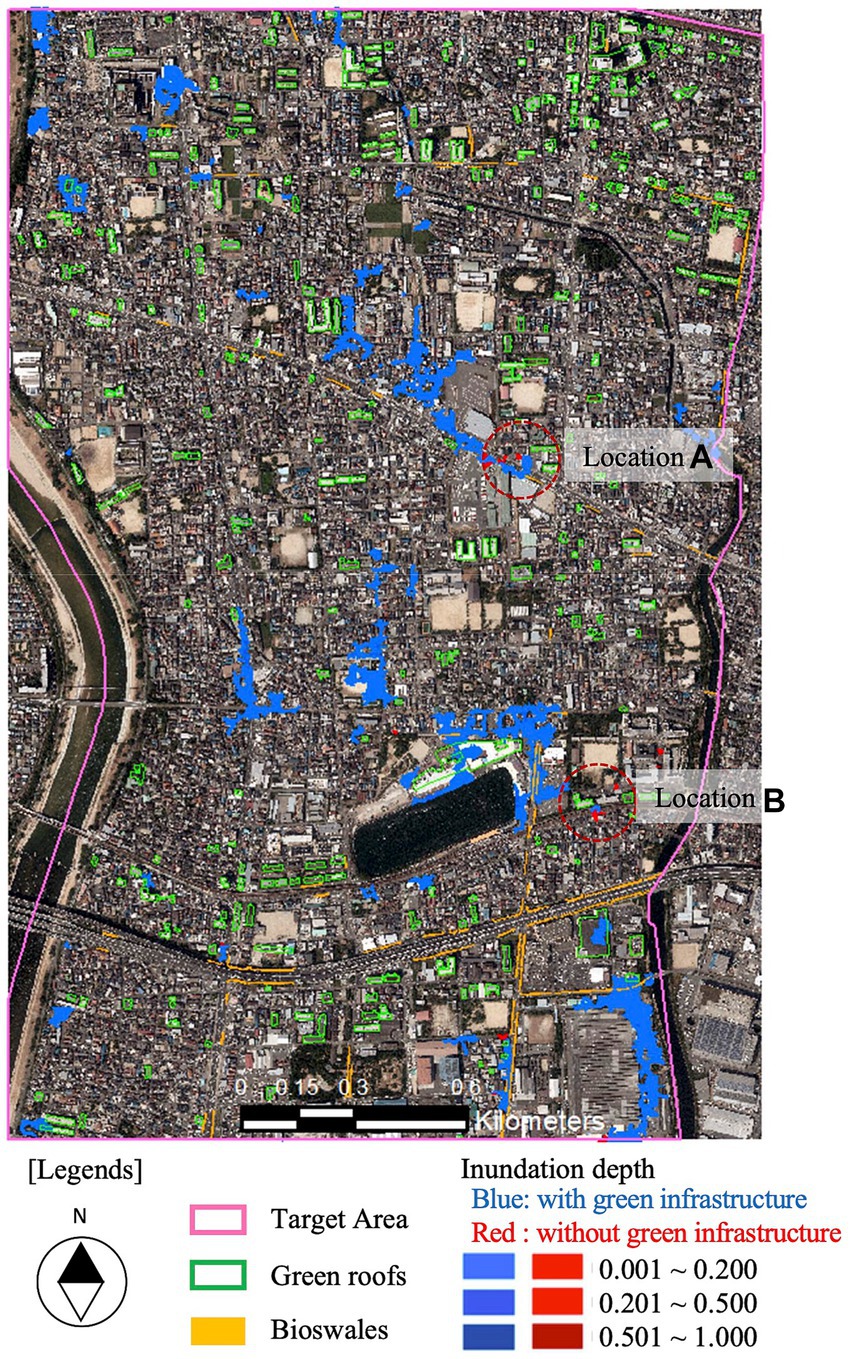
Figure 5. Extent of inundation with and without green infrastructure.
Comparing the values of the five nodes with and without introduction of green roofs and bioswales, the water levels in the sewer culverts at both of the two locations were both reduced at the time of maximum inundation (Table 4). The maximum difference in the dynamic water level at the time of maximum flooding was 0.06 m (3%) at location A and 0.03 m (7%) at location B, confirming the effectiveness of the improvement. The flow quantity in the manhole also decreased after the introduction of green roofs and bioswales.
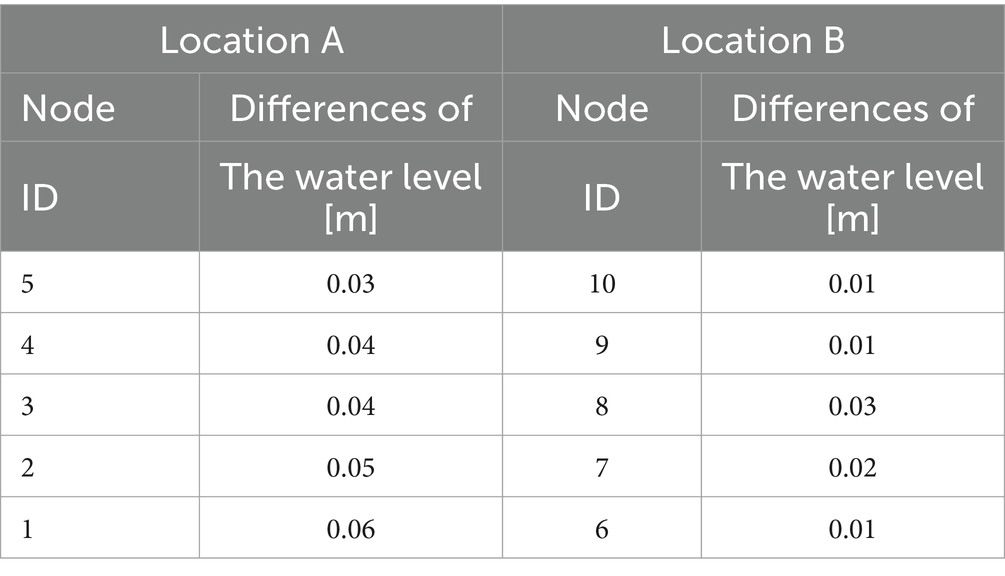
Table 4. Differences of the water level at the time of maximum inundation.
Particularly, at the time of maximum flooding, the flow quantity was reduced by up to 0.1 m3/s at Location A and 0.3 m3/s at Location B (Figure 6). It was confirmed quantitatively that the introduction of green roofs and bioswales reduced the inflow into the sewer culvert, thereby reducing the inflow load. On the other hand, flooding at a location near the downstream side (at the southern end of the district) showed little mitigation effect, even with the introduction of green roofs and bioswales.
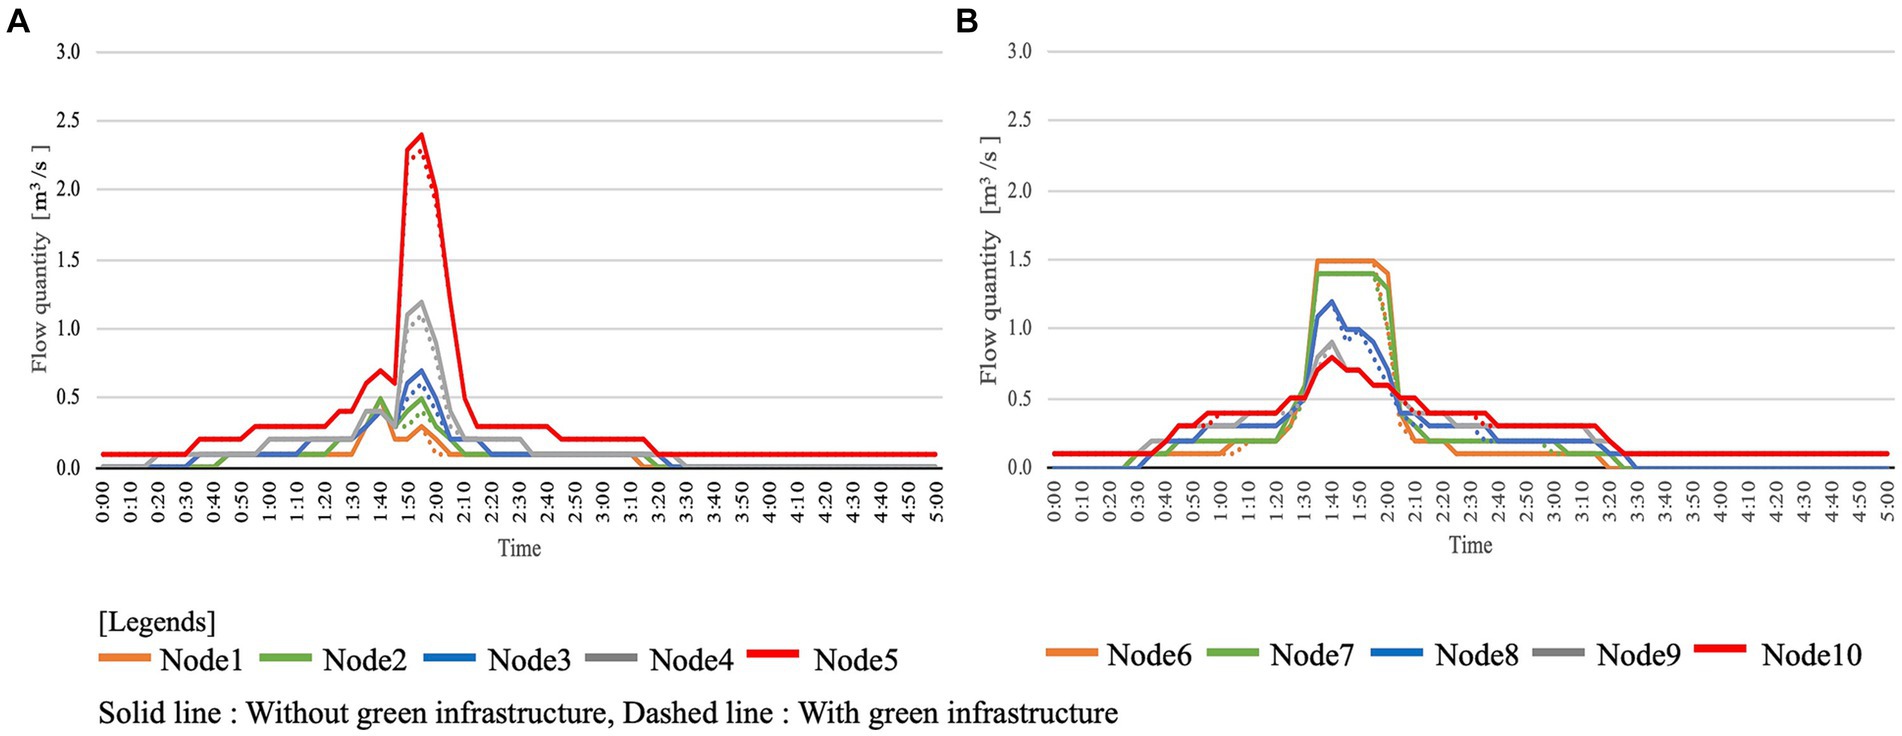
Figure 6. The flow quantity in the manhole of location A (A) and location B (B).
Basically, the sewerage is a natural flow system and the catchment area is smaller upstream. If the amount of green roofs and bioswales introduced is insufficient, the ratio of the area of green roofs and bioswales introduced to the catchment area is smaller downstream, which is the reason why the effect tends to appear more prominent at the upstream end. This logic is also consistent with the results of the inundation analysis, which quantitatively indicates that there is a difference in the effectiveness of runoff control upstream and downstream. Also, this indicates that the factors that contribute to flood impacts on cities are not only the amount of green roofs and bioswales introduced to a catchment area, but also their placement. By introducing a large number of green roofs and bioswales upstream in the catchment area and reducing the inflow load of sewer culverts, flooding can be expected to be mitigated in the entire district.
First, this study differentiated green infrastructure into green roofs for buildings and bioswales for sidewalks, and extracted possible sites for their construction using GIS. The number of floors, building area, and roof type were set as the conditions for introducing green roofs, and the sidewalk width and area were set as the conditions for introducing bioswales. The procedure for extracting possible sites for each was shown using aerial photographs and building data in GIS. A case study was conducted for Osho Drainage District in Amagasaki City. It was confirmed that the possible introduction amounts of green roofs and bioswales were about 1 and 0.1% of the drainage district area, respectively and that the runoff coefficient would be improved by 0.65 points when these were introduced. It was mentioned that the introduction of green roofs in district centers where functions are concentrated and the formation of green streets with bioswales along national roads are noteworthy points in addition to the improvement of the runoff coefficient.
Second, this study quantitatively evaluated the effectiveness of stormwater runoff control by conducting an internal flooding analysis for Osho Drainage District in Amagasaki City, which has a wide range of drainage districts, and compared the results with and without the introduction of green roofs and bioswales. For the inundation analysis, a centralized rainfall event with a total rainfall of 86.3 mm, a maximum hourly rainfall of 52.3 mm/h, and a duration of 3 h was assumed. The maximum waterlogging area inundated and average inundation depth were reduced by 2.5, 1.5, and 0.7%, respectively. Taking the two locations where the runoff reduction effect was significant, it was confirmed that both the water level in the sewer culvert and the flow quantity in the manhole were reduced.
In this study, based on the introduction criteria, the candidate sites for introduction were identified and assuming the introduction of green roofs and bioswales, the area of green spaces to be created would be about 1% of the district area. Taking the securing of park sites in land readjustment projects as an example for comparison, the significance of this 1% is discussed.
In Japan, the land readjustment scheme has been used to develop public facilities such as roads and parks. The land readjustment scheme has been applied to approximately 4,000 km2 of land, which is 30% of the total urban area in Japan. More specifically, the land readjustment scheme contributed to the development of: 11,500 km of city planning roads (25% of all city roads designated on city plans), 150 km2 of green parks (50% of parks in Japan) and 950 station-area facilities (30% of stations with over 3,000 passengers per day) (World Bank Tokyo Development Learning Center, 2021). The operational guidelines for land readjustment projects [Ministry of Land, Infrastructure, Transport and Tourism (MLIT), 2001] stipulate the following standards for greening “The total area of parks required in the project area must be at least 3 m2 per person and at least 3% of the project area, based on the assumption of the population that will be living in the project area in accordance with Article 9, Item 6 of the Regulations.”
Green roofs and bioswales are not necessarily equivalent to parks, but even in land readjustment projects, which are an aerial development method, only 3% of the green spaces is created. In most cases, from the viewpoint of securing revenue, parks are not developed much more than 3%. Therefore, the 1% figure obtained in this study may seem small at first glance, but from the perspective of urban greening, it is significant. Green roofs and bioswales are small-scale, decentralized land modifications that do not produce dramatic improvements like retention or regulating basins.
In this case study, the downstream end of the sewer network showed little reduction in flooding, but several locations at the upstream end showed reductions in both waterlogging and flooded area. Particularly, the runoff control function of green infrastructure was effective in reducing flooding because of the small catchment area in the upstream area. On the other hand, the catchment area in the downstream area was large, reducing the ratio of the converted area of green infrastructure to the catchment area and confirming that no significant effect could be expected. It is possible to increase the effect of inundation mitigation by increasing the amount of green infrastructure installed and networking the green infrastructure from upstream to downstream, even if it is small-scale and decentralized.
The analysis results revealed that not only the amount of introduced area relative to the catchment area was important, but also its placement. The conditions for introduction that are highly effective in reducing runoff were identified. In other words, the results showed that introducing green roofs and bioswales upstream within the catchment area and reducing the inflow load of sewer culverts can be expected to be effective in improving flooding throughout the district. Consideration was given to overlaying information on the distribution of park green spaces with the system of sewer culverts within the district.
The study suggested that the green infrastructure implementation strategy can be pursued in two phases. The first is to examine the most beneficial locations in terms of the network between the sewerage system and existing parks and green spaces. The second is to form a green street that will serve as the skeleton of the district and connect these areas with the existing green network.
Here, based on the results of the case study, effective implementation strategies for green infrastructure are discussed. A panoramic view of the sewer culvert system overlaid with the parks and green spaces in the district shows that many parks and green spaces are distributed in the northern part of the district, near the upstream end of the sewer culvert. The introduction of green roofs and bioswales near the upstream end of the sewer culvert will help control stormwater runoff and create a green network integrated with existing parks and green spaces.
The first stage of the implementation in green infrastructure is to examine the most beneficial areas in terms of networking with the sewerage system and existing parks green spaces. On the other hand, the southern part of the district has fewer parks than the northern part and the sewer culvert system has a smaller runoff control effect. However, the two roads that run through the district from east to west and north to south have the potential to create green streets with bioswales. The second phase of green infrastructure implementation is to form a green street that will serve as the backbone of the district and connect it with the green network starting from the north side of the district, thereby extending the ecosystem services of green infrastructure to the entire district.
It is said that if runoff control works on a district scale, it can be expected to be effective in controlling heat islands and reducing the risk of heat stroke. Therefore, if these multiple benefits can be translated into economic values, it can be expected that a district development will optimize these values (Shimatani et al., 2019).
Although this study has mainly discussed the stormwater runoff control perspective, the most important feature of green infrastructure is its multifunctionality, as mentioned above. Green infrastructure can support human health, provide socio-economic and environmental benefits, and bring color to an otherwise grey urban landscape (Kumar et al., 2019). However, the multi-functional and multi-scale nature of green urban infrastructure complicates the categorization of services and incentives, since in reality the interactions between various benefits are manifold and appear on different scales (Demuzere et al., 2014). Challenges for the near future are the ability to evaluate simultaneously these effects of green infrastructure from multiple perspectives, create the integrated values, and share them with many stakeholders.
The original contributions presented in the study are included in the article/supplementary material, further inquiries can be directed to the corresponding author.
TK: Writing – original draft, Data curation, Investigation, Visualization. TO: Conceptualization, Formal analysis, Methodology, Supervision, Writing – review & editing.
The author(s) declare that financial support was received for the research, authorship, and/or publication of this article. This research was financially supported by JSPS.KAKENHI (20K05034) and the Organization for Research & Development of Innovative Science & Technology, Kansai University.
The authors declare that the research was conducted in the absence of any commercial or financial relationships that could be construed as a potential conflict of interest.
All claims expressed in this article are solely those of the authors and do not necessarily represent those of their affiliated organizations, or those of the publisher, the editors and the reviewers. Any product that may be evaluated in this article, or claim that may be made by its manufacturer, is not guaranteed or endorsed by the publisher.
Abdalla, E. M. H., Pons, V., Stovin, V., Ville, S. D., Beck, E. F., Alfredsen, K., et al. (2021). Evaluating different machine learning methods to simulate runoff from extensive green roofs. Hydrol. Earth Syst. Sci. 25, 5917–5935. doi: 10.5194/hess-25-5917-2021
Aini, A., Muhammad, R., Omkar, D., and Asrar, A. (2022). Green corridor: a critical perspective and development of research agenda. Front. Environ. Sci. 10:982473. doi: 10.3389/fenvs.2022.982473
Amagasaki City Government . (2017). Master Guidelines for Comprehensive Flood Control in River Basin of Amagasaki City. (translated by author. original title: Amagasaki-shi sogo-chisui-taisaku kihon guideline). 2–15. Available at: https://www.city.amagasaki.hyogo.jp/_res/projects/default_project/_page_/001/004/925/guideline2.pdf
American Rivers, Association of State Interstate Water Pollution Control Administrators, National Association of Clean Water Agencies, National Resources Defense Control, The Low Impact Development Center, US Environmental Protection Agencies . (2008). Managing Wet Weather with Green Infrastructure Action Strategy. Available at: https://www.google.com/url?sa=t&rct=j&q=&esrc=s&source=web&cd=&cad=rja&uact=8&ved=2ahUKEwi0_bOsjoaBAxWVmlYBHYZjDbEQFnoECA4QAQ&url=https%3A%2F%2Fnepis.epa.gov%2FExe%2FZyPURL.cgi%3FDockey%3DP1008SI8.TXT&usg=AOvVaw03XVvkR8t9Bw32huyKetiI&opi=89978449
Arjenaki, M. O., Sanayei, H. R. Z., Heidarzadeh, H., and Mahabadi, N. A. (2021). Modeling and investigating the effect of the LID methods on collection network of urban runoff using the SWMM model (case study: Shahrekord City). Model. Earth Syst. Environ. 7, 1–16. doi: 10.1007/s40808-020-00870-2
Brunetti, G., Papagrigoriou, I. A., and Stumpp, C. (2020). Disentangling model complexity in green roof hydrological analysis: a Bayesian perspective. Water Res. 182:115973. doi: 10.1016/j.watres.2020.115973
Chaudhry, M. H. (1979). Applied hydraulic transients. New York: Van Nostrand Reinhold Company. 423–448.
Cunge, J. A., and Wegner, M. (1964). Numerical integration of Barre de saint-Venant’s flow equations by means of an implicit scheme of finite differences. La Houille Blanche 50, 33–39. doi: 10.1051/lhb/1964002
Delmotte, V. M., and Zhai, P. (2022). Regional trends in extreme events in the IPCC 2021 report. World Meteorol. Organ. Bulletin 71, 52–62.
Demuzere, M., Orru, K., Heidrich, O., Olazabal, E., Geneletti, D., Orru, H., et al. (2014). Mitigating and adapting to climate change: multi-functional and multi-scale assessment of green urban infrastructure. J. Environ. Manag. 146, 107–115. doi: 10.1016/j.jenvman.2014.07.025
Ebrahimian, A., Wadzuk, B., and Traver, R. (2019). Evapotranspiration in green stormwater infrastructure systems. Sci. Total Environ. 688, 797–810. doi: 10.1016/j.scitotenv.2019.06.256
Fukuoka, T. (2019). Strategic green infrastructure implementation in the US. Japan Soc. Civil Eng. Magazine 104, 36–37.
Gao, Y., Wang, D., Schmidt, A., and Tang, Y. (2018). Exploring the response of combined urban sewer system to the implementation of green roof. IOP Conf. Series 178:012043. doi: 10.1088/1755-1315/178/1/012043
Green Infrastructure Association . (2021). What is Green Infrastructure? (translated by author, original title: Green infrastructure to WA). Available at: https://www.gi-assoc.net/about/
Guneroglu, N., Acar, C., Dihkan, M., Karsli, F., and Guneroglu, A. (2013). Green corridors and fragmentation in south eastern Black Sea coastal landscape. Ocean Coastal Manag. 83, 67–74. doi: 10.1016/j.ocecoaman.2013.02.025
Horie, N., Shigeta, N., and Watanabe, M. (2020). Identification methods of preissmann slot model. J. Japan Soc. Civil Eng. 76, I_733–I_738. doi: 10.2208/jscejhe.76.2_I_733
Hyogo Prefectural Government . (2022). Promotion of comprehensibe flood control in river basin (translated by author. original title: Sogo-chisui-taisaku no suishin). Available at: https://web.pref.hyogo.lg.jp/ks16/wd18_000000040.html
Iida, A., Yamato, H., Hayashi, S., and Ishikawa, M. (2015). A simulation study of rainwater infiltration and flood prevention effects by urban green spaces in Kanda River, Tokyo. J. City Plan. Inst. Jpn. 50, 501–508. doi: 10.11361/journalcpij.50.501
Ishimatsu, K. (2020). Considering a practical scenario for mainstreaming rain gardens in Japan. J. Japan Assoc. Landscape Ecol. 25, 33–41. doi: 10.5738/jale.25.33
Japan Highway Association . (2007). Roadway Geotechnical and Drainage Guidelines (translated by author, original title: Douro-dokou-Haisui-Shishin). Available at: https://www.road.or.jp/books/pdf/04-005.pdf
Japan Meteorological Agency (2020). Climate Change Monitoring Report 2019. Available at: https://www.jma.go.jp/jma/en/NMHS/ccmr/ccmr2019.pdf
Johnson, B. A., Kumar, P., Okano, N., Dasgupta, R., and Shivakoti, B. R. (2022). Nature-based solutions for climate change adaptation: a systematic review of systematic reviews. Nat. Based Solut. 2:100042. doi: 10.1016/j.nbsj.2022.100042
Jorgensen, G., Fryd, O., Lund, A. A., Andersen, P. S., and Herslund, L. (2022). Nature-based climate adaptation projects, their governance and transitional potential-cases from Copenhagen. Front. Sustain. Cities Sec. Innov. Govern. 4:906960. doi: 10.3389/frsc.2022.906960
Kajikawa, M., Yamada, Y., Okui, Y., Murohashi, S., Kanayama, A., Takeda, H., et al. (2020). Effectiveness of Stormwater runoff control as a GI elemental technology utilizing under sidewalks (translated by author, original title: Hodoushita wo katsuyou shita GI youso-gijutsu to shiteno usui-ryushutsu-yokusei-Kouka ni tsuite). J. Japan. Soc. Reveget. Technol. 45, 447–452. doi: 10.7211/jjsrt.45.447
Katagiri, Y. (2012). Study on the green infrastructure based on the network of former agricultural waterway in the middle Tama River watershed. J. City Plan. Inst. Jpn. 47, 565–570. doi: 10.11361/journalcpij.47.565
Kato, Y., Nishida, T., Nishihiro, J., Fukuoka, T., and Yoshida, J. (2017). Definitive version! Green infrastructure (translated by author, original title: Kettei-ban! Green infrastructure). Tokyo: Nikkei BP, 103–106.
Kaur, R., and Gupta, K. (2022). Blue-green infrastructure (BGI) network in urban areas for sustainable storm water management: a geospatial approach. City Environ. Interact. 16:100087. doi: 10.1016/j.cacint.2022.100087
Kawaike, K., Inoue, K., Hayashi, H., and Toda, K. (2002). Development of inundation flow model in urban area. J. Japan Soc. Civil Eng. 2002:1. doi: 10.2208/jscej.2002.698_1
Kim, S. Y., Na, W., Jun, C., Seo, H., and Kim, Y. (2021). Hydrological performance of green roof systems: a numerical investigation. Front. Environ. Sci. 9:806697. doi: 10.3389/fenvs.2021.806697
Koo, W., Takizawa, A., and Katoh, N. (2007). A study on discriminating roof types from aerial image – constructing two-step discrimination method using curve approximation of brightness distribution and plane fitting by regression. Arch. Inst. Japan’s J. Environ. Eng. 72, 99–105. doi: 10.3130/aije.72.99_1
Kumar, P., Debele, S. E., Sahani, J., Rawat, N., Cardona, B. M., Alfieri, S. M., et al. (2021). An overview of monitoring methods for assessing the performance of nature-based solutions against natural hazards. Earth Sci. Rev. 217:103603. doi: 10.1016/j.earscirev.2021.103603
Kumar, P., Druckmanc, A., Gallagherb, J., Gaterslebend, B., Allisone, S., Eisenmanf, T. S., et al. (2019). The nexus between air pollution. Green infrastructure and human health. Environ. Int. 133:105181. doi: 10.1016/j.envint.2019.105181
Lama, G. F. C., Giovannini, M. R. M., Errico, A., Mirzaei, S., Padulano, R., Chirico, G. B., et al. (2021). Hydraulic efficiency of green-blue flood control scenarios for vegetated Rivers: 1D and 2D unsteady simulations. Water 13:2620. doi: 10.3390/w13192620
Liu, L., Sun, L., Niu, J., and Riley, W. J. (2020). Modeling green roof potential to mitigate urban flooding in a Chinese City. Water 12:2082. doi: 10.3390/w12082082
Ministry of Land, Infrastructure, Transport and Tourism (MLIT) . (2001). The Operational Guidelines for Land Readjustment Projects. (translated by author, original title: Tochi-kukaku-seiri-jigyou un’yo-shishin). 25. Available at: https://www.mlit.go.jp/common/001052004.pdf
Ministry of Land, Infrastructure, Transport, and Tourism (MLIT) . (2005). Guideline for creating inundation area maps for small and medium-sized rivers (translated by author, original title: Chusho-kasen-shinsui-soutei-kuikzu sakusei no tebiki). Available at: https://www.mlit.go.jp/kisha/kisha05/05/050705/04.pdf
Ministry of Land, Infrastructure, Transport, and Tourism (MLIT) . (2009). Recent rainfall and internal water damage. and current status of sewerage system development (translated by author. original title: Kinnen no kouu oyobi naisui-higai no joukyou. gesuidou-seibi no genjou ni tsuite). 10. Available at: https://www.mlit.go.jp/mizukokudo/sewerage/content/001320996.pdf
Ministry of Land, Infrastructure, Transport and Tourism (MLIT) . (2019). Green Infrastructure Promotion Strategy. Available at: https://www.mlit.go.jp/common/001297373.pdf
Ministry of Land, Infrastructure, Transport and Tourism (MLIT) . (2020). River Basin Disaster Resilience and Sustainability by All (RBDRSA). Available at: https://www.mlit.go.jp/river/kokusai/pdf/pdf21.pdf
Ministry of Land, Infrastructure, Transport, and Tourism (MLIT) . (2023). Guideline for creating inundation area maps for small sized rivers (translated by author, original title: Shokibo-kasen no shinsui-soutei-kuikzu sakusei no tebiki). Available at: https://www.nilim.go.jp/lab/rcg/newhp/seika.files/pdf/tebiki_4.pdf
Mobilia, M., and Longobardi, A. (2020). Impact of rainfall properties on the performance of hydrological models for green roofs simulation. Water Sci. Technol. 81, 1375–1387. doi: 10.2166/wst.2020.210
National Association of City Transportation Officials . (2013). Urban Street Design Guide. Available at: https://nacto.org/publication/urban-street-design-guide/street-design-elements/stormwater-management/bioswales/
National Climate Change Adaptation Research Facility . (2019). Synthesis Summary 1 -Heat and heatwaves. Available at: https://nccarf.edu.au/wp-content/uploads/2019/04/Synthesis-Summary_Heatwaves_web-1.pdf
National Weather Services . (2017). Major Hurricane Harvey – August 25–29, 2017. Available at: https://www.weather.gov/crp/hurricane_harvey
New York City Environmental Protection . (2010). New York City Green Infrastructure Plan. Available at: https://www.nyc.gov/assets/dep/downloads/pdf/water/stormwater/green-infrastructure/nyc-green-infrastructure-plan-2010.pdf
Nishida, T. (2019). Green infrastructure in Japan -from the past discussion to perspectives. Japan Soc. Civil Eng. Magazine 104, 10–11.
Ogasawara, Y., Taura, F., and Shimatani, Y. (2018). Flood and CSO suppression effect by green infrastructure targeting upstream Zempukuji-River basin. Ann. J. Hydraulic Eng. 74, I_355–I_360. doi: 10.2208/jscejhe.74.5_I_355
Oshima, M., Ishido, T., and Boiten, W. (2013). Discharge coefficient for full-width sharp-crested high weirs. J. Japan Soc. Civil Eng. 1, 360–365. doi: 10.2208/journalofjsce.1.1_360
Pallathadka, A., Sauer, J., Chang, H., Chang, H., and Grimm, N. B. (2021). Urban flood risk and green infrastructure: who is exposed to risk and who benefits from investment? A case study of three U.S. Cities. Landsc. Urban Plann. 223:104417. doi: 10.1016/j.landurbplan.2022.104417
Pirouz, B., Palermo, S. A., and Turco, M. (2021). Improving the efficiency of green roofs using atmospheric water harvesting systems (an innovative design). Water 13:546. doi: 10.3390/w13040546
Rehbock, T. (1929). Wassermessung mit scharfkantigen Ueber-fallwehren. Zeitschrift des Vereines Deutscher Ingenieure. 73, 817–823.
Rojas, C., Sepulveda, E., Jorquera, F., Munizaga, J., and Pino, J. (2022). Accessibility disturbances to the biodiversity of urban wetlands due to built environment. City Environ. Interact. 13:100076. doi: 10.1016/j.cacint.2021.100076
Sahani, J., Kumar, P., Debele, S., Spyrou, C., Loupis, M., Aragao, L., et al. (2019). Hydro-meteorological risk assessment methods and management by nature-based solutions. Sci. Total Environ. 696:133936. doi: 10.1016/j.scitotenv.2019.133936
Sarwar, S., and Alsaggaf, M. I. (2020). The willingness and perception of people regarding green roofs installation. Environ. Sci. Pollut. Res. 27, 25703–25714. doi: 10.1007/s11356-020-08511-y
Science Council of Japan . (2014). Recommendations for the use of ecological infrastructure in reconstruction and National Land Resilience (translated by author, original title: Fukkou-kokudo-kyoujinka ni okeru seitaikei-infrastructure katsuyou no susume). Available at: https://www.scj.go.jp/ja/info/kohyo/pdf/kohyo-22-t199-2.pdf
Shiga Prefectural Government . (2012). Reasons for using centralized model rainfall based on the Shiga prefecture rainfall intensity equation (translated by author, original title: Shigaken-kouu-kyodoshiki ni motoduku chuo-shuchugata-model-kouu wo mochiiru riyu ni tsuite). Available at: https://www.pref.shiga.lg.jp/file/attachment/19769.pdf
Shimatani, Y., Iwasa, Y., and Kitae, Y. (2019). Toward the promotion of implementing green infrastructure. J. Jpn. Soc. Civ. Eng. Magazine 104, 14–19.
Song, P., Guo, J., Xu, E., Mayer, A. L., Liu, C., Huang, J., et al. (2020). Hydrological effects of urban green space on Stormwater runoff reduction in Luohe. China Sustain. For. 12:6599. doi: 10.3390/su12166599
Takeda, M., Morita, Y., and Matsuo, N. (2007). Application of inundation analysis considering sewer system to measures for flood disaster prevention. Jpn. Soc. Civ. Eng. 51, 529–534. doi: 10.2208/prohe.51.529
Tan, K., and Wang, J. (2023). Substrate modified with biochar improves the hydrothermal properties of green roofs. Environ. Res. 216:114405. doi: 10.1016/j.envres.2022.114405
Tsatsou, A., Frantzeskaki, N., and Malamis, S. (2023). Nature-based solutions for circular urban water systems: a scoping literature review and a proposal for urban design and planning. J. Clean. Prod. 394:136325. doi: 10.1016/j.jclepro.2023.136325
Ujihara, T., Abe, H., Murata, N., and Washi, N. (2016). Reality of “spongy urban area” in local city: based on situation of development and loss, vacant house. J. Japan Soc. Civil Eng. 72, 62–72. doi: 10.2208/jscejipm.72.62
United States Environmental Protection Agencies . (2023). What is Green Infrastructure? Available at: https://www.epa.gov/green-infrastructure/what-green-infrastructure
Vainik, M. K., Kill, K., Espenberg, M., Uuemaa, E., Teemusk, A., Maddison, M., et al. (2022). Urban stormwater retention capacity of nature-based solutions at different climatic conditions. Nature Based Solut. 2:100038. doi: 10.1016/j.nbsj.2022.100038
Venter, Z. S., Barton, D. N., Izquierdo, L. M., Langemeyer, J., Baro, F., and Phearson, T. M. (2021). Interactive spatial planning of urban green infrastructure – retrofitting green roofs where ecosystem services are most needed in Oslo. Ecosyst. Serv. 50:101314. doi: 10.1016/j.ecoser.2021.101314
Versini, P. A., Ramier, D., Berthier, E., and Gouvello, B. (2015). Assessment of the hydrological impacts of green roof: from building scale to basin scale. J. Hydrol. 524, 562–575. doi: 10.1016/j.jhydrol.2015.03.020
Willi, H. H., Oscar, C. O., and Kolumban, H. (2019). Correspondence between de saint-Venant and Boussinesq. 1: birth of the shallow-Wtaer equations. Comptes Rendus Mecanique 347, 632–662. doi: 10.1016/j.crme.2019.08.004
World Bank Tokyo Development Learning Center . (2021). Evolution of quality infrastructure Investment in Japan, 12–13. Tokyo: World Bank Tokyo Development Learning Center.
World Green Infrastructure Network . (2021). Key Definition: Green Roof. Available at: https://worldgreeninfrastructurenetwork.org/key-definition-green-roof/
Xu, H., Randall, M., and Fryd, O. (2023). Urban stormwater management at the meso-level: a review of trends, challenges and approaches. J. Environ. Manag. 331:117255. doi: 10.1016/j.jenvman.2023.117255
Yamada, S., and Shibata, M. (2017). Quantitative evaluation of rainfall-runoff characteristics of rain gardens (translated by author, original title: Amaniwa no kouu-ryushutsu-tokusei no teiryou-teki hyouka). J. Jpn. Soc. Reveget. Technol. 43, 251–254.
Yao, L., Wu, Z., Wang, Y., Sun, S., Wei, W., and Xu, Y. (2015). Does the spatial location of green roofs affects runoff mitigation in small urbanized catchments? J. Environ. Manag. 268:110707. doi: 10.1016/j.jenvman.2020.110707
Zhang, M., He, J., Liu, D., Huang, J., Yue, Q., and Yajing, L. (2022). Urban green corridor construction considering daily life circles: a case study of Wuhan city, China. Ecol. Eng. 184:106786. doi: 10.1016/j.ecoleng.2022.106786
Keywords: climate change, green roofs, bioswales, pluvial flood, urban runoff analysis
Citation: Kinoshita T and Ozaki T (2024) Estimation of possible locations for green roofs and bioswales and analysis of the effect of their implementation on stormwater runoff control. Front. Clim. 6:1287386. doi: 10.3389/fclim.2024.1287386
Edited by:
Kazunori Nakajima, University of Hyogo, JapanReviewed by:
Robert V. Rohli, Louisiana State University, United StatesCopyright © 2024 Kinoshita and Ozaki. This is an open-access article distributed under the terms of the Creative Commons Attribution License (CC BY). The use, distribution or reproduction in other forums is permitted, provided the original author(s) and the copyright owner(s) are credited and that the original publication in this journal is cited, in accordance with accepted academic practice. No use, distribution or reproduction is permitted which does not comply with these terms.
*Correspondence: Taira Ozaki, b3pha2lfdEBrYW5zYWktdS5hYy5qcA==
Disclaimer: All claims expressed in this article are solely those of the authors and do not necessarily represent those of their affiliated organizations, or those of the publisher, the editors and the reviewers. Any product that may be evaluated in this article or claim that may be made by its manufacturer is not guaranteed or endorsed by the publisher.
Research integrity at Frontiers
Learn more about the work of our research integrity team to safeguard the quality of each article we publish.