 Thomas Anderl
- BHU Research, Altenstadt, Germany
Climate change is decomposed into the driving terms allowing long-term projection of the natural and economic impacts. As a result, in the case of carbon emissions reduction by 2% per year from the present, the atmospheric CO2 concentration is expected to return to preindustrial values in about 1,000 years, temperature and sea level rise to approximately peak at 1°C and 5 m above the present levels by then, and the entailed economic burden to grow to 1.4% of the current global gross domestic product. Ninety percent of the required emissions reduction are anticipated achievable through cost neutrality. To take advantage of the potentially bearable impact, humankind is obliged to fulfill certain prerequisites near-time: (i) CO2 emissions reduction must be at least 2%/year at global level; (ii) economic growth may not continue to jeopardize emissions reduction efforts, thus far contributing with an emissions rise of 1.7%/year; (iii) due to the economic interlinkage, global coherence of regulatory measures must be established, proposedly commencing with a sizable group of countries, the rules comprising economic penalization of non-participants. The presented insight is associated with the potential to alter the social decision mode.
1. Introduction
Definitely, climate change sciences have left infancy. Yet, significant skepticism has remained within society. The present work aims to narrow the divide between sciences on the one hand and skepticism on the other hand, particularly addressing science communication. Detailed analysis has been performed on a series of aspects with the focus to uncover reproducibility of the results from sophisticated research since transparency is regarded key to facilitating common understanding (Anderl, 2021a,b,c,d, 2022a,b,c,d). The covered topics are in brief: reading the temperature contribution of atmospheric CO2 for equilibrium climate states from paleo-data (Anderl, 2021a); revealing near-proportionality of this temperature contribution to the atmospheric concentrations of CO2 and associated H2O (Anderl, 2022a); quantifying the cooling effects of CO2 and H2O by simple modeling (Anderl, 2021b); decomposing equilibrium climate states within Earth's energy budget (Anderl, 2021c); consolidating CO2 emissions data by contributing sector (Anderl, 2021d); projecting the atmospheric CO2 concentration on the millennium time scale (Anderl, 2022b); disentangling the CO2 emissions from land use change to detect mitigation potentials (Anderl, 2022c); estimating the transition cost for the zero-CO2 world (Anderl, 2022d). The present article synthesizes the essentials viewed required to form a common information base.
Abundant previous scientific studies have covered the consequences of continued business as usual. As an unequivocal conclusion, faineance is not an option. From recent impression, social dedication has evolved to seriously reduce carbon emissions. This has been the starting point of the present study. It focuses on the prospects from noticeable emissions reduction and explores the prerequisites that serious emissions reduction is given a realistic chance.
The methodological point of departure is the general experience that any subject, even those of the highest complexity, can be described by few driving terms in a readily accessible manner. In the present study, this is applied to climate change by decomposing the natural, economic, and broader social circumstances into their essentials. Since the emphasis lies on the driving terms and orders of magnitude, uncertainties are selectively addressed with further reference to previous sophisticated research, and the concentration is focused on the global view.
The present work is novel in a series of aspects each anticipated to significantly contribute toward a common comprehension base within broader society. (i) Skeptics contest the climate role of CO2; major arguments are that the generally communicated information originates from untransparent computer programs and that the greenhouse analogy is inappropriate. It is shown that the climate impact of CO2 exhibits a consistent footprint through Earth's history of several hundred million years, including the amplification by temperature-dependent effects (e.g., due to albedo change). The amplification by water vapor is explained in plain terms. The temperature contributions of CO2 and H2O are inferred to proportionally follow their concentrations which is elucidated by a simple comprehension model. (ii) Terrestrial vegetation is found to potentially remove the anthropogenic CO2 from the atmosphere on the millennium horizon. The associated trends of temperature and sea level are derived from basic understanding. (iii) Climate change impact cost is deduced with a linear relationship to temperature and sea level rise. The transition toward low-CO2 emissions is found possible at nearly neutral cost. Future climate-induced cost is projected without employing a discount rate. (iv) The comprehensiveness of the present description and the underlying focus on the essentials and driving terms are unique to the present knowledge.
A diversity of methods is applied through the present analysis as summarized in Figure 1 (see the subsequent main section for related references). The anthropogenic CO2 emissions are determined by publicly available data on fossil material consumption and cement manufacture, by a new framework for the land use contributions, and by incorporation of the general impact from economic activity. The entailed atmospheric CO2 concentration is inferred with help of a driving-term model for the CO2 uptake from the atmosphere by the oceans and the terrestrial vegetation, overlaid by mitigation scenarios. The temperature impact of CO2 is read from paleo-observations for equilibrium climate states and determined by a simple driving-term model for the ongoing transient climate states. The equilibrium CO2-temperature relationship is related to the atmospheric greenhouse gas concentrations based on the blackbody energy-temperature correlation. This temperature-concentration relationship is consistent with energy budget considerations and estimations from a practicable shortwave emittance framework. The temperature-entailed sea level change is derived by means of a simple driving-term model. The mitigation cost determination employs a new lifecycle framework for electricity and heat in combination with previously published results for the other sectors. Costs for residual damage after mitigation and adaptation are projected according to a novel model with linear dependencies on temperature and sea level rise superimposed by a driving-term focus. Adaption cost is approximated as linear to the cost from residual damage. General societal conclusions are presented by emphasizing the opportunities and risks.
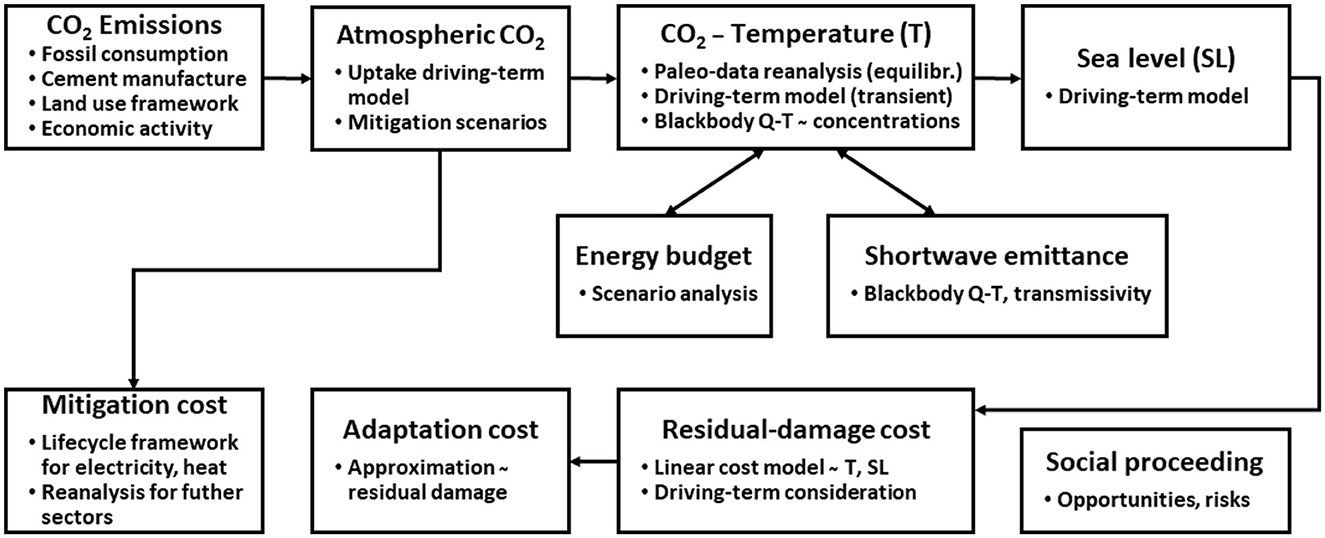
Figure 1. Methods applied in the present analysis, see text for further details.
2. Methods and results
2.1. Understanding nature through its essential terms
2.1.1. Temperature fundamentals
It appears helpful to understand the natural temperature dependencies by the following driving terms. First of all, Sun's irradiation is the primary energy supplier on Earth, and its irradiance variability is the predominant driving force of Earth's temperature variability.
In the atmosphere, the vertical temperature distribution can be understood from a fundamental pattern superimposed with five regional effects. Fundamentally, the temperature follows the exponential pressure decrease with altitude, dry-adiabatically linearized below about 15 km. This is superimposed with three “warming bellies” within the lower ~50 km: close to the surface from longwave absorption particularly on water vapor and CO2, up to a height of ~10 km from water vapor condensation, and at an altitude of roughly 50 km from shortwave absorption on ozone. Cooling contributions come from longwave emittance to space by water vapor at around 5 km and by CO2 between 20 and 50 km; the emittance altitudes increase with surface temperature. The main drivers of variabilities, in addition to insolation, are the densities of the mentioned species and the surface temperature.
The surface temperature contribution of CO2 can be read from nature's past as TCO2 = 6.68 * ln(pCO2/22) °C (TCO2 for mean global annual surface temperature in °C; pCO2 for atmospheric CO2 volume mixing ratio in ppmv) comprising all related effects, e.g., amplification by water vapor. Through the present work, this dependency is termed the “Eocene relationship” with reference to its observational origin (Anderl, 2021a). It turns out that this comprehensive relationship is virtually identical to the frequently used Myhre formula for the radiation contribution of CO2 (Myhre et al., 1998) when multiplying the latter by 1.25°C/(W/m2).
The amplification of the CO2-temperature contribution by water vapor can be understood using the following concept. At the interface with the ocean surface, the atmosphere holds water vapor at its saturation pressure. At a small distance above the surface, this water vapor is distributed horizontally across the globe, leading to global average relative humidity quite independent of global mean surface temperature. Thus, the global mean atmospheric water vapor concentration follows the temperature dependency of the saturation vapor pressure.
The temperature contributions from CO2 and H2O are further amplified by temperature-driven effects, particularly albedo changes caused by snow/ice mass changes. This amplification is read from the glacial and interglacial cycles of the past 800,000 years as a factor of 1.4 to the Eocene relationship (Anderl, 2021a, 2022a,b).
The observed compound temperature contribution of CO2 and H2O (Eocene relationship) can be described by the (near-)proportionality of the absorbed longwave radiation to the number densities of the absorber molecules (Supplementary material S1) (Sn referring to Supplementary text paragraph n). Owing to its significance, this finding requires further discussion.
The present study strongly supports this proportionality on the basis of the extraordinary consistency throughout a series of quantitative considerations: covering a diversity of phases through Earth's history [the past 800,000 years, the period of 35–50 million years ago, the past 400 million years (Anderl, 2021a), the period one to four billion years ago with the potential to resolve the faint young Sun paradox (Anderl, 2021b)] and a series of interrelated properties of nature [surface temperature, longwave emittance to space (Anderl, 2021b), energy budget (Anderl, 2021c), ocean heating (Anderl, 2022a), cloud feedback (Anderl, 2021b)]. The proportionality contrasts, however, the common concept of CO2 longwave absorption to run in saturation mode. The resolution is proposed as follows. The saturation comprehension is a view “from the rear”: Picturesquely, increasing the thickness of a concrete wall (theoretically beyond a certain point) leaves the darkness behind the wall unchanged; this equally means that the transmitted energy remains constant and conversely, the energy absorbed by the wall stays constant, i.e., in saturation. The mentioned proportionality (of the temperature-determining longwave absorption to the absorber particle densities) appears explainable by a view “from the front”: Imagining sitting before the concrete wall at sunshine, the wall feels cold; placing a thin dark wooden plate before the wall renders the temperature more agreeable, this effect increasing with increasing thickness of the wooden plate (up to a certain point). This analogy means that the radiative warming contributions of CO2 and H2O appear in the very vicinity of the surface. With increasing CO2 concentrations, limitations are expected on the density proportionality. From the present study, the proportionality holds up to ~10 times the preindustrial CO2 concentration, with a corresponding mean global surface temperature of 31°C (Anderl, 2021b,c).
2.1.2. Equilibrium and transient climate states
Earth appears to continuously seek balanced energy conditions, that is, radiation emittance to space tends to equal the absorbed solar irradiation. When insolation changes from one steady state to another, Earth establishes a new equilibrium state by changing the emitted radiation such that it equals again the newly absorbed energy. In the case where energy conditions change internally (for example, variation of the atmospheric CO2 concentration causing the atmospheric absorption of surface longwave radiation to change), the radiation to space remains constant.
The inertia of the oceans renders the transition from one equilibrium state to the next asymptotic on a millennial time scale, creating an intermediate sequence of transient states. The Eocene relationship is understood to relate to equilibrium climate states. Applied to the industrial era as a rule of thumb, Earth has until now passed about one-third of the total route to the next equilibrium state in case of immediate anthropogenic emissions cease (and constant atmospheric CO2 concentration from the present) (Anderl, 2022a).
2.1.3. Atmospheric CO2 concentration
The Eocene relationship reveals the significance of the atmospheric CO2 concentration for the surface temperature variability. During the industrial era, the CO2 concentration is strongly influenced by the anthropogenic emissions on the one hand and the natural uptake (removal) from the atmosphere on the other hand. Predominantly on the millennial horizon, CO2 is removed by the ocean waters and terrestrial vegetation. While rather strong in the past, the natural net removal will weaken in the tail of the increasing CO2 concentrations and temperatures.
According to the present analysis, the terrestrial vegetation prominently shapes the future CO2 development. Here, the dependencies on temperature and atmospheric CO2 concentration are treated separately for uptake due to biomass growth (e.g., fertilization effect) and carbon release from the ground [(Anderl, 2022b) slightly adapted to Zhou et al., 2009; Bond-Lamberty and Thomson, 2010; Schimel et al., 2015; Wu et al., 2016, further details in Supplementary material S2]. The resulting atmospheric CO2 concentrations are shown in the left part of Figure 2 from the past through the next about 1,300 years for various emissions reduction scenarios labeled n % for an annual (geometric) reduction of n %/year, i.e., 1–4%/year (colored lines) and 100%/year (black lines), the latter corresponding to an immediate emissions cessation (“zero-emissions” scenario). For a sensitivity analysis, the initial availability of soil carbon for respiration is considered with 200 and 1,000 (dotted and dashed lines), and 1,500 GtC (solid lines, preferred through the present description), accordingly labeled in Figure 2. The lower values are arbitrarily chosen to size the influence, the upper value is comprehended to reflect the currently available soil carbon stock. For illustration reasons, concentrations above 440 ppmv are cut from the presentation in Figure 2.
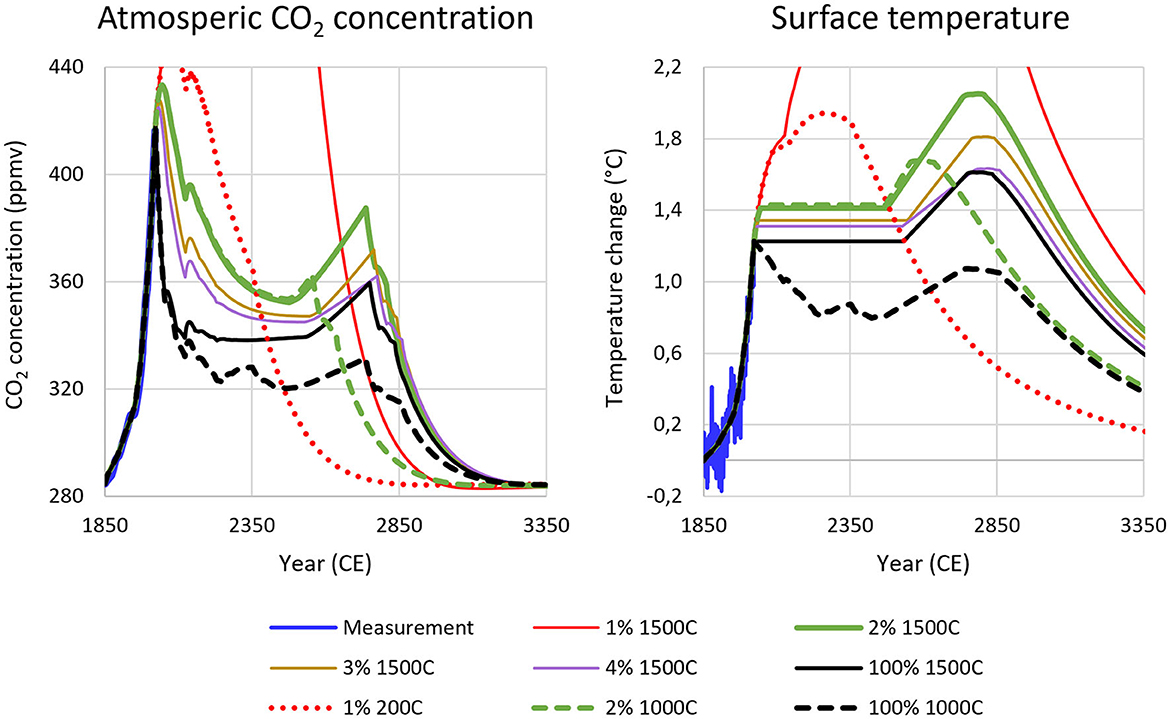
Figure 2. Atmospheric CO2 concentration (Left), relative mean global annual surface temperature (Right). Solid blue: measurements on the past (barely recognizable for CO2); other colors: present computation. Solid: preferred; dashed, dotted: sensitivity study on soil respiration. n%: annual (geometric) reduction of anthropogenic carbon emissions by n %/year; mC: initial soil carbon stock available for respiration amounting to m GtC. Red: partly capped for presentation reasons.
In the zero-emissions case (black lines, Figure 2, left), the CO2 concentration is expected to decrease to 320–340 ppmv within the next around 500 years, the levels of the years 1960–1980. The second bump further in the future mainly originates from soil respiration, as supported by sophisticated simulation studies (MacDougall et al., 2020). In case of 2%/year emissions reduction (green lines), the atmospheric CO2 concentration will follow the same pattern with roughly 10–30 ppmv higher intermediate levels. All scenarios exhibit a return to preindustrial concentrations on the millennial horizon.
In case of emissions reduction by 2%/year, the total anthropogenic carbon emissions will be 1,170 GtC, or 500 GtC from year 2020 into the future, the latter corresponding to the frequently regarded “carbon budget.”
2.1.4. Temperature projection
To derive the entailed temperature (including amplification particularly from albedo change), the present simplified approach approximates the asymptotic influence of the oceans by simple functions (linear and tanhyp where eighty percent of equilibrium are reached after roughly 800 years, based on Anderl, 2022b). The resulting temperature evolution is shown in the right part of Figure 2. The zero-emissions bias (solid black line) is estimated to be 1.2–1.6°C above preindustrial temperatures for the next 800–1,000 years before finally following the CO2 concentration downward. In case of 2%/year emissions reduction from the present (solid green line), the millennial-horizon temperatures are expected to peak at 2.1°C in ~750 years, the peak half-width (time span at 1.75°C) amounting to 350 years. The case of 1%/year emissions reduction reveals temperatures up to 4.7°C from the preindustrial levels for the likely initial soil respiration stock of 1,500 GtC (solid red line). Such a temperature increase is judged irresponsible. In this emissions reduction case, temperatures might remain below 2°C warming if soil respiration would be far lower (initial stock 200 GtC, dotted red line), which is attributed to high risk of being unrealistic.
2.1.5. Sea level projection
To first order, global sea level change has its primary origin in temperature change. For the future, the present first-order estimation indicates 10% to originate from ocean heating and the bulk from land ice loss (Supplementary material S3). Global sea level alteration can regionally be superimposed with vertical land motion—partly dominated by anthropogenic resource exploitation, particularly of groundwater. A summary on the present analysis is presented in the next lines (details in Supplementary material S3, S4).
On the one hand, global sea level is inferred to rise with surface temperature by 4.8 m/°C for temperatures up to 2.5–3°C above present, increasing to 26 m/°C in hotter climates (Supplementary material S3).
On the other hand, the pace (of global sea level rise) is understood to be limited by inertia, particularly of ice melting. During the recent glacial-interglacial cycle, sea level rose at a maximum of 1.3 m/century in the period of 17,000 to 9,000 years ago; since then, velocity has averaged at 0.2 m/century, currently amounting to 0.34 m/century. For projection, sophisticated studies conform to a maximum future pace of 0.4–0.5 m/century (Supplementary material S3). With these latter velocities and for 2%/year emissions reduction (solid green lines in Figure 2), global sea level rise is estimated to peak in the order of 5–6 m in 1,100 years from now (Supplementary material S3).
Region-specific downward land motion (subsidence) is currently reaching, for example, 1.6–3 m/century in Bangkok and the Mekong Delta, and even 10–20 m/century in Indonesia, a. o. in the megacity Jakarta (Supplementary material S4). For Chittagong (Bangladesh), the median of the present land subsidence rate has been assessed to 1.2 m/century. With 0.5 m/century of future global sea level rise, vertical land motion will amplify the impact of global sea level rise by a factor of 2.7 by year 2100—when considering constant velocities from the present, expected population growth of 330%, and half of the population growth affected (Supplementary material S4).
2.1.6. Disastrous events
2.1.6.1. Heat waves, extreme rainfall, droughts
Principally, warmer temperatures are expected to be accompanied by an increase in frequency, strength, and duration of heat waves, droughts, and high-precipitation events. For an analysis, the frequently used data sets HadEX3 and GHCNDEX have been examined at the global level, the former reaching back to 1900 with strong concentration in North European regions, the latter starting in 1951 with additional regional focus, for instance, in North America. The following signals are inferred from the data (Supplementary material S5).
The length of the heat waves has increased after 1995 to roughly 13–23 days/year from 3 to 13 days/year before. A jump in average precipitation may have appeared recently, subject to statistical confirmation in the future. Heavy rain events have started to increase in about 1975 (in line with temperature) at a rate of ~3–6%/decade, translating into 17–33%/°C in tail of warming, and tend to leave the (predominantly natural) variability range of the twentieth century in the present century. In comparison with extreme floods in the past 150 years (Paprotny et al., 2018), the frequency of extreme events has risen above previous levels since approximately 1983. However, regarding extreme floods in Europe during the past 500 years, no clear particularities can be inferred for the past several decades (Blöschl et al., 2020). Regarding droughts, the two data sets exhibit opposite duration trends during most of the overlapping measurement period (i.e., 1960–2010) and no cyclic frequency change; the long-term data remain within the century variability.
It should be noted that the observations on the past do not preclude juvenile trends; related inference and projection need to rely on simulations first. Furthermore, the present spatially coarse consideration is taken as an indicator of overall probabilities leaving plenty of room for regional specifics.
2.1.6.2. Tipping points
By the meaning, tipping point refers to the state in a process where return to the initial state (or a preceding state) is inhibited by significant-to-infinite hysteresis (irreversibility), with or without self-perpetuation. An example of this is the loss of polar ice. As long as sizable ice is present, nature has a straightforward means of recuperating losses. In contrast, once Earth is completely ice-free, the build-up of new ice sheets requires a very long period of cold conditions. Related to the present results, if nature will indeed follow the solid green lines of Figure 2 (upon humankind's 2%/year emissions reduction), the inferred 5–6 m sea level rise corresponds to a loss of approximately eight percent of predominantly polar ice. Thus, nature will be far from the regarded tipping point.
As a further example, significant changes (up to a collapse) are expected for the Atlantic Meridional Overturning Circulation (AMOC) at rising temperatures, noticeable probabilities starting at (mean global annual) temperatures as low as 1.4°C above preindustrial levels. However, the most likely threshold for a collapse has been identified as 4°C warming (McKay et al., 2022). Therefore, with serious anthropogenic emissions reduction (e.g., 2%/year), AMOC changes may be regarded gradual and at fair distance from the tipping point.
However, significant losses are anticipated for coral reefs, mountain glaciers, Tibetan Plateau snow, Barents winter sea ice, Arctic summer sea ice, boreal forest, and subpolar gyre oceanic convection (Labrador Sea)—all primarily with local impacts. For this list, the frequently discussed tipping points have been filtered for a world of warming containment in the order of 2°C and for low uncertainty reported by previous research (McKay et al., 2022).
2.1.6.3. Mass extinction
It has been hypothesized that mass extinctions in Earth's history have been related to carbon input into the oceans, the critical amount inferred to be 310 ± 155 GtC for current conditions (Rothman, 2017). The present simplified approach (cf. Figure 2) indicates a long-term cumulated uptake of the oceans in the order of 325 GtC, independent of the emissions reduction scenario due to the restricted buffer capacity of the oceans.
2.2. Social challenges
2.2.1. Preparedness for CO2 emissions reduction
The present considerations anticipate future carbon emissions reductions well above 1%/year worldwide. This presumption appears justified when examining previous trends and political decisions for the future. In the past, the United States and the European Union have managed to reduce emissions by 20–25% in the period of 15–30 years until 2019; emissions flattening has occurred in Australia, South America, and North America ex United States during the last one to two decades (Ritchie et al., 2020). For the future, the expressed country plans correspond to a global emissions reduction of 4.8%/year (year-on-year) from year 2030 onwards for the sectors of fossil and industry (Ritchie et al., 2020; Net zero emissions race, 2022). Based on subjective general experience, 3%/year reduction appears possible yet ambitious (e.g., translating into 26% reduction in 10 years or 70% in 40 years). In conclusion, society can be considered well prepared for the required future reductions.
For this decade, however, China's current emissions (rising in the order of 4%/year) and abstinence from reduction plans reduce the global reduction commitments to 0.4%/year for fossils and industries.
2.2.2. Mitigation potentials and costs
At global level, it is possible that ~90% of the present CO2 emissions can be abated at neutral cost [(Anderl, 2022d) supported by Deng et al., 2011, Supplementary material S6]. Regarding the total lifecycle cost/benefit, net cost contribution is attributed to forestry, cost/benefit balance to the power sector (levelized costs of renewables having approached those from fossils), and net benefits to the other sectors (Supplementary material S6). Regarding the investment volumes, as example, if half of the current investments in the fossil sector are redirected to renewables (photovoltaic and wind) every year, this translates to a 2%/year reduction of total CO2 emissions (Supplementary material S6).
At the level of regional specifics, the transition toward low/zero-CO2 also appears possible in cost-neutral manner. This is concluded from previous studies, e.g., on Costa Rica as an example for urban decarbonization (IRENA, 2022) as well as on Nigeria (Agajelu et al., 2013) and Gilutongan Island, Philippines (Lozano et al., 2019), as examples for rural off-grid energy transformation. In the latter studies, hybrid diesel-photovoltaic solutions have been proposed for the future. In the Nigeria case, the CO2 emissions reduction is inferred to about 85% as compared to a diesel-only solution. As further instance, cost reduction is expected by a study on (non-grid-interconnected) Donoussa Island, Greece, for replacement of the present petroleum-based electricity generation by a zero-CO2 photovoltaic-wind-battery solution (Katsivelakis et al., 2021): The renewables-based solution is projected to reduce levelized cost in the order of 60–70% from the present (Katsoulakos, 2019).
Looking at prudent use of land, the abatement potential is 5.7 GtC/year or about 50% of present total emissions from five activity types (Anderl, 2022c): (i) replacement of coal by biomass in electricity production (requiring 50% of available land), 2.4 GtC/year; (ii) uptake entailed by the planting of trees in course of the Bonn Challenge programme and the associated UN New York Declaration, 1.1 GtC/year; (iii) soil sequestration from changes in agricultural management practices, 1.0 GtC/year; (iv) gasoline substitution by photovoltaic on urban buildings for light-duty vehicles, 0.8 GtC/year; (v) waste utilization, 0.4 GtC/year. If implemented through 30 years, the corresponding emissions reduction amounts to 2.3%/year of the total present emissions.
It is emphasized that land is a scarce resource and, hence, must be restrictedly used for high-efficiency applications. Further, the inferred cost neutrality is the result of the global generalization from (large-scale) regional experiences. Thus, conclusions at a particular local level may require specific differentiation. Last but not least, future utilization of natural resources may not just relocate or substitute the damages caused in the past.
2.2.3. Economic mitigation stimulus
There is a wide-spread desire to economically stimulate emissions abatement beyond the (predominant) overall cost neutrality and particular cost savings potentials. Frequently discussed means of stimulation are CO2 pricing (taxation) and CO2 certification, with the aim of having free-market forces pushing the envisaged transformation.
Either means lift the prices of products according to their associated CO2 emissions with the intent of strengthening the competitiveness of low-emission products. The immediate effect is a general increase in personal expenditure. For instance, a CO2 levy of 50 $/tCO2 means an additional annual burden for each US citizen of 720 $/person/year, and in Europe likewise (50 Euro/tCO2) an annual expenditure increase of 300 Euro/person/year. Heating costs would be elevated by ~30% at 50 $/tCO2 or doubled upon 150 $/tCO2 (Anderl, 2022d), with residential heating contributing 5% to total emissions on global average (based on Anderl, 2021d). The impact of CO2 taxation on inflation (“greenflation”) depends on the implementation period.
As alternative abatement enforcement means, legislative regulations have always been in place (including subsidization). Besides completely voluntary measures, regulation is an inherent component of any mitigation-stimulation approach. Thus, the actual question concerns the extent of regulation in conjunction with free-market forces.
Prerequisite to climate-effective CO2 levying is international coherence; otherwise, the result is inter-regional economic competition instead of inter-technical competition toward abatement. Similarly, regulation measures are only climate-effective if followed on a global scale. One solution may be that dedicated countries unite as an initial nucleus and enforce their business partners to adhere to a set of defined rules. As key performance indicator, the yearly emissions reduction appears as a natural choice in view of its practicability in monitoring, reporting, and verification.
2.2.4. Economic activity driving CO2 emissions
Economic activity is tightly correlated with energy consumption, and energy consumption used to directly translate into CO2 emissions; for completeness, emissions from energy consumption are regarded as a good measure for the additional emissions from land use—as a rule of thumb, land use emissions can be approximated by 20% of those from fossils and cement (Anderl, 2022c).
Through the past about one-half century, economic activity (as measured by GDP, gross domestic product) has increased by 3.4%/year, composed of GDP/capita and population with 2 and 1.4%/year, respectively; energy supply per unit of GDP has decreased by 1.3%/year; hence CO2-relevant GDP growth has amounted to 2.1%/year. Thus far, CO2 emissions per unit of energy supply have decreased by 0.4%/year leading to 1.7%/year CO2 emissions increase (Supplementary material S7).
With these growth rates, 3.7%/year of present emissions must be mitigated relative to unchanged GDP growth if total CO2 emissions need be reduced by 2%/year. This appears ambitious if not unrealistic and calls for lowering of economic growth as an additional, highly effective, and cost-efficient abatement measure.
The 90% of cost-neutral emissions reduction mentioned earlier is feasible without carbon capture and utilization/storage (CCUS) (Anderl, 2022d, Supplementary material S6) (cf. Section 2.2.2). At this point, CCUS is considered costly, environmentally risky, and juvenile. Nevertheless, it is required particularly to tackle the residual 10% of persistent emissions and potentially, to mitigate future additional emissions caused by economic growth. Regarding CCS for the latter with the preceding growth figures, it is estimated that the available CO2 storage potential will be exhausted by the end of this century; the annual cost will consume ~0.2% of GDP for Europe, USA, and China combined, and 0.6% of GDP worldwide (Supplementary material S7).
2.2.5. Adaptation and residual damage costs
Adaptation to the changing conditions is required in addition to abatement (mitigation). From basic principles, rising temperatures bear the growing risk of damaging events, such as wildfires from longer fire seasons and coastal flooding from sea level rise. Adaptation is a means to reduce the impact of climate change, here viewed through the glasses of 2%/year emissions reduction (cf. solid green lines in Figure 2).
Generally, adaptation economics has been discussed in terms of several metrics. First, consideration is differentiated by sectors such as agriculture (with forestry and fisheries), water supply, human health, coastal and low-lying settlements (related to floods and storms), natural ecosystems, and infrastructure. Second, countries are characterized if their current asset level (particularly in the infrastructure) adheres to a presumed standard (“standard-based”) or is below-standard due to little investments in the past (reflecting an “investment deficit”).
As an example for previous studies, the estimates are [(Parry et al., 2009), therein 200-years horizon discounted back to year 2060, here further scaled back to year 2022 by 1.5%/year GDP growth rate, total costs with constant ratios to GDP]: (i) the total global costs (all sectors) relate to 0.1% of GDP for standard-based adaptation, 0.3 %/GDP for deficit elimination during 20 years, and 0.7 %/GDP for residual damage. (ii) The population in hazard-prone coastal/low-lying areas is expected to grow by 55 million in 2020-2080 if sea level remains unchanged and by further 40 million from the anticipated 35 cm of sea level rise. (iii) Standard-based adaptation is assessed to require US$ 50 bn/year, equal to the present investments (Buchner et al., 2021).
Within the present work, the cost of a 5–6 m sea level rise in 1,100 years (as projected above) is estimated on the base of the following first-order relationships: The annual total cost is regarded as driven by adaptation investment and residual damage, optionally expanded by asset loss due to abandonment. At this point, the adaptation cost is viewed as equal to residual damage (Hallegatte et al., 2013). The assets at risk can be considered as proportional to the GDP (Supplementary material S8). Simultaneously, the assets at risk can be viewed as proportional to sea level rise under constant socioeconomic conditions (Supplementary material S8). Combined, assets-at-risk/GDP are proportional to sea level rise; this relationship is time-independent, assets at risk time-invariant in relation to GDP for constant sea level, superimposed with socioeconomic alterations.
This relationship framework allows us to readily project from the present conditions into the future. The data of three previous studies have been applied to this framework for a 5–6 m sea level rise with the following selected findings. (i) By income group, marginal annual total cost is indicated as 0.25 and 0.4% of GDP for high- and low-income countries, respectively (Brown et al., 2021, Supplementary material S8). (ii) At global level, data on vulnerable population leads to a total cost of 0.6% in relation to GDP. This cost is magnified by a factor of two if the present socioeconomic projections become reality for this century (Kulp and Strauss, 2019, Supplementary material S8). (iii) At country level, the following countries are revealed threatened with extinction, here implicitly indicated by total cost larger than 80% of GDP: Bahamas, Cayman Islands, Kiribati, Maldives, Marshall Islands, Suriname, Tuvalu (Kulp and Strauss, 2019, Supplementary material S8). These countries comprise 0.02% of global population and GDP. (iv) At town level for the largest coastal cities worldwide, a previous study presumes higher-order dependencies of damage/GDP on sea level rise for the first 30 cm (Hallegatte et al., 2013, Supplementary material S8). Projecting from the general pattern of these data, the following towns emerge as vitally affected, again measured by cost in relation to GDP (here larger than 70%) (Supplementary material S8): Haiphong (Vietnam), Khulna (Bangladesh), Guayaquil (Ecuador), Ho Chi Minh City (Vietnam), the former three with 2–3 million inhabitants, the latter (Ho Chi Minh City) with 9 million.
The economic losses from other causes than sea level rise are inferred to linearly correlate with surface temperature, the global annual average amounting to 0.2 % of GDP at present and to 0.8% at 2.1°C temperature rise above preindustrial levels (cf. Figure 2) (Supplementary material S9). Adding the cost from sea level rise, total climate change-induced cost is projected to peak at 1.4% of current GDP for 2%/year emissions reduction from the present (conservatively since supposing temperature and sea level to top at the same time).
It should be noted that the present work expects the sea level rise of 5–6 m in approximately 1,100 years from today, one-meter steps above preindustrial reached by round figures in the years 2100, 2400, 2600, 2900, and 3100. Temperature is expected to rise by ~1°C in the next 750 years. The thus expressed impact pace offers possibilities for soft or seamless transitions potentially bearing costs notably lower than the preceding figures.
2.2.6. Social decision making
Democracy is favored for its profound control mechanisms based on a broad population, with the inherent caveat of prolonged decision times. In contrast, totalitarian systems are generally characterized by (potentially) short decision paths at low control levels.
Climate change is a challenging subject in a democratic world. First, climate change is not only an abstract and complex topic with strong interrelationships, but its handling also requires global coherence. Second, a core challenge is to establish democratic structures with sufficiently low decision times. Third, widespread transparency is the fundamental prerequisite for successful progress in a democratic world. Fourth, the decision processes must concentrate on the sine qua non to give the necessary advancement a chance. The less these conditions are fulfilled, the more dictatorial elements that are expected to evolve.
3. Discussion
The present article presumes that society is ready to significantly reduce anthropogenic carbon emissions (see section 2.2.1). For concreteness, this discussion section is based on an emissions reduction of 2%/year (year on year).
3.1. Simple description of the essentials a must
Climate change is an exceedingly challenging global issue. Discussions and decision making indispensably require a common comprehension of the essentials. The present study attempts to identify the essentials and their simplest descriptions. This may serve as a foundation to reduce the components of fear and chaos to the social decision making in favor of the focus on the indispensable.
3.2. Uncertainties
As the present work focuses on the driving terms, simple descriptions, and orders of magnitude, detailed error calculation has been out of scope. Through the present text, uncertainties are mentioned in selective and implicit manner. From subjective comprehension, the presented results on nature are viewed with uncertainties in the range of ±50% within 75% of likelihood. Economic results are intended as orientational framework with the need of adaptation to actual specifics.
3.3. Reading nature on the climate effect of greenhouse gases
The temperature contribution from atmospheric CO2 has been obtained from nature's past, including the prevailing amplifications from water vapor and albedo change. The temperature-driving energy from longwave absorption in the atmosphere is found to follow the concentrations of atmospheric CO2 and entailed water vapor almost proportionally. This contrasts with the common description of a (strong) logarithmic dependency. Thus far, the proportionality has been convincing due to the overall consistency throughout the present analyses. The implication of the absorption-to-concentration proportionality is strong as it puts the concept of the Global Warming Potential (GWP) into perspective and consequently, moves the climate influence of methane to lower orders.
3.4. Anthropogenic CO2 emissions and atmospheric CO2 concentration
The future evolution of the anthropogenic carbon input into the atmosphere strongly depends on the natural uptake at land and by the oceans. The capacity of the latter needs to be considered limited; the limits are expected to be reached in few decades. Net uptake by terrestrial vegetation appears dynamic with the effect to slowly return the atmospheric CO2 concentration to preindustrial levels in roughly 1,000 years (upon an emissions reduction of 2%/year). This insight is certainly of high value for the social discourse.
3.5. Temperature and sea level projection
With the atmospheric CO2 concentration, the entailed temperature contribution will also return, for example, to 1°C above preindustrial levels in 1,200 years.
Sea level is anticipated to follow temperature with a peak at 5–6 m above preindustrial levels in around 1,100 years. Also, these results are certainly highly valuable information for the social discussions.
3.6. Emissions abatement/climate change mitigation
The techniques for significant emissions reduction are largely available, 90% of present emissions are abatable at neutral cost. This latter result is probably in line with the common communication of huge investment needs. While the present work looks at full lifecycle costs and presumes investment shifts between technologies (CO2-emitting in the past, CO2-clean in the future), the frequent communication is interpreted as focusing on the investment component. The (near) cost neutrality is certainly a further significant input to the various discussions.
Carbon capture and utilization/storage (CCUS) lies outside the cost-neutral measure portfolio. It is considered required as last resort for the residual ten percent of persistent emissions. If CCS is required to compensate for additional emissions due to economic growth, the storage potential may need to be anticipated as restricted, temporally to this century.
It is emphasized that emissions from land use need to be included in the emissions reduction programmes. Furthermore, it is noted that grown forests remove much less CO2 from the atmosphere than young forests do. The topic of loss or degradation of rainforests relates to the manner of deforestation (e.g., crude burning) and new land use (e.g., forest substitution by reckless agriculture) on the one hand, on the other hand to hydrology (with potentially far-reaching impact) and biodiversity.
3.7. Climate change adaptation and residual damage
For clearness, mitigation measures need to be considered separate from adaptation measures. Mitigation and adaptation require dedicated investments. In addition, adaptation financial needs need to be partitioned into raising assets to a standard level (making up previous investment deficits) and additional investments to protect against climate change impact. For the latter from a 200-years horizon translated to the present, the global financial need is estimated to the amount actually spent (about 50 billion US dollars per year). Deficit reduction is assessed to four times this amount for 20 years.
Focusing on sea level rise, the present cost estimation is based on a time-independent proportionality between cost/GDP and sea level rise overlaid by time-specific socioeconomic development. This allows to focus on the current cost without discounting between the future and the present. Based on two previous analyses for the estimated 5–6 m sea level rise in about 1,100 years, total costs are indicated as 0.25 and 0.4% of GDP for high- and low-income countries, respectively, and 0.6–1.2% of GDP at global level depending on the socioeconomic development during the next decades. In other words, the legacy burden from sea level rise on the future generations grows to 0.6% (or 1.2%) of the current GDP through ~1,100 years. In view of the rather slow pace of sea level rise, actual adaptation may potentially bear a lower cost.
Apart from sea level rise, the further climate-related economic losses are estimated as 0.8% of GDP at the peak warming of 2.1°C in 750 years. Principally, the economic losses are inferred to linearly rise with surface temperature. This contrasts prevailing economic modeling where much stronger dependencies are presumed. A clarification is of significant value for the entailed social discussions.
3.8. Intergenerational ethics
The previous generations have brought long-lasting progress to humankind, e.g., in medicine and pharmacy, largely enabled by fossil-based energy supply at the expense of long-lasting damages from climate change. The contemporary generations have the duty to reduce the carbon emissions by at least 2%/year, lower reductions judged irresponsible. The emissions abatement is possible cost-neutral to about 90%. The frequently considered social cost of carbon aims at quantifying the future damages in present terms. The future generations will suffer from the induced climate change, the price growing to 1.4% of GDP in current terms by the end of this millennium if the contemporary generations succeed in reducing the carbon emissions by 2%/year.
Changes principally bear inequalities. In the present context, for instance, the suffering from climate change is commonly strong in regions where the benefits from previous progress are low, e.g., regarding human health. The global society is asked to balance such inequalities, e.g., through support toward self-sufficient production of renewables equipment to enable sustainable welfare increase.
3.9. The unavoidable
It is perceived advantageous for the social discourse to take certain developments as a given, particularly upon an emissions reduction of 2%/year: temperature growth by 1°C from the present through the next 750 years; sea level rise in the order of 5–6 m until 1,100 years from now; entailed disappearance of countries and towns; continued investment needs and residual damages; region-specific weather changes; ocean heating and acidification; snow/ice/glacier retreat; and coral reef extinction. Acknowledgment of such changes may free the focus on the primary need for action.
3.10. Economic growth counteracting mitigation
Emissions reduction below 2%/year is simply no choice, as derived from abundant scientific literature and depicted by the solid red lines in Figure 2 as well as implicitly addressed in the sea level section. With at least 2%/year emissions reduction, nature is in great support to keep the damage from anthropogenic carbon emissions at bearable levels. On the one hand, there are signs that society is determined for such emissions reduction. However, there is reason for doubt. A reason originates from population growth and the simultaneous aiming for personal wealth increase—presently amounting to a 2.1%/year (year on year) rise in energy demand with entailed CO2 emissions rising by 1.7%/year. Current equipment replacement needs to deliver a 3.7%/year emissions reduction to achieve the required effective 2%/year reduction. 3.7%/year is judged unrealistic, at the very least in risk terms. Consequently, a reduction in economic growth must be an integral component of the abatement measure portfolio.
3.11. Globally coherent movement
A further reason for doubt (to successful emissions reduction) stems from the apparent incapability of the required global policy coherence. For the required effect at global scale, it is advocated to concentrate on the establishment of a “climate club” (Nordhaus, 2015): to timely conclude agreements between a sizeable group of nations to implement a common set of measures with economic penalization of non-participating countries. Taking emissions reduction as the key indicator is expected to bear the necessary simplicity, transparency, and realism regarding implementation, adherence, and monitoring—and to take care of the interrelationship with economic growth.
3.12. Economic stimulus and regulation
CO2 pricing/levying, commonly supported for the free-market characteristics, is perceived as exhibiting disproportionately unsocial characteristics. Therefore, it is proposed to alternatively focus on regulatory measures. It should be noted that in fact, any measure is based on regulatory prescriptions; thus, the actual subject of discussion is the extent of regulatory measures. Furthermore, climate change mitigation is probably insufficiently addressed by free-market forces given the inevitability of action. Again, this is a call to focus on alternative regulatory measures instead of CO2 pricing. Humankind is not given any choice than to immediately exploit the available mitigation potentials; significant emissions reduction (by at least 2%/year) is the sole viable goal.
3.13. Social interrelationships
Humankind is being presented with a great opportunity to keep the impact of past fossil material usage at bearable levels. Taking advantage of this opportunity, humankind is far from the exodus and the last generation. However, pressure from a broader society may still be required to bring the necessary political action on the road. Enforcement activities must obey the rules defined by the national societies. In addition, fuelling intergenerational conflict for additional spin-up appears disproportionate. On the other hand, immediate emissions reduction of ~2%/year is indispensable to calm anxiety.
At the very bottom line, humankind seems to pursue too many desires at the same time, insufficiently recognizing the interrelationships. Consequently, humankind runs the risk of not approaching the required emissions reduction. If this occurs, extremism, totalitarianism, as well as regulated redistribution and allowance are predicted to find fertile breeding grounds, even at the continuing risk of not turning climate change.
4. Conclusion
From the present work, a CO2 emissions reduction of 2%/year opens the possibility to contain the fossil-induced temperature increase at about 2.1°C and appears moderate in terms of transition pace and cost. At lower emissions reductions, this comfort niche is left with strongly rising impacts, particularly related to temperature, sea level, environment (a. o., from new risk-intensive mitigation techniques), social cohesion, and cost.
Through the past decades, humankind has proven capable of sizable emissions reductions. For the future, conditiones sine quibus non for the required emissions reduction are implementing an appropriate international policy alignment, proposedly based on a minimum emissions reduction per country and year; accounting for the interrelationships, particularly between emissions and economic activity; and assuring that specific actions really help climate (e.g., biodiversity conservation may fall beyond).
Data availability statement
The original contributions presented in the study are included in the Supplementary material, further inquiries can be directed to the corresponding author.
Author contributions
The author confirms being the sole contributor of this work and has approved it for publication.
Conflict of interest
The author declares that the research was conducted in the absence of any commercial or financial relationships that could be construed as a potential conflict of interest.
Publisher's note
All claims expressed in this article are solely those of the authors and do not necessarily represent those of their affiliated organizations, or those of the publisher, the editors and the reviewers. Any product that may be evaluated in this article, or claim that may be made by its manufacturer, is not guaranteed or endorsed by the publisher.
Supplementary material
The Supplementary Material for this article can be found online at: https://www.frontiersin.org/articles/10.3389/fclim.2023.1207872/full#supplementary-material
References
Agajelu, B. O., Ekwueme, O. G., Obuka, N. S. P., and Ikwu, G. O. R. (2013). Life Cycle cost analysis of a diesel/photovoltaic hybrid power generating system. Indus. Eng. Lett. 3, 19–30.
Anderl, T. (2021a). The climate role of CO2 – nature's telling from 400 Mio. years. Res. Squ. doi: 10.21203/rs.3.rs-524780/v1
Anderl, T. (2021b). Planetary emittance and feedback parameters through varying climates in basic modelling. Res. Squ. doi: 10.21203/rs.3.rs-692319/v1
Anderl, T. (2021c). Earth's balanced climates in view of their energy budgets. Res. Squ. doi: 10.21203/rs.3.rs-568771/v1
Anderl, T. (2021d). CO2 emissions and climate - nature's prospect on Green Growth. Res. Squ. doi: 10.21203/rs.3.rs-547822/v1
Anderl, T. (2022a). The climate roles of H2O and CO2 from longwave absorption. Res. Squ. doi: 10.21203/rs.3.rs-830246/v1
Anderl, T. (2022b). Climate change into reverse gear – reversibility and legacies. Res. Squ. doi: 10.21203/rs.3.rs-1652932/v1
Anderl, T. (2022d). CO2 abatement economics - a practical view. Res. Squ. doi: 10.21203/rs.3.rs-1187536/v1
Blöschl, G., Kiss, A., Viglione, A., Barriendos, M., Böhm, O., Brázdil, R., et al. (2020). Current European flood-rich period exceptional compared with past 500 years. Nature 583, 560–566. doi: 10.1038/s41586-020-2478-3
Bond-Lamberty, B., and Thomson, A. (2010). Temperature-associated increases in the global soil respiration record. Nature 464, 579–582. doi: 10.1038/nature08930
Brown, S., Jenkins, K., Goodwin, P., Lincke, D., Vafeidis, A. T., Tol, R. S. J., et al. (2021). Global costs of protecting against sea-level rise at 1.5 to 4.0 °C. Clim. Change 167, 4. doi: 10.1007/s10584-021-03130-z
Buchner, B., Naran, B., Fernandes, P., Padmanabhi, R., Rosane, P., Solomon, M., et al (2021). Global Landscape of Climate Finance 2021. Climate Policy Initiative. Available online at: https://www.climatepolicyinitiative.org
Deng, Y., Cornelissen, S., Klaus, S., Blok, K., van der Leun, K., Worrell, E., et al. (2011). “The ECOFYS energy scenario,” in The Energy Report. 100% Renewable Energy by 2050, eds S. Singer and J. P. Denruyter (Gland: WWF International).
Hallegatte, S., Green, C., Nicholls, R., and Corfee-Morlot, J. (2013). Future flood losses in major coastal cities. Nat. Clim. Change 3, 802–806. doi: 10.1038/nclimate1979
IRENA (2022). Urban Energy Transition for the Greater Metropolitan Area of the Central Valley of Costa Rica. Abu Dhabi: International Renewable Energy Agency.
Katsivelakis, M., Bargiotas, D., Daskalopulu, A., Panapakidis, I. P., and Tsoukalas, L. (2021). Techno-economic analysis of a stand-alone hybrid system: application in Donoussa Island, Greece. Energies 14, 1868. doi: 10.3390/en14071868
Katsoulakos, N. M. (2019). An overview of the Greek Islands' autonomous electrical systems: proposals for a sustainable energy future. Smart Grid Renewable Energy 10, 55–82. doi: 10.4236/sgre.2019.104005
Kulp, S. A., and Strauss, B. H. (2019). New elevation data triple estimates of global vulnerability to sea-level rise and coastal flooding. Nat. Commun. 10, 4844. doi: 10.1038/s41467-019-12808-z
Lozano, L., Querikiol, E. M., Abundo, M. L. S., and Bellotindos, L. M. (2019). Techno-economic analysis of a cost-effective power generation system for off-grid island communities: a case study of Gilutongan Island, Cordova, Cebu, Philippines. Renewable Energy 140, 905–911. doi: 10.1016/j.renene.2019.03.124
MacDougall, A. H., Frölicher, T. L., Jones, C. D., Rogelj, J., Matthews, H. D., Zickfeld, K., et al. (2020). Is there warming in the pipeline? A multi-model analysis of the Zero Emissions Commitment from CO2. Biogeosciences 17, 2987–3016. doi: 10.5194/bg-17-2987-2020
McKay, D. I. A., Staal, A., Abrams, J. F., Winkelmann, R., Sakschewski, B., Loriani, S., et al. (2022). Exceeding 1.5°C global warming could trigger multiple climate tipping points. Science 377, 1135. doi: 10.1126/science.abn7950
Myhre, G., Highwood, E. J., Shine, K. P., and Stordal, F. (1998). New estimates of radiative forcing due to well mixed greenhouse gases. Geophys. Res. Lett. 25, 2715–2718. doi: 10.1029/98GL01908
Net zero emissions race (2022). Energy and Climate Intelligence Unit. Online resource. Available online at: https://eciu.net/netzerotracker; https://zerotracker.net/ (accessed December 20, 2022).
Nordhaus, W. (2015). Climate clubs: overcoming free-riding in international climate policy. Am. Econ. Res. 105, 1339–1370. doi: 10.1257/aer.15000001
Paprotny, D., Sebastian, A., Morales-Nápoles, O., and Jonkman, S. N. (2018). Trends in flood losses in Europe over the past 150 years. Nat. Commun. 9, 1985. doi: 10.1038/s41467-018-04253-1
Parry, M., Arnell, N., Berry, P., Dodman, D., Fankhauser, S., Hope, C., et al (2009). “Assessing the costs of adaptation to climate change: a review of the UNFCCC and other recent estimates,” in International Institute for Environment and Development and Grantham Institute for Climate Change (London). Available online at: https://www.iied.org
Ritchie, H., Roser, M., and Rosado, P. (2020). CO2 and Greenhouse Gas Emissions. OurWorldInData.org. Available online at: https://ourworldindata.org/co2-emissions (accessed October 26, 2022).
Rothman, D. H. (2017). Thresholds of catastrophe in the Earth system. Sci. Adv. 3, e1700906. doi: 10.1126/sciadv.1700906
Schimel, D., Stephens, B. B., and Fisher, J. B. (2015). Effect of increasing CO2 on the terrestrial carbon cycle. Proc. Natl. Acad. Sci. U.S.A. 112 436–441. doi: 10.1073/pnas.1407302112
Wu, C., Liang, N., Sha, L., Xu, X., Zhang, Y., Lu, H., et al. (2016). Heterotrophic respiration does not acclimate to continuous warming in a subtropical forest. Sci. Rep. 6, 21561. doi: 10.1038/srep21561
Keywords: climate projection, social decision making, mitigation policy, climate change economics, CO2 projection, sea level rise, weather disasters
Citation: Anderl T (2023) Climate change through the essentials–nature's offering and humankind's sine qua non. Front. Clim. 5:1207872. doi: 10.3389/fclim.2023.1207872
Received: 19 April 2023; Accepted: 26 June 2023;
Published: 10 July 2023.
Edited by:
Grigorios L. Kyriakopoulos, National Technical University of Athens, GreeceReviewed by:
Ioannis Sebos, National Technical University of Athens, GreeceSiamak Hoseinzadeh, Sapienza University of Rome, Italy
Stefanos Leontopoulos, Hellenic Open University, Greece
Copyright © 2023 Anderl. This is an open-access article distributed under the terms of the Creative Commons Attribution License (CC BY). The use, distribution or reproduction in other forums is permitted, provided the original author(s) and the copyright owner(s) are credited and that the original publication in this journal is cited, in accordance with accepted academic practice. No use, distribution or reproduction is permitted which does not comply with these terms.
*Correspondence: Thomas Anderl, Ymh1LnJlc2VhcmNoQGdteC5uZXQ=