 Nadia Boschi
94% of researchers rate our articles as excellent or good
Learn more about the work of our research integrity team to safeguard the quality of each article we publish.
Find out more
BRIEF RESEARCH REPORT article
Front. Clim. , 01 March 2023
Sec. Climate Services
Volume 5 - 2023 | https://doi.org/10.3389/fclim.2023.1130365
This article is part of the Research Topic Urban ecohydrology & hydrometeorology: Integrating water and greenery management to improve climate resilience in cities View all 6 articles
Climate-related transitional and physical risks are relevant to the building industry. This paper focuses on the physical risk as mitigated and embedded into the design of buildings and infrastructures at the Milan Innovation District (MIND). MIND is an Italian development piloting the transition to resilient green urban planning. This paper discusses the methodology adopted at the early stages of urban and building design to assess the local climate change risks and impacts to be mitigated. As per the Intergovernmental Panel on Climate Change (IPCC) and the climate change scenarios are based on projected temperature changes under representative concentration pathways (RCPs). The scenarios considered are 4.5 and 8.5. Climate projections are from the World Bank Change Knowledge Portal and the projected epw Weatherfiles for Milano Linate. These were generated using IES and Weathershift™ tool. The analysis focused on the temperature raise including the masterplan sunlight analysis, the spatial thermal comfort analysis, and the climate change visualization. Results show that the risk of overheating increases. These were discussed in climate change adaptation and resilience planning workshops with a broad range of stakeholders to identify key strategies and functional distribution de-risking strategies. Climate change poses a significant risk to society and resiliency and decarbonization priorities may differ by region. Although, This paper proposes a replicable high-level assessment that can help developers and business leaders in mapping and mitigate the climate capital-related downside risks that have a material impact on their business overall risk profile and capital adequacy.
Climate change effects such as heatwaves and flooding are severely impacting health and comfort ans socio-economic aspects (World Health Organization, 2021). These impacts are greater in urban agglomerates (Nagarambe et al., 2022). The IPCC's 2018 report (IPCC, 2018) on climate change and buildings projects the impact that a global warming of 1.5°C and the related global Greenhouse Gas emission routes would produce compared to pre-industrial levels. The report highlights several impacts that could be avoided by limiting global warming to 1.5°C, including eradicating poverty, and establish climate change as a collective action problem. Two major issues are related to the built environment: the relation between the building and the city scale as well as their performances with reference to the energy demand. Buildings and infrastructures systems are responsible for up to 40 percent of global carbon emissions (UNEP, 2020). In this context, buildings and cities represent a critical component of a low-carbon future and a physical risk and transitional risk (Bua et al., 2022) that developers must consider. Impact of climate change on buildings' heating and cooling loads has been investigated with dynamic computer simulation modeling (Dodoo et al., 2014) and with a year selection method (Zou et al., 2022a,b). This paper reports a qualitative methodology to evaluate the implications of IPCC climate change projections in RIBA 1 stage of masterplanning, applied to a case study in Milan. Careful consideration has been taken of the interaction between people, site, and the environment to achieve comfortable outdoor spaces.
Resilient cities, including innovation districts, to be sustainable and liveable need to provide solutions for numerous challenges including carbon emissions reduction, climate change adaptation, and social inclusion (Wagner et al., 2019). The case study area, called West Gate, is part of a development in Milan (Italy) called Milano Innovation District (MIND). MIND is a public private partnership (PPP) and the first Italian 99-year concession. MIND embraces the attributes of density and proximity of the innovation districts to facilitate collaborative “open” innovation and strong social networks. Top research strengths of this site include life sciences, advanced technologies, advanced automation, advanced manufacturing, precision medicine, precision nutrition, and prop tech. This 100-hectare development includes offices, laboratories, housing and retail and parks. The site also hosts the new University of Milan' campus for more than 18,000 students, a 500 bed research hospital, the national research center on human genome and a Foundation representing 68 civil society organizations. Innovation, science and technology are at the heart of MIND, and this includes its approach to sustainability which is a showcase of environmental, inclusive, and social innovation strategies. The ambition for MIND is to implement a sustainability strategy that meets the 1.5°C goal (IPCC, 2018). This translates into achieving net zero for scope one and two carbon emissions by 2025 and achieving absolute zero, including scope 3 emissions, by 2040 with no offsets (World Resorce Institute WBCSD, 2018). A key part of the sustainability strategy discussed in this paper is the climate resilience defined as the ability to prepare and plan for, absorb, recover from, and more successfully adapt to adverse events. Delivering a high-quality urban realm that provides places for community gathering enjoyment and connectivity and a portfolio of climate resilient assets is also commercially crucial for the MIND project. As such outdoor areas must be designed carefully to provide a positive experience for a range of activities and buildings and infrastructures must be designed to mitigate risk and/or plan for climate adaptability. The case study area (see Figure 1) counts 125,000 sqm of offices, 28,000 sqm of residential, 13,000 sqm of hotel, 10,000 sqm of retail plus multipurpose space and laboratories.
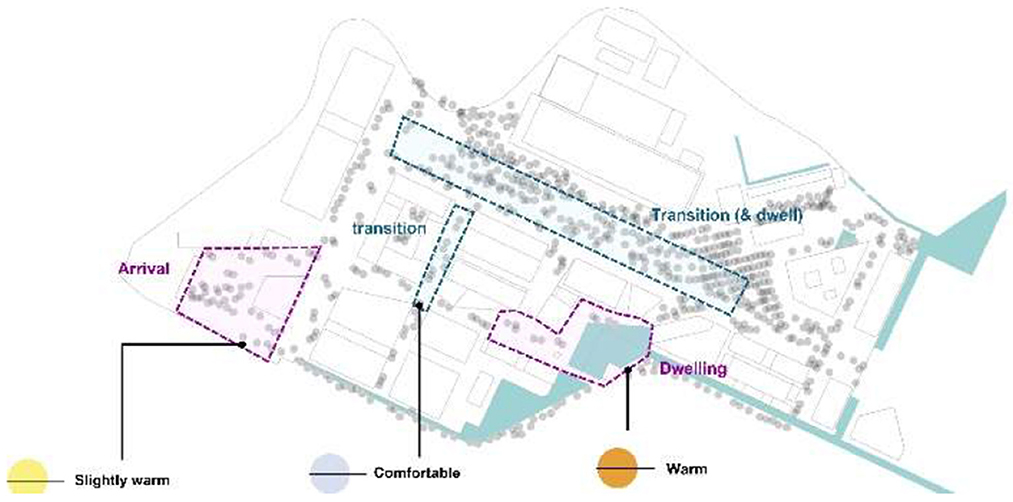
Figure 1. MIND West Gate area with identification of targeted outdoor comfort levels for “arrival,” “transitional,” and dwelling areas.
According to Köppen climate classification, Milan has a humid subtropical climate with hot, humid summers and cold, foggy winters (https://weather-and-climate.com). Temperatures, considering the period 1999–2019 (IWEC2-Linate airport WMO Id: 168080), are highest in July and August with avergaes the middle of the day of 28–30°C. Peak summer temperatures can reach up to 35–40°C. Winters average temperatures can get to as low as −10°C As in all densely populated cities, Milan is affected by strong urban heat island effects that cause higher temperatures in the city than in the surrounding countryside. Although this phenomenon is especially pronounced in the winter (with differences in extreme situations of over 5°C) it results in a temperature increase in urban centers in the summer adding to the heat stress during peak temperature conditions. The relative humidity is very high throughout the year, during the winter causing heavy fog and during hot weather adding to discomfort. The Alps mountains form a natural barrier that protect the city from the major air circulations coming from the north. Winds are therefore low wind speed (average <2 m/s) with few limited peaks. Several microclimate elements were considered to determine the opportunities and risks posed by the environment. Although the parameters considered are part of the standard urban climate assessment MIND is the first development in Italy that included projected climate science data into the definition of urban and building design.
The resilience strategy to inform the RIBA 1 stage design (Royal Institute of British Architects, 2020) was defined in a three-step methodology: baseline definition for outdoor comfort conditions for the site and of the standard effective temperatures for primary outdoor functional areas; use of scenario planning to project and forecast climate change impacts for the project's performance; and climate change adaptation and resilience planning workshops to define the highest potential to cause direct and indirect environmental, social, and economic impact and select a combination of strategies to enable the project to achieve and maintain expected performance goals.
In line with IPCC (Fifth Assessment Report, 2014) the potential impact of climate change for Milan was assessed using the climate projections available from the World Bank Climate Change Knowledge Portal and the projected epw (energy plus weather) weatherfiles for Milano Linate. These were generated using IES and the Weathershift™ tool (Dickinson and Brannon, 2016). These climate change projections are high level and look at different RCP scenarios to give an overview of climate change impact. Two climate change emissions scenarios were mainly considered for the assessment: the RCP 4.5 defined as moderately aggressive mitigation scenario (compliant with the target of the Paris agreement) and the RCP 8.5 defined as the business-as-usual scenario. Specifically Milano Linate Climate IWEC (ASHRAE, 2012) RCP8.5 projected period 2031–2050, warming percentile 90% and RCP8.5 projected period 2071–2090, warming percentile 50%.
The connection between microclimate modeling and RCP data, where it has been used, is simply using future climate data instead of current climate data for assessment. The mesoscale climate projection models and the microclimate models being very different per spatial and temporal scales and complexity do not directly interact. Evaluations were conducted as follows (ARUP, 2019):
(a) Climate change projection visualization (temperature and RH only) with Grasshopper–Ladybug (the climate analysis tool) using climate projection weather data. These are also EPW-type files that were created using Weathershift™;
(b) Climate and thermal comfort assessment based on the climate projections available for Milan from the World Bank Climate Change Knowledge Portal and the projected. epw Weatherfile for Milan Linate generated using IES and Weathershift™ tool–IWEC2/Milan Linate was also used to carry out the comfort analysis plots (SET* plots on climate);
(c) The sunlight analysis was done in Grasshopper using Ladybug/Honeybee plugins using climate data (EPW) and a Radiance engine to run the analysis;
(d) The spatial thermal comfort analysis was done using Radiance (directly rather than via Grasshopper).
Thermal comfort across the West Gate area was assessed using Standard Effective Temperatures (SET*). This index was selected because deemed appropriate measure of thermal comfort considering environmental factors such as solar radiation, air temperature, air speed and humidity, as well as activity levels (metabolic rate), insulation from clothing and human temperature regulation mechanisms. The system was adopted by ASHRAE (1992). The SET* index does not consider other cultural, psychological, and other physiological factors. These factors are subjective, therefore not possible to reliably quantify through an index. SET* index gives a robust and validated reference point upon which other considerations can be factored in during the design process (Laouadi et al., 2020).
The type of activity and the season also have an impact on the expectation of comfort. During the summer, people will expect to be warm when they are outside. For instance, if you are doing recreational activities in a park then you may expect or even desire to be slightly warm. Comparatively if you are walking to work or another destination then you would expect to be comfortable. This led to 3 targets: transition areas to achieve SET* comfortable for most of the year, dwelling, and recreational areas that could be slightly warm as the arrival area where people may dwell for shorter periods (see Figure 1).
An initial assessment of the West Gate area was conducted to determine how outdoor comfort varies across the masterplan. The outdoor comfort analysis for SET* contour plots was carried out for a peak summer day when temperatures reach 38–39°C to determine areas of the masterplan that may be vulnerable and needed design intervention. A further detailed analysis would be the need for a more accurate prediction of thermal performance. The model assumptions were:
• Direct and diffuse solar radiation.
• Hard surfaces are assumed to be at air temperature +10°C and soft surfaces (greenery and water) are assumed to be at air temperature; no wind modeling.
• Spatial variation of SET* for:
– Peak summer day recorded during the last 20 years (11th August 2003).
– Dataset: Linate Airport.
– Solar data from a Paige radiation model.
– Max DBT on this day was: 39°C.
– For 9 a.m., 1 p.m., 4 p.m., and 7 p.m.
• Clo = 0.5 (western summer light).
• Met = 116 (walking).
• Windspeed = 0.2 m/s everywhere.
Scenario planning is a globally recognized planning methodology used to prepare for diverse plausible futures. The process involves imagining plausible futures and planning how an organization or a project would respond to each possible future. It is a shift from the forecasting approach based on historical data to planning using data projections. Climate change projection data has been used to make an informed assessment that looks specifically at how climate will impact the microclimate and urban health island effects. The assessment examined the probability of climate events occurring against their potential impact on the present day and in the future. This allowed the level of risk to be examined. Higher risk parameters will need an appropriate design response which should be integrated into the microclimate design strategy.
Results of the climate projections were discussed in consultation with a broad range of stakeholders in design workshops. Workshop participants discussed the following areas of impact: operations, markets, supply chain, products and reputation, and brand. The impacts of each identified risk were scored on a 25-point risk management framework that considers the potential direct and indirect environmental, social, and economic impacts the risk event carries on both the development and the organization. The level of risk priority is evaluated as a function of the likelihood and consequences. This enabled the project team to identify areas that are most sensitive to climate change and focus on critical or significant risks first and incorporate them into performance goals mitigating strategies.
Results indicated that temperature rise, and urban flooding are the top two local climate risks. The main trends identified from the climate change impact assessment, depending on the climate change emission scenario selected by 2090 are up to 3–7°C average temperature increase and up to 10–20% probability increase of heat waves, both associated with increased health risks for the exposed fragile population (see Figure 2); strong increase in extreme rainfall events: up to 12–24% increase in the 24h max precipitation, associated with short-duration high-intensity events, and up to 8–15% increase in the 5-day max cumulative precipitation, associated with an increased level of water and flooding risk; middle to a strong increase in the likelihood of severe droughts: with the lowest considered emission scenario (RCP4.5) the increase is limited to +10%, whereas with the emission scenario RCP8.5 the increase is considerably higher resulting in up to + 70%.
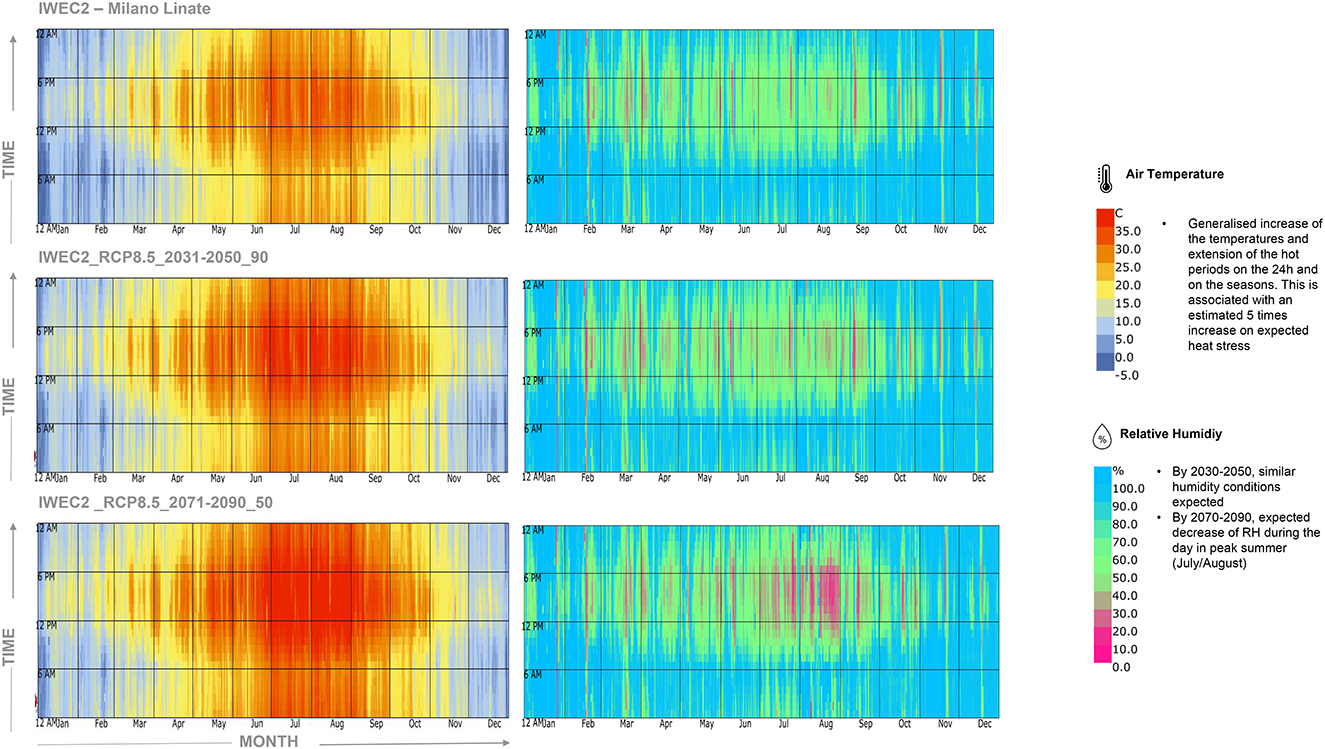
Figure 2. Temperature and relative humidity trends, from the top baseline, RCP 8.5 in 2050 and RCP 8.5 in 2090.
This risk is linked to the increased pressure on the city's water resources, strong increase in average temperature, probability of heat waves and severe drought. By 2050, in the RCP 8.5 scenario, there will be up to 3 times increase in heat stress compared to today and this will raise to 5 times more by 2090 (see Figure 3).
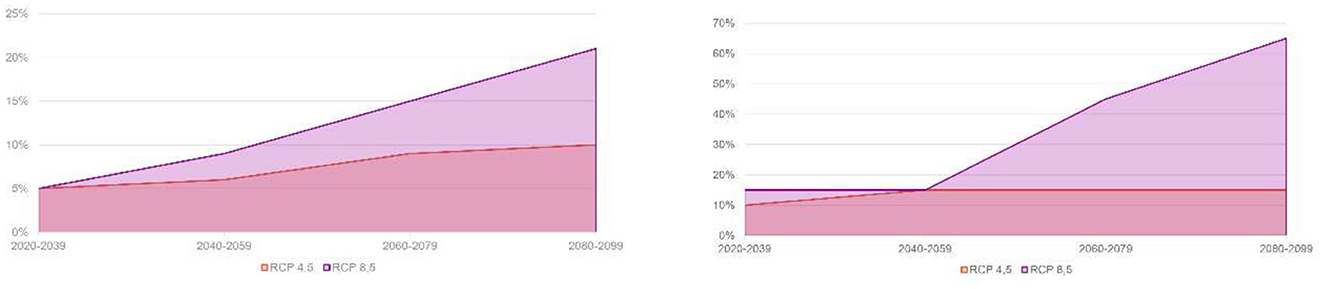
Figure 3. Increased probability of heath waves (sx) and likelihood of severe drought (dx).
The climate analysis and the target comfort level to be achieved led to the definition of passive measures (e.g., shading, low surface temperatures, increase air movement) that could help to improve outdoor comfort. These translated into a need to shade and provide areas of respite along key transition routes giving priority to commuters' routes and routes most likely to be used by most vulnerable populations such as the elderly and children. Selection of materials to reduce heat island impact, resilient species selection for planting strategy, and appropriate use of blue and green spaces.
SET* analysis on the West Gate masterplan design has shown the thermal comfort conditions experienced in the key areas and gives a direction for improving these areas. The assessment was carried out for a peak day and is therefore conservative. Looking at other times of the year at later stages will allow us to refine the design further. Thermal comfort assessment using the climate data RCP 8.5 in 2090 highlighted the period where outdoor spaces are likely to be (un)comfortable throughout the year and where there was a need to mitigate to meet the expectation of creating a fully pedestrian site. The thermal comfort over the West Gate helped to determine how different areas around the site could perform giving an indication of what strategies work well and where further improvements can be made (see Figure 4). Modeling also showed up to a 17% decrease in heat stress by providing sufficient shading and non-absorbing materials, and a 3% decrease in heath stress by enhancing air movement.
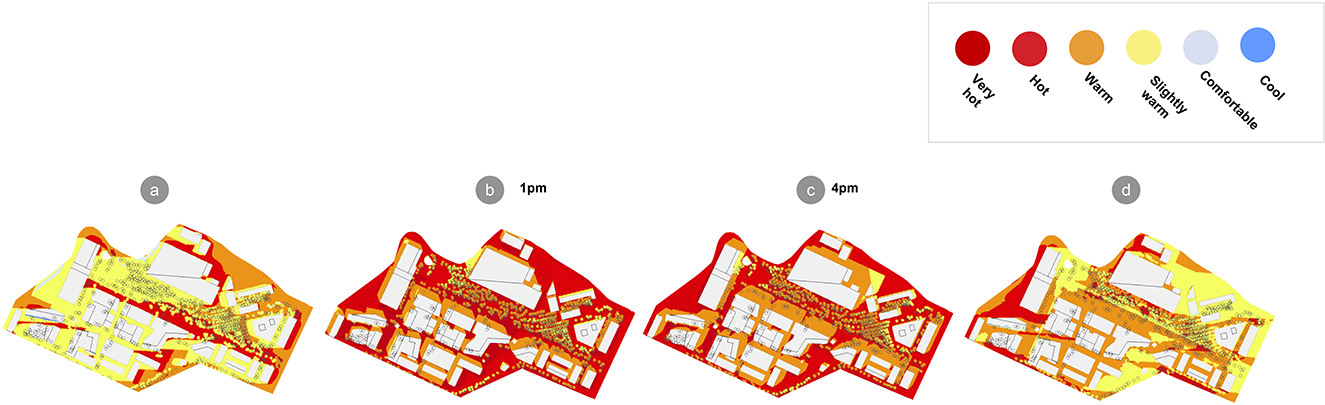
Figure 4. Plots contour for a peak summer day when temperatures reach 38–39°C from 1 to 4 p.m.
To assess the sunlight at external spaces of the masterplan the following three qualitative metrics, over defined analysis period to represents qualitatively the seasonal conditions, were used:
• The seasonal cumulative radiation ratio: This metric indicates the ratio between the total solar radiation received at external spaces (incl. direct and diffuse) over the global horizonal solar radiation. A ratio of 100% means that the surface has no shading over the analysis period, thus the received radiation matches the global horizontal radiation over the analysis period. Maximizing the ratio during winter, as well as minimizing the ratio during summer, can help to improve the perceived comfort.
• The seasonal average sun hours: This metric indicates the average direct sun exposure in terms of hours at external spaces. The analysis helps to identify qualitatively areas with good sun access during different seasons.
• Sun hour analysis on the Equinox (March 21) following the BRE Report 209 (Littlefair, 2011) recommendations: BRE recommends 2+ hours for outdoor spaces during the Equinox. This condition needs to be achieved for at least 50 % of outdoor spaces to avoid excessive overshadowing caused by the massing. This is a good quantitative indicator to identify areas where outdoor activities are suitable all year round.
The assessment of the combined results of the three analysis was used to determine which areas will be the most appropriate for transition and outdoor activities during the different seasons.
Climate change adaptation and resilience planning workshops engaged a broad range of stakeholders for the identification of the risk scenarios with the highest potential to cause direct and indirect environmental, social, and economic impacts. With increased mean and extreme temperatures, heatwaves there is a likelihood of risks such as:
• Restricted work hours for outdoor work (e.g., landscape maintenance, building envelope cleaning) and reduced precinct amenity.
• Accelerated degradation of material and services leading to increased maintenance requirements (e.g., carbonation of concrete, softening of pavements).
• Increased air and surface temperatures of external spaces lead health and safety risks for visitors/residents/tenants (e.g., heat stress and surface burns).
• Increased utility/operational costs.
• Increased discomfort for commuters who will need access to safe comfortable routes throughout the year.
• Decrease in asset network capacity causing power outages and disruption to essential services.
• HVAC/passive design features are not adequate leading to occupant discomfort.
• Increased cooling requirements.
• Increased spatial demand for air conditioning plant.
• Use common ground in buildings to provide respite and comfort along key transition routes.
• Providing local microclimate pavilions which: shelter from excessive heat and cold–(e.g., forest pavilion, accessible conditioned spaces, …).
• provide respite along key transition routes;
• provide additional amenities such as seating or drinking water that can be combined with other functions such as teaching and event space;
• Could provide active measures for heating and cooling such as fans;
• Selection of materials to reduce the impact of urban heat islands (UHI);
• Appropriate use of blue and green spaces;
• Resilient species selection for planting strategy;
• Effective irrigation strategy.
• Reduce UHI through reduction in building and vehicle exhausts where possible.
Need for consistent shade and shelter along the transition routes. Priority is should be for commuter routes which will need to be safely accessible throughout the year, routes taken by vulnerable populations (e.g., elderly).
Increased need for shade and shelter in dwell spaces. Supplementing dwell with cooler respite ones. Active strategies should be considered for limited periods.
Increased need for shade and shelter in dwell spaces. Providing respite in waiting areas. Active strategies should be considered for limited periods.
Thermal comfort assessment using the Milan climate data highlighted the period where outdoor spaces are likely to be comfortable throughout the year. The analysis facilitated the understanding of how passive measures could help improve comfort. SET* analysis on the West Gate masterplan design has shown the thermal comfort conditions experienced in the key areas and gives a direction for improving these areas. The analysis has been carried out for a peak day and is therefore conservative. Looking at other times of the year at later stages will allow us to refine the design further.
• The arrival area: This area has very little shading. This means it will be exposed for much of the day and will be uncomfortable during high temperatures. Massing helps produce shade late in the day. This will be an area where people may dwell before transferring to other areas on site. Shading should be used in dwell areas to improve conditions.
• The Dwelling area: This is an area of recreation where people are expected to spend a longer period. It will be difficult to make it comfortable for all periods of the year and it may not be suitable during the hottest hours of a peak day without further design strategies.
• Transition area (site-wide): This area has extensive shading from trees and plants as well as some green surfaces. This helps to improve thermal comfort during hot periods. This is a large area where they may be multiple routes connecting across. Some shaded pathways could be introduced to help facilitate the journey.
• Cool green surfaces are most effective later in the day.
• Transition area (local, alleys, and lanes): The (narrow) local transition zone is shaded by building massing. This makes it suitable for people walking around the site for much of the year. There will be times of the year when it will be uncomfortable.
Climate change projection data has been used to make an informed assessment that looks specifically at how climate change will impact the microclimate and urban heat island effect. Our built environment must be designed not just for today's climate but for future climates as well. This implies taking the design beyond minimum compliance to increase resilience into the future.
Projection data carry a level of uncertainty and when 70–80 years out may not be so accurate, nevertheless they enable a design shift linked to building flexibility into the design of the asset and stimulate a more responsible use of the resources. They foster a dynamic approach capable of accommodating changes and innovations. It also stimulates a better-integrated approach to deliver horizontal and vertical asset design.
Climate scenario planning enabled the linking of the environmental factors to the project control risk matrix and the business plan of a project including financial risk (Williams and Eccles, 2022). The proposed approach to climate risk assessment, although simple, it constitutes a paradigm shift in professional practices that base their evaluation on historical data rather than on projections not necessarily within the boundary of current professional insurance.
The study reports a high-level climate assessment to respond to the very early stages of urban design to help shape the masterplan and minimize the material risk exposure. Modeling is influenced by challenging assumptions, bordering scenarios. The weather file of the WeatherShift™ Tool is an intuitive interface suitable for the early design stages. Although, the use of weather data in simulation software like IES can come from different sources (e.g., satellite data, weather stations, climate models, etc.) whose level of accuracy and reliability of the data source may change. Translating climate science into building design practice is still in its early stages and the degree of science certainty necessary for decision making need to be strengthen. Further detailed analysis is needed for a more accurate prediction of thermal performance including the assessment of other times of the year to refine the design further especially at the building scale.
Climate change is a transitional, physical but also material risk in financial terms (US Senate, 2022). Resiliency and decarbonization priorities may differ by region. Although, the study has proved that mapping climate risks and opportunities in the early stages of design mitigations can be effectively implemented. The proposed methodology can be replicated in urban scale interventions aiming to consider IPCC projections and related effects on people's comfort and wellbeing even if of different scale. Further developments of the proposed study are certainly needed to explore the effects on different building typologies as well as on the inhabitant's reaction considering different climate contexts and cultural background.
The raw data supporting the conclusions of this article will be made available by the authors, without undue reservation.
NB agrees to be accountable for the content of the work as represented in this paper.
This study was received funding from Lendlease. The funder was not involved in the study design, collection, analysis, interpretation of data, the writing of this article, or the decision to submit it for publication. The work was outsourced to Arup London.
Climate modeling was done by Arup London (UK). The workshops to map climate risks engaged the entire MIND Lendlease team and all designers and consultants involved in the site design. This paper represents exclusively the author's view.
NB was employed by Lendlease.
All claims expressed in this article are solely those of the authors and do not necessarily represent those of their affiliated organizations, or those of the publisher, the editors and the reviewers. Any product that may be evaluated in this article, or claim that may be made by its manufacturer, is not guaranteed or endorsed by the publisher.
ARUP (2019). Milano Innovation District – Micro climate and resilience. Report available upon request.
ASHRAE (1992). Thermal Environmental Conditions for Human Occupancy, American Society of Heating. Atlanta, GA: Refrigerating and Air Conditioning Engineers, Inc.
ASHRAE (2012). International Weather for Energy Calculation (IWEC2) International Weather for Energy Calculations (IWEC Weather Files), Version 2.0. Available online at: www.ashrae.org
Bua, G., Kapp, D., Ramella, F., and Rognone, L. (2022). Transition Versus Physical Climate Risk Pricing in European Financial Markets: A Text-Based Approach. Frankfurt am Main: European Central Bank.
Dickinson, R., and Brannon, B. (2016). “Generating future weather files for resilience,” in 36th International Conference on Passive and Low Energy Architecture (Los Angeles, CA: PLEA).
Dodoo, A., Gustavsson, L., and Bonakdar, F. (2014). Effects of future climate change scenarios on overheating risk and primary energy use for Swedish residential buildings. Energy Procedia 61, 1179–1182. doi: 10.1016/j.egypro.2014.11.1048
IPCC (2018). “Summary for policymakers,” in Global Warming of 1.5°C. An IPCC Special Report on the Impacts of Global Warming (Geneva: IPCC).
Laouadi, A., Barko, M., Lacasse, M., and Armstrong, M. M. (2020). Development of reference summer weather years for analysis of overheating risk in buildings. J. Building Perform. Simulat. 13, 301–319. doi: 10.1080/19401493.2020.1727954
Littlefair, P. (2011). Site Layout Planning for Daylight and Sunlight: A Guide to Good Practice (BR 209). Building Research Establishment (BRE) Press.
Nagarambe, J., Santamouris, M., and Yun, G. Y. (2022). The impact of urban warming on the mortality of vulnerable populations in seoul. Sustainability 14, 13452. doi: 10.3390/su142013452
Royal Institute of British Architects (2020). RIBA Plan of Work. Available online at: https://www.architecture.com/knowledge-and-resources/resources-landing-page/riba-plan-of-work
UNEP (2020). Global Status Report for Buildings and Construction. Toward a Zero Emission, Efficient and Resilient Buildings and Construction Sector. Nairobi: United Nations Environment Programme.
US Senate (2022). The Honourable Gary Gensler Chair Securities and Exchange Commission, June 17, 2022. The Enhancement and Standardization of Climate-Related Disclosures for Investors (File No. S7-10-22).
Wagner, J., Katz, B., and Osha, T. (2019). The Evolution of Innovation Districts: The New Geography of Global Innovation. Available online at: https://www.giid.org/the-evolution-of-innovation-
Williams, C. A., and Eccles, R. G. (2022). Review of Comments on SEC Climate Rulemaking, Posted on November 23, 2022. Available online at: https://corpgov.law.harvard.edu/2022/11/23/review-of-comments-on-sec-climate-rulemaking/
World Health Organization (2021). COP26 Special Report on Climate Change and Health: The Health Argument for Climate Action. WHO: Geneva.
World Resorce Institute WBCSD (2018). World Resources Institute. Available online at: https://ghgprotocol.org/sites
Zou, J., Gaur, A., and Wang, L. (2022a). “A method of selecting future reference years for indoor overheating assessment,” in Indoor Air 2022 Conference (Kuopio).
Keywords: climate risk, climate resilience, urban climate forecast, resilient infrastructures, innovation district
Citation: Boschi N (2023) Urban climate forecasts: From risk to resilience. Milan Innovation District's key design aspects for buildings and infrastructures. Front. Clim. 5:1130365. doi: 10.3389/fclim.2023.1130365
Received: 23 December 2022; Accepted: 06 February 2023;
Published: 01 March 2023.
Edited by:
Liangzhu Wang, Concordia University, CanadaReviewed by:
Jiwei Zou, Concordia University, CanadaCopyright © 2023 Boschi. This is an open-access article distributed under the terms of the Creative Commons Attribution License (CC BY). The use, distribution or reproduction in other forums is permitted, provided the original author(s) and the copyright owner(s) are credited and that the original publication in this journal is cited, in accordance with accepted academic practice. No use, distribution or reproduction is permitted which does not comply with these terms.
*Correspondence: Nadia Boschi, bmFkaWEuYm9zY2hpQGxlbmRsZWFzZS5jb20=
Disclaimer: All claims expressed in this article are solely those of the authors and do not necessarily represent those of their affiliated organizations, or those of the publisher, the editors and the reviewers. Any product that may be evaluated in this article or claim that may be made by its manufacturer is not guaranteed or endorsed by the publisher.
Research integrity at Frontiers
Learn more about the work of our research integrity team to safeguard the quality of each article we publish.