
94% of researchers rate our articles as excellent or good
Learn more about the work of our research integrity team to safeguard the quality of each article we publish.
Find out more
ORIGINAL RESEARCH article
Front. Clim., 16 September 2022
Sec. Climate Services
Volume 4 - 2022 | https://doi.org/10.3389/fclim.2022.941900
This article is part of the Research TopicInsights in Climate Services: 2021View all 8 articles
 Aline Anderson de Castro1*
 Celso von Randow1
 Rita de Cássia Silva von Randow2,3
 Francisco Gilney Silva Bezerra1
Climate change and land-use change can alter the role of natural vegetation as a sink or source of atmospheric carbon. In this work, we evaluate the response of water and carbon fluxes and stocks in Brazilian biomes as a proxy for ecosystem services of regional climate regulation under two contrasting future scenarios: a sustainable development scenario, where some deforested areas are restored by vegetation regrowth combined with a low representative concentration pathway, and a pessimistic scenario, where there is still high deforestation rates and strong climate change. We used refined regional scenarios for land-use change in Brazil, together with climate projections of the HADGEM2-ES model for RCPs 2.6 and 8.5 to drive a land surface model and assess possible future impacts in surface fluxes. Our results show that drying climate and shifts of natural vegetation into anthropogenic land use might shift part of upperstory biomass into understory biomass, which can be more vulnerable to dry events. The simulations also show that climate change appears to drive most of the water balance changes compared to land-use change, especially over the Amazon.
CO2 is one of the main greenhouse gasses, and despite the sink role of ocean and land surfaces, its atmospheric concentration is increasing due to fossil fuel emission and land-use change (LUC), reaching more than 400 part per million (ppm) recently (Friedlingstein et al., 2022). Both ocean and land surfaces can act as a carbon sink, but the ocean absorbs atmospheric CO2 at a relatively constant rate; the continental surface has much greater variability between years (Bloom et al., 2016) because the biosphere is highly sensitive to changes in climate (Canadell et al., 2007).
Changes in water balance are strongly related to biosphere productivity, and drought events can change the sink role of vegetation to the source of atmospheric CO2 due to both a temporary stop in growth and an increase in carbon loss by mortality, which represents an emission flux by decomposition over several years (Phillips et al., 2009; Lewis et al., 2011). Moreover, elevated temperatures can increase the soil respiration rates (heterotrophic plus root respiration), reducing carbon stocks in the largest C reservoir in the terrestrial C cycle (Nottingham et al., 2020). The soil contains about three times as much carbon as vegetation and two times as much carbon as the atmosphere (Batjes and Sombroek, 1997).
On the other hand, the increase in atmospheric CO2 concentration associated with anthropogenic emissions may improve the ability of the biosphere to assimilate C through the CO2 fertilization process, but this effect can be limited by the increasing temperatures associated with high CO2 concentration (Fernández-Martínez et al., 2019) and in drought events (Lewis et al., 2011). High CO2 concentration can also improve the water-use efficiency (WUE), leading to a lower water loss by transpiration, since the plant opens its stomata for a shorter period to capture the same amount of CO2 (Steffen et al., 2004).
Recently, Brazil has already experienced extreme drought events (Lewis et al., 2011; Cuartas et al., 2012), which by itself can weaken the sink role of the land surface (Lewis et al., 2011; Gatti et al., 2021). In addition to climate change (CC), Brazil is under pressure due to changes in the policies related to deforestation, including in protected areas (Friedlingstein et al., 2022; Wiltshire et al., 2022). Some biomes are suffering more than others, but the environmental constraints are becoming weaker. Brazilian biomes Pantanal and Cerrado have experienced 2 years of huge fire events, losing much of their ecosystem richness. In the Amazon, in addition to deforestation for agriculture and pasture, degradation is also increasing and even exceeding deforestation in some years (Assis et al., 2020; Friedlingstein et al., 2022).
In this study, we explore how changes in climate and land use can affect future water and carbon fluxes and stocks in different Brazilian biomes. We used the dynamic vegetation global model (DVGM) INLAND (Anderson de Castro et al., 2018; Dionizio et al., 2018; Caen et al., 2022) to evaluate projections considering two contrasting scenarios (Table 1):
• S1 (optimistic), where some areas have restored vegetation following Socioeconomics Pathway (O'Neill et al., 2014) SP1, and global CO2 emissions are reduced following Representative Concentration Pathway (van Vuuren et al., 2011) RCP2.6;
• S2 (pessimistic), with high deforestation and increasing emissions following SSP3 and RCP8.5.
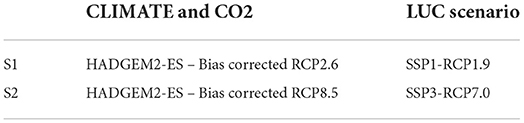
Table 1. Configuration of the simulations.
We used the INLAND DGVM model to simulate the water and carbon cycles in the present climate and also under two different CC and LUC scenarios. For these simulations, some improvements were included in the model compared to the simulations used by Caen et al. (2022), such as better spatial representation of leaf, root, and wood residence times and also in considering the water stress in the dark respiration. The spatial variability of residence time parameters was obtained using the carbon data model framework (CARDAMOM), at 1° resolution for the 2001–2010 period. CARDAMOM is a benchmark produced using a model data fusion approach (MDF) to obtain terrestrial C cycling information (e.g., autotrophic and heterotrophic respiration, carbon stocks, and residence time) by assimilation of the leaf area index, biomass and soil carbon maps, and atmospheric forcing in a low-complexity C model (Bloom and Williams, 2015; Bloom et al., 2016; Smallman et al., 2021; Caen et al., 2022).
To stabilize the carbon and water stocks, we used a 500-year spin up run with dynamic vegetation, which means that the vegetation is allowed to respond to climatic constrains. After this spin up, performed with historical data from Climatic Research Unit and Japanese reanalysis (CRU-JRA, detailed by Harris, 2019), we started the two different scenario simulations in 2006 but discarded 10 years, which was considered as stabilization time to the new input data (for both LUC and climate), and recorded the model outputs from 2016 to 2095 (80 years), in a 0.5 X 0.5 degrees grid (latitude AND longitude), with an hourly time step. For the analyses, we considered the yearly outputs.
The meteorological forcing and CO2 concentration were taken from HADGEM2-ES (Collins et al., 2011), which is an Earth System Model developed by the Met Office Hadley Center (MOHC). HADGEM is already known for a good representation of El Niño and La Niña (da Rocha et al., 2014) and also the precipitation patterns in South America (Sorribas et al., 2016). The data were obtained from the Inter-Sectorial Impact Model Intercomparison Project (ISIMIP)1, from 2b Repository (https://data.isimip.org/). The project adjusts the simulations of different models according to the difference between the simulation and the historical observations as described by Frieler et al. (2017). We choose to use the bias-corrected data because this study is focused on the analyses of climate and land-use impacts in the land surface, and not in the climate model evaluation.
As input of land-use and land cover maps, we used the refined regional scenarios provided by Bezerra et al. (2022), data available at https://zenodo.org/record/5123560#.YVJFzzlv80M (Bezerra et al., 2021), based on local socioeconomic driving factors using the LUCCME-BR model. LUCCME-BR is a tool developed at the INPE, which calculates the fraction of each of six uses per grid cell: forest vegetation, grassland vegetation, planted pasture, agriculture, mosaic of occupation, and forestry. As INLAND uses only the natural fraction of each grid cell as land-use information, we consider the forest, grassland, and forestry uses as natural, and pasture, agriculture, and mosaic of occupation as anthropic. The scenarios are available for each 5 years. In the intermediate years, the data of the previous map were repeated. Figure 1 shows the main Brazilian biomes and the general scenarios projected for changes in temperature, precipitation, and land cover according to the two contrasting scenarios in this study.
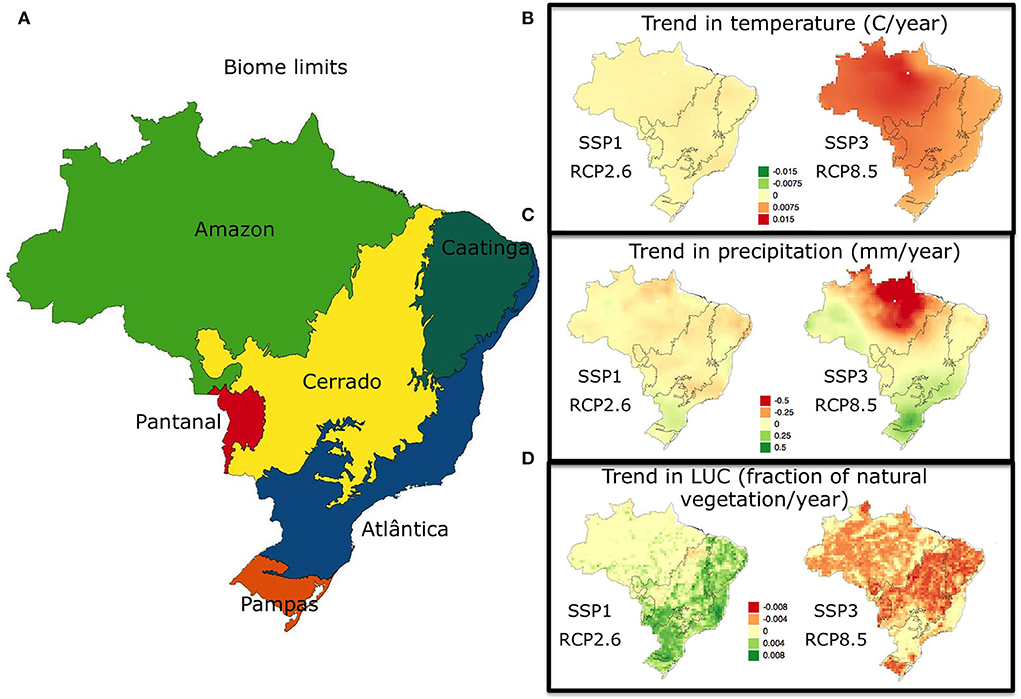
Figure 1. (A) Brazilian biomes: (B) trend in temperature (C/year), (C) trend in precipitation (mm/year2), and (D) trend in LUC (fraction of natural area/year) between 2016 and 2095 to SSP1-RCP 2.6 (S1) and SSP3-RCP8.5 (S2).
We compare a sustainable development scenario with a pessimistic scenario (Table 1). According to Bezerra et al. (2022), in the S1 scenario, in addition to respecting existing environmental laws, there is an incentive for restoration and preservation actions in order to reduce deforestation. In this scenario, like in other countries, Brazil would be moving toward a sustainable path and inclusive development that respects environmental limits, and investments would be mainly oriented toward the wellbeing of society and changes in consumption habits. By contrast, the S2 scenario reflects the weakening of actions to combat deforestation, linked to the resurgence of nationalism, that is, a greater concern with competitiveness and security and regional conflicts. Furthermore, countries would focus on achieving energy and food security goals in their regions at the expense of broader development, which would contribute to increasing inequality. Environmental degradation would intensify mainly due to low national and international priorities to address environmental issues.
INLAND considers 12 plant functional types (PFTs), where the first 8 PFTs include a diversity of trees, considered as upperstory vegetation, and the last four include shrubs and grasses, considered as understory vegetation. For the treatment of land-use change, the model runs simultaneous simulations, the first one where the whole domain is treated as natural vegetation, allowing any PFT which fits the climatic restrictions, and the second one where the whole domain is treated as C4 grass. Every year, the model reads a land cover map, with the fractions of natural vegetation and anthropogenic land, and then calculates a composite of the fluxes and stocks from the weighted average of each simulation.
To evaluate the changes in water and carbon fluxes and stocks, we calculated the difference between the mean of the last and first 15 years of the simulation for each biome, so between 2016–2030 and 2076–2090. The differences were evaluated for both absolute values and percent difference, given by Equation 1. The percent difference allows for evaluation of the relative change from the beginning of the simulation.
To evaluate the spatially explicit distribution of the changes, we also evaluated the linear trend coefficient, given by the term a in Equation 2:
In Equation 2, Y(x) represents the expected value for any variable if the trend is linear, x is the number of years since the beginning of the time series, and yo is the value of the variable in the first year (the point where the time series cross the Y axis and a is the trend coefficient (Satyamurty et al., 2009, 2013). The trend coefficient shows the annual change in the variable, which means it has the same unit of each variable per year.
To analyze impacts in the water balance, we evaluated precipitation (PPT), evapotranspiration (ET), total runoff (RUN), surface and subsurface runoff (SRUN and SUBRUN), and transpiration (TRANSP). For the carbon stocks, we consider the soil and litter carbon together as dead carbon (DEADC) and evaluated the carbon biomass in upper- and understory biomass. For the carbon fluxes, we analyze the model outputs of gross primary productivity (GPP), net primary productivity (NPP), heterotrophic respiration (HR), and connection between water and carbon fluxes, through the water-use efficiency (WUE), given by Equation 3.
The source/sink role of the land surface can be approached by the net ecosystem exchange (NEE) or the net ecosystem production (NEP). The NEE and NEP are usually used interchangeably in the scientific literature (NEE = −NEP) and represent the balance between gross carbon uptake and emissions by autotrophic (AR) and heterotrophic respiration (HR) in the ecosystem. In this work, we assessed NEP (equation 4), resulting from the difference between model outputs of NPP and HR, where positive values indicate a net sink of carbon in the biosphere. Note that NPP represents the net photosynthesis (NPP = GPP–AR).
The evaluations were performed for each biome (Figure 1A), ranging from a tropical humid forest (Amazon) to a semiarid (Caatinga), and also to Brazil as a whole. Some important information about the biomes is presented in Table 2.
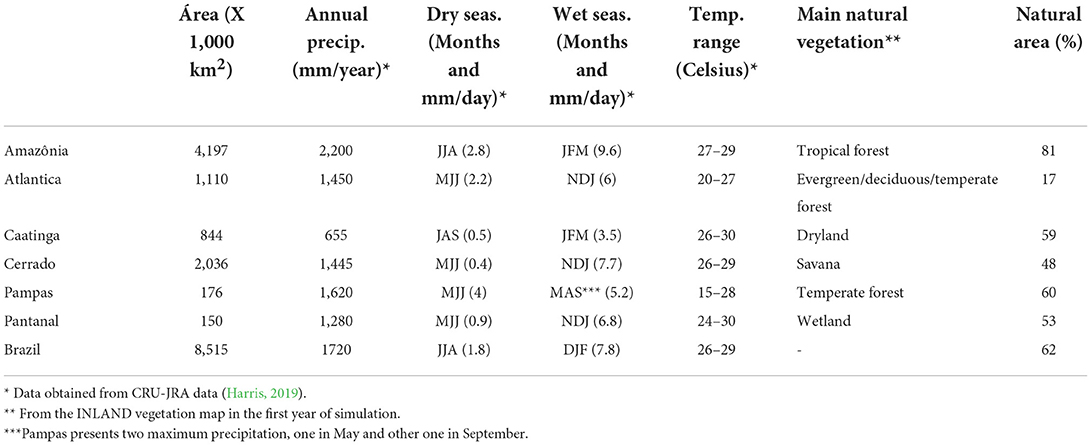
Table 2. Area, total annual precipitation, months and mean of daily precipitation for the dry and wet seasons, temperature range (minimum and maximum), main vegetation, and percent of natural area for each biome and Brazil.
Looking at the input data for each simulation, S1 presents almost no changes in temperature, while the trend coefficient is increasing over all the area in S2 (Figure 1B). In precipitation (Figure 1C), RCP8.5 presents a decrease in northeastern Amazon and an increase in southwest Brazil and over Atlantica and Pampas biomes. In Caatinga and Cerrado, the trend coefficient is very low. S1 shows the same patterns of S2 but with a lower magnitude. In LUC (Figure 1D), the trends show regrowth of natural vegetation in S1, mainly in Atlantica, eastern Cerrado, Caatinga, and the arc of deforestation, while in S2, the trends are deforestation in most of Brazil.
In S1, the climatic trends in the input data are small, while in S2, the increase in temperature reaches 4 degrees over most of Brazil in the period evaluated. Land use is also very different between the scenarios, with recovery of vegetation in S1 and deforestation over all the country in S2, achieving a condition where there would remain areas with more than 75% of natural vegetation only in the Amazon (Figure 2).
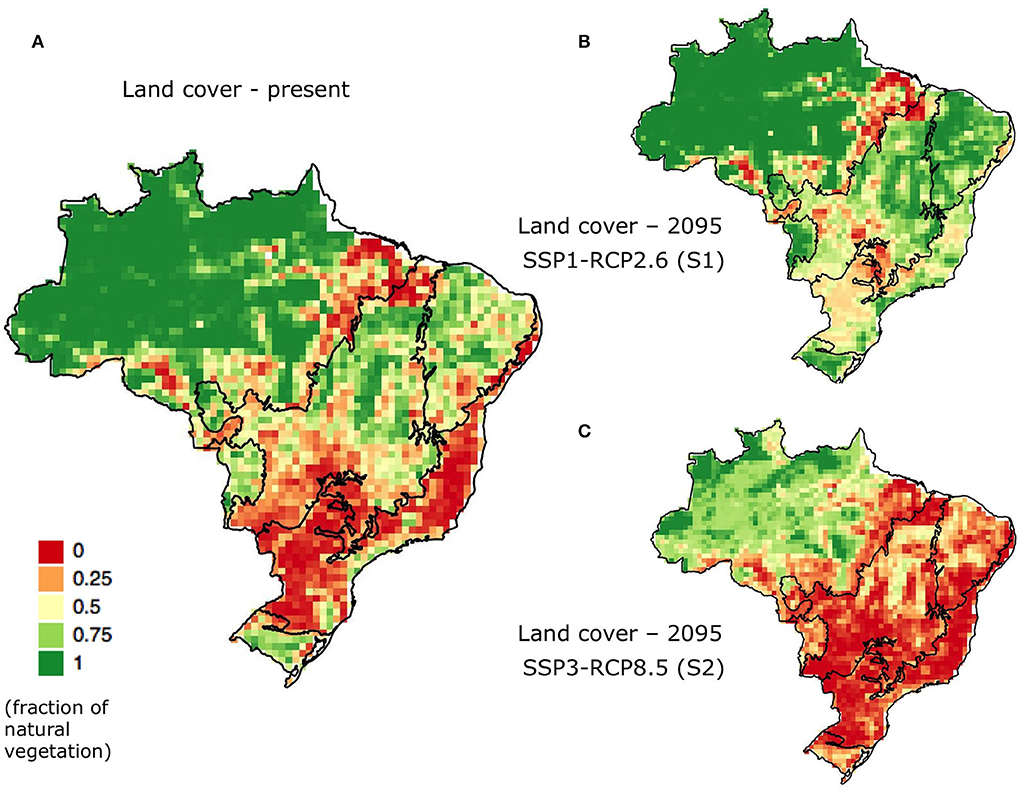
Figure 2. Land cover (fraction of natural area) for (A) the first time step of the model and at the end of the simulation to (B) SSP1-RCP2.6 (S1) and (C) SSP3-RCP8.5 (S2).
Evaluating the changes in the water balance per biome (Figure 3), we can see the differences in precipitation (PPT, Figure 3A), total runoff (RUN, Figure 3B), and evapotranspiration (ET, Figure 3C). In PPT, while in S1, the changes are small, in S2, they present a significant decrease in Amazônia and Caatinga (about 400 and 200 mm/year, respectively) and a significant increase in Atlantica and Pampas (about 250 and 350 mm/year, respectively). Compared to the present period, it represents −18% rainfall in Amazônia and −22% rainfall in Caatinga by the end of the century. The increases are 15% in Atlantica and 19% in Pampas. Pantanal and Cerrado present lower variation, about −6 and −1%, respectively.
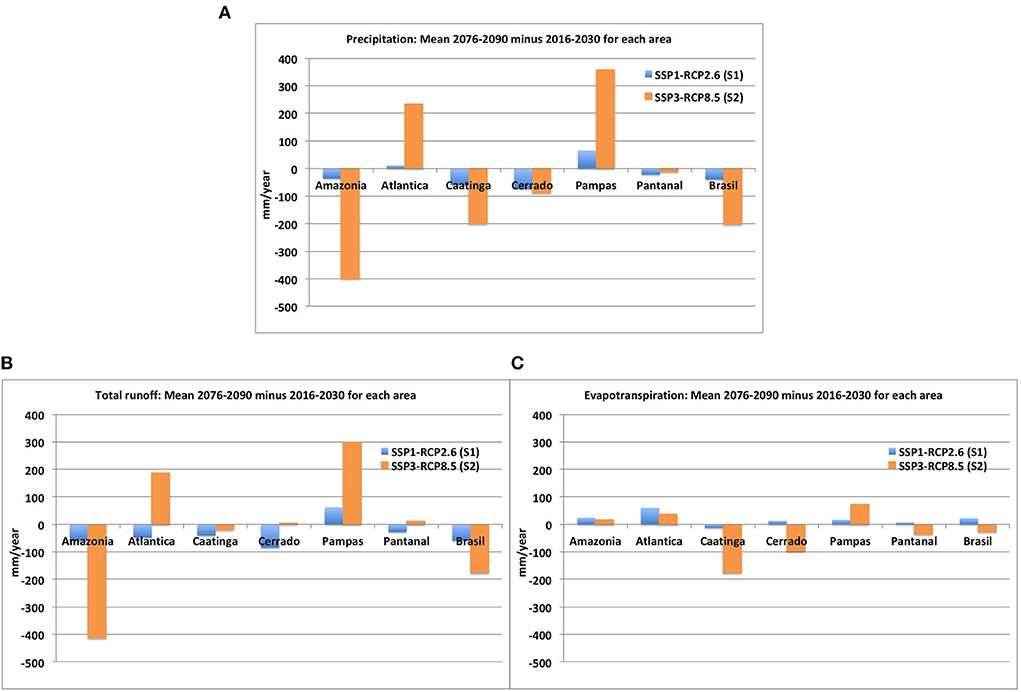
Figure 3. Difference (mm/year) between the mean of the last and first 15 years of the simulation for each biome for (A) precipitation, (B) total runoff, and (C) evapotranspiration for S1 (blue bars) and S2 (orange bars).
Precipitation is an input, which will provide water to be distributed between ET and RUN. Thus, looking at their variations, most of the change in PPT in S2 (Figure 3A) is reflected in the total runoff (Figure 3B) in the Amazon, Atlantica, and Pampas, with decreases in the first and increases in the other two. In Caatinga and Cerrado, the change in precipitation is likely directed to ET (Figure 3C). In addition to a small change in PPT in Pantanal, the biome presents greater reduction in ET, compensated by an increase in RUN. In S1, the change in precipitation is smaller than that in S2, and except for a small reduction in ET in Caatinga and an increase in RUN in Pampas, ET is increasing and RUN is reducing in all other biomes.
Transpiration (Figure 4A) increases in the Amazon and Atlantica for both scenarios, but with the changes around 27 mm/year in S1 and about 44 mm/year in S2 in the Amazon (about 5%) and 20 mm/year in Atlantica for both scenarios (nearly 3%), while in Pampa, it decreases in S1 (about −7 mm/year or −3% of total annual TRANSP) and increases in S2 (about 60 mm/year or 7% of total annual TRANSP). Cerrado, Caatinga, and Pantanal experience decreases for both scenarios, with higher changes in S2, reaching −30% of total TRANSP in Caatinga.
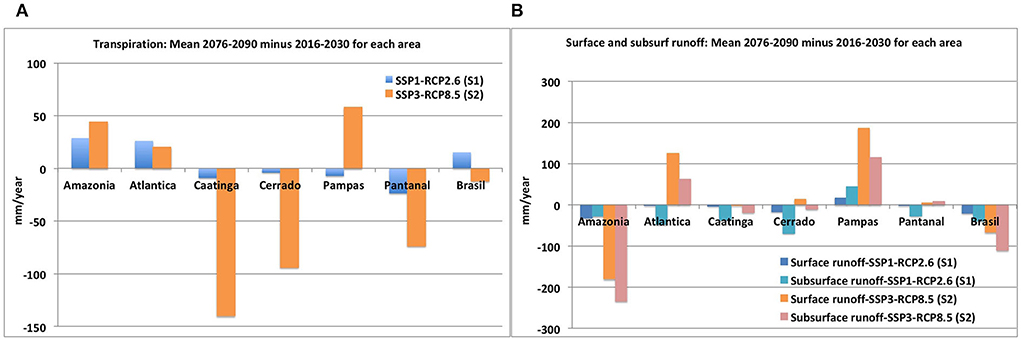
Figure 4. Difference (mm/year) between the mean of the last and first 15 years of the simulation for each biome for (A) transpiration (S1 in blue and S2 in orange) and (B) surface (S1 in blue and S2 in orange) and subsurface (S1 in green and S2 in pink) runoff.
When we separate the runoff into surface and subsurface components (Figure 4B), the reduction in S2 in the Amazon is related to both of them, with more change in SUBRUN. Also, despite increases in Pampas and Atlantica, the magnitude of the Amazon reduction is leading to decreases in both components when considering Brazil as a whole.
Figure 5 shows the spatially explicit trend in the total runoff, which includes surface and subsuperface waters (Figures 5A,D), evapotranspiration (ET, –Figures 5B,E), and transpiration (Figures 5C,F) for S1 (Figures 5A–C) and S2 (Figures 5D–F). In S1, the trend is small, with a decrease in RUN and an increase in ET. In S2, the Amazon biome presents a strong decrease in RUN, while ET increases in southwest to decreases in northeast Brazil, coinciding with the changes in precipitation (Figure 1C). RUN increases in the other biomes, while ET only in Pampas and Mata Atlantica. In TRANSP, both S1 and S2 trends follow the same pattern of ET, as expected, since ET is given by the sum of soil evaporation, transpiration, and water interception by vegetation.
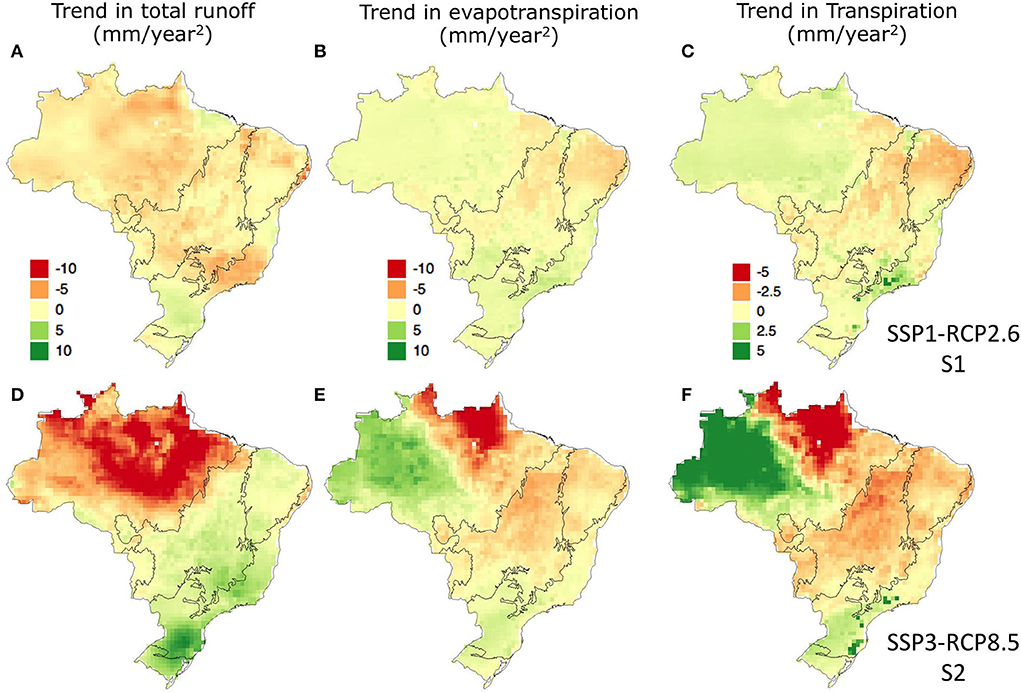
Figure 5. Trend coefficient (mm/year2) to (A) S1 total runoff, (B) S1 evapotranspiration, (C) S1 transpiration, (D) S2 total runoff, (E) S2 evapotranspiration, and (F) S2 transpiration.
In carbon stocks, the model indicates a structural change in vegetation, allocation of more carbon to upperstory (Figure 6B) and less to understory (Figure 6A) biomass in S1, while S2 presents mostly a decrease in upperstory and an increase in understory biomass. The soil and litter carbon (SLC) is decreasing in Cerrado and Pantanal and increasing in Pampas and Atlantica for both scenarios (Figure 6C). In the Amazon and Caatinga, it is increasing in S1 and reducing in S2, with very low values in Caatinga. Altogether, the balance in carbon stocks (Figure 6D) shows an increase in all biomes in S1, especially in the Amazon (about 13%), Atlantica (48%), and Pampas (about 50%). In S2, there is a reduction in C stocks, except for Atlantica and Pampas, achieving a mean of −1.9 kg/m2 considering Brazil as a whole, which means a reduction of about 15% compared to the first period.
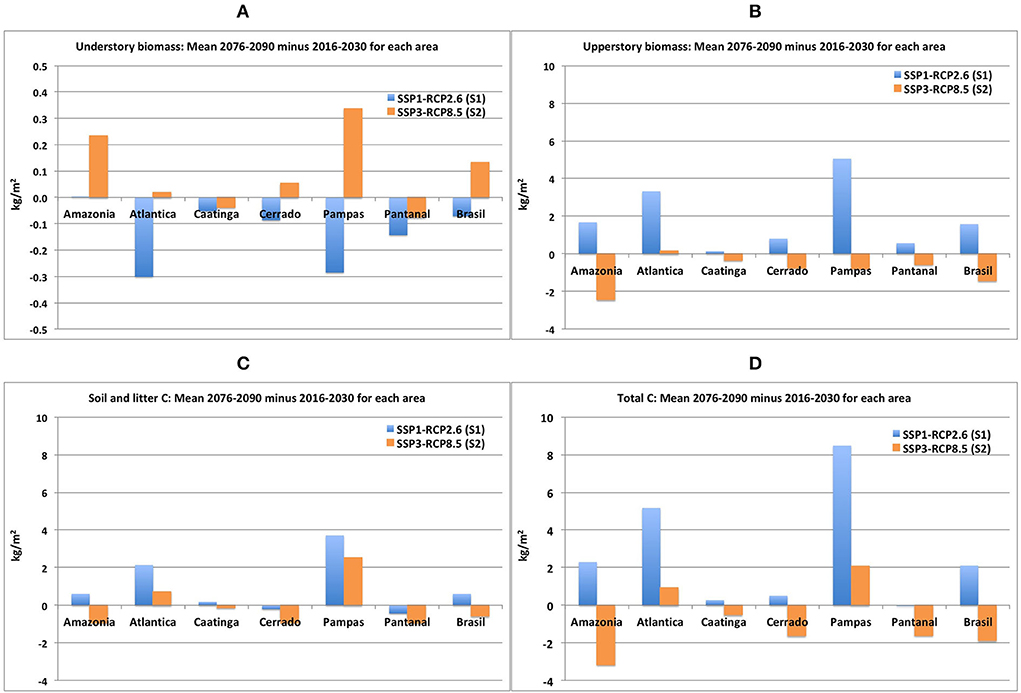
Figure 6. Difference (kgC/m2) between the mean of the last and first 15 years of the simulation for each biome for (A) understory, (B) upperstory, (C) soil and litter, and (D) total carbon stock for S1 (blue bars) and S2 (orange bars).
The spatially explicit results (Figure 7) shows that although the mean of Amazon upperstory carbon biomass is increasing in S1 (Figure 7A), there is still a decrease in the arc of deforestation, where understory biomass is increasing (Figure 7B). In S2, except for the northwest Amazon and central Atlantica, upperstory biomass carbon is decreasing (Figure 7D). Understory is decreasing only in Pantanal and Cerrado edges (Figure 7E). A trend in soil carbon shows similar patterns in both experiments (Figures 7C,F), but with higher magnitude in S2: decreases in northeastern Amazon and in Cerrado–Amazon and Cerrado–Atlantica borders.
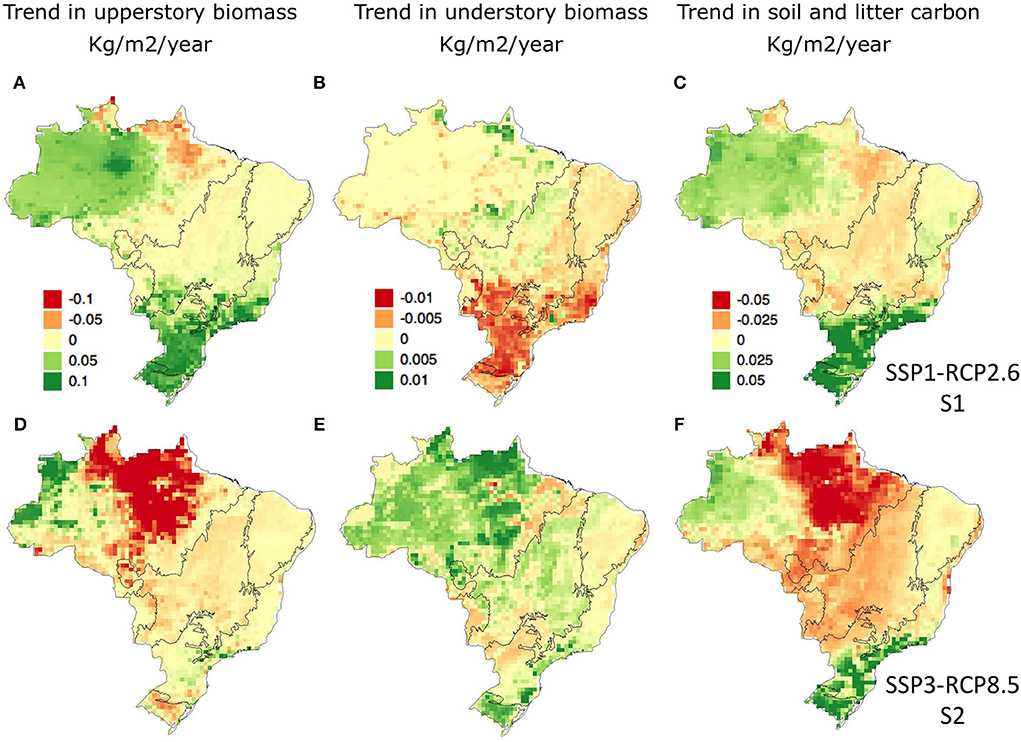
Figure 7. Trend coefficient in the carbon pools (kgC/m2/year) for (A) S1 upperstory, (B) S1 understory, (C) S1 soil plus litter, (D) S2 upperstory, (E) S2 understory, and (F) S2 soil plus litter.
Figure 8 shows the difference between the beginning and end of the century for each biome for NPP (Figure 8A), GPP (Figure 8B), HR (Figure 8C), and NEP (Figure 8D). GPP represents the total carbon taken up, and NPP denotes the balance between the gain and loss by plant respiration (autotrophic respiration AR). Changes in GPP in S1 range from −0.2 in Pantanal (about −7%) to 0.07 in the Amazon (about 2.5%), which are the only biomes presenting increases. In S2, the range is higher, from −0.4 in Caatinga (nearly −22%) to 0.65 in Pampas (nearly 22%). Cerrado and Pantanal present decreases of 0.2, which represents about 7% for both of them. In the Amazon and Atlantica, GPP is increasing, with higher values in Atlantica, but the changes represent a percent difference of <10%.
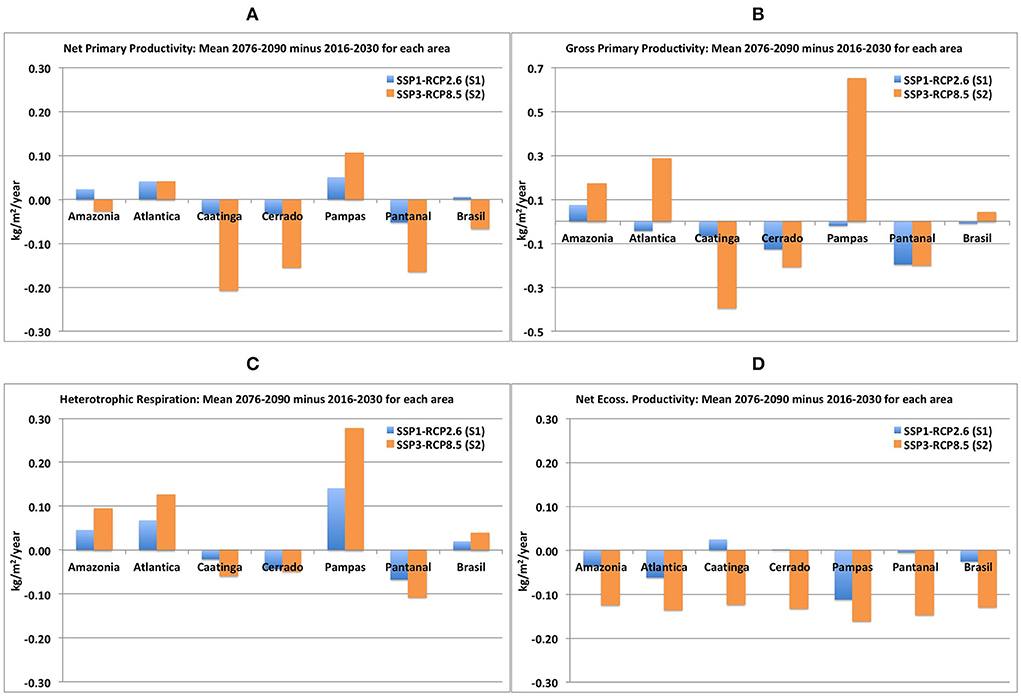
Figure 8. Difference (kgC/m2/year) between the mean of the last and first 15 years of the simulation for each biome for (A) net primary productivity, (B) gross primary productivity, (C) heterotrophic respiration, and (D) net ecosystem productivity for S1 (blue bars) and S2 (orange bars).
NPP is increasing in Atlantica and Pampas, and decreasing in Caatinga, Cerrado, and Pantanal for both scenarios, with more change in S2, except for Atlantica (almost the same increase in S1 and S2). The Amazon presents inverse behavior when comparing S1 (increase) and S2 (decrease). In S2, while GPP is increasing in the Amazon, NPP is decreasing, indicating that the carbon loss during photosynthesis is increasing. HR presents the same behavior as NPP, except for the Amazon, where it is increasing for both scenarios, and Atlantica, which it is increasing more in S2. In the balance over Brazil, NPP is slightly increasing in S1 and reducing in S2, while HR is increasing in both scenarios. Except for Caatinga (higher) and Cerrado (almost no change) in S1, NEP is decreasing for all biomes in the two scenarios.
Figure 9 shows spatially explicit trend coefficients for NPP (Figures 9A,D), HR (Figures 9B,E), and NEP (Figures 9C,F) for S1 and S2 scenarios. In both S1 and S2, NPP and HR have almost similar spatial distribution. In S1, the area in central-western Amazon and in southern Brazil shows a reduction in NEP, consistent with the area where HR is increasing, while in other areas in the Amazon, in the border between Cerrado, Caatinga, and Atlantica, it is increasing, indicating higher emission in these areas. In S2, the NEP is decreasing in most of the country, except for the arc of deforestation, eastern Amazon.
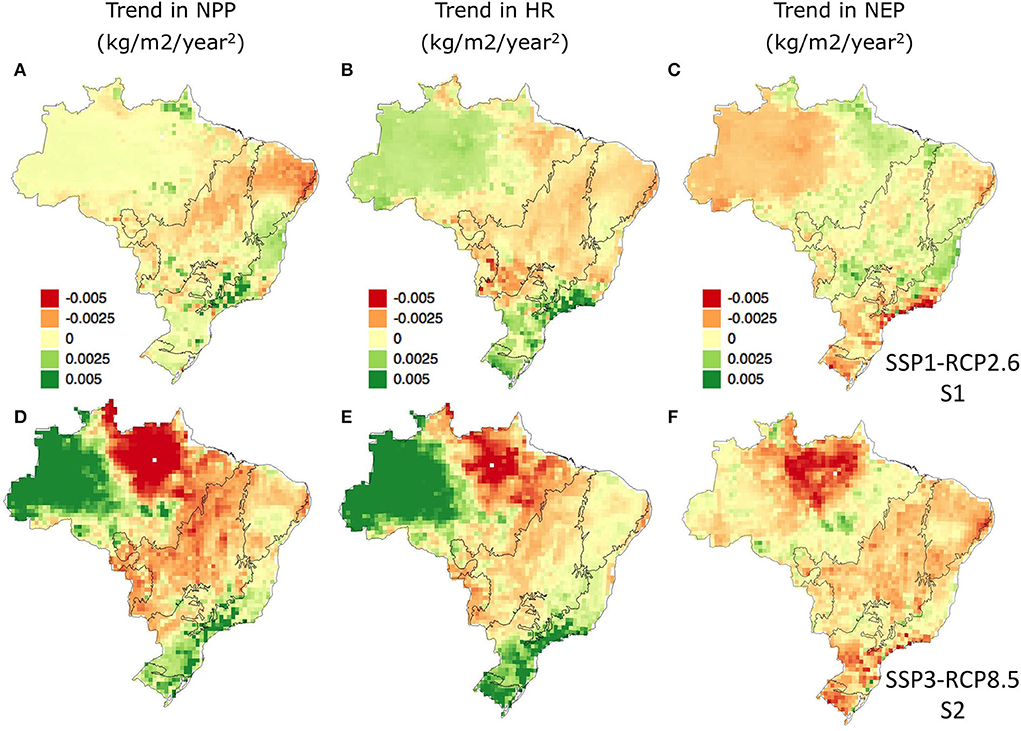
Figure 9. Trend coefficient in the carbon fluxes (kgC/m2/year2) for net primary productivity in (A) SSP1-RCP2.6 and (D) SSP3-RCP8.5, heterotrophic respiration in (B) SSP1-RCP2.6 and (E) SSP3-RCP8.5, and net ecosystem productivity in (C) SSP1-RCP2.6 and (F) SSP3-RCP8.5.
Figure 10 shows the trend coefficient in WUE for each biome for S1 (Figure 10A) and S2 (Figure 10B). In S1, except for the northeastern Amazon and in the Cerrado–Atlantica–Caatinga border, WUE decreases (Figure 10A) and, in S2 (Figure 10B), it is increasing in all biomes, but in the Amazon.
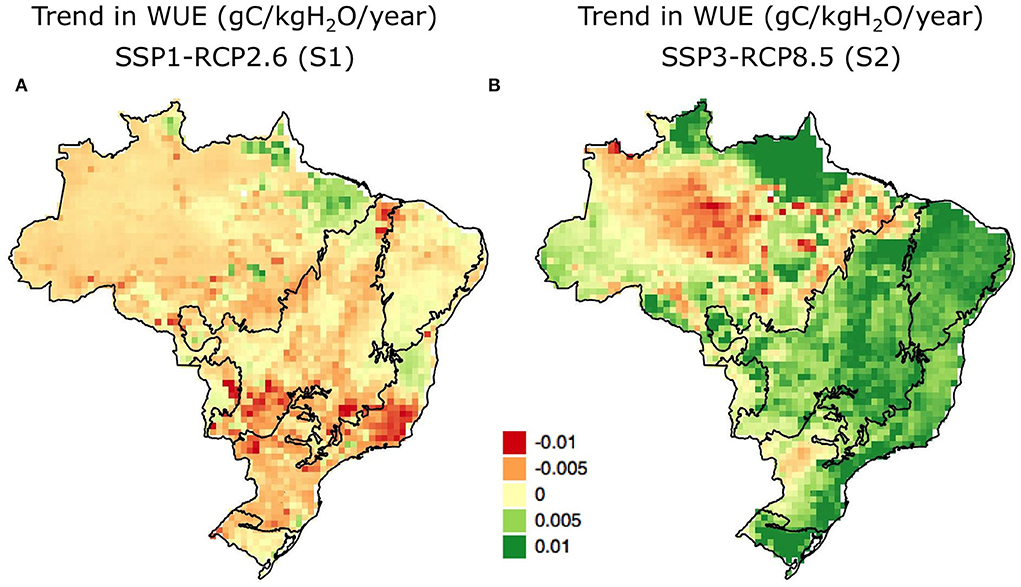
Figure 10. Trend coefficient in the WUE (gC/kgH2O/year) for (A) SSP1-RCP2.6 (S1) and (B) SSP3-RCP8.5 (S2).
Using regionalized scenarios of land-use change in the Brazilian territory, we expect to provide more robust information about the diversity of processes linked to the inter-regional socio-ecological differences of Brazilian biomes. Combining them with climate drivers from a global climate model, we assess potential impacts related to both climate change and regional land-use change on water and carbon fluxes.
In the water balance, under the SSP1-RCP2.6 scenario, in addition to the fact that most of the change occurs in runoff (increases in Pampa and decreases in other biomes), all biomes, but Caatinga, present a slight increase in evapotranspiration. In fact, in Caatinga, both are reducing, with more changes in the runoff. In Atlantica, this increase is compensated by a decrease in runoff. Since precipitation presents almost no changes, it is likely related to the more than three degrees warming when comparing the first 15 to the last 15 years of simulation, and higher temperature can increase evapotranspiration (Huntington, 2006), especially in the humid tropical areas (Wang et al., 2022).
Under the pessimistic SSP3-RCP8.5 scenario, our results show that in the biomes with larger upperstory biomass, the change in precipitation (reduction in the Amazon and large increases in Atlantica and Pampas) is reflected in runoff. The Amazon presents a decrease of about −45% of surface and −50% of subsurface runoff, related to the precipitation decrease. The subsurface runoff presents a more pronounced decrease probably because the percentage of natural vegetation is still high, and considering the CO2 fertilization added to the deep roots of this type of vegetation, the transpiration increases (Figure 4A), decreasing the amount of water that would be directed to subsurface runoff.
The large increase in runoff in Atlantica and Pampas is mostly associated with higher subsurface runoff (55 and 53% increase) and probably related to the increases projected in precipitation, ranging from 15 to 20%. Still, it is important to consider that both precipitation and temperature are treated only as input data and are not fed back by the regional LUC in our simulation. So, climate change affects runoff but does not include feedback from LUC to precipitation. Deforestation might impact regional climate in the long term, reducing precipitation recycling in the region, which will, in turn, reduce runoff, as found by Lima et al. (2014) and Posada-Marín and Salazar (2022).
In the biomes with more understory biomass, like grasses and shrubs (mostly Caatinga and Pantanal and also some areas and years in Cerrado), the reduction in precipitation is reflected in reduction in evapotranspiration. In these biomes, even with high CO2 fertilization in SSP2-RCP8.5, which could increase the vegetation, there is a high loss of natural vegetation (Figure 2C), losing more than 50% of upper biomass and also, for Caatinga and Pantanal, about 10% of the understory biomass. This reduction can explain the large decrease in transpiration in Caatinga, Cerrado, and Pantanal in transpiration (Figure 4A), leading to the reduction in ET.
Regarding the role of land surface as a carbon sink, upperstory vegetation is able to store more carbon since it includes wood biomass, while understory includes only carbon with low residence time (Bloom et al., 2016). In INLAND, understory vegetation can contain grasslands and shrubs, and upperstory includes trees. Changes in this reservoir are more effective to affect the role of the biosphere as a carbon sink or source.
Results in the sustainable scenario show decreases in understory and increase in upperstory biomass for all biomes, reaching more than 200% increase in the C stocks when compared to the first 15 years of simulation in the Atlantica biome. Atlantica is the most deforested area in Brazil, with <18% of natural vegetation remaining, and in S1, it is projected to regenerate more than 50% by the end of the simulation. Pampas has the same behavior, with increases from about 50–75%, and an increase of about 90% in upperstory biomass. Also, S1 presents almost no climatic constraints for both temperature and precipitation. In the Amazon, Caatinga, Cerrado, and Pantanal, although with less magnitude, upperstory is also growing about 17, 23, 63, and 92%, respectively.
In the pessimistic scenario, except for Atlantica, upper biomass carbon is reducing in all biomes, especially in Caatinga, Cerrado, and Pantanal, reaching less than half of the first period. Caatinga and Pantanal also showed reduction of around 15% in the lower canopy biomass. Pampas and the Amazon showed reduction of about 25 and 16% in upperstory and an increase in the understory of about 90 and 45%, respectively. Understory biomass is more susceptible to dry events since wood biomass plants can absorb water from deep layers of the soil (Kulmatiski et al., 2020; Miguez-Macho and Fan, 2021; Zhang et al., 2022), Furthermore, understory biomass, together with the highest inflammability of grass vegetation, can strengthen the possible impact of fire events (Hoffmann et al., 2012).
Looking closely at Caatinga and Pantanal, which also have decreases in understory biomass, they have naturally larger areas with understory carbon biomass as considered in the model and also high deforestation as projected in the pessimistic scenario (−50% in both of them), and for the deforested area, INLAND considers the fluxes as grasses. In S2, in addition to the climatic constraints and deforestation, there is a potentially strong CO2 fertilization effect, which can lead to changes on the other direction. Nevertheless, this effect is more effective in forest and not so visible in grassland, especially when it is located in warmer and drier areas (Zhan et al., 2022). CO2 fertilization, together with the increase in precipitation (15% in Atlantica and 19% in Pampas), can also explain the increasing carbon stocks for upperstory and C pools in Atlantica and Pampas in S2.
Atlantica and Pampas are the only biomes with a positive change in NPP in S2. Nevertheless, HR is also increasing, even more than NPP, leading to a decrease in the NEP. The GPP change is also positive in the Amazon, but the negative NPP change indicates an increase in the AR, which, together with the increase in HR, reduces NEP in this biome. In fact, NEP is reduced for all biomes in S2. In Caatinga and Cerrado, GPP, NPP, and HR are also decreasing, which can be related to the less effective CO2 fertilization in grassland since the three of them have a reduction of more than 50% in natural areas.
Another aspect that can be affected by the CO2 fertilization is the WUE, which represents the ratio between gross carbon uptake (GPP) and water loss (transpiration) by vegetation (Equation 3). When there is more CO2 in the atmosphere, the plants can open the stomata for a shorter time, reducing the water loss during photosynthesis. In S2, it is clearly increasing for all biomes, except for the Amazon, in the same area where there is a large increase in both GPP and TRANSP (Figure 10B). The areas where WUE is increasing coincide with areas where deforestation is higher and is decreasing in the only areas with less deforested areas. Since WUE represents GPP/TRANSP, we can suppose that for this scenario, in Caatinga, Cerrado, and Pantanal, in spite of the reduction in GPP, a stronger reduction in TRANSP is leading to an increase in WUE. In the Amazon, Atlantica, and Pampas, both GPP and TRANSP increase, but the increase in GPP drives an increase in WUE.
Table 3 shows the results of carbon stock changes simulated in the two scenarios. In S1, Brazilian ecosystems absorb about 18,000 GtC (about 66,000 GtCO2), with a mean increase in the restored area of 11%, while in S2, it emits 16,000 GtC (about 60,000 GtCO2), with an increase in the deforested area of 18%. This indicates that leaving areas for vegetation regrowth can help mitigate carbon emission in Brazil and also improve the vegetation role as a carbon sink. In fact, recent studies have shown that secondary forest regrowth can capture even more atmospheric carbon than old-growth forests (Heinrich et al., 2021).
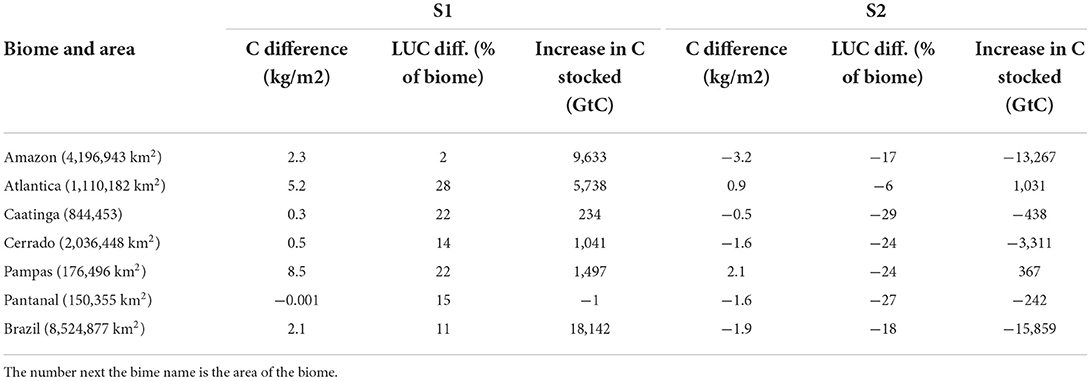
Table 3. Difference in total carbon stocks from the first 15 to the last 15 years of the simulation, percent of the biomass area restored (+) or deforested (-), and correspondent carbon storage in the land surface for each simulation.
We already have an increase in fire events, which can get worse if we do not change the policies about deforestation and fire management in Brazil. In the Amazon, instead of improving the supervision, Brazil is increasing deforestation (PRODES2; Silva Junior et al., 2021) and weakening laws to protect natural forest. So, unfortunately, it is not likely that we will follow the optimistic scenario S1 but continue on the pessimistic S2.
Since we are evaluating model outputs, it is important to consider possible uncertainties in input data and in the model representations. One limitation of our simulations is that INLAND treats deforested or other anthropogenic land uses as grassland. Therefore, crops or urban areas are misrepresented in our simulations. Nevertheless, we suppose the simulations presented here provide good insights on the possible impacts of land conversion from natural vegetation to an anthropogenic land-use type, for illustrative purposes.
Another important point is that INLAND does not consider nutrient limitations, which may be an important constraint in the CO2 fertilization effect on photosynthesis (Peñuelas et al., 2017). The only constraints are the climatic limitations, due to the meteorological inputs and location. Therefore, CO2 fertilization effects in these simulations may be overestimated and must be treated with caution.
This study evaluated the biosphere response to contrasting scenarios, one with reduction and mitigation of CO2 emissions and another with continued deforestation, increasing carbon emission and its associated climate change using regional LUC projections and bias-corrected climate data. To achieve this, we used a dynamic global vegetation model, INLAND, with improvements in the carbon allocation and its residence time in vegetation parameters.
Climate change appears to affect most of the water balance compared to LUC, especially over the Amazon, since the changes in water and carbon fluxes strongly coincide with the precipitation changes in the input data. Runoff shows highest changes in the SSP3-RCP8.5 scenario, but this can be overestimated due to the uncoupled land–atmosphere model used in this study. Also, the Amazon shows a strong reduction of about 50% in surface and subsurface runoff. Reduction in subsurface runoff can lead to reduction in the low flow, which, in turn, leads to a more severe dry season, increasing the susceptibility to degradation. In evapotranspiration, the highest changes are in Caatinga, which also presents a decrease in the runoff.
Regarding carbon fluxes, again, SSP3-RCP8.5 presents a higher difference between the beginning and the end of simulation. In general, the results show that in drier weather, the vegetation tends to change from an upperstory, stable biomass to understory vegetation, which can be more sensitive to dry events, and becomes an easy access fuel for fire. Also, the change shown here alters the carbon storage in the biosphere since upperstory has higher density biomass, as wood and deep roots, while understory includes grasslands and shrubs.
The original contributions presented in the study are publicly available. This data can be found here: https://doi.org/10.5281/zenodo.7057596.
AC and CR contributed to conception and design of the study. AC organized the database, performed the statistical analysis, and wrote the first draft of the manuscript. All authors wrote sections and contributed to manuscript discussion, revision, and approved the submitted version.
This work was developed with support from FAPESP (Grant Nos. 2017/22269-2, 2022/01655-0, and 2020/15230-5). CR acknowledges support from CNPq (Grant No. 314780/2020-3).
We gratefully acknowledge the support of the RCGI - Research Centre for Gas Innovation, hosted by the University of São Paulo (USP), sponsored by FAPESP - São Paulo Research Foundation (2020/15230-5) and Shell Brasil, and the strategic importance of the support given by ANP (Brazil's National Oil, Natural Gas, and Biofuels Agency) through the R&D levy regulation.
The authors declare that the research was conducted in the absence of any commercial or financial relationships that could be construed as a potential conflict of interest.
All claims expressed in this article are solely those of the authors and do not necessarily represent those of their affiliated organizations, or those of the publisher, the editors and the reviewers. Any product that may be evaluated in this article, or claim that may be made by its manufacturer, is not guaranteed or endorsed by the publisher.
1. ^https://www.isimip.org/documents/564/ISIMIP2b_protocol_210131_noEnergy_IV_JS-1_IV_pmp-1.pdf
2. ^http://terrabrasilis.dpi.inpe.br/app/dashboard/deforestation/biomes/amazon/increments
Anderson de Castro, A., Cuartas, L. A., Coe, M. T., Von Randow, C., Castanho, A., Ovando, A., et al. (2018). Coupling the terrestrial hydrology model with biogeochemistry to the integrated LAND surface model: amazon basin applications. Hydrol. Sci. J. 63, 1954–1966. doi: 10.1080/02626667.2018.1538592
Assis, T. O., De Aguiar, A. P., Von Randow, C., de Paula Gomes, D. M., Kury, J. N., Ometto, J. P., et al. (2020). CO2emissions from forest degradation in Brazilian Amazon. Environ. Res. Lett. 15, 104035. doi: 10.1088/1748-9326/ab9cfc
Batjes, N. H., and Sombroek, W. G. (1997). Possibilities for carbon sequestration in tropical and subtropical soils. Glob. Chang. Biol. 3, 161–173. doi: 10.1046/j.1365-2486.1997.00062.x
Bezerra, F. G., Von Randow, C., Assis, T. O., Bezerra, K. R., Tejada, G., Castro, A. A., et al. (2021). New land use change scenarios for Brazil: refining global SSPs with a regional spatially-explicit allocation model. bioRxiv. doi: 10.1101/2021.08.12.456156
Bezerra, F. G., Von Randow, C., Assis, T. O., Bezerra, K. R., Tejada, G., Castro, A. A., et al. (2022). New land-use change scenarios for Brazil: refining global SSPs with a regional spatially-explicit allocation model. PLoS ONE. 17, e0256052. doi: 10.1371/journal.pone.0256052
Bloom, A. A., Exbrayat, J. F., van der Velde, I. R., Feng, L., and Williams, M. (2016). The decadal state of the terrestrial carbon cycle: Global retrievals of terrestrial carbon allocation, pools, and residence times. Proc. Natl. Acad. Sci. USA. 113, 1285–1290. doi: 10.1073/pnas.1515160113
Bloom, A. A., and Williams, M. (2015). Constraining ecosystem carbon dynamics in a data-limited world: Integrating ecological “common sense” in a model-data fusion framework. Biogeosciences 12, 1299–1315. doi: 10.5194/bg-12-1299-2015
Caen, A., Smallman, T. L., de Castro, A. A., Robertson, E., von Randow, C., Cardoso, M., et al. (2022). Evaluating two land surface models for Brazil using a full carbon cycle benchmark with uncertainties. Clim. Resilien. Sustain. 1, e10. doi: 10.1002/cli2.10
Canadell, J. G., Le Quéré, C., Raupach, M. R., Field, C. B., Buitenhuis, E. T., Ciais, P., et al. (2007). Contributions to accelerating atmospheric CO2 growth from economic activity, carbon intensity, and efficiency of natural sinks. Proc. Natl. Acad. Sci. USA. 104, 18866–18870. doi: 10.1073/pnas.0702737104
Collins, W. J., Bellouin, N., Doutriaux-Boucher, M., Gedney, N., Halloran, P., Hinton, T., et al. (2011). Development and evaluation of an earth-system model – HadGEM2. Geosci. Model Develop. 4, 1051–1075. doi: 10.5194/gmd-4-1051-2011
Cuartas, L. A., Tomasella, J., Nobre, A. D., Nobre, C. A., Hodnett, M. G., de Oliveira, S. M., et al. (2012). Distributed hydrological modeling of a micro-scale rainforest watershed in Amazonia: Model evaluation and advances in calibration using the new HAND terrain mode. J. Hydrol. 462–463, 15–27. doi: 10.1016/j.jhydrol.2011.12.047
da Rocha, R. P., Reboita, M. S., Dutra, L. M., Llopart, M. P., and Coppola, E. (2014). Interannual variability associated with ENSO: present and future climate projections of RegCM4 for South America-CORDEX domain. Clim. Change. 125, 95–109. doi: 10.1007/s10584-014-1119-y
Dionizio, E. A., Heil Costa, M., Castanho, A. D., Ferreira Pires, G., Schwantes Marimon, B., Hur Marimon, B Jr, et al. (2018). Influence of climate variability, fire and phosphorus limitation on vegetation structure and dynamics of the amazon-cerrado border. Biogeosciences 15, 919–936. doi: 10.5194/bg-15-919-2018
Fernández-Martínez, M., Sardans, J., Chevallier, F., Ciais, P., Obersteiner, M., Vicca, S., et al. (2019). Global trends in carbon sinks and their relationships with CO 2 and temperature. Nat. Clim. Chang. 9, 73–79. doi: 10.1038/s41558-018-0367-7
Friedlingstein, P., Jones, M. W., O'Sullivan, M., Andrew, R. M., Bakker, D. C., Hauck, J., et al. (2022). Global carbon. Budget 2021, 1917–2005. doi: 10.5194/essd-14-1917-2022
Frieler, K., Lange, S., Piontek, F., Reyer, C. P., Schewe, J., Warszawski, L., et al. (2017). Assessing the impacts of 1.5g€°C global warming - simulation protocol of the inter-sectoral impact model intercomparison project (ISIMIP2b). Geosci. Model Develop. 10, 4321–4345. doi: 10.5194/gmd-10-4321-2017
Gatti, L. V., Basso, L. S., Miller, J. B., Gloor, M., Gatti Domingues, L., Cassol, H. L., et al. (2021). Amazonia as a carbon source linked to deforestation and climate change. Nature. 595, 388–393. doi: 10.1038/s41586-021-03629-6
Harris, I. C. (2019). CRU JRA: Collection of CRU JRA forcing datasets of gridded land surface blend of Climatic Research Unit (CRU) and Japanese reanalysis (JRA) data. Centre for Environmental Data Analysis (2022). Available online at: http://catalogue.ceda.ac.uk/uuid/863a47a6d8414b6982e1396c69a9efe8 (accessed December 2020).
Heinrich, V. H., Dalagnol, R., Cassol, H. L., Rosan, T. M., de Almeida, C. T., Silva, C. H Jr, et al. (2021). Large carbon sink potential of secondary forests in the Brazilian amazon to mitigate climate change. Nat. Commun. 12, 1–11. doi: 10.1038/s41467-021-22050-1
Hoffmann, W. A., Jaconis, S. Y., Mckinley, K. L., Geiger, E. L., Gotsch, S. G., and Franco, A. C. (2012). Fuels or microclimate? Understanding the drivers of fire feedbacks at savanna-forest boundaries. Austral Ecol. 37, 634–643. doi: 10.1111/j.1442-9993.2011.02324.x
Huntington, T. G. (2006). Evidence for intensification of the global water cycle: review and synthesis. J. Hydrol. 319, 83–95. doi: 10.1016/j.jhydrol.2005.07.003
Kulmatiski, A., Adler, P. B., and Foley, K. M. (2020). Hydrologic niches explain species coexistence and abundance in a shrub-steppe system. J. Ecol. 108, 998–1008. Available online at: https://core.ac.uk/download/pdf/237587213.pdf
Lewis, S. L., Brando, P. M., Phillips, O. L., Van Der Heijden, G. M., and Nepstad, D. (2011). The 2010 Amazon drought. Science. 331, 554. doi: 10.1126/science.1200807
Lima, L. S., Coe, M. T., Soares Filho, B. S., Cuadra, S. V., Dias, L. C., Costa, M. H., et al. (2014). Feedbacks between deforestation, climate, and hydrology in the Southwestern Amazon: Implications for the provision of ecosystem services. Landsc. Ecol. 29, 261–274. doi: 10.1007/s10980-013-9962-1
Miguez-Macho, G., and Fan, Y. (2021). Spatiotemporal origin of soil water taken up by vegetation. Nature. 598, 624–628. doi: 10.1038/s41586-021-03958-6
Nottingham, A. T., Meir, P., Velasquez, E., and Turner, B. L. (2020). Soil carbon loss by experimental warming in a tropical forest. Nature 584, 234–237. doi: 10.1038/s41586-020-2566-4
O'Neill, B. C., Kriegler, E., Riahi, K., Ebi, K. L., Hallegatte, S., Carter, T. R., et al. (2014). A new scenario framework for climate change research: the concept of shared socioeconomic pathways. Clim. Change. 122, 387–400. doi: 10.1007/s10584-013-0905-2
Peñuelas, J., Ciais, P., Canadell, J. G., Janssens, I. A., Fernández-Martínez, M., et al. (2017). Shifting from a fertilization-dominated to a warming-dominated period. Nat. Ecol. Evol. 1, 1438–1445. doi: 10.1038/s41559-017-0274-8
Phillips, O. L., Aragão, L. E., Lewis, S. L., Fisher, J. B., Lloyd, J., López-González, G., et al. (2009). Drought sensitivity of the amazon rainforest. Science. 323, 1344–1347. doi: 10.1126/science.1164033
Posada-Marín, J. A., and Salazar, J. F. (2022). River flow response to deforestation: contrasting results from different models. Water Secur. 15, 100115. doi: 10.1016/j.wasec.2022.100115
Satyamurty, P., Da Costa, C. P., Manzi, A. O., and Candido, L. A. (2013). A quick look at the 2012 record flood in the Amazon basin. Geophys. Res. Lett. 40, 1396–1401. doi: 10.1002/grl.50245
Satyamurty, P., de Castro, A. A., Tota, J., da Silva Gularte, L. E., and Manzi, A. O. (2009). Rainfall trends in the Brazilian amazon basin in the past eight decades. Theor. Appl. Climatol. 99, 139–148. doi: 10.1007/s00704-009-0133-x
Silva Junior, C. H Jr, Pessoa, A., Carvalho, N. S., Reis, J. B., Anderson, L. O., and Aragão, L. E. (2021). The Brazilian Amazon deforestation rate in 2020 is the greatest of the decade. Nat. Ecol. Evol. 5, 144–145. doi: 10.1038/s41559-020-01368-x
Smallman, T. L., Milodowski, D. T., Neto, E. S., Koren, G., Ometto, J., and Williams, M. (2021). Parameter uncertainty dominates C-cycle forecast errors over most of Brazil for the 21st century. Earth Syst. Dynamics. 12, 1191–1237. doi: 10.5194/esd-12-1191-2021
Sorribas, M. V., Paiva, R. C., Melack, J. M., Bravo, J. M., Jones, C., Carvalho, L., et al. (2016). Projections of climate change effects on discharge and inundation in the Amazon basin. Clim. Change. 136, 555–570. doi: 10.1007/s10584-016-1640-2
Steffen, W., Sanderson, A., Tyson, P., Jäger, J., Matson, P., Moore Oldfield, B., et al. (2004). Global Change and the Earth System. Berlin: Springer-Verlag.
van Vuuren, D. P., Edmonds, J., Kainuma, M., Riahi, K., Thomson, A., Hibbard, K., et al. (2011). The representative concentration pathways: an overview. Clim. Change. 109, 5–31. doi: 10.1007/s10584-011-0148-z
Wang, R., Li, L., Gentine, P., Zhang, Y., Chen, J., Chen, X., et al. (2022). Recent increase in the observation-derived land evapotranspiration due to global warming. Environ. Res. Lett. 17, 24020. doi: 10.1088/1748-9326/ac4291
Wiltshire, A. J., von Randow, C., Rosan, T. M., Tejada, G., and Castro, A. A. (2022). Understanding the role of land-use emissions in achieving the Brazilian nationally determined contribution to mitigate climate change. Clim. Resilience Sustainability. 1, 1–19. doi: 10.1002/cli2.31
Zhan, C., Orth, R., Migliavacca, M., Zaehle, S., Reichstein, M., Engel, J., et al. (2022). Emergence of the physiological effects of elevated CO2 on land-atmosphere exchange of carbon and water. ESSOAr. doi: 10.1002/essoar.10510955.1
Zhang, X., Zhang, Y., Tian, J., Ma, N., and Wang, Y. P. (2022). CO2 fertilization is spatially distinct from stomatal conductance reduction in controlling ecosystem water-use efficiency increase. Environ. Res. Lett. 17, 054048. Available online at: https://iopscience.iop.org/article/10.1088/1748-9326/ac6c9c/meta
Keywords: climate change, scenarios, Brazilian biomes, projections, land-use change
Citation: Castro AA, von Randow C, von Randow RCS and Bezerra FGS (2022) Evaluating carbon and water fluxes and stocks in Brazil under changing climate and refined regional scenarios for changes in land use. Front. Clim. 4:941900. doi: 10.3389/fclim.2022.941900
Received: 11 May 2022; Accepted: 02 August 2022;
Published: 16 September 2022.
Edited by:
Viviana Maggioni, George Mason University, United StatesReviewed by:
Ricardo Dalagnol, University of California, Los Angeles, United StatesCopyright © 2022 Castro, von Randow, von Randow and Bezerra. This is an open-access article distributed under the terms of the Creative Commons Attribution License (CC BY). The use, distribution or reproduction in other forums is permitted, provided the original author(s) and the copyright owner(s) are credited and that the original publication in this journal is cited, in accordance with accepted academic practice. No use, distribution or reproduction is permitted which does not comply with these terms.
*Correspondence: Aline Anderson de Castro, YWNhbGluZUBnbWFpbC5jb20=
Disclaimer: All claims expressed in this article are solely those of the authors and do not necessarily represent those of their affiliated organizations, or those of the publisher, the editors and the reviewers. Any product that may be evaluated in this article or claim that may be made by its manufacturer is not guaranteed or endorsed by the publisher.
Research integrity at Frontiers
Learn more about the work of our research integrity team to safeguard the quality of each article we publish.