 Rija Faniriantsoa
 Tufa Dinku
94% of researchers rate our articles as excellent or good
Learn more about the work of our research integrity team to safeguard the quality of each article we publish.
Find out more
TECHNOLOGY AND CODE article
Front. Clim., 30 August 2022
Sec. Climate Services
Volume 4 - 2022 | https://doi.org/10.3389/fclim.2022.933543
This article is part of the Research TopicInsights in Climate Services: 2021View all 8 articles
Climate data are essential in an array of climate research and applications. Climate data also provide the foundation for the provision of climate services. However, in many parts of Africa, weather stations are sparse, and their numbers have been declining over the last half-century. Moreover, the distribution of existing meteorological stations is uneven, with most weather stations located in towns and cities along the main roads. To address these data gaps, efforts over the last decade, largely driven by external donor funding, have focused on expanding meteorological observation networks in many parts of Africa, mainly through the provision of Automatic Weather Stations (AWS) to National Meteorological Services (NMS). While AWS offer a number of advantages over the conventional ones, which include automated reporting at a very fine temporal resolution (15 min, on average), they also have several disadvantages and accompanying challenges to their use. Some of these well-known challenges are the high maintenance requirements and associated costs that arise from the need to procure replacement parts that may not be available locally. However, another major, under-discussed challenge confronting NMS is the disparities between the different station types provided by different donors that has given rise to barriers to pragmatically using the plethora of data collected by AWS in decision-making processes. These disparities include major differences in the way the data from various AWS types are formatted and stored, which result in poorly coordinated, fragmented, and unharmonized datasets coming from different AWS networks. The end result is that while top-of-the-line AWS networks may systematically be collecting highly needed data, the inability of NMS to efficiently, combine, synchronize, and otherwise integrate these data coherently in their databases limits their use. To address these challenges, a free web-based application called Automatic Weather Station Data Tool (ADT) with an easy-to-use graphical user interface was developed to help NMS to access, process, perform quality control, and visualize data from different AWS networks in one place. Now implemented in five African countries (Ethiopia, Ghana, Kenya, Rwanda, and Zambia), ADT also enables real-time monitoring of stations to see which ones are working and which ones are offline. This tool emerged from a wider climate services approach, the Enhancing National Climate Services (ENACTS), recognizing that availability of high-quality climate data does not automatically translate to ease of access or effective use.
Climate information is an important resource enabling decision-makers in climate-sensitive sectors to make better-informed decisions at different levels, in support of resilience and adaptation to increasingly erratic climate patterns. From shorter-term decisions relating to how to manage climate hazards such as droughts or floods in the face of climate variability to longer-term decisions such as how to best inform strategic policy and planning around climate risk management and climate change adaptation, its effective use can support a range of important and life-saving activities (Cooper et al., 2008; Hansen et al., 2014, 2019a,b; Sheffield et al., 2014; Vaughan and Dessai, 2014; Stern and Cooper, 2017).
To enable the effective use of climate information and its underlying data for these applications, climate services are developed under the guidance of, and with climate data collected from, National Meteorological Services (NMS). Such climate services, which may be defined as “the provision of one or more climate products or advice in such a way as to assist decision-making by individuals or organizations,” (WMO, 2014) or “the production, translation, transfer, and use of climate knowledge and information in climate-informed decision making and climate-smart policy and planning,” (Climate Services Partnership, 2022), play a critical role in ensuring the availability, access to, and use of climate information by different users at different levels.
The availability, quality and timeliness of these services, however, are in turn dictated by the availability, quality, and timeliness of the underlying climate data that form their foundation. In many developing countries, especially those in Africa, these aspects have been negatively affected by low investment in meteorological services, resulting in inadequate, poorly maintained, and unevenly distributed stations that give rise to climate data of inconsistent and poor quality (Washington et al., 2006; Dinku et al., 2018; Dinku, 2019).
While there have been various efforts to overcome the symptoms of these weak infrastructural investments, such as through the filling of historical spatial and temporal gaps via interpolation of existing stations (e.g., Becker et al., 2013), use of proxies such as satellite rainfall estimates (e.g., Dinku, 2020), the combination of ground station observations with proxies such as satellite rainfall estimates and climate model reanalysis products (Dinku et al., 2018, 2022a), and expansion of ground observations networks, other significant challenges to the use of climate data can arise even when the data collected is readily available, of high-quality, and timely.
The recent expansion of meteorological observation networks focusing more heavily on the use of Automatic Weather Stations (AWS) is a good example of this phenomenon. AWS, or automated versions of traditional weather station, represent an important scientific innovation that offers a number of advantages over their traditional counterparts (Snow et al., 2016; Sabatini, 2017), including automated reporting at a very fine temporal resolution (15 min on average), which can be important in monitoring climate hazards such as floods, and for the development of robust climate datasets and historical records that ultimately lead to improved prediction of these events. Recognizing their importance for climate resilience, there have been a number of efforts by different donor communities across the world to support NMS in Africa to expand their use. These include initiatives such as Trans-African Hydro-Meteorological Observatory (TAHMO, Giensen et al., 2014; Schunke et al., 2021), Southern African Science Service Center for Climate Change and Adaptive Land Management (SASSCAL; Muche et al., 2018), and other efforts supported by different funding agencies such as the United Nations Development Program (UNDP), the World Bank Africa Hydromet Program (https://www.worldbank.org/en/programs/africa_hydromet_program) and Korean International Cooperation Agency (KOICA, http://www.koica.go.kr/sites/koica_en/index.do).
Despite the good intentions of these collaborative efforts, however, the challenge many NMS are now facing is that different initiatives and donors provide different types of AWS networks from different vendors such as Vaisala, Adcon, Campbell, and many more. In Kenya, for example, the Kenya Meteorological Department (KMD) manages AWS networks from six different vendors, shown in Figure 1. Other countries where ADT has been installed (Ethiopia, Ghana, Rwanda, and Zambia) also manage AWS networks from a plethora of different vendors, summarized in Table 1.
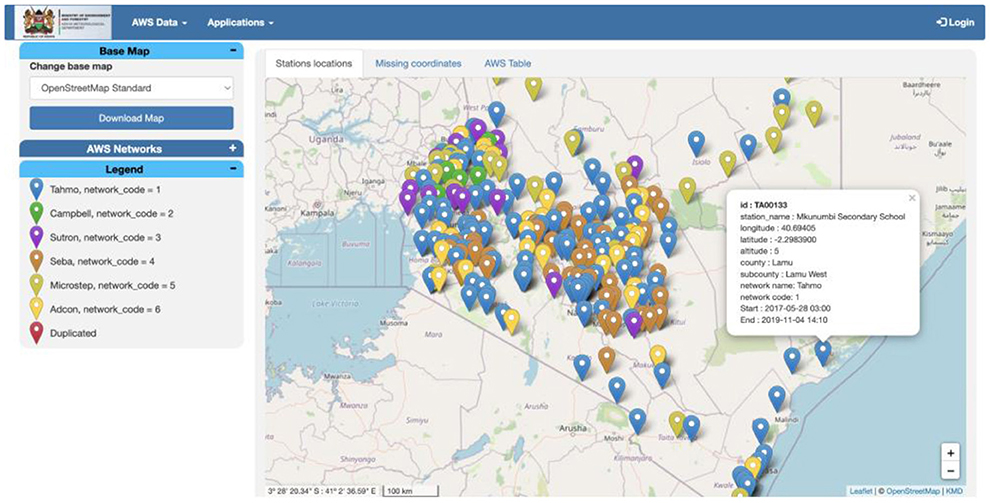
Figure 1. ADT web interface for Kenya showing six different types of AWS networks as well as duplicate coordinates identified.
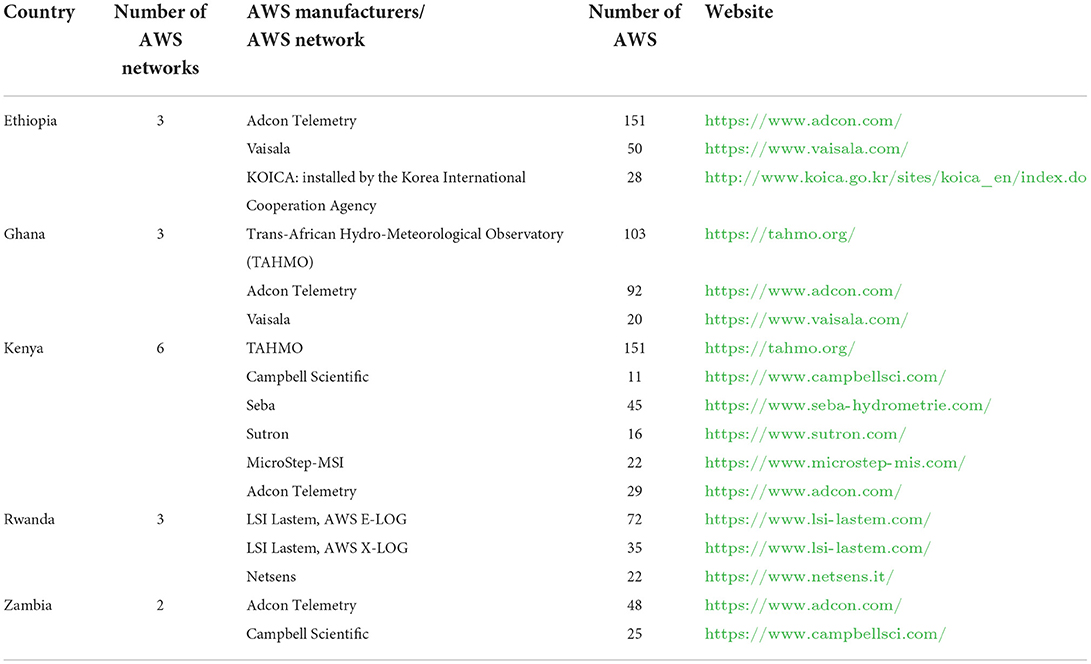
Table 1. A summary of the available AWS networks for the five countries in Africa where ADT has been installed.
The challenge with having AWS networks from different vendors is that the data collected from their component stations are organized in a different way and cannot be easily combined into a common format that provides NMS with unified, easily usable datasets. While stations in one part of the country may collect and format climate data in one way, stations in another part of the country from another vendor may collect and collate the data differently. Moreover, the data collected by these different systems or networks may even sit on different computer servers with their own organizational protocols and permissions. While each vendors' AWS network has applications to access and visualize the data, in practice, this is done manually and station-by-station. The implications for this data discord are huge, especially when it comes to actually processing, analyzing, and visualizing this data to transform it into information and services for decision-making.
To address these challenges, the Enhancing National Climate Services (ENACTS) initiative (Dinku et al., 2018, 2022a) of the International Research Institute for Climate and Society (IRI), Columbia University, has developed a new tool, the Automatic Weather Station Data Tool (ADT) (https://iri.columbia.edu/our-expertise/climate/tools/adt/). This free, web-based application with an easy-to-use graphical user interface (GUI), enables any NMS to access, organize, process, perform quality control, and visualize data from different AWS networks in one place, in near real-time so that NMS staff can make immediate assessments of monitored information without having to resort to time-consuming manual methods. Moreover, ADT enables real-time monitoring of stations to see which ones are working and which ones are offline, to more quickly address issues with data collection interruptions and assess data sources. And the NMS can use ADT to share observations with the public, including humanitarian actors, on a real-time basis through the web interface.
While ADT is relatively new, having first been installed in Rwanda in 2020, it has already been implemented in five Africa countries (Ethiopia, Ghana, Kenya, Rwanda, and Zambia) with strong demand for installation and training coming from other NMS and regional climate centers (RCCs) such as the IGAD Climate Prediction and Application Center (ICPAC) in East Africa and the Agrometeorology, Hydrology and Meteorology Regional Center (AGRHYMET) in West Africa.
In what follows, we provide a methodological overview of ADT, including the technical details of the metadata, the applied quality control procedures, and the construction of its unified database. We then present outputs from the different component functionalities of the tool, including visualization and dissemination of the standardized meteorological data. Finally, we discusses the significance, strengths, and weaknesses of ADT, as well as future directions for its improvement and applications.
ADT enables an integrated data archive with functionalities to easily access, process, perform quality control, and visualize data from different AWS networks, regardless of vendor or type. This is accomplished by amalgamating AWS data from different networks in a common format, in tandem with the application of a near real-time quality control procedure that is applied before storing data into a central database. This process involves the use of a series of Python and R scripts to enable data processing and analysis, as well as a web application for its subsequent visualization and dissemination (Figure 2).
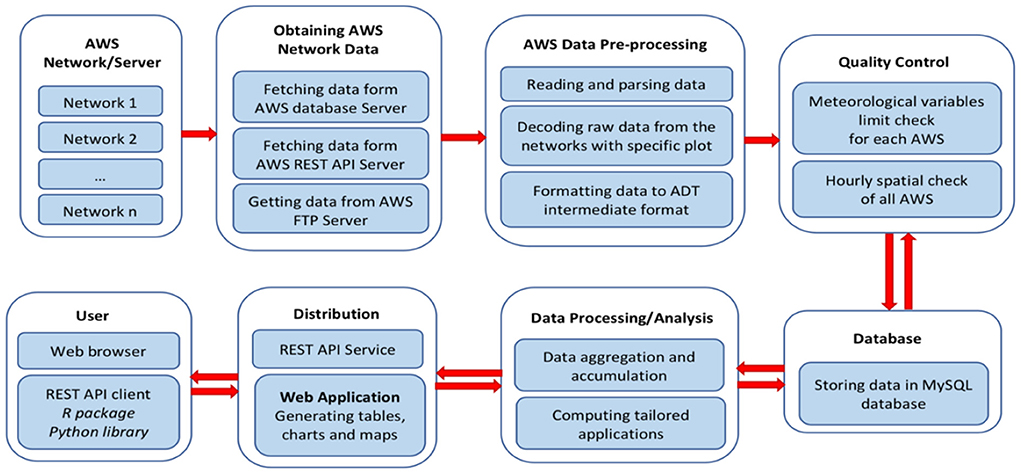
Figure 2. ADT workflow showing detailed steps for the data integration and dissemination.
To install the tool in each new context, ADT must first be configured on-site at each NMS for each specific AWS network. As a result, there are different sets of scripts for the different countries. An example for Zambia can be found here: https://github.com/rijaf-iri/zmdADT. Efforts are being made to consolidate the scripts and make them more general. When that happens, a GitHub link will be provided on the ADT web page (https://iri.columbia.edu/our-expertise/climate/tools/adt/).
Easy-to-use menus allow users to generate climate visualization outputs for individual AWS or groups of AWS, andfor single or multiple variables. The main components of ADT described in this paper are the following (Figure 2):
• Obtaining data from different AWS network systems;
• Data pre-processing and quality control;
• Creating a unified database that allows storage of quality-checked data from different AWS networks;
• Data Analysis, Visualization, and Dissemination.
Creating a unified database requires accessing and fetching data from different AWS systems. Table 1 provides a summary of the available networks for the five countries where ADT has been implemented.
To do this, data from each AWS network needs to be read and converted to an intermediate format to facilitate further processing and storage. Most of the AWS networks installed at NMS in Africa have centralized remote monitoring and control access through a web-based interface or a dedicated program from the manufacturer. The display can include one or more meteorological variables from one or several stations at the same time. These platforms may produce tables, graphs, and maps of both raw and processed data at different time steps programmed by the user, which NMS staff can download or export as Excel or text files. However, some AWS networks do not have software for analysis and visualization, and the data therefore need to be decoded and parsed before use for analysis. Similarly, some AWS networks are operated by an external organization, and data must be accessed through FTP servers. Those data are generally available in text file format and preformatted in table structure for easy manipulation by the NMS staff.
Station metadata is very critical for reading data from different AWS networks into a unified database. Thus, metadata of each AWS network is obtained and standardized. The metadata information includes station name and unique identifier, latitude, longitude, elevation, available sensors, the type of sensors, the height of each sensor above ground, history of change of sensors, meteorological variables observed, units of the measurement, temporal resolution, as well as the periodic maintenance and calibration of sensors. Observed meteorological variables may include precipitation, air temperature, air pressure, dew point, relative humidity, wind speed and direction, total radiation, sunshine, leaf wetness, soil temperature, and moisture. Fortunately, the installation of the AWS operated by the NMS follows the guidelines of the World Meteorological Organization (WMO, 2008; Sabatini, 2017), which makes it easier to gather the metadata. However, it has been difficult to collect the full metadata from some AWS, especially those operated by external organizations. In addition, some required characteristics for these sensors are not directly accessible.
The data extracted from the database of the AWS networks (internal database at the NMS), downloaded from the REST API server (remote database operated by an external organization), and downloaded via the FTP site (remote storage operated by an external organization) are harmonized and integrated before performing the first level of quality control and storage into the database. This involves the following steps:
• Parsing (converting the data to an intermediate format) and decoding the AWS data, if the data is written in a specific format that is not in a well-structured table;
• Converting the unit of the meteorological variables (if it is not in the same units used by ADT);
• Converting the time zone to local time (if the data are saved in UTC);
• Checking for the quality of the data (if it is available in the table of data from the database) and discarding the data flagged as erroneous; and
• Converting the data in a uniform format to be passed to the QC procedures and stored into the database.
The primary purpose of quality control (QC) of climate data is to detect observation errors and missing data, in order to ensure reasonable accuracy for the data stored in the database. Most of the data stored in the AWS network databases do go through a basic quality control procedure in accordance with World Meteorological Organization guidelines (WMO, 2008, 2010). This is performed in real-time, and the errors are determined using only the observed values themselves or observations a short time before and afterwards. The real-time QC consists of the QC of the raw data or signal measurements as well as QC of the processed data.
The QC of raw data is performed at the AWS site, and this includes a gross error check, basic time checks, and basic internal consistency checks. The QC of processed data consists of (1) physical limit check: the observed value is compared to a physical possible upper or lower limit; (2) step check: a value is flagged as an error when the difference between the current and prior observed values is greater than a certain threshold; (3) persistence check: a value is classified as an error when the accumulated change in the observed value within a defined period is smaller than a certain value for some meteorological variables; (4) internal consistency check: the relation between two meteorological variables is checked if consistent; for example, if the dew point temperature is greater than the air temperature, both values are flagged as errors. For precipitation data, if the precipitation occurrence value is 0 but the precipitation value is not 0, both values are classed as errors. For the AWS networks with a structured relational database, the outputs of these QCs are available in the tables of data, but for some AWS networks whose data are stored in a data file and accessible via FTP, there are no QC output data available.
The integration of AWS from different networks brings challenges regarding the quality of data (WMO, 2017). An extended quality control procedure is carried out by ADT to insure the quality of the AWS data before the final storage in the database. There are two levels of automated near real-time quality control procedures for AWS data applied in ADT: climatological limit check and spatial consistency check.
The first consists of comparing the observed value at the temporal resolution of the AWS with climatologically possible upper and lower limits. Although a limit check was already applied to the observation, the thresholds used are those defined by the manufacturer of the sensor or the AWS installer. However, it has been observed that a number of observations are completely erroneous when compared to the possible values for the climatology of the region. Therefore, the thresholds used for the limit check are adjusted on the basis of the local climatological statistics. To determine thresholds for the limit check, first the country is divided into climate regimes (based on the climate zones used by the NMHS, if it exists, or the experiences of the forecasters and climatologists at the NMHS). For each climate zone, data are spatially averaged, then the minimum (min), maximum (max) and 5th/95th percentiles are computed. Then, the maximum limit is calculated as: maximum limit = max + (max – 95th percentiles). Similarly, minimum limit = min + (min – 5th percentiles). For some parameters such as rainfall, the minimum limit is set to zero. Values less/greater than the lower or upper limit are flagged as erroneous and will be discarded from the next stage of data processing.
The second step is to perform a spatial check using the neighboring stations at an hourly time scale. Two spatial check methods are performed sequentially. Observed values flagged as suspects or erroneous from the first method will be checked by the second method. The first method uses a local interpolation method adapted from the optimal interpolation technique developed by Belousov et al. (1968). At each AWS location, the difference between the observed value and the value interpolated at the same location for a meteorological variable is computed. If the difference is small, then the observed value agrees with the values of its neighbors and is considered as correct; otherwise, either the observed value being checked or one or several values used in the interpolation from the neighbor stations are erroneous. To determine which is the case, an interpolation at the AWS location is performed by eliminating the neighboring observations one by one. If successively eliminating each neighbor does not give a small difference that agrees with the observed value, then the observed value is flagged as erroneous; otherwise, the observed value is considered as correct and the values of neighboring AWS that give a larger difference are flagged as suspects. The erroneous values are not used when quality checking data from the next AWS. Elevation data are included in the interpolation as an auxiliary variable for the temperature and pressure data. All the values flagged as erroneous are passed to the second method of the spatial test. The second method performs a spatial regression test used by the Climate Data Tool (Dinku et al., 2022b). The spatial regression test is a quality control approach that checks whether the variable falls within the confidence interval formed from the values of neighboring stations during a given time period called window length (Hubbard and You, 2005; Hubbard et al., 2005; You et al., 2008). The window length is set to 12; in other words, the previous 12 h of observations are used to perform the regression. All AWS within a certain distance centered on the target AWS are selected, and a linear regression is performed for each AWS paired with the target AWS.
Here it should be noted that though ADT can be used to do basic QC of AWS data, it is not created to do extensive QC of historical climate data such as from conventional meteorological stations. Another tool, the Climate Data Tool (CDT), has been developed to do this and many other functions (Dinku et al., 2022b). This tool, which has been installed by over 20 NMS in Africa alone, is used for data organization, extensive quality control (including homogenization), an array of data analyses, and visualization.
A large amount of data from the different AWS networks necessitates the creation of an advanced database system for data archiving. The main objective here is to create a relational database that allows for the standardization and combination of data in the least redundant form, without loss of information. This method of data standardization allows for the flexibility of the system and the network itself (e.g., adding a new network, new stations, or new meteorological variables). ADT uses a local MySQL database containing all metadata and data from the different AWS networks. A relational database has the potential to be an ideal tool for both quick and complex queries. A number of R and Python scripts and queries are used to process the data, and populate and extract data from the database.
Standardization is achieved through the creation of separate tables containing the metadata for each network (AWS location, sensors, etc.) and separate tables for the data at different temporal resolutions (5, 10, 15, and 30 min), as well as hourly and daily accumulations. Given the large amount of data stored in the tables, tables containing the minutes and hourly data are partitioned for each year using the range partitioning in MySQL. This type of partitioning offers several advantages including optimization of the scan process, making the queries run faster, optimization of the data storage, and providing greater control over the data operations. The AWS networks, the meteorological variables, and the naming of computed statistics (e.g., minimum, maximum, and average) are coded to the smallest integer MySQL data type in order to save space in the database. The units of the meteorological variables are also standardized to facilitate the queries and the processing. For example, the unit of soil humidity from different AWS networks, even from different AWS within the same network, are expressed in different units (percentage, fraction, or m3/m3). These data are converted to the same unit before processing and populating the data tables. The standardization and the structure of data stored in the database allow the spatial consistency check easily. An automated backup of the database is scheduled every week in order to secure the safety of the data.
The creation of the unified database described above necessitates the development of an interactive tool for the analysis and visualization of the raw data. The tool should allow downloading of data from the database with ease and the generation of climate information products useful to NMHS staff and the general public. An adaptive tool for analysis, visualization, and downloading is required to achieve these objectives.
After extensive research on the technologies available for such functions, ADT has adopted the REST API services. REST API services provide a flexible, lightweight approach to integrating applications and interacting with the database via an HTTP request. Thus, ADT is a REST API service using the Flask framework (https://flask.palletsprojects.com), which is a micro-framework written in Python used for easy and fast web application development and for configuring back-end applications with the front-end. And ADT's back-end is written in Python and R, while the front-end uses several open-source libraries such as Jinja2, JavaScript, Leaflet.js, Plotly.js, and Highcharts JS. R packages and Python wrappers were developed to process and analyze the user queries, and interact with the database. There are many advantages to using R and Python codes such as the portability of the codes, being independent of the database which ensures the safety of the database, and is independent of the platform on which the codes are running.
The main issues with the basic quality control performed at the AWS site or at the central server are that the limits used, which were set to the operating range of the sensors (at the AWS site) or the physical possible limits of the meteorological variables (at the central server). The outputs of QC of observations stored at the AWS server show that many observed values as correct; however, further QC has shown that those values are in many instances erroneous compared to the climatology of the site. An example is shown in Figures 3, 4. Figure 3 shows the location of all AWS flagged as suspects at hourly time intervals, and clicking on the marker of the AWS would display errors shown in Figure 4. The table in Figure 4 shows minimum temperatures exceeding 30°C; however, the observed minimum temperatures for this region do not exceed 25°C all year round. Table 2 presents percentages of data flagged as suspicions for some climate variables in Ethiopia.
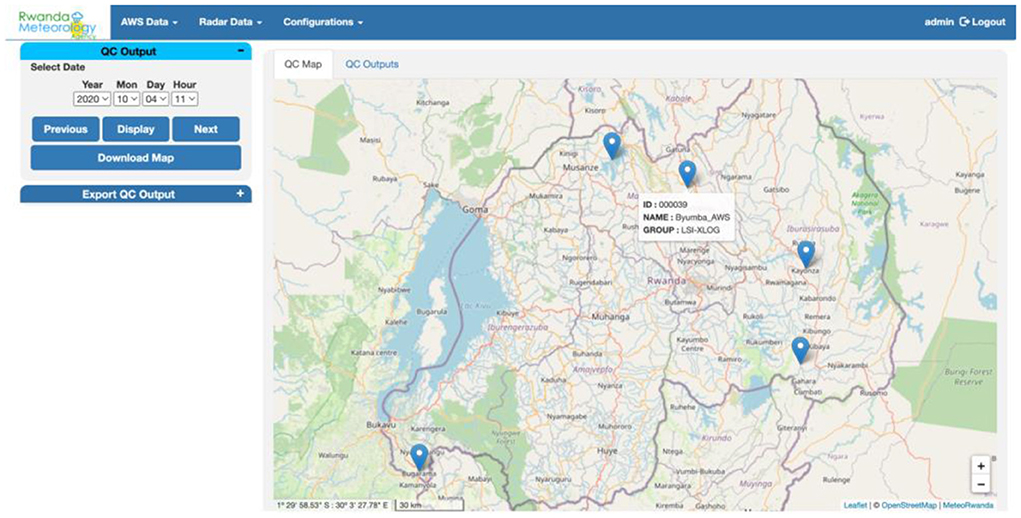
Figure 3. Output of QC limit check flagging suspitious values at hourly time step. Clicking on any of the markers of the AWS will generate what shown in Figure 4.
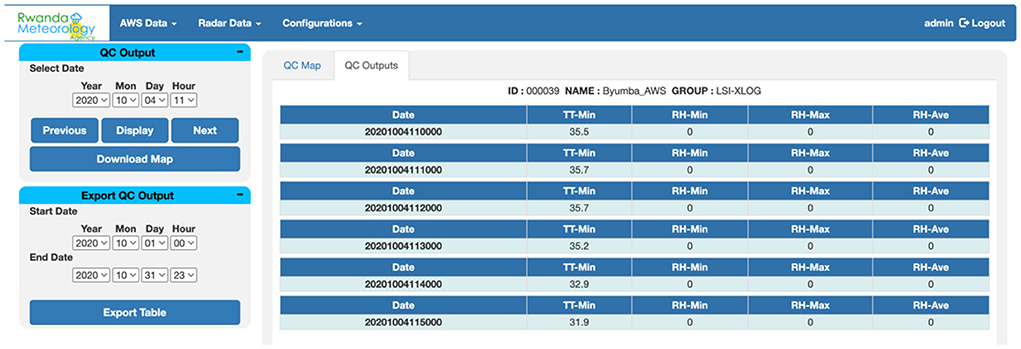
Figure 4. Table showing values flagged as suspects for one station.
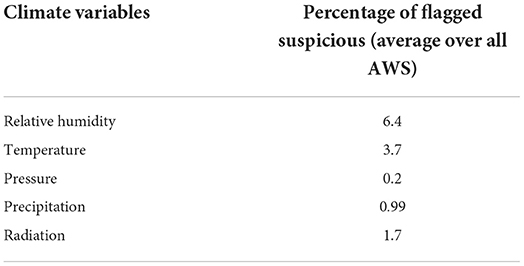
Table 2. Data flagged as suspicions by ADT quality control procedure for some elements in Ethiopia.
An R package and Python library were developed to query the data from the database. The idea behind the creation of those libraries is to allow the advanced user, who knows how to write Python or R scripts, to directly fetch the data from the MySQL database and perform more advanced analysis. These libraries contain several functions such as obtaining the metadata, checking the outputs of the quality control, and making queries to get the meteorological data for some variables, AWS or AWS networks.
A web application offers an easy way to fetch the data from the database, render the outputs of the analysis depending on the user queries, and add more analyses/applications in the future. Through this intuitive interface, the user is able to easily access, view, navigate, and download all forms of meteorological data from the database and outputs of data analyses.
ADT menus are classified into three main categories: AWS data (Figure 5), applications (Figure 6), and configurations.
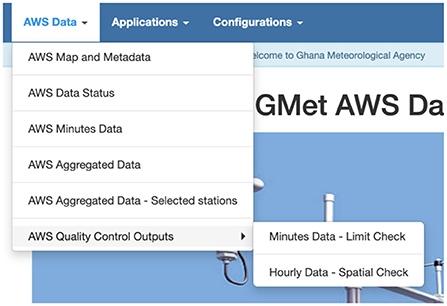
Figure 5. The ADT Data menu.
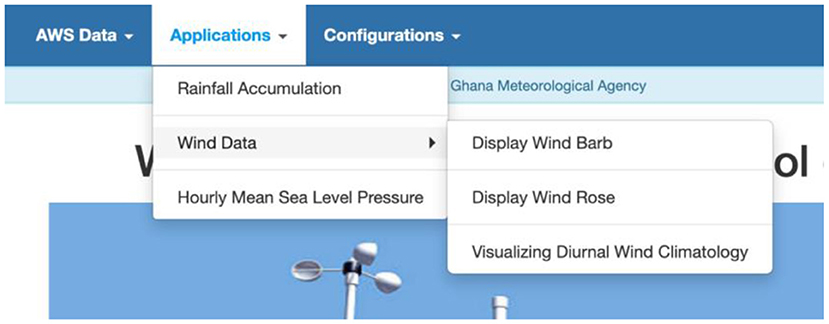
Figure 6. The ADT Applications menu.
The data menu can be sued to display the metadata of the stations on a map, including the status of AWS reporting and availability of the data for the past 1-h or even back to the past 1 month (Figure 7), near real-time data from the AWS as soon as data become available in the database, and historical data. The user has the ability to display tables, graphs (at the time resolution of the selected AWS), and maps (at hourly time intervals) of a selected meteorological variable (Figures 8, 9). One can also display maps, graphs, and tables of the aggregated data at different temporal resolutions (hourly, daily, pentad, dekadal, and monthly), download the data, and display the tables and maps of the quality control outputs.
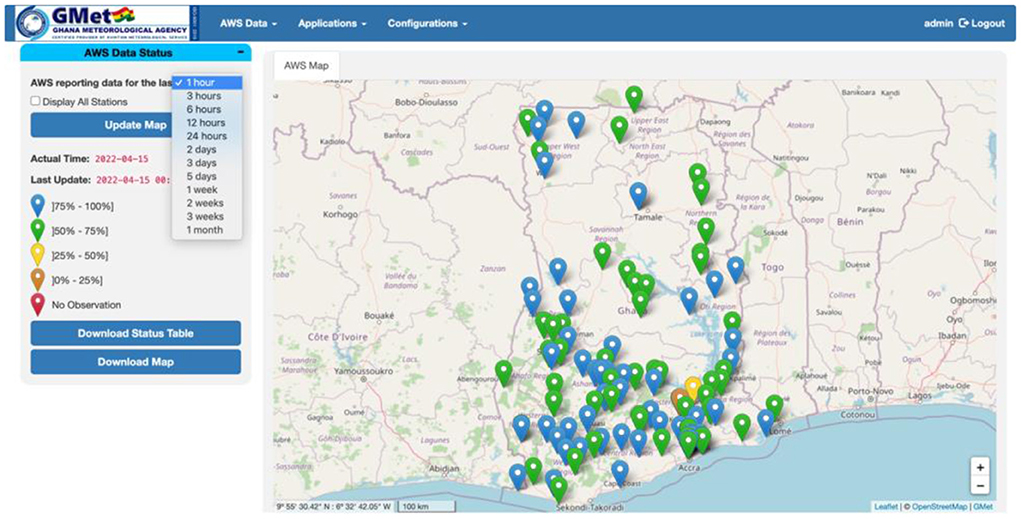
Figure 7. Ghana ADT web portal showing a map of the AWS status data reporting for the past hour as a percent of expected observations.
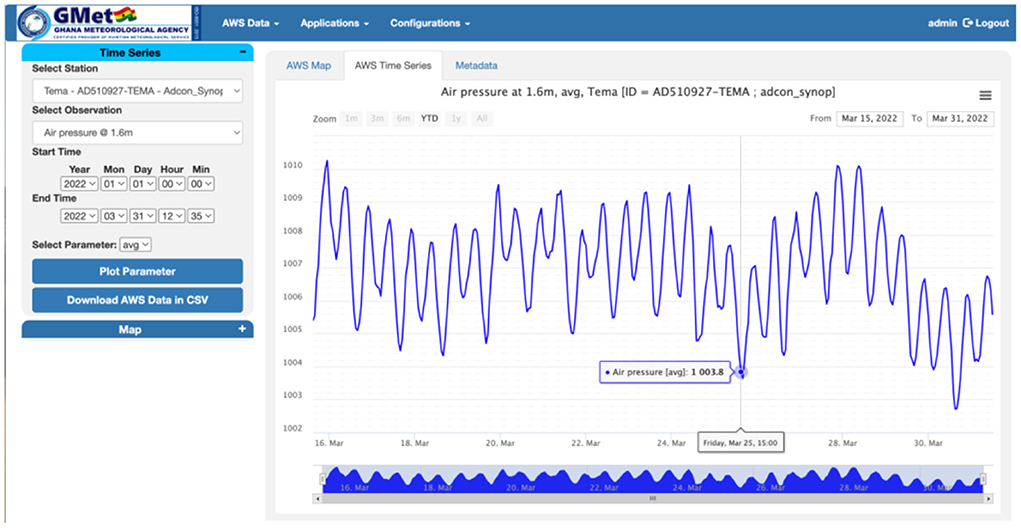
Figure 8. Chart of the 15 min average air pressure for one AWS and for selected period in Ghana.
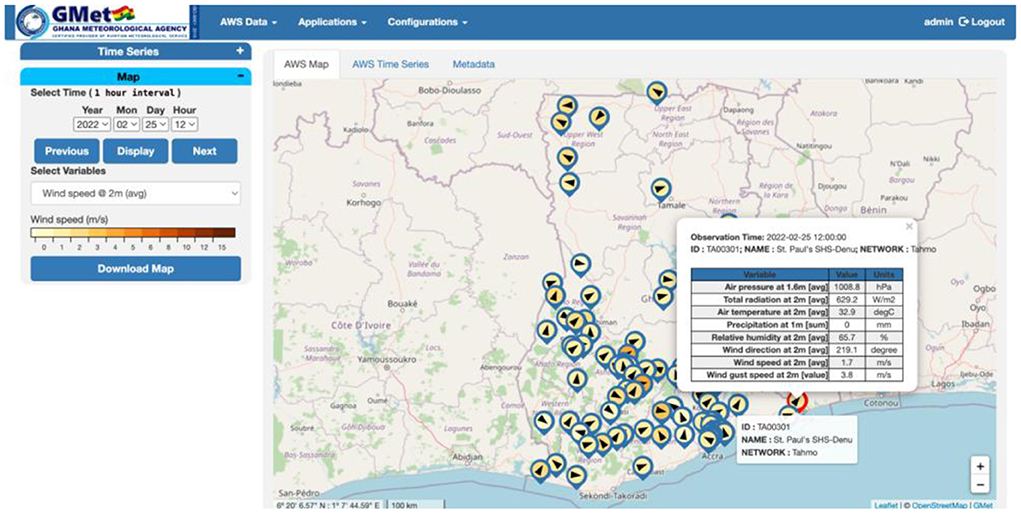
Figure 9. Hourly wind speed at 2 meter above ground for a selected time. The arrows represent the wind direction. All the available meteorological variables could be displayed by clicking on an individual AWS (small table in the figure).
The Applications menu offers only a few options but will be expanded with more relevant and tailored analysis depending on the need of and request from NMHS. In the current menu, users can display graphs and maps of the accumulated rainfall for the past 1 h or go back to the past 90 days as well as analysis and display of wind data as shown in Figure 10.
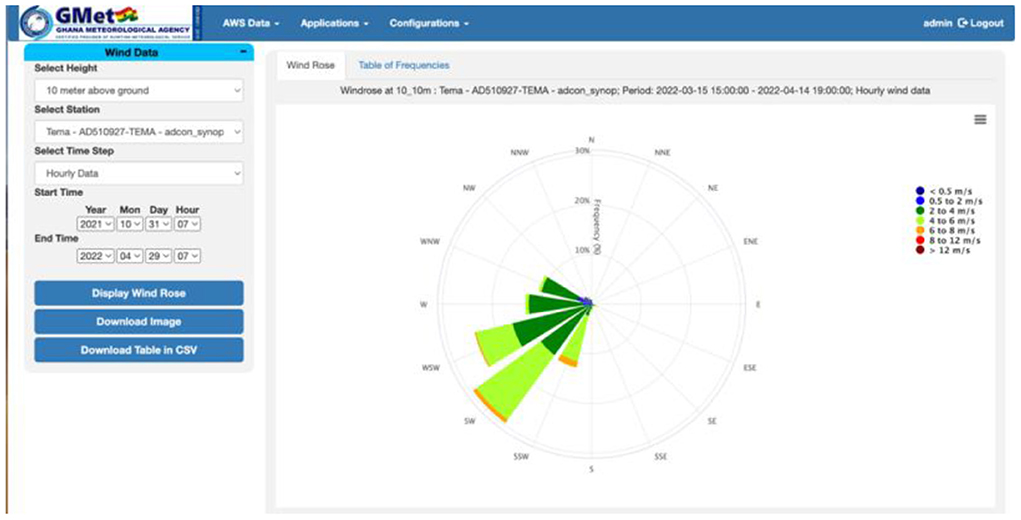
Figure 10. Wind rose chart in the Application menu.
The configurations menu includes user management as well as the configuration of the parameters to be used for the computation of the tailored analysis. Due to the data policies of the different NMHS, a login system is created with different access levels. The number of access levels depends on the need of the NMHS. The administrator level can access all the pages, create and remove users, configure the system and download the data. Figure 11 shows an example of the user management page. The second user access level can access all the pages and download the data but is not allowed to access the user management and configuration pages. The other users are granted access to view some pages and download the data from some networks or from a number of assigned AWS.
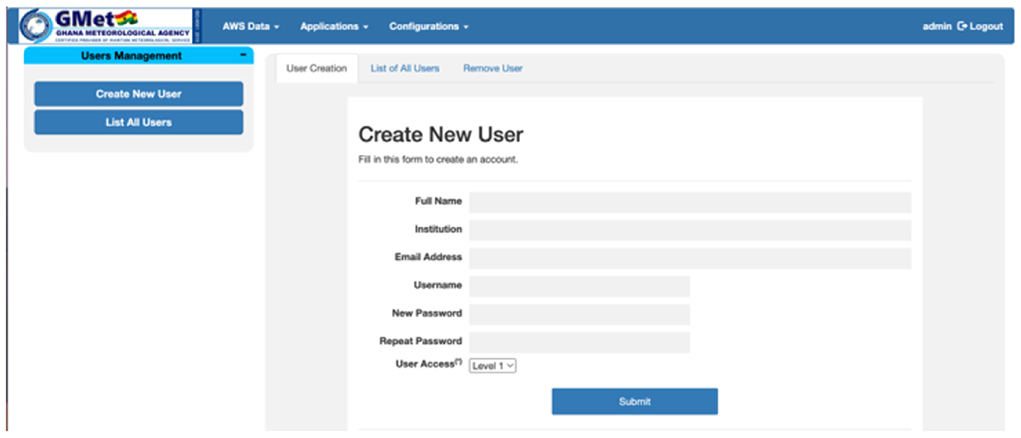
Figure 11. User management page.
Different initiatives (e.g., SASSCAL and TAHMO) and various donors have been supporting the expansion of meteorological observation networks in Africa through the deployment of Automatic Weather Stations (AWS). AWS offers a number of advantages over conventional meteorological observation networks in that they enable automated reporting at a very fine temporal resolution and without the presence of human observers. However, different initiatives and donors deploy different types of AWS, and data collected by these different systems or networks are in different formats and may sit on different servers. This has created a challenge for NMHS to access, process, visualize, and ultimately use these data from the different types of networks.
The International Research Institute for Climate and Society (IRI), Columbia University, has stepped up to this challenge by developing a new tool: the Automatic Weather Station Data Tool (ADT). ADT has so far enabled five NMS in Africa to access, process, perform quality control, and visualize data from different AWS networks and systems in one place. The installation of ADT is accompanied by training of NMS staff at two levels. The first training is for IT staff on configuring and maintaining the system, including the web interface. The second training is mainly for data staff who manage the data.
This tool, which was borne out of practical necessity, can play a significant role in supporting efforts being made to overcome observation gaps and improve climate services in these countries. In particular, one of the main strengths of ADT is that it can help NMS in providing access to near real-time data display through the web portal. However, while some NMS are open to this, others are not willing to share real-time observations with the public. This is unfortunate, as the near-time display of some weather elements, such as temperature, would provide valuable and actionable information for a variety of users, especially those in the humanitarian space responsible for understanding and assessing vulnerability of populations to climate risk, and planning for and responding to climate hazards. More open sharing of data through the web platform might also be beneficial for the visibility of NMS, which often suffer from inadequate funding or awareness of their tools and services.
Nonetheless, ADT has helped the NMHS to detect some issues in their AWS network that they could not observe before. These include stations with no coordinates or wrong coordinates, wrong daily aggregation, mixed-up measurement units, etc. Other strengths of ADT include the following:
• Data integration through the creation of a unified database;
• Enables additional quality control before final data storage;
• User-friendly web-based interface to analyze, visualize and download data;
• Significantly reduce the time required for data preparation and analysis;
• Facilitate data dissemination.
There have been some challenges in creating a unified database from the different AWS systems. The most serious challenge has been metadata. Some NMHS may not have the complete metadata in the AWS data files. This is particularly true for AWS networks from external organizations that are accessed via FTP. In some cases, the only available information could be just the names of sites where the AWS are installed. And sometimes there are duplicate coordinates, or two or more AWS sharing the same coordinates. In addition, in cases where data are stored in a table format and the header of the table is encoded, the information explaining the columns in the table is missing. In such cases, one has to guess or compute a descriptive statistic to understand the type of meteorological variables recorded in each column and the units of the different variables.
Inconsistencies have also been observed in data stored in data files. These inconsistencies range from file naming conventions to how the header of the data table is formatted. For example, if data for each day is stored in separate files, the file name is expected to have a specific convention. The problem encountered has been changing of naming convention over time. It seems that when a new staff is in charge of the server, that staff changes the structure of file names. In the same way, if the data is stored in a table format, the header describing the columns may also change over time. This means that the same meteorological variable may have a different header over time. Likewise, when a new station is added, the naming of the file and the header also change. This complicates the creation of scripts to access and process the data.
The other challenge has been that the frequency at which data is stored in the database or written to the data file may not be uniform. Some networks store data at regular time intervals depending on the AWS time resolution (5, 10, and 15 min), other networks store data at different time intervals such as every 1, 2, 3, 6, or 12 h. These inconsistencies make the real-time spatial quality control complicated.
Of course, ADT also suffers from some weaknesses. The main weakness could be that ADT needs to be configured for each NMS and each AWS system. So, one cannot just install ADT and be done with it. Configuration may take days, even weeks, depending on the number of AWS networks and the availability and completeness of metadata. Understanding and configuring the local network is another time-consuming task. There are some other ADT weaknesses, which include the following:
• ADT depends entirely on the local network at the NMS and the internet if the server of the AWS network is located outside the NMHS. Thus, data streams will be interrupted if the local network or internet is down;
• The background map and tiles use OpenStreetMap, which heavily depends upon internet availability.
Going forward, ADT would need to be strengthened and also expanded to other NMS in Africa and other developing countries that can use this kind of tool. The strengthening aspect, some which came as feedback from NMS staff we have worked with, include the following:
• Improve the rendering of charts, tables, and maps according to the user feedbacks;
• Add a search engine to quickly find station and data of interest;
• Add more analyses/applications in consultation with NMS;
• Add a menu to visualize gridded data from the interpolation of AWS data and/or merging of AWS data with a proxy (satellite observation data or reanalysis);
• Add a menu to display data from manual stations; displaying graphs of manual station and AWS together at different temporal resolutions can help to compare the two observations;
• Create API endpoints for specific data-driven models; for example, extract the data from the MySQL database, format the data, compute derived variables and make the data available at the endpoint for the use of the external specific model; and
• Improve user management through the implementation of different access levels depending on geographical location of the user.
The datasets presented in this article are not readily available because data are owned by individual NMS. Requests to access the datasets should be directed to the corresponding author/s.
RF: tool developer. TD: tool development manager and also contributed to manuscript writing. All authors contributed to the article and approved the submitted version.
This work was undertaken jointly as part of the Adapting Agriculture to Climate Today, for Tomorrow (ACToday) Columbia World Project and the Accelerating Impacts of CGIAR Climate Research in Africa (AICCRA) project. AICCRA is a project that helps deliver a climate-smart African future driven by science and innovation in agriculture. It is led by the Alliance of Bioversity International and CIAT and supported by a grant from the International Development Association (IDA) of the World Bank.
We would like to thank Amanda Grossi for reviewing the manuscript for language. We would also like to thank the reviewers for their valuable contribution toward the improvement of the paper.
The authors declare that the research was conducted in the absence of any commercial or financial relationships that could be construed as a potential conflict of interest.
All claims expressed in this article are solely those of the authors and do not necessarily represent those of their affiliated organizations, or those of the publisher, the editors and the reviewers. Any product that may be evaluated in this article, or claim that may be made by its manufacturer, is not guaranteed or endorsed by the publisher.
Becker, A., Finger, P., Meyer-Christoffer, A., Rudolf, B., Schamm, K., Schneider, U., et al. (2013). A description of the global land-surface precipitation data products of the Global Precipitation Climatology Centre with sample applications including centennial (trend) analysis from 1901–present. Earth Syst. Sci. Data 5, 71–99. doi: 10.5194/essd-5-71-2013
Belousov, S. L., Gandin, L. S., and Mashkovich, S. A. (1968). “Computer Processing of Current Meteorological Data,” in Meteorological Translation, No. 18, 1972, Atmospheric Environment Service, eds V. Bugaev. (Downsview, ON: Atmospheric Environment Service), 227.
Climate Services Partnership (2022). What are Climate Services? Available online at: http://www.climate-services.org/about-us/what-are-climate-services/ (accessed April 29, 2022).
Cooper, P. J. M., Dimes, J., Rao, K. P. C., Shapiro, B., Shiferaw, B., and Twomlo, S. (2008). Coping better with current climatic variability in the rain-fed farming systems of sub-Saharan Africa: an essential first step in adapting to future climate change? Agric. Ecosyst. Environ. 126, 24–35. doi: 10.1016/j.agee.2008.01.007
Dinku, T. (2019). “Challenges with availability and quality of climate data in Africa,” in Extreme Hydrology and Climate Variability, eds A. M. Mellese, W. Abtew and G. Senay (Springer Book).
Dinku, T. (2020). “Remote sensing of African rainfall,” in Oxford Research Encyclopedia of Climate Science (Oxford University Press). doi: 10.1093/acrefore/9780190228620.013.778
Dinku, T., Faniriantsoa, R., Cousin, R., Khomyakov, I., Vadillo, A., Hansen, J., and Grossi, A. (2022a). ENACTS: advancing climate services across Africa. Front. Clim. 3, 787683. doi: 10.3389/fclim.2021.787683
Dinku, T., Faniriantsoa, R., Islam, S., Nsengiyumva, G., and Grossi, A. (2022b). The climate data tool: enhancing climate services across Africa. Front. Clim. 3, 787519. doi: 10.3389/fclim.2021.787519
Dinku, T., Thomson, M. C., Cousin, R., del Corral, J., Ceccato, P., Hansen, J., et al. (2018). Enhancing national climate services (ENACTS) for development in Africa. Clim. Dev. 10, 664–672. doi: 10.1080/17565529.2017.1405784
Giensen van de, N., Hut, R., and Selker, J. (2014). The trans-African hydro-meteorological observatory (TAHMO). WIREs Water 1, 341–348. doi: 10.1002/wat2.1034
Hansen, J., Furlow, J., Goddard, L., Nissan, H., Vaughan, C., Rose, A., et al. (2019b). Scaling Climate Services to Enable Effective Adaptation Action. Rotterdam; Washington, DC. Available online at: www.gca.org (accessed August 10, 2022).
Hansen, J. W., Vaughan, C., Kagabo, D. M., Dinku, T., Carr, E. R., Körner, J., et al. (2019a). Climate services can support African farmers' context-specific adaptation needs at scale. Front. Sustain. Food Syst. 3, 21. doi: 10.3389/fsufs.2019.00021
Hansen, J. W., Zebiak, S., and Coffey, K. (2014). Shaping global agendas on climate risk management and climate services: an IRI perspective. Earth Persp. 1, 13. doi: 10.1186/2194-6434-1-13
Hubbard, K. G., Goddard, S., Sorensen, W. D., Wells, N., and Osugi, T. T. (2005). Performance of quality assurance procedures for an ACIS. J. Atmosp. Oceanic Technol. 22, 105–112. doi: 10.1175/JTECH-1657.1
Hubbard, K. G., and You, J. (2005). Sensitivity analysis of quality assurance using the spatial regression approach—a case study of the maximum/minimum air temperature. J. Atmosp. Oceanic Technol. 22, 1520–1530. doi: 10.1175/JTECH1790.1
Muche, G., Kruger, S., Hillmann, T., Josenhans, K., Ribeiro, C., Bazibi, et al. (2018). “SASSCAL WeatherNet: present state, challenges, and achievements of the regional climatic observation network and database,” in Climate Change and Adaptive Land Management in Southern Africa – Assessments, Changes, Challenges, and Solutions, eds R. Revermann, K. M. Krewenka, U. Schmiedel, J. M. Olwoch, J. Helmschrot, N. Jürgens (Göttingen; Windhoek: Klaus Hess Publishers), 34–43.
Sabatini, F. (2017). “Setting up and managing automatic weather stations for remote sites monitoring: from Niger to Nepal,” in Renewing Local Planning to Face Climate Change in the Tropics. Green Energy and Technology, eds M. Tiepolo, A. Pezzoli, V. Tarchiani (Cham: Springer).
Schunke, J., Laux, P., Bliefernicht, J., Waongo, M., Sawadogo, W., and Kunstmann, H. (2021). Exploring the potential of the cost-efficient TAHMO observation data for hydro-meteorological applications in Sub-Saharan Africa. Water. 13, 3308. doi: 10.3390/w13223308
Sheffield, J., Wood, E. F., Chaney, N., Guan, K., Sadri, S., Yuan, X., et al. (2014). A Drought monitoring and forecasting system forsub-Saharan African water resources and food security. Bull. Am. Meteorol. Soc. 95, 861–888 doi: 10.1175/BAMS-D-12-00124.1
Snow, J. T., Biagini, B., Benchwick, G., George, G., Hoedjes, J., Miller, A., and Usher, J. (2016). A New Vision for Weather and Climate Services in Africa, New York, NY: UNDP, License: Creative Commons Attribution CC BY 3.0 IGO.
Stern, B. R. D., and Cooper, P. J. M. (2017). Assessing climate risks and climate change using rainfall data—a case study from Zambia. Exp. Agricul. 47, 241–266. doi: 10.1017/S0014479711000081
Vaughan, C., and Dessai, S. (2014). Climate services for society: origins, institutional arrangements, and design elements for an evaluation framework. WIREs Clim. Change 5, 587–603. doi: 10.1002/wcc.290
Washington, R., Harrison, M., Conway, D., Black, E., Challinor, A., Grames, D., et al. (2006). Africa climate change: taking the short route. Bull. Am. Meteorol. Soc. 87, 1355–1366. doi: 10.1175/BAMS-87-10-1355
WMO (2008). Guide to Meteorological Instruments and Methods of Observation (WMO-No. 8). Geneva: World Meteorological Organization.
WMO (2010). Guide to the Global Observing System (WMO-No. 488). Geneva: World Meteorological Organization.
WMO (2017). Quality Assessment using METEO-Cert: The MeteoSwiss Classification Procedure for Automatic Weather Stations (IOM Report No. 126). Geneva: World Meteorological Organization.
Keywords: automatic weather station (AWS), climate data, climate, data tool, ADT
Citation: Faniriantsoa R and Dinku T (2022) ADT: The automatic weather station data tool. Front. Clim. 4:933543. doi: 10.3389/fclim.2022.933543
Received: 01 May 2022; Accepted: 05 August 2022;
Published: 30 August 2022.
Edited by:
Elena Tarnavsky, University of Reading, United KingdomReviewed by:
Dragan Milošević, University of Novi Sad, SerbiaCopyright © 2022 Faniriantsoa and Dinku. This is an open-access article distributed under the terms of the Creative Commons Attribution License (CC BY). The use, distribution or reproduction in other forums is permitted, provided the original author(s) and the copyright owner(s) are credited and that the original publication in this journal is cited, in accordance with accepted academic practice. No use, distribution or reproduction is permitted which does not comply with these terms.
*Correspondence: Tufa Dinku, dHVmYUBpcmkuY29sdW1iaWEuZWR1
Disclaimer: All claims expressed in this article are solely those of the authors and do not necessarily represent those of their affiliated organizations, or those of the publisher, the editors and the reviewers. Any product that may be evaluated in this article or claim that may be made by its manufacturer is not guaranteed or endorsed by the publisher.
Research integrity at Frontiers
Learn more about the work of our research integrity team to safeguard the quality of each article we publish.