
94% of researchers rate our articles as excellent or good
Learn more about the work of our research integrity team to safeguard the quality of each article we publish.
Find out more
ORIGINAL RESEARCH article
Front. Clim., 08 September 2022
Sec. Predictions and Projections
Volume 4 - 2022 | https://doi.org/10.3389/fclim.2022.926568
 Nikolaos Skliris1*
 Robert Marsh1
 Ivan D. Haigh1Melissa Wood1
 Joel Hirschi2Stephen Darby3Nguyen Phu Quynh4Nguyen Nghia Hung4
Observational rain gauge/satellite and reanalysis datasets since the 1950s are evaluated for trends in mean and extreme rainfall in and around Mainland Southeast Asia (MSEA). Rain gauge data indicate strong increases exceeding 50% in both annual mean precipitation and various extreme precipitation indices over Vietnam and the northwestern part of the peninsula since 1979. The remote influence of ENSO may partially explain the recent precipitation trend toward a more intense regional hydrological cycle, in response to predominant La Niña states over recent decades. Increasing precipitation in MSEA is also associated with increased monsoon intensity in southeast Asia and a northward shift of the monsoon activity center toward MSEA over 1979–2018. Warming-driven evaporation increases were obtained over the adjacent seas typically feeding precipitation over MSEA associated with a shift toward predominantly positive phases of the two major natural climate variability modes of the tropical Indian Ocean, namely the Indian Ocean Dipole and the Indian Ocean Basin Mode. A moisture budget analysis using ERA5 re-analysis data showed increasing oceanic moisture transports along the typical winter and summer moisture pathways toward the MSEA. However, results show that during summer the major part of increased moisture from the oceanic moisture sources ends up as precipitation over the oceanic regions adjacent to MSEA with ERA5 not being able to produce the observed positive trends in summer continental precipitation. On the other hand, ERA5 reveals pronounced increases in winter precipitation over the MSEA, in accordance with rain-gauge data, associated with strongly increasing transport of moisture originated from the western tropical Pacific and the South China Sea.
Coastal regions of Mainland Southeast Asia (MSEA) are densely populated and vulnerable to flooding, as a result of their exposure to storms and the annual monsoonal flood pulse. In Vietnam, 70% of the population lives in coastal regions, and around major deltas in particular. The Mekong delta, home of 19% of the population (18.6 million people) and the largest agricultural producing center in the country (Dun, 2011), has been identified by the IPCC as being one of the three most vulnerable deltas in the world (Nicholls et al., 2007).
Annual total rainfall in MSEA is dominated by the monsoon season, with occasional but major typhoon contributions on a synoptic timescale. The rainfall pattern is very complex and shows strong spatial and seasonal variability. The wind pattern is characterized by a well-established seasonal regime with winds and associated moisture transport mainly originating from the South China Sea and the western tropical Pacific during winter, and from the northern and western parts of the tropical Indian Ocean during summer (Sun and Wang, 2015). Oceanic sources of moisture are known to provide the dominant contribution to precipitation over MSEA compared with continental moisture sources (Wu et al., 2012). There are also strong orographic constraints (Figure 1) which interact with the monsoon and the large-scale atmospheric circulation to shape local continental precipitation (Wang and Chang, 2012), leading to pronounced spatial variations over MSEA. In particular large-scale mountain ranges in the western part of the peninsula between Myanmar and Thailand present an orographic meridional barrier that partitions rainfall east and west of the barrier (Tsai et al., 2015). Mountain ranges along much of Vietnam likewise present a meridional barrier that partly blocks westward moisture fluxes from penetrating further inland during winter and tropical storms that originate in the western Pacific during summer. The wet season across most of MSEA typically starts at mid-spring with the onset of the Southeastern Asian summer monsoon and peaks in summer but as a consequence of combined orographic and seasonal wind patterns the wet season starts later and peaks in Autumn along the eastern part of the peninsula in Vietnam (Figure 2). In the latter region, relatively strong precipitation persists even during winter, whereas in the rest of the peninsula precipitation levels are very low (Figure 2A). At the northern border of MSEA, the Tibetan Plateau blocks winter cold events from the north, thereby generally confining the winter monsoon to southeastern Asia (Yanai and Wu, 2006).
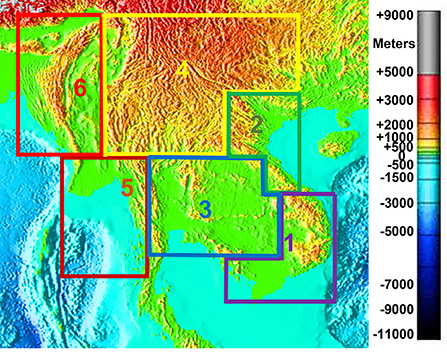
Figure 1. Mainland Southeast Asia topographical map (National Oceanic and Atmospheric Administration, http://www.ngdc.noaa.gov/mgg/image/2minrelief.html) based on ETOPO2v2 topography/bathymetry 2-minute dataset: [NOAA National Geophysical Data Center. 2006: 2-minute Gridded Global Relief Data (ETOPO2) v2. NOAA National Centers for Environmental Information. https://doi.org/10.7289/V5J1012Q. Accessed (1/10/2019)]. The 6 sub-regions for which area-averaged mean and extreme precipitation changes are investigated here are also depicted: (1) South Vietnam, (2) North Vietnam, (3) Central MSEA, (4) North MSEA, (5) South Myanmar, (6) Northwest MSEA.
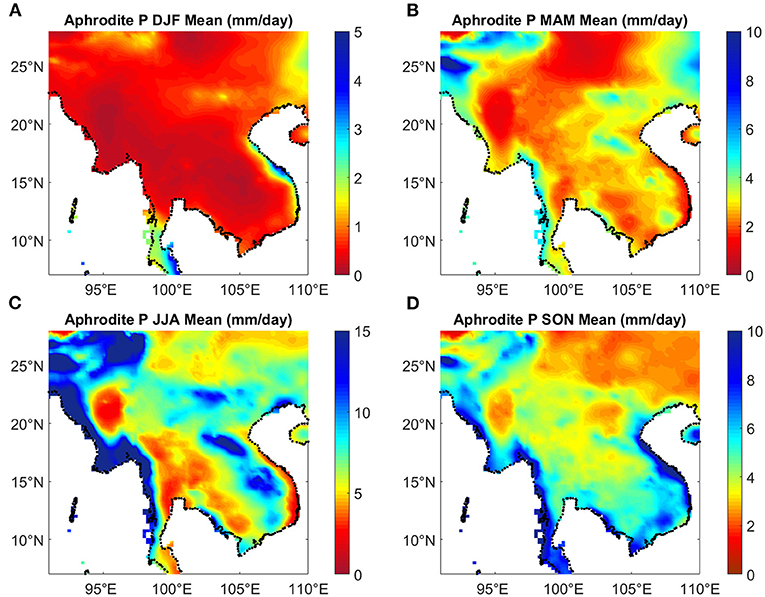
Figure 2. Climatological mean seasonal precipitation patterns over MSEA based on the rain-gauge-based APHRODITE dataset: (A) Winter (Dec–Feb); (B) Spring (Mar–May); (C) Summer (Jun–Aug); (D) Autumn (Sep–Nov).
The frequency and intensity of flooding events across the region are expected to increase as the hydrological cycle amplifies with anthropogenic global warming (Held and Soden, 2006). The Clausius-Clapeyron relationship predicts an increase in the water holding capacity of air of approximately 7% per degree Celsius rise in temperature. Following energy and moisture balance constraints, the increased atmospheric moisture and its horizontal transport in the lower troposphere are expected to increase global mean precipitation and strengthen the mean evaporation minus precipitation pattern, with wet regions becoming wetter and dry regions becoming drier (Held and Soden, 2006). Satellite-derived observations over the global tropical ocean clearly show a robust tendency for a water cycle amplification under anthropogenic warming (Liu and Allan, 2012; Liu et al., 2012; Chou et al., 2013). Liu and Allan (2012), using multiple satellite-based observational products to analyse the response of the global tropical ocean precipitation intensity distribution to changes in surface temperature, found that the wetter area precipitation shows a robust response to temperature rise of around 20%/deg. K. A pronounced increase of tropical ocean rainfall over the last few decades is evidenced in several studies (Fasullo, 2012; Liu et al., 2012; Skliris et al., 2014). Observations and climate model simulations also show that precipitation extremes intensify in a warming climate (e.g., O'Gorman, 2015). As surface temperature rises, the largest increases in mean and extreme precipitation are expected in tropical regions of moisture convergence. Monsoon rainfall and extreme tropical storms in Southeast Asia are therefore at high risk of intensification, with potentially severe socio-economic implications for these regions.
Climate Model Intercomparison Project phase 6 (CMIP6) projections also indicate a strong enhancement of global land monsoon rainfall pattern under a warming climate (Schurer et al., 2020), with the largest rainfall increases being obtained in the Southeast Asian monsoon regions (Chen et al., 2020). However, the uncertainty of precipitation projections is still very high, for the long-term projections and the strongest emissions scenario in particular, with the large inter-model spread mainly being attributed to the model-dependent response to sea surface warming (Chen et al., 2020). Ge et al. (2019) investigated projected changes in precipitation extremes in Southeast Asia based on six high-resolution regional climate models and using the scenarios of 1.5 and 2°C global warming levels exceeding pre-industrial conditions. Their results showed that projected changes in various precipitation extreme indices were significantly amplified over the MSEA in both scenarios, while precipitation extremes were highly sensitive to the additional 0.5°C increase in global warming.
Due to the highly sporadic and localized character of rainfall, and the large difficulties in obtaining reliable in-situ measurements of evaporation and precipitation, over the ocean in particular, there is a very high level of uncertainty in the estimation of observed variability and trends in surface freshwater fluxes (Hegerl et al., 2015). It is particularly difficult to assess drivers of long-term changes in regional continental-scale water cycling. This is especially the case in dynamically complex and data-sparse areas like the MSEA where local precipitation is strongly shaped by interactions between orography and large-scale, seasonally reversing, atmospheric circulation related to the monsoon, and which is also influenced by sporadic but strong storm events (typhoons) mainly originating in the Western Tropical Pacific. The inter-annual/decadal rainfall pattern is also strongly modulated by natural climate variability, with MSEA being located at the crossroads of the major coupled ocean/atmosphere variability modes of the tropical Pacific (El Nino Southern Oscillation) and Indian (Indian Ocean Dipole) Oceans.
Our overall aim in this paper is to investigate large-scale coupled atmosphere/ocean processes that drive mean and extreme rainfall over and around the MSEA using observationally-based (rain gauge and/or satellite-derived) and atmospheric model re-analysis data. Our first objective is to assess historical long-term trends in mean and extreme precipitation over MSEA as well as in mean evaporation over the tropical Indian Ocean and adjacent seas typically feeding precipitation over MSEA. Our second objective is to investigate links between changes in evaporation in oceanic moisture source regions and precipitation by performing a moisture budget analysis. Our third objective is to assess the impact of monsoon activity and large-scale natural climate variability modes of the tropical Indian and Western Pacific oceans on evaporation and precipitation variations in and around MSEA.
Three observationally-based and two atmospheric re-analysis gridded precipitation datasets are used here to investigate precipitation variability and long-term trends over and around MSEA. The three observationally-based datasets comprise:
(1) The Global Precipitation Climatology Project (GPCP v2.3; https://psl.noaa.gov/data/gridded/data.gpcp.html), monthly mean data over land and ocean on a 2.5° × 2.5° grid, available from 1979, based on rain gauge observations over land and satellite retrievals (Adler et al., 2003);
(2) The Asian Precipitation-Highly-Resolved Observational Data Integration Toward Evaluation (APHRODITE), daily data spanning 1950–2007 on a 0.25° × 0.25° grid (Yatagai et al., 2012; APHRO_MA-V1101, aphrodite.st.hirosaki-u.ac.jp);
(3) Climate Prediction Center (CPC), Global Unified Gauge-Based Analysis of Daily Precipitation (https://psl.noaa.gov/data/gridded/data.cpc.globalprecip.html), daily data spanning 1979–2018 on a 0.5° × 0.5° grid.
The two atmospheric reanalysis-based evaporation and precipitation datasets used here are obtained from:
(1) NCEP/NCAR Reanalysis 1 (https://psl.noaa.gov/data/gridded/data.ncep.reanalysis.html) spanning 1948-present on a 2.5° × 2.5° grid (Kistler et al., 2001) and
(2) The European Center for Medium-Range Weather Forecasts ERA5 global reanalysis (https://www.ecmwf.int/en/forecasts/datasets/reanalysis-datasets/era5) spanning 1979-present on a 0.25° × 0.25° grid (Hersbach et al., 2020). In addition, two variables provided in ERA5 involved in the moisture budget were used here, namely the vertically integrated atmospheric moisture transport convergence and the vertically integrated atmospheric water vapor transport.
Oceanic evaporation is also obtained by the Objectively Analyzed air–sea Fluxes (OAFlux) dataset developed by Yu et al. (2008) (http://rda.ucar.edu/datasets/ds260.1/), that blends NCEP and ERA-40 reanalysis products with satellite surface meteorology through an objective synthesis, with monthly data spanning 1958-present on a 1° × 1° grid. Near-surface salinity trends are assessed using the UK Met Office Hadley Center Enhanced Ocean Data Assimilation and Climate prediction (ENACT) archive version4 (En4, subversion En4.1.1, 1° × 1° grid) dataset (http://www.metoffice.gov.uk/hadobs/en4) developed by Good et al. (2013).
We have chosen 6 sub-regions to investigate changes in precipitation over the MSEA, each of which is characterized by different precipitation/wind seasonal patterns and orographic constraints, namely: (1) South Vietnam, (2) North Vietnam, (3) Central MSEA, (4) North MSEA, (5) South Myanmar, and (6) NW MSEA (see Figure 1). For simplicity rectilinear boxes are used to define the 6 sub-regions. Note that the geographical areas of sub-regions named by a specific country largely consist of that country (or the largest part of that country) but may also include smaller portions from other nations.
We use extreme precipitation indices based on daily precipitation data as defined by the Expert Team on Climate Change Detection and Indices (ETCCDI) to quantify climate extremes with reoccurrence times of a year or shorter (Sillmann et al., 2013). Extreme precipitation indices employed here include RCPTOT (total precipitation of wet days), SDII (simple daily precipitation intensity), R10mm (number of days of heavy rainfall, defined as >10 mm/day), R20mm (number of days of very heavy rainfall, defined as >20 mm/day), and CDD (number of consecutive dry days). Wet (dry) days are defined as days with >1 mm (<1 mm) of rainfall.
Following the atmospheric backtracking analysis of continental precipitation by van der Ent and Savenije (2013) we have identified three major oceanic regions supplying moisture for MSEA precipitation, namely: The South China Sea, the Bay of Bengal, and the Arabian Sea. A significant oceanic moisture source is defined when on average more than 20% of the total evaporation, and at least 250 mm year−1 of evaporation from the source region, ends up as continental precipitation (van der Ent and Savenije, 2013). Area-averaged monthly evaporation timeseries are constructed for each oceanic region.
We construct monthly anomaly time series for all datasets by subtracting the climatological monthly mean from the monthly data at each grid point. Seasonal and annual anomalies are then constructed from the monthly anomalies, allowing us to compute linear trends. Uncertainties in linear trends are estimated using the standard error of a linear fit (least squares).
Land precipitation based on the rain-gauge-based APHRODITE dataset, analyzed here to assess long-term trends, show an overall increase in precipitation since the 1950s but there is no coherent spatial signal over MSEA. There is a statistically significant (at the 95% confidence interval) increase in annual precipitation (~30–40% in respect to climatological annual mean over 1950–2007) throughout Vietnam (sub-regions 1 and 2) and decreasing trends in NW MSEA (sub-region 6) throughout the wet season, with maximum changes during summer (Figure 3). On the other hand, there are very low trends (not statistically significant) in large parts of north and central parts of MSEA including in South Myanmar and Thailand, in agreement with the study of Tsai et al. (2015).
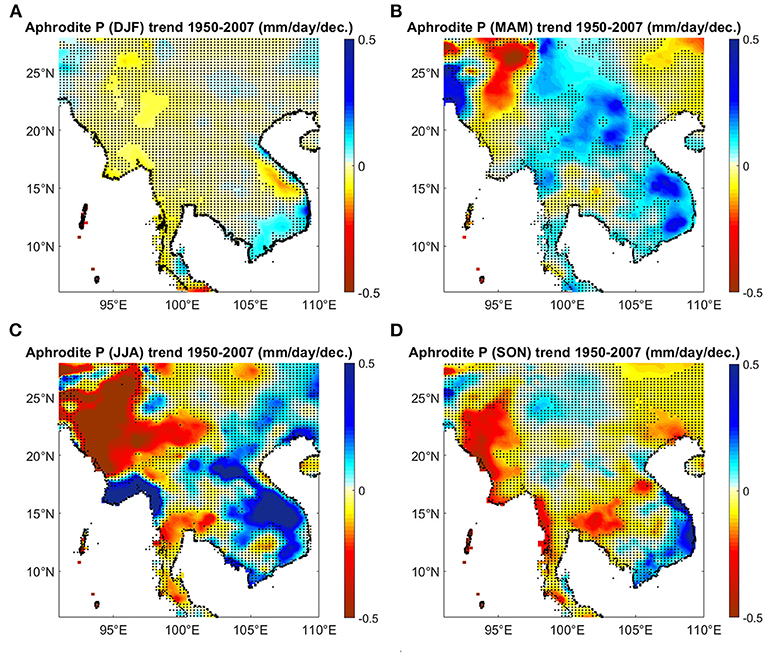
Figure 3. Seasonal precipitation trends (mm/day/decade over 1950–2007 based on the rain-gauge-based APHRODITE dataset: (A) Winter (Dec–Feb); (B) Spring (Mar–May); (C) Summer (Jun–Aug); (D) Autumn (Sep–Nov). Regions where the linear trend is not significant at the 95% confidence interval are stippled.
Analysis of precipitation data from the NCEP/NCAR reanalysis over 1950–2018 shows a statistically significant positive trend only over southern MSEA (~20–30% increase with respect to the climatological annual mean) with a more wide-spread signal compared to the rain gauge dataset and low (not statistically significant) trends roughly north of 15° North (Supplementary Figure S1). In general, there are large spatial discrepancies between the two datasets in representing long-term trends, over the northwest MSEA in particular. Moreover, the trend in land precipitation in NCEP/NCAR re-analysis is much less than that over the ocean around MSEA. Both NCEP/NCAR and 20th Century reanalysis products suggest a strong large-scale increase in precipitation in the eastern tropical Indian Ocean and western tropical Pacific Ocean over that period (Skliris et al., 2014). This large-scale, spatially-coherent, pattern of increasing oceanic precipitation since the 1950s appears to be the most pronounced signal of change within the global ocean. However, as a strong caveat, we need to stress the limits to which atmospheric reanalyses can adequately represent precipitation variability prior to the start of the satellite era in 1979. Large uncertainty in the precipitation long-term trend from 1950 estimated here based on the NCEP/NCAR re-analysis may arise from inhomogeneities in the timeseries due to the incorporation of satellite data in the assimilation scheme after 1979.
Spatial patterns in precipitation trends over 1979–2018 as derived by the CPC rain gauge-based dataset show spatially variable changes, with larger precipitation increases exceeding 50% (with respect to the climatological mean) over Vietnam (sub-regions 1 and 2) and the northwestern part of the peninsula (sub-region 6), versus much lower trends, or even precipitation decreases, over large parts of central and northern MSEA. Seasonal precipitation trend patterns (Figure 4; Table 1) indicate that this contrast is evidenced throughout the summer monsoon season (Figure 4C), but it is also present in the declining phase of the monsoon in autumn (Figure 4D). A pronounced widespread increasing precipitation trend persists along the Vietnam coast in winter (Figure 4A).
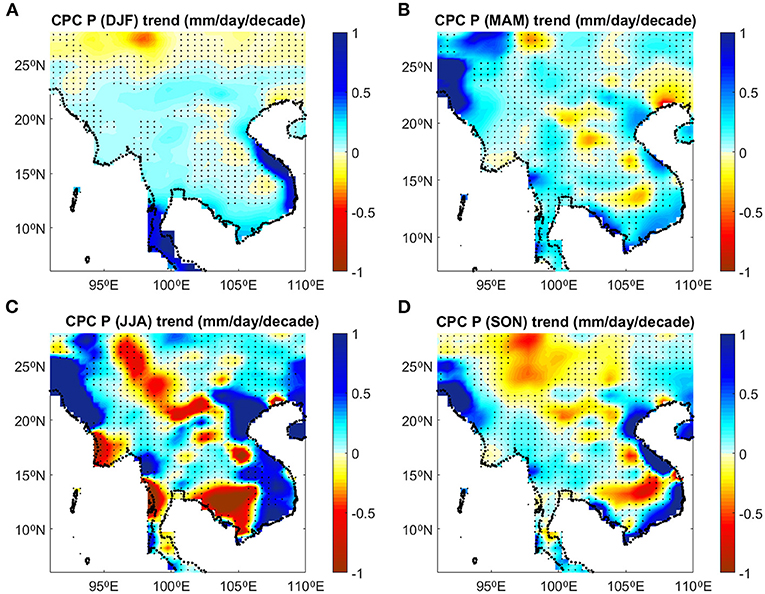
Figure 4. Seasonal precipitation trends (mm/day/decade) over 1979–2018 from the Global Unified Gauge-Based Analysis of Daily Precipitation–Climate Prediction Center (CPC) dataset: (A) Winter (Dec–Feb); (B) Spring (Mar–May); (C) Summer (Jun–Aug); (D) Autumn (Sep–Nov). Regions where the linear trend is not significant at the 95% confidence interval are stippled.
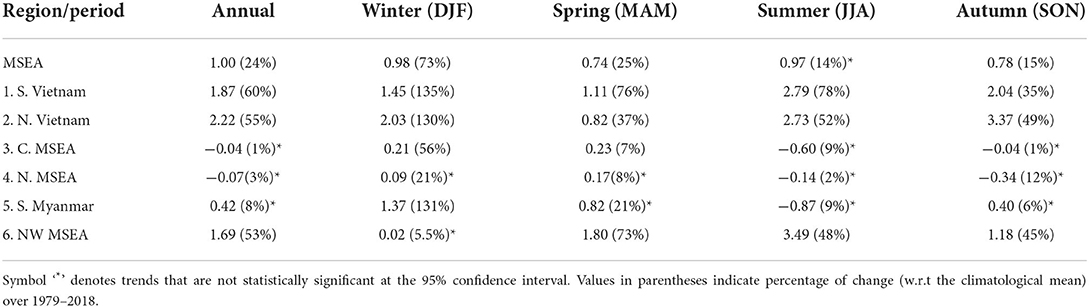
Table 1. Precipitation annual and seasonal trends (mm/day/40 years) over 1979–2018 averaged over MSEA and the 6 sub-regions considered in this study based on the Global Unified Gauge-Based Analysis of Daily Precipitation–Climate Prediction center (CPC).
Importantly, the daily CPC data clearly demonstrate an intensification of extreme precipitation events over 1979–2018 with highly statistically significant positive trends in several extreme precipitation indices considered here throughout Vietnam (sub-regions 1 and 2) and the northwestern part of the peninsula (sub-region 6) in particular (Figure 5; Table 2). Increases in total wet season precipitation (PRCPTOT) and in number of days of heavy (R10mm) and extreme (R20mm) rainfall exceed 50% in the above areas over 1979–2018. There is also a significant decrease in the dry season period throughout Vietnam as expressed in the large reduction of the CDD index. Together with increasing mean and extreme precipitation, changes in the monsoon onset and duration can have strong implications for agriculture in these regions (Wati et al., 2019). In contrast, together with mean summer precipitation, extreme precipitation indices are significantly reduced over parts of Cambodia, Thailand, and Laos over 1979–2018.
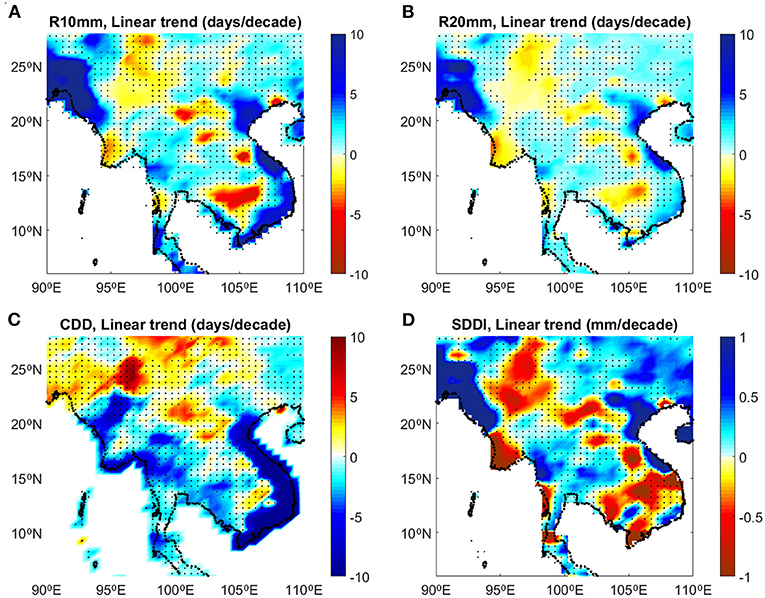
Figure 5. Trends over 1979–2018 in extreme precipitation indices from the Global Unified Gauge-Based Analysis of Daily Precipitation–Climate Prediction Center (CPC) dataset. (A) R10mm: Number of days of heavy precipitation (P > 10 mm), (B) R20mm: Number of days of very heavy precipitation (P > 20 mm), (C) CDD: Number of Consecutive Dry Days, (D) SDII: Simple daily precipitation intensity. Regions where the linear trend is not significant at the 95% confidence interval are stippled.
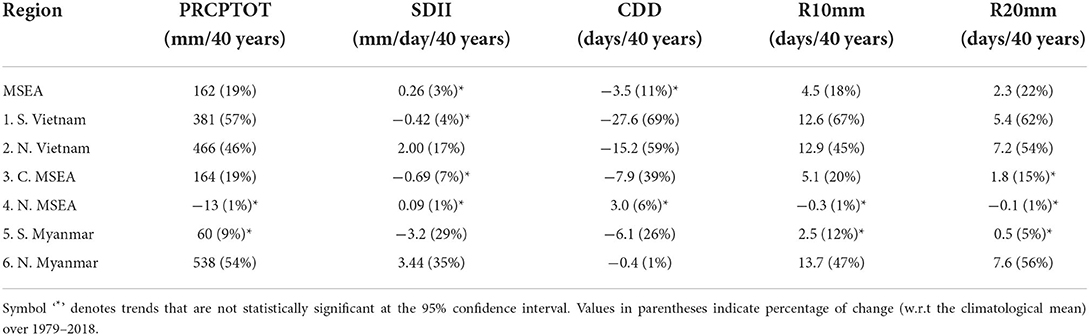
Table 2. Trends in extreme precipitation indices averaged over MSEA and the 6 sub-regions considered in this study based on the global unified gauge-based analysis of Daily Precipitation–Climate Prediction Center (CPC) over 1978–2018.
Analysis of satellite-derived ocean precipitation (Figure 6A) and near surface salinity (Figure 6C) show that ocean precipitation and salinity has increased and decreased, respectively, around MSEA over the last 40 years (1979–2018) indicating an accelerated broad-scale freshening of the tropical eastern Indian and western Pacific oceans over that period (Skliris et al., 2014). Low-resolution GPCP shows a statistically significant positive trend over southern MSEA but is largely inconsistent with the CPC rain-gauge dataset (Figure 6B) in terms of the identification of precipitation trends over large parts of the peninsula, in northwestern MSEA in particular.
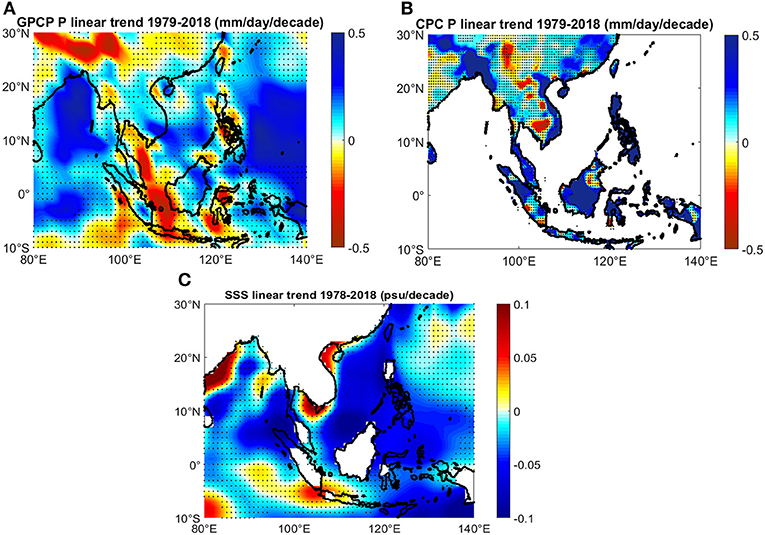
Figure 6. Linear trends over 1979–2018 in (A) GPCP Precipitation; (B) CPC Precipitation; (C) En4 Near Surface Salinity. Regions where the linear trend is not significant at the 95% confidence interval are stippled.
Rain-gauge data (Aphrodite and CPC) indicate a strong widespread precipitation increase throughout Vietnam since the 1950's which has accelerated over the last 40 years. This pronounced change in precipitation obtained here is in contrast with the study of Nguyen et al. (2014), who investigated variations of Vietnam rainfall based on 60 meteorological stations over the earlier period of 1971–2010 but found no statistically significant trends over most of the Vietnam region. However, in a more recent study Gao et al. (2019) found a strong significant increase in spring precipitation with a concomitant decrease in extreme drought throughout Vietnam during the past 4 decades, in agreement with our results.
Seasonal surface wind patterns clearly reveal a reversing source of moisture fluxes to MSEA from the South China Sea in winter, to the Bay of Bengal in summer (Zhang et al., 2019). There are two distinct major oceanic moisture pathways providing moisture for precipitation to MSEA following the seasonal wind pattern regimes (Supplementary Figure S2). During summer moisture transport gains intensity in a northeastward pathway along the highly evaporative central and northwestern Indian Ocean and Arabian Sea, then eastward through and south of the Indian Peninsula to the Bay of Bengal to finally reach the MSEA (Supplementary Figure S2A). Dey and Döös (2021) showed that the strong summer precipitation over Myanmar and its nearby regions is primarily fed by moisture originating from the central and south Indian Ocean, which has passed over the Bay of Bengal. During winter the moisture transport direction is reversed from eastward to westward with ocean moisture sources located in the northwestern tropical Pacific Ocean and the South China Sea (Supplementary Figure S2B). Moisture transport toward the MSEA is considerably decreased during winter with relatively large values being obtained only in the South China Sea and across the southern part of the MSEA. Continental moisture transport, mainly reaching the northern part of the peninsula, is several times lower than oceanic moisture transport, throughout the year.
Figures 7A,B show the spatial pattern of long-term trends in evaporation since the 1950s from NCEP/NCAR (1950–2018) and OAFlux (1958–2018), respectively. Both products indicate broad-scale evaporation increases over the typical oceanic moisture transport pathways to MSEA. Here we particularly focus on evaporation long-term variations in the main three oceanic sources of moisture for MSEA precipitation as defined in the atmospheric backtrack analysis of van der Ent and Savenije (2013) i.e., the South China Sea, the Bay of Bengal, and the Arabian Sea. The Bay of Bengal moisture contribution for MSEA precipitation peaks in June–August with the summer monsoon peak mainly supplying moisture in the northwestern part of the peninsula where on average it contributes locally to ~10–25% of total precipitation (van der Ent and Savenije, 2013). The South China Sea moisture contribution peaks in August–November mainly supplying moisture to the east coast along Vietnam, when the monsoon period is in the declining phase, contributing locally to 10–25% of total precipitation (van der Ent and Savenije, 2013). The Arabian Sea, although relatively distant, is also a significant moisture source, mainly supplying moisture to northwestern MSEA where on average it contributes to 10–20% of total precipitation.
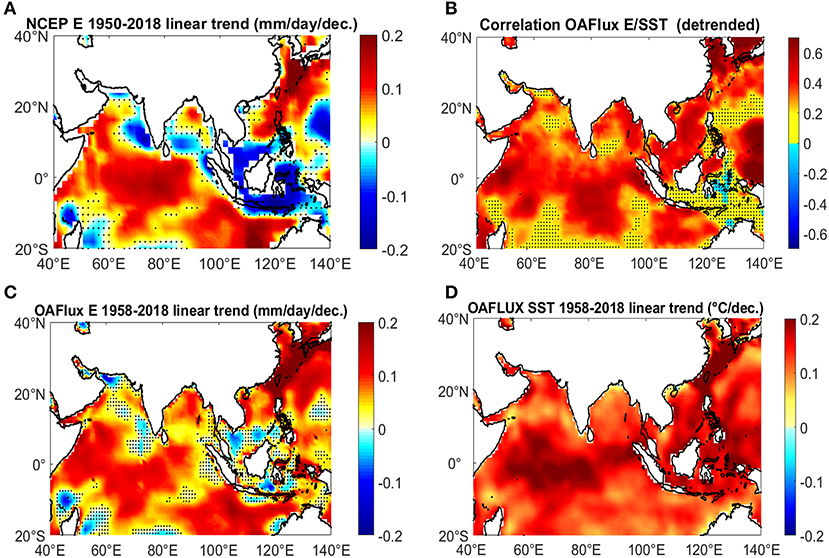
Figure 7. (A) Linear trends in evaporation (mm/day/decade) from OAFlux (1958–2018); (B) Correlation spatial pattern between annual mean evaporation (OAFlux) and SST (OAFlux) anomaly timeseries (detrended). (C) Linear trends in evaporation (mm/day/decade) from NCEP/NCAR (1950–2018); (D) Linear trend in SST (OAFlux) over 1958–2018 (°C/decade). Regions where the linear trend/correlation is not significant at the 95% confidence interval are stippled.
Our analysis of area-averaged ocean evaporation based on the OAFlux dataset (Supplementary Figure S3) shows highly statistically significant positive trends over the Arabian Sea (0.085 mm/day/decade), Bay of Bengal (0.069 mm/day/decade), and South China Sea (0.096 mm/day/decade), amounting to increases of annual evaporation of 13, 10, and 16%, respectively, during 1958–2018. The long-term evaporation increases obtained here in the oceanic moisture sources for MSEA precipitation are in-line with strongly increasing surface warming (Figure 7C) that would act to enhance ocean latent heat fluxes in these regions. Relatively high significant correlations between annual SST and Evaporation anomaly timeseries (R > 0.5, p < 0.05) were obtained over the major moisture transport pathways toward the MSEA (Figure 7D). This trend seems to be part of a broad-scale spatially coherent pattern of evaporation increase in the tropical Indian and western Pacific Oceans (e.g., Skliris et al., 2014) that is consistent with a warming-driven intensification of the global hydrological cycle, clearly evidenced over the last 50–60 years (Durack et al., 2012; Skliris et al., 2016; Zika et al., 2018).
OAFlux evaporation analysis also shows that evaporation trends become stronger over 1979–2018 (see Supplementary Figure S3) in the main three moisture source regions (Arabian Sea: 0.123 mm/day/decade; Bay of Bengal: 0.088 mm/day/decade; South China Sea: 0.126 mm/day/decade) as ocean surface warming is accelerating. Area-averaged annual evaporation and SST anomalies are significantly correlated in all three regions (R ~ 0.6–0.7, p < 0.05). This is consistent with the study of Su and Feng (2015) who found a significant positive broad-scale warming-driven linear trend in evaporation in the Tropical Indian Ocean over 1979–2011 based on the analysis of various atmospheric re-analysis products.
Accelerating precipitation trends over large parts of MSEA after 1979 coincide with increasing trends in evaporation in all three of the major oceanic moisture sources. The higher rate of evaporation increase between ocean moisture source regions is obtained in the South China Sea, which could be associated with the large increasing precipitation trend over the eastern coast of the peninsula along the whole Vietnam region. This is especially evidenced during autumn and winter when moisture fluxes to Vietnam originate mainly from the South China Sea. On the other hand, moisture transport from the Bay of Bengal and Arabian Sea mainly affect the northwest part of MSEA during summer. Therefore, evaporation increases in these two oceanic moisture source regions could explain at least part of the pronounced precipitation increases over NW MSEA (sub-region 6). As expected, correlations between seasonal area-averaged evaporation in the ocean moisture source regions (OAFlux) and precipitation (CPC) over MSEA sub-regions (not shown) are generally low and not statistically significant. This is probably due to the fact that the climatological mean contribution of each of the three ocean source regions to total precipitation of each sub-region is relatively small (varying between roughly 5 and 30%, van der Ent and Savenije, 2013). Statistically significant correlations (R ~ 0.3, p < 0.05) were only found in this study between precipitation in Vietnam regions and South China Sea evaporation during the autumn and winter. On the other hand, large parts of central and north MSEA show small and not statistically significant trends in precipitation, whereas there are even statistically significant negative trends in summer and autumn over most of Cambodia and parts of southern Thailand and Laos (see Figure 5). Orographic constraints, i.e., meridional mountain ranges along Vietnam and western Thailand blocking eastward and westward moisture transport, respectively, together with changes in local moisture convergence, could explain why these increased ocean moisture signals may not reach the interior of the peninsula to enhance precipitation in Central MSEA. Although oceanic sources of moisture contribute considerably more than continental sources to precipitation over MSEA, it is very difficult to assess the contribution of land moisture changes to the local precipitation trend. There is currently large uncertainty in estimating global evapotranspiration trends (Zhang et al., 2019; Pan et al., 2020). Ensemble mean global datasets based on advance remote sensing and land surface models indicate much lower and mostly not statistically significant evapotranspiration trends over MSEA compared to oceanic evaporation trends during recent decades (Pan et al., 2020).
In this section we further explore the high-resolution ERA5 re-analysis dataset (1979–2018) to investigate long-term changes in the water cycle components and water vapor transport over the ocean and the MSEA. Importantly we also perform a moisture budget analysis for the ocean moisture source regions and the MSEA to investigate the link between changes in oceanic evaporation and changes in precipitation in and around the MSEA.
Figure 8 shows annual trends in the water cycle components (E, P, and E-P) as well as the vertically integrated atmospheric water vapor transport in ERA5 over 1979–2018. Results show a broad-scale increasing annual evaporation trend in the tropical Indian Ocean (Figure 8A) in agreement with the other ocean evaporation datasets considered here (OAFlux, NCEP) and also consistent with the study of Su and Feng (2015) based on a large number of atmospheric re-analysis products. However, overall, oceanic evaporation trends are less pronounced in ERA5 as compared to the objectively analyzed OAFlux dataset over 1979–2018. Annual and seasonal trends in ERA5 land evaporation (evapotranspiration) are too small compared to oceanic evaporation trends (~one order of magnitude lower) and not statistically significant in the largest part of the MSEA over the considered period. This is consistent with recent studies showing very low/insignificant evapotranspiration trends over MSEA during the last few decades (Zhang et al., 2019; Pan et al., 2020). Importantly, evapotranspiration was found not to be correlated to local precipitation over MSEA (Zhang et al., 2019) indicating a very low contribution to moisture budget variations.
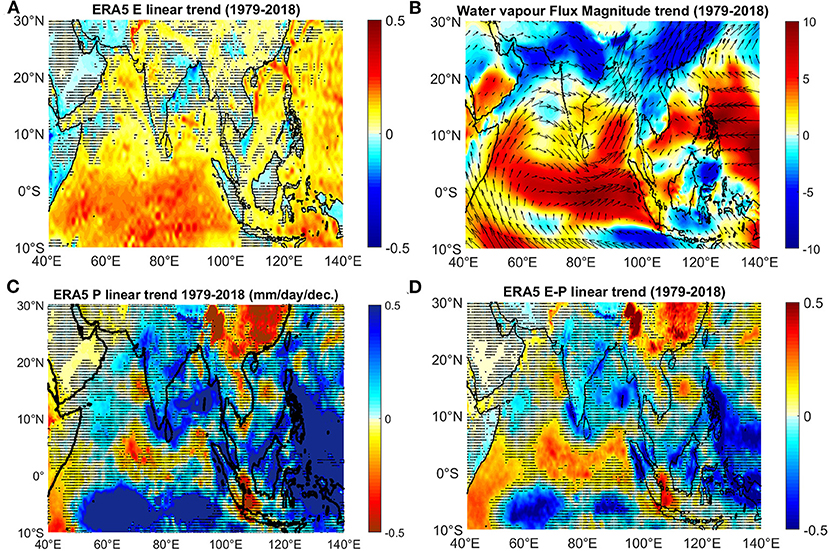
Figure 8. ERA5 annual linear trends (1979–2018) in (A) Evaporation (mm/day/dec.); (B) Magnitude of vertically integrated atmospheric water vapor transport (kg m−1 s−1/dec.) (C) Precipitation (mm/day/dec.); (D) Evaporation minus Precipitation (mm/day/dec.); The climatological annual mean atmospheric water vapor transport (vectors, kg m−1 s−1) is also depicted. Regions where the linear trend is not significant at the 95% confidence interval are stippled.
The spatial pattern of the annual trend in vertically averaged atmospheric water vapor transport shows significant increases along the two main seasonal pathways of ocean moisture feeding the MSEA (Figure 8B). Together with extra moisture reaching the North Indian Ocean from the equatorial region and the northwestern tropical Pacific, net evaporation (E–P) is strongly increasing in large parts of the southern Arabian Sea, in the northeastern equatorial zone (south of the Bay of Bengal) and in the central South China Sea providing extra moisture along the main moisture pathways to the MSEA (Figure 8D). This leads to a strong increase in annual precipitation around the MSEA (Figure 8C) and especially in the Bay of Bengal which seems to have been receiving a large part of this extra moisture. ERA5 shows a widespread increase in annual precipitation over the Bay of Bengal that is consistent with the satellite-derived GPCP data. However, area-averaged annual precipitation increase over the Bay of Bengal is lower in ERA5 (~18%) compared to GPCP (28%) over 1979–2018. Results indicate an amplification of the oceanic water cycle over the tropical Indian Ocean during 1979–2018 with increasing oceanic moisture transports whilst dry regions such as the Arabian Sea (E > P) becoming drier (ΔE > ΔP) and wet regions such as the Bay of Bengal (P > E) becoming wetter (ΔP > ΔE).
Spatial patterns of precipitation trends since 1979 in southeast Asia show a relatively good consistency between reanalyses (NCEP/NCAR, ERA5) and satellite-derived precipitation (GPCP) over the ocean (see Supplementary Figure S1), but much larger discrepancies over land. ERA5 precipitation trends over MSEA are consistent in sign over some parts of the peninsula, but much lower in magnitude compared with the CPC rain-gauge data over 1979–2018. In particular, relatively low and mostly not statistically significant precipitation increases are obtained over the western part of MSEA and close to the Vietnamese coastline whereas decreasing trends are obtained in central and northern parts of the peninsula. ERA5 precipitation trend spatial pattern is inconsistent across Vietnam and NW MSEA with rain-gauge data which show instead large widespread precipitation increases. Area-averaged annual precipitation over South MSEA (5–18°N) is increased by ~6% in ERA5 compared to ~26% in CPC. The discrepancy is even larger over North MSEA (18–30°N) where ERA5 shows a decrease in annual precipitation of ~13% compared to an increase in annual precipitation in CPC of ~20%.
Here we focus on long-term changes of the moisture budget over winter and summer seasons which are characterized by contrasting wind/moisture transport regimes. We calculated the spatial change patterns (1979–2018) of P, E–P, vertically integrated moisture transport convergence, and vertically integrated atmospheric water vapor transport during summer (Figure 9) and winter (Figure 10). We also performed an area-averaged moisture budget analysis for the south and north parts of the MSEA as well as for four oceanic moisture source regions, including the three major regions discussed in the previous sections (Arabian Sea, Bay of Bengal, and South China Sea) and the northeast equatorial region which is identified here as another major moisture source region for precipitation in and around the MSEA. We calculated area-averaged E, P, and E–P change over each region as well as changes in the zonally/meridionally integrated atmospheric water vapor transports across the boundaries of each region, with results summarized in Figure 11.
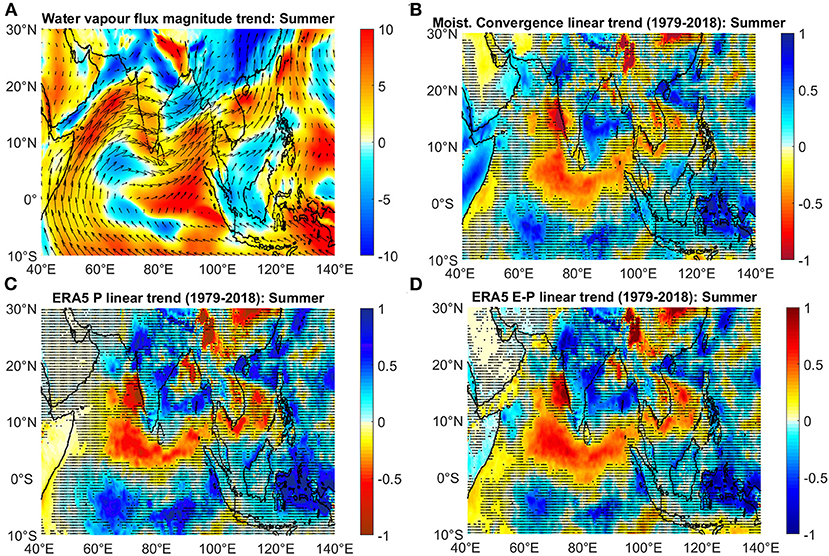
Figure 9. ERA5 summer (JJA) linear trends (1979–2018) in (A) Magnitude of vertically integrated atmospheric water vapor transport (kg m−1 s−1/dec). The climatological summer mean atmospheric water vapor transport (vectors, kg m−1 s−1) is also depicted. (B) Moisture transport convergence (mm/day/dec.); (C) Precipitation (mm/day/dec.); (D) Evaporation minus Precipitation (mm/day/dec.). Regions where the linear trend is not significant at the 95% confidence interval are stippled.
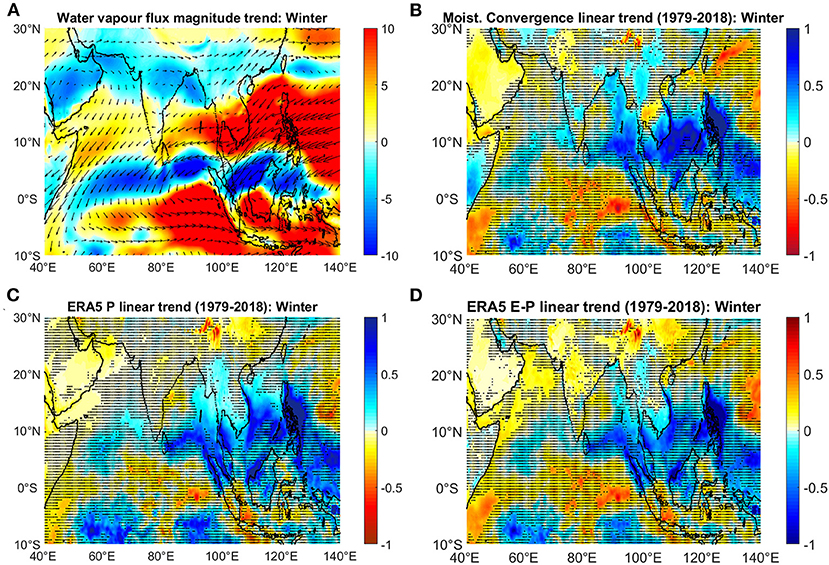
Figure 10. ERA5 winter (DJF) linear trends (1979–2018) in (A) Magnitude of vertically integrated atmospheric water vapor transport (kg m−1 s−1/dec.). The climatological winter mean atmospheric water vapor transport (vectors, kg m−1 s−1) is also depicted. (B) Moisture transport convergence (mm/day/dec.); (C) Precipitation (mm/day/dec.); (D) Evaporation minus Precipitation (mm/day/dec.). Regions where the linear trend is not significant at the 95% confidence interval are stippled.
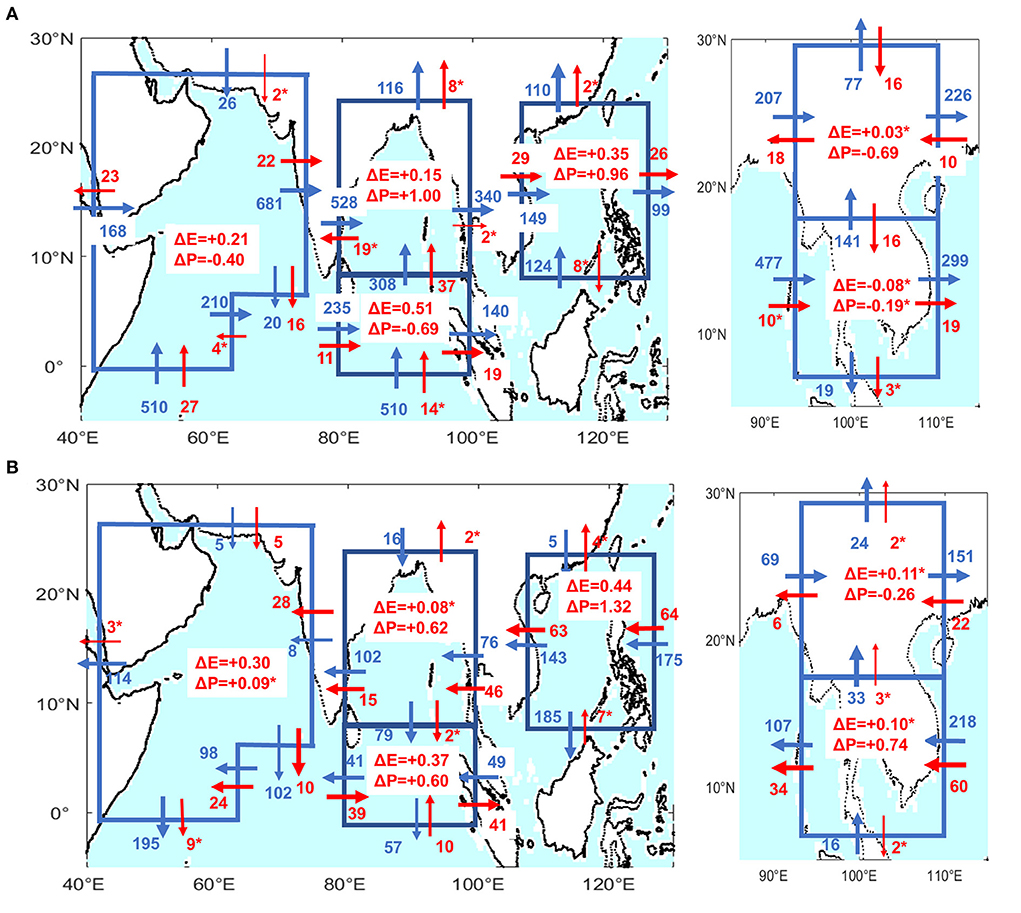
Figure 11. Linear trends (1979–2018) in area-averaged evaporation ΔE (mm/day/40 years) and precipitation ΔP (mm/day/40 years) and atmospheric water vapor transport integrated along the zonal/meridional boundaries (in 106 kg/s/40 years) of four oceanic regions (Arabian Sea, Northeast equatorial region (0–8°N), Bay of Bengal, and South China Sea) and for the south (7–18°N) and north (18–30°N) parts of the MSEA in (A) summer (JJA); and (B) winter (DJF), based on the ERA5 re-analysis. Blue and red vectors and accompanied values denote climatological mean and total change in transport direction and magnitude, respectively, over 1979–2018. Symbol ‘*’ denotes trends that are not statistically significant at the 95% confidence interval.
In a steady state the seasonal mean local precipitation minus evaporation (P–E) field averaged over a specific region is roughly balanced by the vertically-integrated moisture transport convergence over this region (Brubaker et al., 1993; Wang et al., 2017). The moisture budget is expressed as follows (Wang et al., 2017):
where P is the precipitation, E is the evaporation, q is the specific humidity, and is the horizontal wind vector. pt and ps are pressure at the surface and top level of the atmospheric column, respectively, and the overbars denote seasonal means. In a transitioning state, long-term changes in P–E are expected to follow changes in the moisture transport convergence over this region.
During summer, results show a strong increase in moisture transport roughly all along the main northeastward moisture pathway from the western equatorial region to the Arabian Sea (Figure 9A). Extra moisture is imported over the Arabian Sea from the western equatorial region with the northward moisture transport at the southern (equatorial) boundary of the Arabian Sea increasing by ~5% during summer (Figure 11A). As expected, the spatial change pattern of moisture transport convergence (Figure 9B) strongly resembles that of P–E (Figure 9D). Moisture divergence is significantly increasing in large parts of the Arabian Sea indicating an increase in moisture export of this region with summer net evaporation over the Arabian Sea increasing by ~27% (Figure 11A). Moisture export is increasing along the eastern (continental) boundary of the Arabian Sea except from the northern part where moisture export decreases resulting in a relatively small increase in the total eastward transport of ~3% across the eastern continental boundary toward the India Peninsula. A strong increase in moisture export is obtained in the southeastern oceanic boundary of the Arabian Sea where the (southward) moisture transport increases by ~80%. Moisture transport continues to increase as moisture enriched air masses from the Arabian Sea circulate around the Indian Peninsula and over the northeast equatorial zone. In the latter region a pronounced decrease in moisture convergence occurs. Increasing moisture export from this region following its eastward moisture pathway feeds a large moisture import to the Bay of Bengal with moisture (northward) transport increasing by ~12% in its southern boundary over 1979–2018. On the other hand, there is a small (and not statistically significant) decrease in the eastward moisture transport from the Indian Peninsula to the Bay of Bengal. Moisture (northeastward) transport toward the MSEA increases in the southern part and decreases in the northern part of the Bay of Bengal. A large part of the increased moisture input converges within the southern part of the Bay of Bengal leading to a pronounced increase in precipitation there (see Figure 9). However, although moisture transport increases toward the south part of the MSEA (roughly south of 18°N), moisture convergence decreases in most parts of the peninsula. Increases in summer precipitation are obtained only along the western part of the peninsula but are relatively small and mostly not statistically significant whereas there are decreases in precipitation over the eastern part of the peninsula resulting in a low negative (and not significant) trend averaged over south MSEA (see Figure 11A). Results show a significant negative trend in area-averaged precipitation over north MSEA (18–30°N) of ~13% associated with strongly decreasing continental moisture transport and moisture convergence across the region (Figures 9A,B).
During winter, ERA5 data reveal a pronounced precipitation trend in and around MSEA (Figure 10D) in accordance with the observationally-based datasets considered here (GPCP over the ocean and CPC over land). This widespread precipitation trend is clearly associated with strongly increasing westward transport of moisture originated from the northwestern tropical Pacific Ocean and the South China Sea (see Figure 10A). Winter westward moisture transport integrated over the eastern and western boundaries of the South China Sea is largely increased i.e., by ~35 and 45% (with respect to the climatological winter mean), respectively, over 1979–2018 (Figure 11B). Moreover, the core of maximum moisture transport area, typically obtained in the southern part of the peninsula, is shifted northward covering a larger part of the MSEA resulting in exceptionally high rainfall, especially over the Vietnamese coast. In the south part of MSEA (5–18°N) there is pronounced rainfall increase during winter of ~80% over 1979–2018 (Figure 11B). However, the extra moisture is mainly converged close to the coastline with much lower rainfall increases over the peninsula interior. In contrast there is a small but statistically significant decrease in rainfall of ~15% over the northern part of the peninsula associated with decreasing moisture (eastward) transport over the continent and the northern part of the Bay of Bengal. CPC data show a similar trend pattern during winter over the same period (1979–2018) with a pronounced rainfall increase (~80%) in the south part of MSEA, but very low and not statistically significant trends in the northern part of the peninsula. This large increase in winter moisture transport across the eastern coasts of MSEA may also explain the large decrease of the dry season duration across Vietnam, as evidenced by the large reduction in the CDD index there (see Figure 5C).
Our analysis demonstrates that re-analysis products are quite consistent with observationally-based products in estimating water cycle changes over the ocean but there is much less coherency regarding changes over land. Long-term trends in oceanic evaporation from re-analyses and objectively-analyzed datasets show a good level of agreement with all products indicating large increases in evaporation over the tropical Indian Ocean over the last 40 years. Similarly, some coherency in the precipitation spatial change patterns over the ocean is evident between ERA5 and the satellite-derived GPCP dataset, although ERA5 generally underestimates the intensity of precipitation trends. There is also a relatively good agreement between ERA5 and CPC precipitation spatial change patterns over MSEA during winter. ERA5 reveals a pronounced increase in the transport of moisture from South China Sea and the western tropical Pacific during winter which drives large widespread increases in precipitation over MSEA, a pattern that it is also evident in the rain-gauge data (CPC). On the other hand, there are large discrepancies in precipitation changes over land during the summer period. ERA5 shows relatively low, and in some regions even opposing trends in precipitation compared to observationally-based datasets (CPC and GPCP). Although eastward oceanic moisture transport toward the MSEA increases during summer, moisture convergence decreases over a large part of the MSEA in ERA5. The largest part of extra oceanic moisture produced over the last 40 years ends up as extra precipitation over the adjacent oceanic regions, in the Bay of Bengal in particular, with vary small changes in moisture transport and continental precipitation over the MSEA. Given that evapotranspiration trends are very small this pattern is inconsistent with the observational datasets which indicate instead widespread increases in precipitation across Vietnam and NW MSEA.
The Monsoon is the major climatic driver controlling precipitation over MSEA, especially during the summer period. The South Asian Summer Monsoon is mainly induced by the land-sea thermal contrast which drives large ocean moisture transport to MSEA (Wu et al., 2012). However, typical indices used to investigate monsoon activity in Southeast Asia, such as the Western North Pacific-East Asian monsoon Index (WNPEA) and the Indian Monsoon Index (IMI), show low correlations to MSEA precipitation (Tsai et al., 2015). Here we use the Summer Asian Monsoon Outgoing Longwave Radiation (OLR) index (SAMOI-A; http://ds.data.jma.go.jp/tcc/tcc/products/clisys/emi.html) to investigate changes in the Monsoon intensity over the study area. SAMOI-A consists of reversed-sign area-averaged OLR anomalies for the area from the Bay of Bengal to the east of the Philippines (averaged over May-October and normalized by the standard deviation). OLR is often used as a proxy for convection in tropical regions with lower values of OLR indicating more enhanced convective activity under cloudy conditions. Positive and negative SAMOI-A values indicate enhanced and suppressed summer monsoon activity, respectively. The spatial pattern of SAMOI-A is roughly centered over the MSEA and Indonesian Seas, enabling us to better capture changes in monsoon activity in this region over summer and early autumn. The correlation pattern between SAMOI-A and summer precipitation in Southeast Asia (Figure 12A) show positive correlations across MSEA (R ~ 0.4–0.6) with maximum correlations along the Vietnam coast (R ~ 0.6–0.7). In addition, the SAMOI-N index is used to investigate meridional shifts of the active convection area associated with the monsoon. The correlation pattern between SAMOI-N and precipitation shows a dipole with increasing precipitation over North MSEA and decreasing precipitation over the Indonesian Seas with maximum positive correlations (R ~ 0.5–0.6) obtained in the northwestern part of the peninsula (Figure 12C). SAMOI-A significantly increases during 1979–2018 (Figure 12B) indicating increasing summer monsoon intensity over MSEA during that period that is consistent with the large increase in summer precipitation over MSEA evidenced in the rain-gauge data. Moreover, the SAMOI-N index also increases over the same period (Figure 12D) revealing a northward shift of the monsoon center toward northern MSEA, further enhancing Monsoon intensity there.
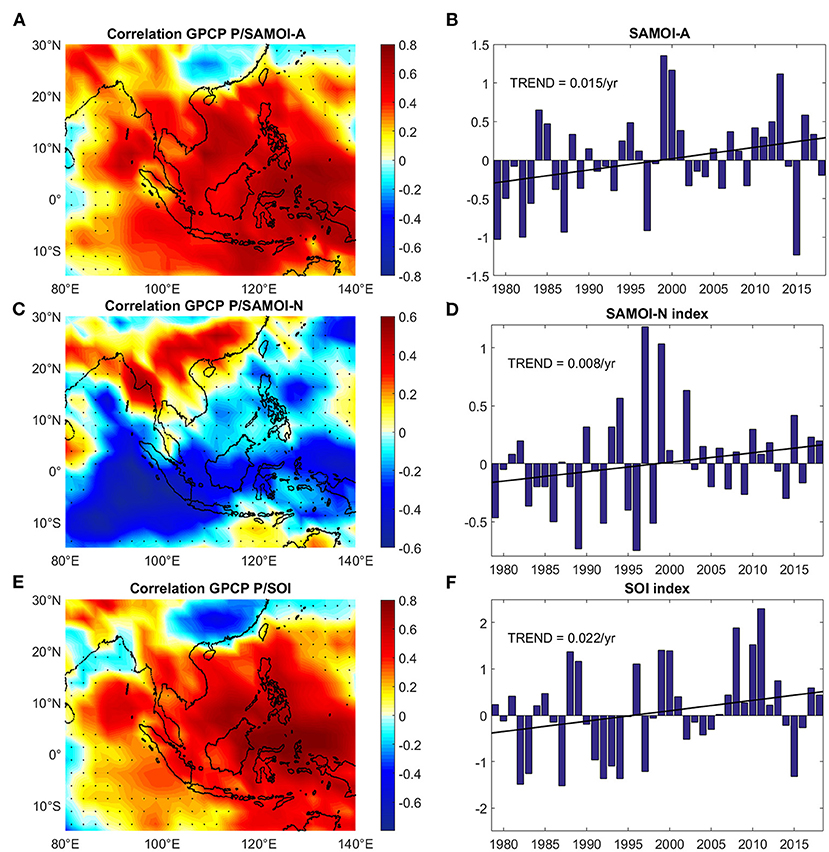
Figure 12. Correlation spatial patterns between annual mean precipitation (GPCP) and SAMOI-A, SAMOI-N, and SOI index detrended timeseries (A,C,E). Regions where the correlation is not significant at the 95% confidence interval are stippled. SAMOI-A, SAMOI-N, and SOI index annual timeseries over 1979–2018 (B,D,F). Linear trends (significant at the 90% confidence interval) are also depicted.
Precipitation over MSEA is also associated with the major modes of natural climate variability of the tropical Pacific and Indian Oceans. One of the key challenging issues regarding the changing hydrological cycle is how to distinguish between natural low-frequency modes of large-scale variability and long-term climatic trends, and hence to properly attribute changes in the hydrological cycle to either natural variability or anthropogenic forcing. In particular, the signal of the El Nino Southern Oscillation (ENSO) is imprinted in the changing spatial patterns of long-term surface freshwater flux and salinity in the tropical Pacific and Indian oceans and may skew possible anthropogenic climatic trends (Skliris et al., 2014). Rainfall over the Southeast Asian seas has strong positive correlations to a la Nina-like SST anomaly pattern (Caesar et al., 2011; Skliris et al., 2014). The Southern Oscillation Index (SOI; https://www.ncdc.noaa.gov/teleconnections/enso/indicators/soi), which measures the intensity of ENSO with strongly positive (negative) values indicating a La Nina (El Nino) event, is significantly correlated with annual precipitation over the Western tropical Pacific (R ~ 0.5–0.8) as well as over MSEA (R ~ 0.4–0.5) (Figure 12E). SOI significantly increases over the last 40 years (Figure 12F) which may partially explain the strong large-scale precipitation increase around MSEA, in the western tropical Pacific and northeastern tropical Indian oceans (see Figure 3). The observed ocean precipitation increase around MSEA is concomitant and consistent with broad-scale decreasing ocean surface salinity in these regions over the same period (Skliris et al., 2014). The SOI positive trend over 1979–2018 is essentially driven by the difference between the 2000s and early 2010s characterized by predominantly La Nina states (positive SOI) and the 1980s and 1990s with predominantly El Nino states (negative SOI). However, there is a large uncertainty of the impact of ENSO on precipitation around the over the MSEA as the SOI inter-annual variability is strong, affecting the significance of the multi-decadal trend. In particular, the very strong El Nino event in 2015 abruptly interrupts the recent La Nina dominated period. Timeseries of SAMOI-A index representing the intensity of the East Asian Monsoonal precipitation (see Figure 12B) also shows a positive trend over 1979–2018 (although again statistically significant only at the 90% confidence interval) with a strongly increasing monsoonal precipitation around the late 1990s and early 2010s and with major positive peaks coinciding with SOI positive (La Nina) peaks. In contrast there are pronounced negative SAMOI-A peaks during the strong El Nino events of 1997 and 2015.
The two dominant modes of tropical Indian Ocean variability, namely the Indian Ocean Basin Mode (IOBM) and the Indian Ocean Dipole (IOD), also control climate conditions and local continental precipitation in many regions surrounding the tropical Indian Ocean. The IOBM features inter-annual basin-wide warming/cooling in the Tropical Indian Ocean and is closely associated with ENSO (Klein et al., 1999). The IOBM index is defined as the SST anomaly averaged over the tropical Indian Ocean (40°E−100°E, 20°S−20°N). Inter-decadal variations of IOBM show a strong positive increase since the 1950s (Huang et al., 2019). A positive IOBM index, typically peaking in spring, is associated with increasing (decreasing) summer precipitation over North (South) MSEA although correlations are relatively low (Zhang et al., 2019). Low and statistically insignificant correlations were found here between seasonal patterns of precipitation and IOBM in most of the MSEA. On the other hand, the correlation pattern between detrended IOBM and evaporation (Figure 13A) shows positive statistically significant correlations across the tropical North Indian Ocean (R ~ 0.4–0.5) including the main ocean moisture source regions for MSEA precipitation. Increasing (positive) IOBM over recent decades (Figure 13B) is associated with anomalous surface warming in the tropical Indian ocean. In addition, the center of action in the IOBM shifted from the Southeast Indian Ocean toward the Arabian Sea after the late 1970s (Sun et al., 2019). Roxy et al. (2014) identified fastest long-term warming in the Western Indian Ocean (WIO, 50–65°E, 5°S−10°N) during Northern Hemisphere summer months, compared with slower warming across the rest of Indian Ocean (70–100°E, 20°S−20°N). Higher positive SST anomalies are observed in the oceanic moisture sources including the Arabian Sea and Bay of Bengal (Sun et al., 2019), which may have driven the large increases in evaporation evidenced in this study, suggesting that there was potentially an increased supply of ocean moisture for MSEA precipitation over that period.
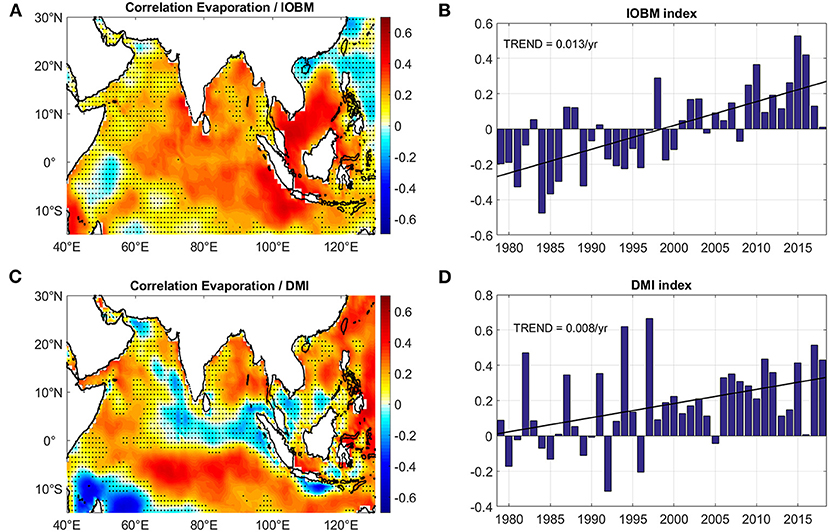
Figure 13. Correlation spatial patterns between annual mean evaporation (OAFlux) and (A) IOBM, (B) DMI. Regions where the correlation is not significant at the 95 % confidence interval are stippled. Annual timeseries over 1979–2018 of (C) IOBM and (D) DMI. The linear trends (significant at the 90% confidence interval) are also depicted.
The Indian Ocean Dipole (IOD) mode is characterized by a strong east-west sea surface temperature gradient with cold anomalies off Sumatra and warm anomalies in the western Indian Ocean, accompanying wind and precipitation anomalies (Saji et al., 1999). The impact of IOD on MSEA precipitation is investigated here using the Dipole Mode Index (DMI) measuring the SST anomaly difference between the western (10°S−10°N, 50°E−70°E) and the eastern (10°S−0°S, 90°E−110°E) parts of the tropical Indian Ocean. Positive DMI is associated with broad-scale increasing (decreasing) surface temperature and precipitation over the western (eastern) part of the tropical Indian Ocean. Positive DMI peaking in autumn is linked with decreasing precipitation over most of MSEA in the following summer (Zhang et al., 2019). On the other hand, Gao et al. (2019) found that extreme droughts over spring are strongly reduced throughout Vietnam and the northwestern part of the peninsula during negative IOD events, and this pattern is further accentuated when these events are also concomitant with La Nina events. There is a clear shift to predominantly positive IOD states (positive DMI) over recent decades. However as for the IOBM, the DMI correlations to MSEA precipitation obtained here (based on CPC data) are quite low (R <0.3) and not statistically significant over most of the peninsula in accordance with the study of Tsai et al. (2015). We only found statistically significant negative correlations (R ~−0.3–0.4) between DMI and precipitation over southern parts of MSEA (sub-regions 1, 3, and 5) during autumn (not shown). On the other hand, similarly to IOBM the correlation pattern between DMI and evaporation (Figure 13C) shows small but statistically significant positive correlations (R ~ 0.3–0.4) along the main pathway of moisture transport toward the MSEA. Largely positive DMI over 1979–2018 (Figure 13D) is associated with abnormally high SSTs over the northwestern Indian Ocean and Arabian Sea. These higher SSTs may in turn have partially driven the observed evaporation increases in the oceanic moisture sources for MSEA precipitation over that period.
Evaporation anomaly timeseries over oceanic moisture sources show a multi-decadal variation signal with a phase transition in the late 1980's (see Supplementary Figure S3). This pattern roughly coincides with a shift in natural climate variability modes of the tropical Indian Ocean with both DMI and IOBM transitioning to a predominantly positive phase driving ocean surface warming and subsequently evaporation increases along the main ocean moisture pathways to the MSEA.
In this study we investigated large-scale coupled atmosphere/ocean processes that drive variable and extreme rainfall in the MSEA. Rain-gauge data indicate large increases exceeding 50% in precipitation over the eastern coast (Vietnam) and northwest part of the MSEA over the last 40 years. ENSO multi-decadal variability with predominant La Niña states over recent decades may partially explain the recent precipitation trend toward a more intense regional hydrological cycle around the MSEA. Increasing precipitation in MSEA is also associated with increased monsoon intensity in southeast Asia and a northward shift of the monsoon activity center toward MSEA over 1979–2018. Over the same period strong warming-driven evaporation increases were observed in most parts of the tropical Indian Ocean including over the major oceanic moisture source regions typically feeding precipitation around and over the MSEA. Multidecadal shifts in the natural climatic variability modes of the tropical Indian Ocean such as IOBM and IOD seem to at least partially drive the evaporation trends in the oceanic moisture sources during recent decades. It is interesting to note that mean precipitation trends in CMIP6 climate model projections over the 21st century under the higher emissions scenario (Chen et al., 2020) are much lower (i.e., by ~1 order of magnitude) than the recent historical 40-year trends over large parts of MSEA, as inferred from rain-gauge data in this study. In general climate models do not properly capture the intensity and time-evolution of multi-decadal natural variability signals, thereby misrepresenting their impact on regional hydrological cycles (e.g., Skliris et al., 2020).
Moisture budget analysis using ERA5 re-analysis data over 1979–2018 showed an acceleration of the water cycle over the ocean with increasing oceanic moisture transport over both winter and summer moisture pathways toward the MSEA. ERA5 reveals pronounced increases in winter precipitation over the MSEA, in accordance with rain-gauge data, associated with strongly increasing transport of moisture originated from the South China Sea and the western tropical Pacific. In contrast, there is a large discrepancy for summer trends when ERA5 is not able to reproduce the observed strong increases in precipitation in large parts of the MSEA over 1979–2018. Oceanic moisture transport increase results in pronounced moisture convergence within the Bay of Bengal with only a very small portion of this extra moisture converging over the MSEA.
Our results demonstrate that it is still difficult to assess using re-analysis products the extent to which evaporation in the ocean moisture source regions has contributed to increased precipitation over large parts of the MSEA during recent decades. This is mainly due to the large uncertainties in the re-analyses producing long-term changes of moisture transport and convergence over land, that actually control local continental precipitation. Although the present re-analyses are appropriate tools for establishing climatological mean wind and moisture flux patterns, they are still unreliable to assess long-term trends in water cycling over land. Our analysis confirms results from previous studies showing a large spread amongst re-analyses in estimating long-term precipitation trends whilst also being inconsistent with observational estimates (Schanze et al., 2010; Fasullo, 2012; Skliris et al., 2014). However, present model reanalyses and hybrid model/observationally-based datasets show better consistency amongst various products concerning ocean evaporation trends compared with rainfall trends (Skliris et al., 2014). Therefore, evaporation in the oceanic moisture sources could be used as a proxy for variability and long-term trends in precipitation over MSEA.
Our results are in accordance with regional climate model simulations (Ngo-Duc et al., 2016; Tangang et al., 2018; Ge et al., 2019) showing a very high sensitivity of precipitation extremes to warming over the Southeast Asia. Our results demonstrate that together with total wet season precipitation the number of days of extreme rainfall and other extreme precipitation indices are also increasing abruptly over the last decades in parts of the MSEA. This is especially the case for flood prone regions such as the coastal areas of Vietnam and Myanmar, underlining the increased risk of extreme flooding events in the near future, with potentially severe socio-economic impacts for these regions.
The original contributions presented in the study are included in the article/Supplementary material, further inquiries can be directed to the corresponding author/s.
NS developed the manuscript and undertook the formal analysis. RM, IH, MW, JH, SD, NQ, and NH contributed to the conceptualization and methodological approach of the research. All authors contributed to writing-review and editing.
This work was funded by the UK's National Environment Research Council (NERC) and the National Foundation of Science and Technology Development (NAFOSTED-RCUK fund), Ministry of Science and Technology of Vietnam, through the grant CompFlood: Compound Flooding in coastal Vietnam (Grant No. NE/S003150/1). An earlier version of this work appeared online as a preprint in Research Square (Skliris et al., 2021).
The authors declare that the research was conducted in the absence of any commercial or financial relationships that could be construed as a potential conflict of interest.
All claims expressed in this article are solely those of the authors and do not necessarily represent those of their affiliated organizations, or those of the publisher, the editors and the reviewers. Any product that may be evaluated in this article, or claim that may be made by its manufacturer, is not guaranteed or endorsed by the publisher.
The Supplementary Material for this article can be found online at: https://www.frontiersin.org/articles/10.3389/fclim.2022.926568/full#supplementary-material
Adler, R. F., Huffman, G. J., Chang, A., Ferraro, R., Xie, P., Janowiak, J., et al. (2003). The version 2 global precipitation climatology project (GPCP) monthly precipitation analysis (1979-present). J. Hydrometeor. 4, 1147–1167. doi: 10.1175/1525-7541(2003)004<1147:TVGPCP>2.0.CO;2
Brubaker, K. L., Entekhabi, D., and Eagleson, P. S. (1993). Estimation of continental precipitation recycling. J. Clim. 6, 1077–1089.
Caesar, J., Alexander, L. V., Trewin, B., Tsering, K., Sorany, L., Vuniyayawa, V., et al. (2011). Changes in temperature and precipitation extremes over the Indo-Pacific region from 1971 to 2005. Int. J. Climatol. 31, 791–801. doi: 10.1002/joc.2118
Chen, Z., Zhou, T., Zhang, L., Chen, X., Zhang, W., and Jiang, J. (2020). Global land monsoon precipitation changes in CMIP6 projections. Geophys. Res. Lett. 47, e2019GL086902. doi: 10.1029/2019GL086902
Chou, C., Chiang, J. C. H., Lan, C.-W., Chung, C.-H., Liao, Y.-C., and Lee, C.-J. (2013). Increase in the range between wet and dry season precipitation. Nat. Geosci. 6, 263–267. doi: 10.1038/ngeo1744
Dey, D., and Döös, K. (2021). Tracing the origin of the South Asian Summer Monsoon precipitation and its variability using a novel Lagrangian framework. J. Clim. 34, 1–40. doi: 10.1175/JCLI-D-20-0967.1
Dun, O. (2011). Environmentally induced migration in the context of social vulnerability. Int. Migration 49, 200–223. doi: 10.1111/j.1468-2435.2010.00646.x
Durack, P. J., Wijffels, S. E., and Matear, R. J. (2012). Ocean salinities reveal strong global water cycle intensification during 1950 to 2000. Science 336, 455–458. doi: 10.1126/science.1212222
Fasullo, J. (2012). A mechanism for land–ocean contrasts in global monsoon trends in a warming climate. Clim. Dyn. 39, 1137–1147. doi: 10.1007/s00382-011-1270-3
Gao, Q.-G., Sombutmounvong, V., Xionag, L., Lee, J.-H., and Kim, J.-S. (2019). Analysis of drought-sensitive areas and evolution patterns through statistical simulations of the Indian Ocean dipole mode. Water 11, 1302. doi: 10.3390/w11061302
Ge, F., Zhu, S., Peng, T., Zhao, Y., Sielmann, F., Fraedrich, K., et al. (2019). Risks of precipitation extremes over Southeast Asia: does 1.5°C or 2°C global warming make a difference? Environ. Res. Lett. 14, 044015. doi: 10.1088/1748-9326/aaff7e
Good, S. A., Martin, M. J., and Rayner, N. A. (2013). Quality controlled ocean temperature and salinity profiles and monthly objective analyses with uncertainty estimates. J. Geophys. Res. Oceans 118, 6704–6716. doi: 10.1002/2013JC009067
Hegerl, G. C., Black, E., Allan, R. P., Ingram, W. J., Polson, D., Trenberth, K. E., et al. (2015). Challenges in quantifying changes in the global water cycle. Bull. Am. Meteorol. Soc. 96, 1097–1115. doi: 10.1175/BAMS-D-13-00212.1
Held, I. M., and Soden, B. J. (2006). Robust responses of the hydrological cycle to global warming. J. Clim. 19, 5686–5699. doi: 10.1175/JCLI3990.1
Hersbach, H., Bell, B., Berrisford, P., Hirahara, S., Horányi, A., Muñoz-Sabater, J., et al. (2020). The global ERA5 reanalysis. Q. J. R. Meteorol. Soc. 146, 1999–2049. doi: 10.1002/qj.3803
Huang, Y., Wu, B., Li, T., Liu, B., and Zhou, T. (2019). Interdecadal Indian Ocean basin mode driven by interdecadal pacific oscillation: a season-dependent growth mechanism. J. Clim. 32, 2057–2073. doi: 10.1175/JCLI-D-18-0452.1
Kistler, R., Kalnay, E., Collins, W., Saha, S., White, G., Woollen, J., et al (2001). The NCEP-NCAR 50-year reanalysis: monthly means CD-ROM and documentation. Bull. Am. Meteorol. Soc. 82, 247–267. doi: 10.1175/1520-0477(2001)082<0247:TNNYRM>2.3.CO;2
Klein, S. A., Soden, B. J., and Lau, N.-C. (1999). Remote sea surface variations during ENSO: evidence for a tropical atmospheric bridge. J. Clim. 12, 917–932.
Liu, C., and Allan, R. P. (2012). Multi-satellite observed responses of precipitation and its extremes to interannual climate variability. J. Geophys. Res. 117, D03101. doi: 10.1029/2011JD016568
Liu, C., Allan, R. P., and Huffman, G. J. (2012). Co-variation of temperature and precipitation in CMIP5 models and satellite observations. Geophys. Res. Lett. 39, L13803. doi: 10.1029/2012GL052093
Ngo-Duc, T., Tangang, F. T., Santisirisomboon, J., Cruz, F., Trinh-Tuan, L., Nguyen-Xuan, T., et al. (2016). Performance evaluation of RegCM4 in simulating extreme rainfall and temperature indices over the CORDEX-Southeast Asia region. Int. J. Climatol. 37, 1634–1647. doi: 10.1002/joc.4803
Nguyen, D. Q., Renwick, J., and McGregor, J. (2014). Variations of surface temperature and rainfall in Vietnam from 1971 to 2010. Int. J. Climatol. 34, 249–264. doi: 10.1002/joc.3684
Nicholls, R. J., Wong, P. P., Burkett, V. R., Codignotto, J. O., Hay, J. E., McLean, R. F., et al. (2007). “Coastal systems and low-lying areas,” in Climate Change 2007: Impacts, Adaptation and Vulnerability. Contribution of Working Group II to the Fourth Assessment Report of the Intergovernmental Panel on Climate Change, eds M. L. Parry, O. F. Canziani, J. P. Palutikof, P. J. van der Linden, and C. E. Hanson (Cambridge, UK and New York, NY: Cambridge University Press), 315–356.
O'Gorman, P. A. (2015). Precipitation extremes under climate change. Curr. Clim. Change Rep. 1, 49–59. doi: 10.1007/s40641-015-0009-3
Pan, S., Pan, N., Tian, H., Friedlingstein, P., Sitch, S., Shi, H., et al. (2020). Evaluation of global terrestrial evapotranspiration using state-of-the-art approaches in remote sensing, machine learning and land surface modeling. Hydrol. Earth Syst. Sci. 24, 1485–1509. doi: 10.5194/hess-24-1485-2020
Roxy, M. K., Ritika, K., Terray, P., and Masson, S. (2014). The curious case of Indian ocean warming. J. Clim. 27, 8501–8509. doi: 10.1175/JCLI-D-14-00471.1
Saji, N. H., Goswami, B. N., Vinayachandran, P. N., and Yamagata, T. (1999). A dipole mode in the tropical Indian Ocean. Nature 401, 360–363.
Schanze, J. J., Schmitt, R. W., and Yu, L. L. (2010). The global oceanic freshwater cycle: a state-of-the-art quantification. J. Mar. Res. 68, 569–595. doi: 10.1357/002224010794657164
Schurer, A. P., Ballinger, A. P., Friedman, A. R., and Hegerl, G. C. (2020). Human influence strengthens the contrast between tropical wet and dry regions. Environ. Res. Lett. 15, 104026. doi: 10.1088/1748-9326/ab83ab
Sillmann, J., Kharin, V. V., Zhang, X., Zwiers, F. W., and Bronaugh, D. (2013). Climate extremes indices in the CMIP5 multimodel ensemble: part 1. Model evaluation in the present climate. J. Geophys. Res. Atmos. 118, 1716–1733. doi: 10.1002/jgrd.50203
Skliris, N., Marsh, R., Haigh, I. D., Wood, M., Hirschi, J., Darby, S., et al. (2021). Drivers of past and predicted changes of rainfall in and around Mainland Southeast Asia. Res. Square. 1–39. doi: 10.21203/rs.3.rs-194416/v2
Skliris, N., Marsh, R., Josey, S. A., Good, S. A., Liu, C., and Allan, R. P. (2014). Salinity changes in the World Ocean since 1950 in relation to changing surface freshwater fluxes. Clim. Dyn. 43, 709–736. doi: 10.1007/s00382-014-2131-7
Skliris, N., Marsh, R., Mecking, J., and Zika, J. D. (2020). Changing water cycle and freshwater transports in the Atlantic Ocean in observations and CMIP5 models. Clim. Dyn. 54, 4971–4987. doi: 10.1007/s00382-020-05261-y
Skliris, N., Zika, J. D., Nurser, G., Josey, S. A., and Marsh, R. (2016). Global water cycle amplifying at less than the Clausius-Clapeyron rate. Sci. Rep. 6, 38752. doi: 10.1038/srep38752
Su, T., and Feng, G. (2015). Spatial-temporal variation characteristics of global evaporation revealed by eight reanalyses. Sci. China Earth Sci. 58, 255–269. doi: 10.1007/s11430-014-4947-8
Sun, B., Li, H., and Zhou, B. (2019). Interdecadal variation of Indian Ocean basin mode and the impact on Asian summer climate. Geophys. Res. Lett. 46, 12388–12389. doi: 10.1029/2019GL085019
Sun, B., and Wang, H. (2015). Analysis of the major atmospheric moisture sources affecting three sub-regions of East China. Int. J. Climatol. 35, 2243–2257. doi: 10.1002/joc.4145
Tangang, F., Supari, S., Chung, J. X., Cruz, F., Salimun, E., Ngai, S. T., et al. (2018). Future changes in annual precipitation extremes over Southeast Asia under global warming of 2°C. APN Sci. Bull. 8, 436. doi: 10.30852/sb.2018.436
Tsai, C., Behera, S. K., and Waseda, T. (2015). MSEA monsoon indices. Sci. Rep. 5, 8107. doi: 10.1038/srep08107
van der Ent, R. J., and Savenije, H. H. G. (2013). Oceanic sources of continental precipitation and the correlation with sea surface temperature. Water Resour. Res. 49, 3993–4004. doi: 10.1002/wrcr.20296
Wang, Z., and Chang, C.-P. (2012). A numerical study of the interaction between the largescale monsoon circulation and orographic precipitation over South and Southeast Asia. J. Clim. 25, 2440–2455. doi: 10.1175/JCLI-D-11-00136.1
Wang, Z., Duan, A., Yang, S., and Ullah, K. (2017). Atmospheric moisture budget and its regulation on the variability of summer precipitation over the Tibetan Plateau. J. Geophys. Res. Atmos. 122, 614–630. doi: 10.1002/2016JD025515
Wati, T., Kusumaningtyas, S. D. A., and Aldrian, E. (2019). Study of season onset based on water requirement assessment. IOP Conf. Ser. Earth Environ. Sci. 299, 012042. doi: 10.1088/1755-1315/299/1/012042
Wu, G., Liu, Y., He, B., Bao, Q., Duan, A., and Jin, F.-F. (2012). Thermal controls on the Asian summer monsoon. Sci. Rep. 2, 404. doi: 10.1038/srep00404
Yanai, M., and Wu, G.-X. (2006). “Effects of the Tibetan plateau,” in Chapter 13, The Asian Monsoon, ed B. Wang, and et al., (Chichester: Springer). doi: 10.1007/3-540-37722-0_13
Yatagai, A., Kamiguchi, K., Arakawa, O., Hamada, A., Yasutomi, N., and Kitoh, A. (2012). APHRODITE: constructing a long-term daily gridded precipitation dataset for Asia based on a dense network of rain gauges. Bull. Am. Meteorol. Soc. 93, 1401–1415. doi: 10.1175/BAMS-D-11-00122.1
Yu, L., Jin, X., and Weller, R. A. (2008). “Multidecade global flux datasets from the objectively analyzed air–sea fluxes (OAFlux) project: latent and sensible heat fluxes, ocean evaporation and related surface meteorological variables,” in OAFlux Project Technical Report (OA2008–01) (Falmouth: Woods Hole Oceanographic Institution).
Zhang, Y, Zhou, W., and Leung, M. Y. T. (2019). Phase relationship between summer and winter monsoons over the South China Sea: Indian Ocean and ENSO forcing. Clim. Dyn. 52, 5229–5248. doi: 10.1007/s00382-018-4440-8
Keywords: Mainland Southeast Asia, rainfall, monsoon, evaporation, water cycle, moisture budget
Citation: Skliris N, Marsh R, Haigh ID, Wood M, Hirschi J, Darby S, Quynh NP and Hung NN (2022) Drivers of rainfall trends in and around Mainland Southeast Asia. Front. Clim. 4:926568. doi: 10.3389/fclim.2022.926568
Received: 22 April 2022; Accepted: 15 August 2022;
Published: 08 September 2022.
Edited by:
Ori Adam, Hebrew University of Jerusalem, IsraelReviewed by:
Chujie Gao, Hohai University, ChinaCopyright © 2022 Skliris, Marsh, Haigh, Wood, Hirschi, Darby, Quynh and Hung. This is an open-access article distributed under the terms of the Creative Commons Attribution License (CC BY). The use, distribution or reproduction in other forums is permitted, provided the original author(s) and the copyright owner(s) are credited and that the original publication in this journal is cited, in accordance with accepted academic practice. No use, distribution or reproduction is permitted which does not comply with these terms.
*Correspondence: Nikolaos Skliris, Ti5Ta2xpcmlzQG5vYy5zb3Rvbi5hYy51aw==
Disclaimer: All claims expressed in this article are solely those of the authors and do not necessarily represent those of their affiliated organizations, or those of the publisher, the editors and the reviewers. Any product that may be evaluated in this article or claim that may be made by its manufacturer is not guaranteed or endorsed by the publisher.
Research integrity at Frontiers
Learn more about the work of our research integrity team to safeguard the quality of each article we publish.