- Application Laboratory, Japan Agency for Marine-Earth Science and Technology, Yokohama, Japan
A large ensemble of 120 predictions of the Scale Interaction Experiment-Frontier Research Center for Global Change Version 2 (SINTEX-F2) coupled general circulation model were evaluated for their skill in predicting the surface air temperature (SAT) anomalies over Japan in the winter months December, January, and February. The predictions were initialized using November initial conditions. The members with skill scores based on anomaly correlation coefficient (ACC) were selected and an average of the selected predictions (SEM) was generated. Comparison of SAT anomaly predictions by the average of all the 120 members (ENS) to the SEM predictions shows SEM to outperform the ENS predictions in all the three winter months with higher ACC skill score, higher hit rate and low false alarm rate over the regions covering central Japan in December and January and over the northern region of Hokkaido in February. The improvement in the skill scores in the SEM is found to be due to improved representation of 200 hPa geopotential height anomalies in SEM compared to ENS predictions. The results indicate SEM to be useful for improving skill in predicting SAT anomalies over parts of Japan in the winter months.
Introduction
Variability of surface air temperatures (SAT) in the winter months (December, January, and February) over Japan has wide ranging implications on various sectors such as agriculture, energy and sports, which directly affect the economy of Japan (Doi et al., 2020). Providing reliable predictions of seasonal SAT variations could therefore lead to substantial economic benefits. However, the prediction of SAT over Japan in the winter months is challenging due to the pronounced internal variability of the atmosphere compared to the external forcing from the slowly varying sea surface temperature and soil moisture. Due to this low signal-to-noise ratio, the anomaly correlation coefficient (ACC) skill of most state-of-the-art dynamical models in predicting the winter months variability is very low (Becker et al., 2014; Doi et al., 2016; Takaya et al., 2017, 2018; Johnson et al., 2019).
Often, an ensemble of model predictions is generated by slightly varying atmospheric and oceanic model initial conditions to reduce the uncertainty in the predictions. In recent years the focus has been on increasing the ensemble size of model predictions to increase the skill in regions with low signal-to-noise ratio (Chen and Lin, 2013; Scaife et al., 2014; Doi et al., 2019). Large ensembles are found to increase the skill of predicting extreme events (Doi et al., 2019) which in turn helps improve the predictions at monthly and seasonal time scales. A simple average of all the predictions of a large ensemble (ENS hereafter) is usually calculated and is typically more skillful and reliable than predictions by individual ensemble members (Palmer and Anderson, 1994). However, several studies (Qi et al., 2014; Nishimura and Yamaguchi, 2015; Scher and Messori, 2019; Ratnam et al., 2021) have shown that evaluating the skill and reliability of individual members and generating a mean of those selected members (SEM hereafter) outperforms the ENS predictions. Qi et al. (2014) and Nishimura and Yamaguchi (2015) found such a technique to be useful for improving the track forecasts of tropical cyclones. Scher and Messori (2019) found the SEM technique to be useful in increasing the lead-time of useful predictions for extreme wind storm events. The SEM technique has been successfully used to improve the Scale Interaction Experiment-Frontier Research Center for Global Change Version 2 (SINTEX-F2) (Doi et al., 2016, 2017) SAT predictions over various regions of Japan in the summer months (Ratnam et al., 2021). The SEM technique is analogous to various other methods (e.g., Lee et al., 2011) which use selected members of a large ensemble to improve predictions.
In this study we extend our earlier study (Ratnam et al., 2021) to verify if SEM can be used to improve the prediction of SAT anomalies over Japan in the winter months December, January, and February. We use a large ensemble, consisting of 120 members of SINTEX-F2 (Doi et al., 2019) and select members with robust ACC skill score for the SEM. We apply the SEM method to generate an SAT anomaly distribution for each grid point covering the landmass of Japan. Applying the SEM technique to all grid points allows identifying the regions where SEM can improve SAT predictions.
Materials and Methods
A large ensemble of 120 predictions of the SINTEX-F2 prediction system were first analyzed for their robustness in predicting the SAT in the winter months at each grid point covering the landmass of Japan. The skillful members over each grid point are then averaged to generate SEM at the grid points. In this study, we used the SINTEX-F2 predictions, initialized from 1st to 9th November, for the winter months December, January, and February covering the period 1983/84 to 2019/20 (37 years). The predictions for December, January, and February correspond to 1–3 month lead predictions from early November initial conditions.
The SINTEX-F2 seasonal prediction system is based on an ocean-atmosphere-land-sea ice coupled model (Masson et al., 2012; Sasaki et al., 2013) with the atmospheric component ECHAM5 (Roeckner and Coauthors, 2003) at a horizontal resolution of T106 (~100 km) with 31 vertical levels; the Océan Parallelisé, version 9 (OPA9; Madec, 2008) with a horizontal resolution of 0.5 deg with 31 vertical levels as the oceanic component and the sea-ice model Louvain-la-Neuve, version 2 (LIM2; Fichefet and Morales Maqueda, 1997) as the sea-ice component. The three components are coupled using the Ocean Atmosphere Sea Ice Soil, version 3 (OASIS3; Valcke et al., 2004) coupler. Information is exchanged between the model components every 2 h with no flux correction. The 120 ensemble members were generated in the following way. First, 12 members of the SINTEX-F2 predictions issued on 1st November are generated using two kinds of observational SST datasets and three large negative feedback values for the SST-nudging scheme with the ocean 3DVAR in the initialization phase (Doi et al., 2017) and two different modeling ways for the ocean vertical mixing induced by small vertical-scale structures (Sasaki et al., 2013). The ensemble size is increased from 12 to 108 by using the lagged average forecasting (LAF) method, i.e., by initializing predictions on each day from November 2 through November 9 (Doi et al., 2019). We also added 12 members from a prediction ensemble that only uses SST-nudging to generate the initial conditions, without using 3DVAR (Doi et al., 2016). Details of the methodology and validation of the system can be found in Doi et al. (2016, 2017, 2019).
The most skillful members to be used in the SEM are identified using the ACC between the SINTEX-F2 predicted SAT anomalies and the Global Historical Climatological Network Version 3 and the Climate Anomaly Monitoring System (GHCN-CAMS; Fan and van den Dool, 2008) SAT anomalies. GHCN-CAMS, a product of the Climate Prediction Center/National Centers for Environmental Prediction, USA, is a gridded data at 0.5° × 0.5° horizontal resolution. The anomalies of SINTEX-F2 predictions are calculated by removing the monthly mean climatology of each member from their respective predictions at each lead time. The period 1983/1984 to 2019/2020 is taken as the base period for calculating the monthly climatology for both the SINTEX-F2 and GHCN-CAMS datasets. The SINTEX-F2 predictions are linearly interpolated to the GHCN-CAMS grid to facilitate comparison.
We used bootstrapping (Efron and Tibshirani, 1994) with replacement, by keeping the forecast and observation pairs together (Mason, 2008), to calculate the ACC to identify the skillful members of SINTEX-F2 in predicting SAT at each grid point. Bootstrapping is useful for short time series like ours, which only covers 37 years. The “boot” package (Davison and Hinkley, 1997; Canty and Ripley, 2021) of R, a software environment for statistical computing and graphics (R Core Team, 2021) is used for calculating ACC. A bootstrap sample of 10,000 with replacement is used for the calculation. The bias-corrected and accelerated (BCa) bootstrap interval is used to estimate the confidence intervals at the 95% level. The BCa method corrects for both bias and skewness of the bootstrap parameter estimators. A member is considered robust when both the lower and upper limit of the confidence intervals are positive.
The predictions of SAT anomalies for the winter months (December, January, and February) for each year from 1983/84 to 2019/20 (37 predictions) are generated using SEM after identifying the members with robust skill. The SEM is more skillful if its members are selected based on several training data sets. We used the leave-one-out technique to generate 36 training datasets for testing the stability of the identified members with robust skill. First, the year for which SAT is to be predicted is set aside so that the predictions of that year do not affect the ACC in identifying the skillful members and the data of the remaining 36 years is used for identifying the skillful members. We generated 36 training datasets by removing 1 year at a time from the 36-year dataset. The ACC between the SINTEX-F2 and GHCN-CAMS surface air temperature anomalies is calculated for each training period at each grid point. For a given grid point, the members that are selected in all 36 leave-one-year-out experiments are selected for the SEM at that grid point. The members so identified are used for generating SEM prediction of SAT anomalies over the grid point in the year set aside. For example, say we want to predict the SAT anomalies over all the grid points in December 1983 using SEM. We set aside 1983 and we are left with 36 years 1984 to 2019. Leave-one-year-out is used repeatedly to generate 36 training data sets covering the years 1984 to 2019. Skillful members over the grid points are identified for each leave-one-year-out training dataset. The members which are common over a grid point in all the 36 leave-one-year-out experiments are used to generate the prediction of SAT anomalies for 1983 at that grid point. This process is repeated to cover all the grid points covering the landmass of Japan. Figures 1A–F show the spatial distribution of mean and standard deviation of the number of SINTEX-F2 members contributing to SEM in December, January, and February. Figure 1 indicates that very few of the 120 SINTEX-F2 predictions are robust in predicting the SAT over Japan in the winter months. In December about 9–10 members of SINTEX-F2 contribute to the SEM over the central parts of Japan on average and about 3–6 members over the rest of Japan (Figure 1A). In January and February on average only 2–4 members contribute to the SEM over most parts of Japan (Figures 1C,E). The standard deviation is about 1–2 members in all the months (Figures 1B,D,F). The procedure we followed is designed to ensure that the testing subset used to generate the forecasts for the period 1983/84 to 2019/20 and the training subset are independent. i.e., the testing subset is unseen by the training process. This procedure is ideal for the real time forecasting where the data for the year for which SEM is to be applied is unknown in advance. The SEM technique can be considered as a statistical post-processing of the SINTEX-F2 model forecasts, adding value to the SINTEX-F2 forecasts, and the SEM forecasts are not independent forecasts. Thus, the conventional method of keeping the members constant for the forecasts throughout the years does not strictly apply here.
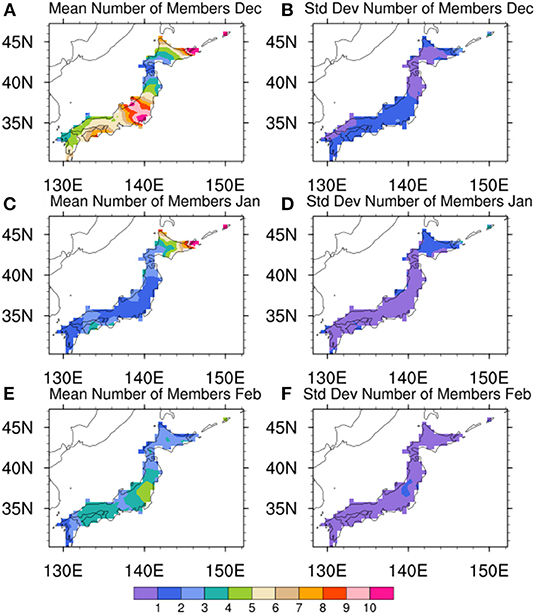
Figure 1. Spatial distribution of mean and standard deviation of number of members contributing to the SEM predictions in December (A,B), January (C,D), and February (E,F), respectively.
Results and Discussion
Predicted ENS and SEM Surface Air Temperature Anomalies
The spatial distribution of anomaly correlation coefficients (ACC) of ENS and SEM with GHCN-CAMS anomalies is shown in Figure 2. It is evident from Figures 2A–F that the SEM predictions have higher ACC skill score compared to ENS over most regions of Japan in all the 3 months. The ACC values of ENS are below 0.4 over Japan in all the 3 months December, January, and February (Figures 2A,C,E) except for a small region in January over Hokkaido (northernmost of Japan's four main islands), which has ACC values between 0.4 and 0.5 (Figure 2C). The ACC values are slightly improved in SEM predictions in December with values ranging between 0.4 and 0.5 over central parts of Japan, parts of western Japan and Hokkaido (Figure 2B). The ACC values are between 0.2 and 0.3 over central parts of Japan in ENS predictions (Figure 2C) in January, which are improved to values between 0.5 and 0.6 in the SEM predictions (Figure 2D). However, the ENS predicted values (Figure 2C) have higher ACC skill score over Hokkaido compared to the SEM (Figure 2D) in January. In February, the SEM predictions (Figure 2F) over Hokkaido show large improvements compared to the ENS predictions (Figure 2E), with ACCs improved from a range of 0.1–0.2 to 0.5–0.6. Over central and western Japan the improvement in ACC values is about 0.2. The contiguous regions over which SEM has higher ACC values compared to ENS are marked in Figure 2 as Reg[1–3]. The differences in ACC values between SEM and ENS in regions Reg2 and Reg3, which have z-score of 1.43 and 1.85 at the lower range of ACC values, are significant at the 90% significance level using a one-sided right-tailed test.
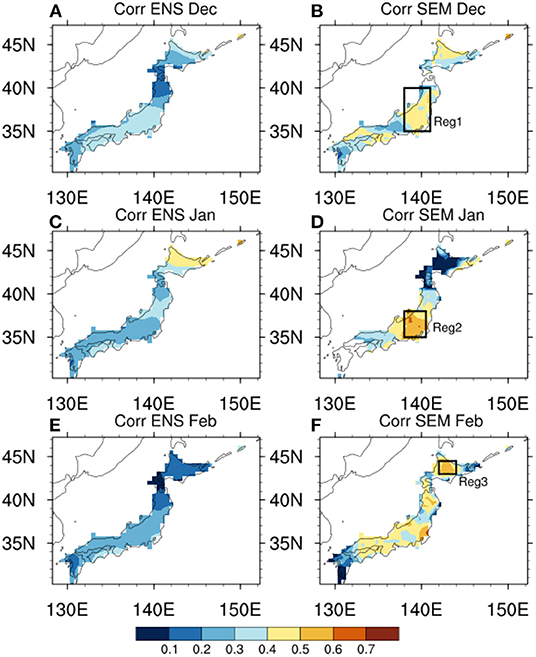
Figure 2. Spatial distribution of ACC between GHCN-CAMS and (A) ENS and (B) SEM in December. Panels (C,D) and (E,F) same as (A,B) but for January and February, respectively. Reg[1-3] correspond to the regions with higher ACC skill score in SEM compared to ENS.
The spatial distribution of RMSE (Figures 3A–F) of SAT anomalies, indicates that both ENS and SEM predictions have errors exceeding 1°C in all the 3 winter months over most parts of Japan. The RMSE values are not very different between ENS and SEM predictions. However, the regions which have improved (deteriorated) ACC values in SEM compared to ENS (Figure 2), have a slight reduction (increase) of about 0.1 to 0.2°C in RMSE (Figures 3A–F).
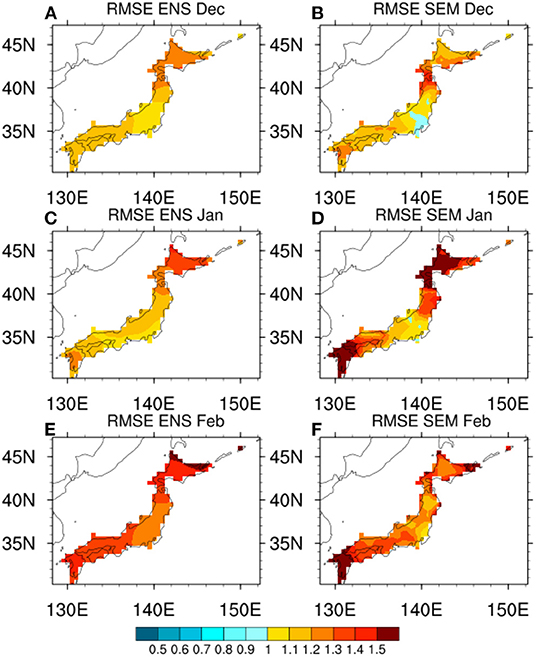
Figure 3. Same as Figure 2 but shows spatial distribution of RMSE (°C) of SAT anomalies.
To further analyze the differences between ENS and SEM predictions of SAT, inter-annual variation of SAT anomalies in the 3 winter months averaged over regions Reg[1-3] are plotted (Figure 4). Figure 4 shows the ensemble spread of the SAT anomalies from all the 120 members (gray lines) of SINTEX-F2 over the period of study along with the SAT anomalies of validation dataset GHCN-CAMS (black line), Persistence (orange line), ERA-5 reanalysis (dark blue line), ENS (violet line) and SEM (red line). As evident from Figure 4 the GHCN-CAMS dataset, which is extensively used in the study as a validation dataset, does not differ much from the ERA-5 reanalysis (Hersbach et al., 2020) dataset, increasing confidence in our results. The spread in SAT anomalies in the SINTEX-F2 predictions is large in all the three winter months and thus the ENS predicted values are small in magnitude compared to SEM in most years (Figure 4). In December, both ENS and SEM predictions fail to predict the extreme negative SAT anomalies in December 2006 over Reg1. The predictions also failed to predict SAT anomalies in the December of 1997 to 1999, 2009 and 2011 to 2014 (Figure 4A) with the correct sign. ENS failed to predict the negative SAT anomalies in the December of 2001 to 2003 which SEM was successful in predicting. The slight improvement in the ACC values of SEM (0.44) compared to ENS (0.29) must have been due to SEM being more successful than ENS in predicting SAT anomalies in some Decembers. To have a better understanding of the success and failures of the ENS and SEM in predicting the correct sign of the SAT anomalies, we plot the Hit rate (HR) and False Alarm Rate (FAR) for positive (≥0.5°C) and negative (≤ -0.5°C) SAT anomalies over all the grid points covering Japan (Figures 5A–I, 6A–I). HR and FAR are defined following Mason and Graham (1999) as HR=hit/(hit+miss) and FAR=(false alarm)/(false alarm + correct rejection), where hit is when an event occurred and was successfully predicted; miss is when an event occurred and but was not predicted; false alarm is when an event was predicted but did not occur; correct rejection is when an event did not occur and was not predicted. A prediction is considered to be skillful if HR is greater than FAR. In December, the HR exceeds 0.4 over Hokkaido, northern parts of Japan and over scattered regions of west Japan in SEM prediction of positive SAT anomalies (Figure 5C) also the FAR has a smaller value (<0.4) over most parts of Japan (Figure 5D) indicating the SEM prediction of positive SAT anomalies to be skillful. The ENS predictions though skillful over most parts of Japan with higher HR (Figure 5A) compared to FAR (Figure 5B) are less skillful compared to SEM. Both ENS and SEM are also skillful in predicting negative temperature anomalies in December. The SEM predictions have HR exceeding 0.4 over most parts of Japan (Figure 6C) in predicting the negative SAT anomalies and are higher than the FAR values (Figure 6D). The ENS predictions have lower values of HR (Figure 6A) and FAR (Figure 6B) compared to SEM (Figures 6C,D). Similar results of HR and FAR are evident even for positive and negative SAT anomalies >1.0°C and < -1.0°C (figure not shown).
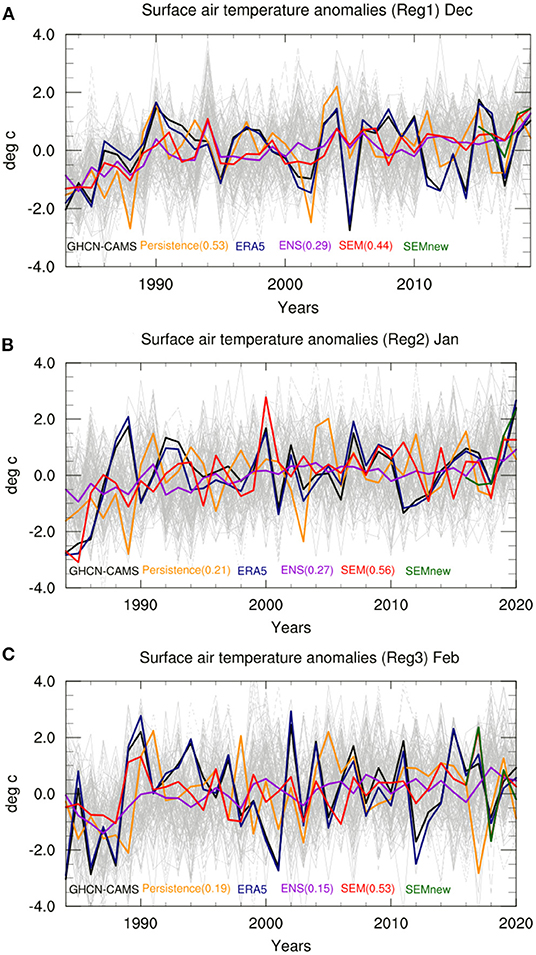
Figure 4. Interannual variation of SAT anomalies over (A) Reg1 in December, (B) Reg2 in January, and (C) Reg3 in February. Regions Reg[1-3] are shown in Figure 1. The SAT anomalies from all the 120 members of SINTEX-F2 members is shown in gray color. SAT anomalies of GHCN-CAMS, Persistence, ERA5, ENS, SEM and SEMnew are shown using black, orange, blue, violet, red, and green line, respectively. The values in the brackets are the correlation coefficients w.r.t GHCN-CAMS anomalies.
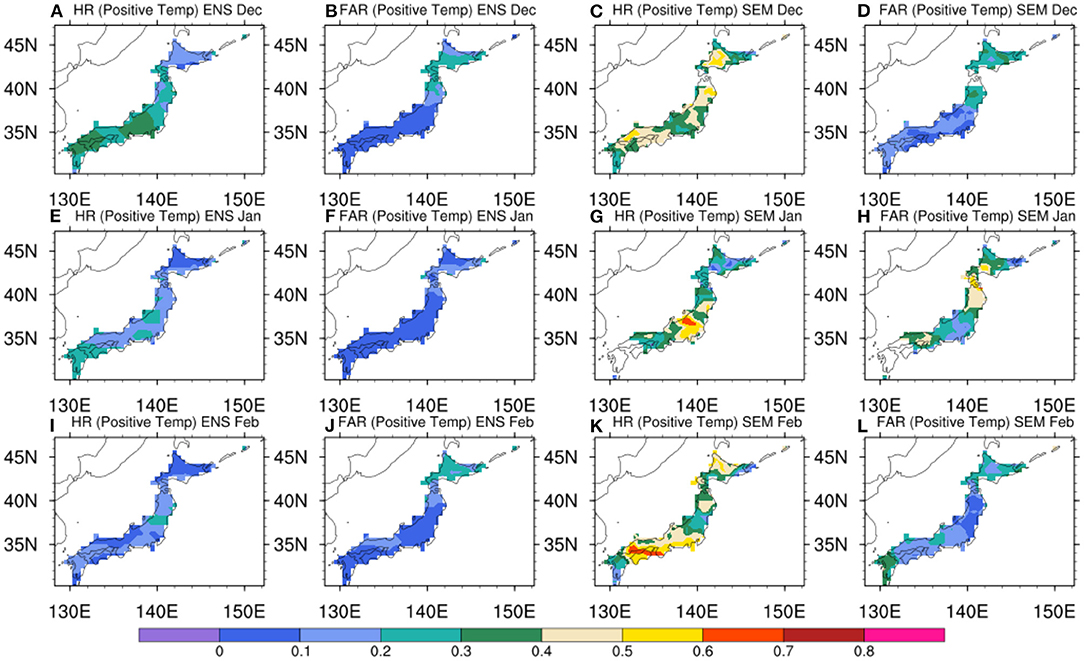
Figure 5. Spatial distribution of (A) HR and (B) FAR of positive SAT anomalies in ENS predictions of December. (C) HR and (D) FAR of positive SAT anomalies in SEM predictions of December. (E–H) same as (A–D) but for January. (I–L) same as (A–D) but for February.
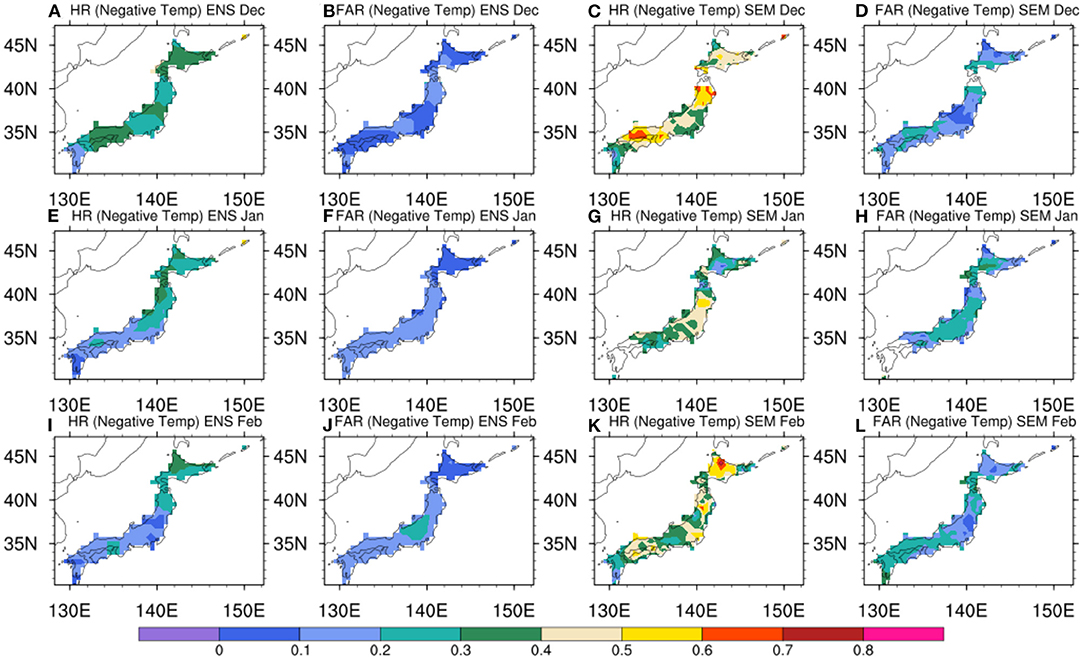
Figure 6. Same as Figure 5 but for negative SAT anomalies.
The ENS predictions in January have small amplitude in all the years (Figure 4B) and also failed to capture the correct sign of the anomalies in many years over region Reg2. Whereas, the SEM predictions have a realistic amplitude of anomalies over Reg2 (Figure 4B). The HR (Figure 5E) in predicting positive SAT anomalies is about 0.2 over most parts of Japan with FAR (Figure 5F) values between 0.0 and 0.1 (Figure 5F) in the ENS predictions indicating the ENS predictions to be skillful. ENS predictions also have higher HR (Figure 6E) compared to FAR (Figure 6F) over all the regions of Japan in predicting negative temperature anomalies. The SEM predictions have high HR values (>0.4) over central and northern parts of Japan (Figures 5G, 6G) with lower FAR values (Figures 5H, 6H) in predicting both positive and negative SAT anomalies. However, over Hokkaido the FAR (Figures 5H, 6H) values exceed HR (Figures 5G, 6G) in the SEM predictions, which indicates that the predictions have no useful skill. The region of high correlation in January (Reg2) also has high HR and low FAR in the SEM predictions.
The SEM predicted SAT anomalies (Figure 4C) in February have more realistic amplitudes compared to ENS predicted SAT anomalies (Figure 4C) over Hokkaido (Reg3) in many years. ENS failed to predict the correct sign of the SAT anomalies in February of 1985, 1992 to 1997, 1999 to 2002, 2005, 2008, 2010, 2012 to 2014, 2016 and in 2018 a total of 19 years (Figure 4C) and SEM failed to predict the correct sign of SAT anomalies in February of 1985, 1994-1997, 1999, 2001, 2006, 2013, and 2014 a total of 10 years (Figure 4C) indicating that the SEM is more skillful compared to ENS predictions, which is also reflected in the higher HR over Hokkaido in the SEM predictions (Figures 5K, 6K) compared to the ENS predictions (Figures 5I, 6I). Over Hokkaido the ENS predictions of both positive and negative SAT anomalies have no skill with higher FAR values (Figures 5J, 6J) compared to HR values (Figures 5I, 6I). The SEM predictions have higher HR (Figures 5K, 6K) compared to FAR (Figures 5L, 6L) over the whole of Japan for both positive and negative SAT anomalies.
To check if the SEM predicted values over the regions Reg[1-3] are better than persistence, we plotted the area averaged GHCN-CAMS SAT anomalies over Reg[1-3] in November along with the SEM predicted values in December, January, and February in Figures 4A–C. The results show that the persistence of November SAT anomalies in December (Figure 4A) over Reg1 has higher ACC score (0.53) compared to both SEM (0.44) and ENS (0.29) indicating the SEM to be not so useful for improving the SINTEX-F2 predictions in December. The SEM predicted SAT anomalies perform better than persistence in January and February with higher ACC score (0.56 and 0.53) in January (Figure 4B) and February (Figure 4C) over Reg2 and Reg3 compared to persistence (0.21 and 0.19).
The results discussed above use the leave-one-out cross validation for generating the predictions i.e., we predict the SAT anomalies for 1 year using the rest of the data for training. To test the robustness of the results of leave-one-out cross validation, we carried out an additional experiment of dividing the data approximately into 90% training and 10% test data and generating the predictions. We used the data for the years 1983/84 to 2014/15 (training data) for generating the members of SEM. Using those members, we generated the predictions for the years 2015/2016 to 2019/2020 (test data). The area averaged predictions over Reg[1-3] in December-February are shown in Figures 4A–C (SEMnew; dark green line). As evident from Figures 4A–C the predictions of SEMnew are not very different from the predictions of SEM for the period 2015/16 to 2019/20 in all the 3 months indicating the methodology followed to identify the members for SEM to be robust.
The above analysis indicates that the SEM has better skill in predicting the winter surface air temperature anomalies over most parts of Japan compared to the ENS, in which all the 120 members of the SINTEX-F2 forecasts are averaged. The improved predictions in SEM compared to ENS are robust over central Japan (Reg2) in January and over Hokkaido (Reg3) in February. To investigate if the improvement in the SEM is due to better skill of the members of the SEM or merely coincidental, we plotted a Taylor diagram (Figure 7) to show the skill of all the 120 members of the predictions over a grid point within the regions Reg [1-3]. The SAT anomalies used for the plot are for the winter months covering the whole period 1983/84 to 2019/20. The SINTEX-F2 members contributing to the SEM predictions are marked with blue and green colors (Figure 7). The members marked in blue contributed to SEM predictions in all years whereas the members marked in green contributed to predictions in some years. In December (Figure 7A) about 20 of the 120 members have ACC scores of about 0.32 (95% significance level using Student's two-tailed t-test) and most of the members which contributed to the SEM predictions also have ACC values of about 0.32 indicating the better performance of the SEM is due to the better skill of the members in the SEM. Similar results can be inferred from the Taylor diagrams for a grid point within regions Reg2 and Reg3 in January and February (Figures 7B,C). We verified that the results shown for a grid point with in the regions Reg[1-3] are applicable for all the grid points within Reg [1-3] (figure not shown).
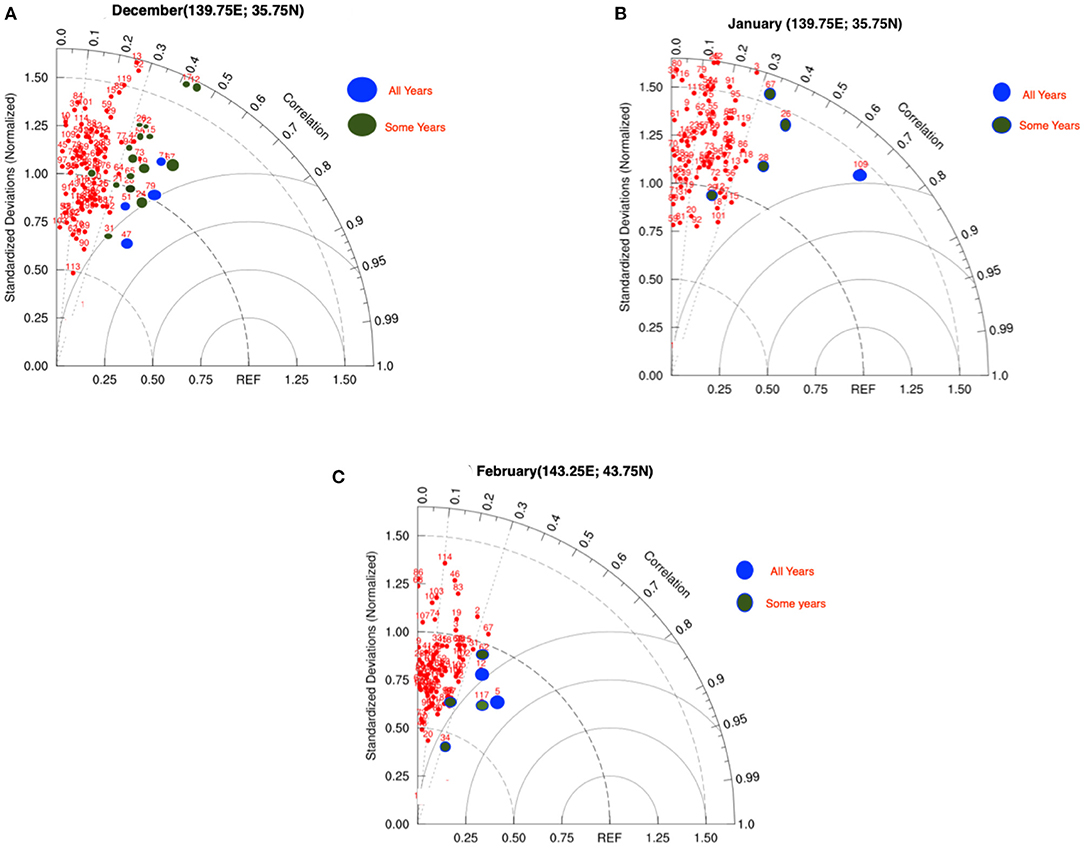
Figure 7. Taylor diagram showing the spread of performance of 120 predictions of SINTEX-F2 of SAT anomalies in (A) December over a grid point located at 139.75°E, 35.75°N, (B) January over a grid point located at 139.75°E, 35.75°N, and (C) February over a grid point located at 143.25°E, 43.75°N) within regions Reg[1-3]. Blue mark is for members which contributed to SEM predictions in all the years. Green marked members contributed to SEM predictions in some years.
Possible Reasons for Improved Skill in SEM Predictions
We analyzed several variables, such as sea surface temperature (SST), 200 hPa geopotential height, sensible and latent heat fluxes, which have direct or indirect effects on the SAT variability over Japan to understand the possible causes for the higher skill of the SEM predictions of SAT compared to ENS predictions. Correlation analysis was used to show how the linkage between SAT over Japan and large-scale fields is represented in observations/reanalysis vs. the SEM and ENS predictions. Specifically, we correlated the GHCN-CAMS anomalies averaged over Reg1, Reg2 and Reg3 in Dec, Jan, and Feb, respectively, with observed/reanalyzed, ENS and SEM predicted SST, 200 hPa geopotential height, surface sensible and latent heat flux anomalies. The analyzed variables can to some extent explain the variation of SAT anomalies over Japan. As some members of SEM vary over forecast years, for convenience we choose only the members of SEM which are robust over all the forecast years for the analysis.
The correlation of GHCN-CAMS SAT anomalies over central Japan (Reg1) in December with NOAA Optimum Interpolation data version 2 (OIV2) (Reynolds et al., 2002) SST anomalies in December shows the SAT anomalies over Reg1 to be significantly correlated with SST anomalies in the equatorial Pacific (Figure 8A) indicating the El Nino-Southern Oscillation (ENSO) can have remote effect on the variation of SAT anomalies over Reg1 in December through atmospheric teleconnections. The SAT anomalies over Reg1 in December are also significantly correlated with the SST anomalies in the Arabian Sea (Figure 8A) and a region of high correlation with values exceeding 0.6 is seen around Japan (Figure 8A). The ENS (Figure 8B) and SEM (Figure 8C) predicted SST anomalies realistically capture the significant correlations over the equatorial Pacific and also the correlations over the Arabian Sea, though they are not significant. The main difference in the ENS and SEM predictions is in the spatial distribution of ACC values around Japan. The SEM predictions (Figure 8C), similar to OIV2 have significant correlations around Japan though with some prediction errors. In ENS predictions (Figure 8B), the correlation is positive but not significant.
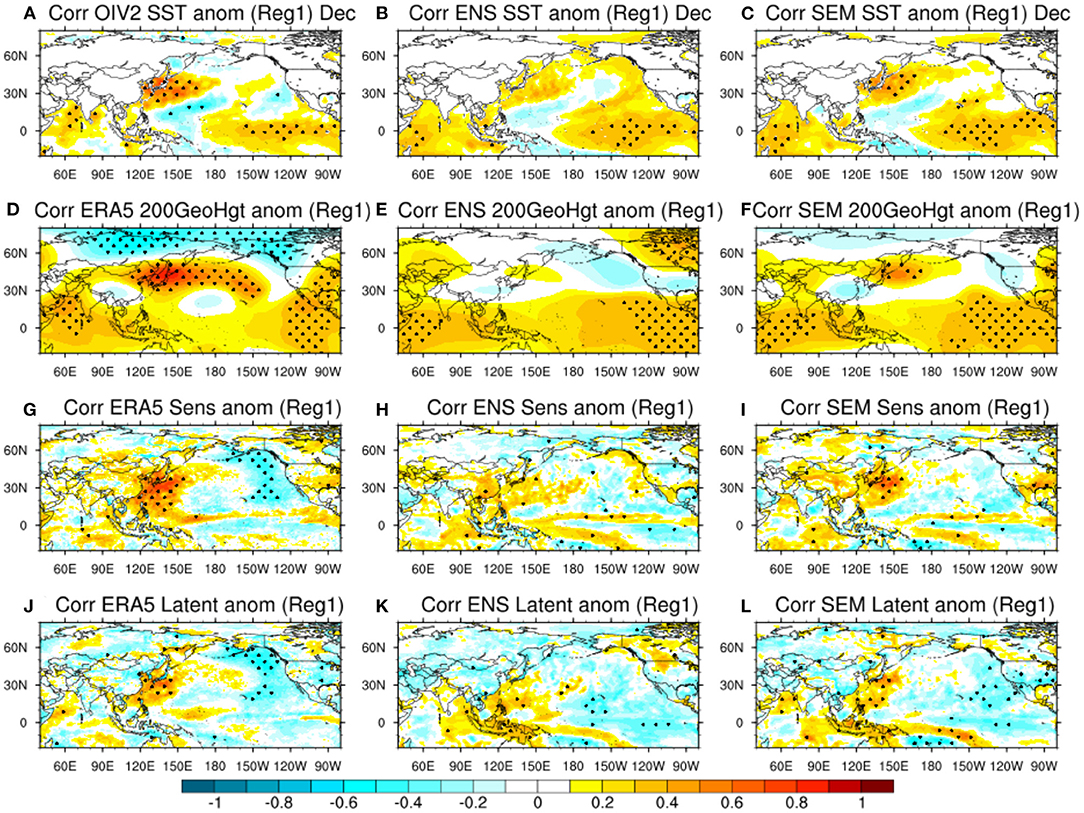
Figure 8. Spatial distribution of correlation coefficients between GHCN-CAMS SAT anomalies averaged over Reg1 and (A) OIV2, (B) ENS and (C) SEM SST anomalies in December. (D–F) same as (A–C) but for ERA5 200 hPa geopotential height anomalies. (G–I) same as (A–C) but for sensible heat anomalies. (J–L) same as (A–C) but for latent heat anomalies. The stippled regions are statistically significant at 95% level using Student's 2 tailed t-test.
The ERA5 200 hPa geopotential height anomalies correlated with GHCN-CAMS SAT anomalies over Reg1 reveals significant negative correlations at higher latitudes extending from the Siberian region to Canada (Figure 8D) and significant positive correlations extending across North Pacific (Figure 8D). The positive correlation values exceed 0.6 over Japan and surrounding regions. The GHCN-CAMS SAT anomalies are also positively correlated with 200 hPa geopotential height anomalies in the equatorial eastern Pacific and over the Arabian Sea regions (Figure 8D). Both ENS (Figure 8E) and SEM (Figure 8F) predictions have errors in the prediction of 200 hPa geopotential height anomalies at higher latitudes though both ENS and SEM capture the correlations realistically in the eastern Pacific and Arabian Sea regions. At higher latitudes, the spatial pattern of correlation coefficients of SEM (Figure 8F) is more realistic compared to that of ENS (Figure 8E). The negative correlation over the Siberian region is well captured in the SEM predictions, and the positive correlation pattern over the North Pacific is also predicted, although it is confined to regions over and around Japan (Figure 8F) and the negative correlations over Siberia and Canada are weak and not significant. The correlation coefficients of ENS predicted 200 Pa geopotential height anomalies are small and are not significant over Japan and surrounding regions (Figure 8E), and the correlations found in the reanalysis over Siberia and Canada regions are not reproduced well. The errors in the predicted 200 hPa geopotential height anomalies over and around Japan can to some extent explain the better performance of SEM in predicting SAT anomalies over Reg1 in December compared to ENS. The sign and location of 200 hPa geopotential height anomalies, which are equivalent barotropic and extend to lower levels at higher latitudes, determine the sign of the SAT anomalies over a region. Positive (negative) 200 hPa geopotential height anomalies indicate clear skies (cloudy) and hence an increase (decrease) of incoming solar radiation which can lead to positive (negative) SAT anomalies. Also, the circulation anomalies associated with the 200 hPa height anomalies help advect heat fluxes from the surrounding seas and contribute to the variation of the SAT anomalies. The higher values of correlation coefficients of SEM predicted 200 hPa geopotential height anomalies with the SAT anomalies indicates a more realistic location and sign of predicted geopotential height anomalies in SEM compared to ENS.
The surface sensible heat (Figure 8G) and latent heat flux (Figure 8J) anomalies (positive downward) over the seas around Japan are positively correlated with the GHCN-CAMS SAT anomalies over region Reg1 in December. The correlation coefficients have values exceeding 0.5 and are significant. This indicates that warmer SAT over Reg1 is associated with downward surface heat flux anomalies, and the positive correlation of SST (Figures 8A–C) found around Japan can be considered as a result of surface heat fluxes. The region of significant correlation extends from the West North Pacific to the central parts of Japan (Figures 8G,J). A “horseshoe” pattern of significant negative correlation is also seen over the eastern North Pacific region (Figures 8G,J). The correlation of GHCN-CAMS anomalies over Reg1 with ENS predicted surface sensible heat (Figure 8H) and latent heat (Figure 8K) flux anomalies is positive in the seas surrounding Japan but the correlation coefficient values are small and not significant. The SEM predictions of sensible (Figure 8I) and latent heat (Figure 8L) fluxes have slightly higher ACC values compared to ENS and are significant over some regions. However, both ENS and SEM predicted surface fluxes do not have the “horseshoe” pattern in the ACC values over the eastern North Pacific. The above analysis indicates that both the ENS and SEM-predicted geopotential height anomalies and surface heat fluxes in the seas around Japan have errors and that the members contributing to the SEM have slightly reduced errors.
In January, the GHCN-CAMS SAT anomalies over Reg2 (Figure 2D) are significantly correlated with OIV2 SST anomalies in the Indian Ocean and Arabian Sea (Figure 9A) and also with SST anomalies around Japan (Figure 9A). The ACC spatial distribution in the Indian Ocean indicates that the SST anomalies in the Indian Ocean can have a remote effect on the SAT anomalies over Reg2 through atmospheric teleconnections. The spatial pattern of correlation coefficients in the Indian Ocean is well-captured in both ENS (Figure 9B) and SEM (Figure 9C) predictions. However, the SEM (Figure 9C) predictions have higher correlation coefficients around Japan compared to ENS (Figure 9B). The spatial pattern of correlation coefficients of ERA5 200 hPa geopotential height anomalies with GHCN-CAMS SAT anomalies over Reg2, shows negative correlation in higher latitudes covering Eurasian region to Canada and positive correlation from west Asia to central North Pacific along the sub-tropical jet (Figure 9D). Significant positive correlations are also seen over the Indian Ocean and equatorial Pacific regions (Figure 9D). The correlation of GHCN-CAMS anomalies over Reg2 in January with the 200 hPa geopotential height anomalies of ENS (Figure 9E) reveals weak correlations and distortion in the spatial distribution of ACC values in the higher latitudes indicating large errors in the ENS predicted 200 hPa geopotential height. Interestingly, the spatial distribution of ACC values of SEM predicted 200 hPa geopotential height (Figure 9F) is similar to the one seen in Figure 9D with negative correlation extending from the Eurasian region to Canada and positive correlations along the sub-tropical Jet from west Asia to central North Pacific indicating the SEM predicted 200 hPa geopotential height anomalies to have smaller errors compared to ENS predicted geopotential height anomalies. The correlation of GHCN-CAMS SAT anomalies over Reg2 with ERA5 sensible (Figure 9G) and latent (Figure 9J) heat flux anomalies shows the sensible heat flux to be strongly correlated compared to latent heat flux anomalies to the variations of SAT anomalies over Reg2, though both the fluxes have positive correlations around Japan. The correlations of the SEM predicted sensible (Figure 9I) and latent (Figure 9L) heat fluxes with GHCN-CAMS SAT anomalies over Reg2 in January have magnitudes and spatial pattern similar to the one seen with ERA5 (Figures 9G,J). However, the ACC values with the ENS predictions are weak (Figures 9H,K). The SEM predicted geopotential height and the atmospheric teleconnections compare well to the ENS predicted values resulting in predicting SAT anomalies with high ACC over Reg2 in January.
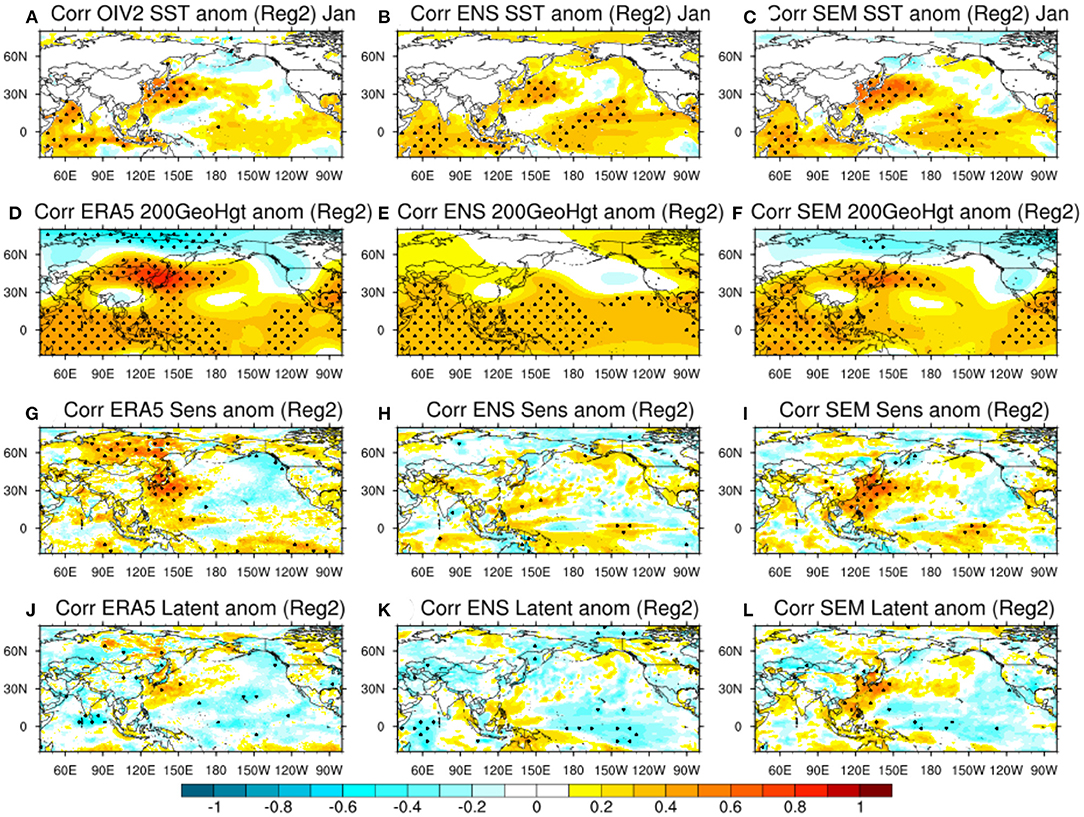
Figure 9. Same as Figure 8 but for January.
The correlation of GHCN-CAMS SAT anomalies over Hokkaido (Reg3) in February with SST anomalies in February shows Central Pacific or ENSO Modoki (Ashok et al., 2007) type of spatial distribution over the equatorial Pacific though the correlations are not significant (Figure 10A). A region of significant correlation around the northern parts of Japan is also seen in the spatial distribution (Figure 10A). Though both ENS (Figure 10B) and SEM (Figure 10C) have errors in the ACC patterns over the tropical and equatorial Pacific regions, the ACC pattern of SEM (Figure 10C) around Japan is comparable to the observed pattern (Figure 10A). The spatial pattern of correlation of GHCN-CAMS SAT anomalies over Reg3 in February and ERA5 2,000 hPa geopotential anomalies, similar to the patterns in January shows significant negative correlations over the Eurasian region and significant positive correlation around Japan (Figure 10D). The correlation coefficients of sensible (Figure 10G) and latent (Figure 10J) heat fluxes are positive around Japan. Similar to January, the ACC values of sensible heat are higher than those of latent heat flux. The spatial distribution and magnitudes of the ACC values of GHCN-CAMS SAT anomalies with SEM 200hPa geopotential height (Figure 10F), sensible (Figure 10I), and latent (Figure 10L) heat flux anomalies are comparable to observed. In the ENS, on the other hand, the pattern and magnitudes of correlations (Figures 10E,H,K) differ from the observed ones (Figures 10D,G,J). The smaller errors in the geopotential height anomalies in SEM predictions compared to ENS predictions can to some extent explain the differences in the SAT ACC values between the two predictions.
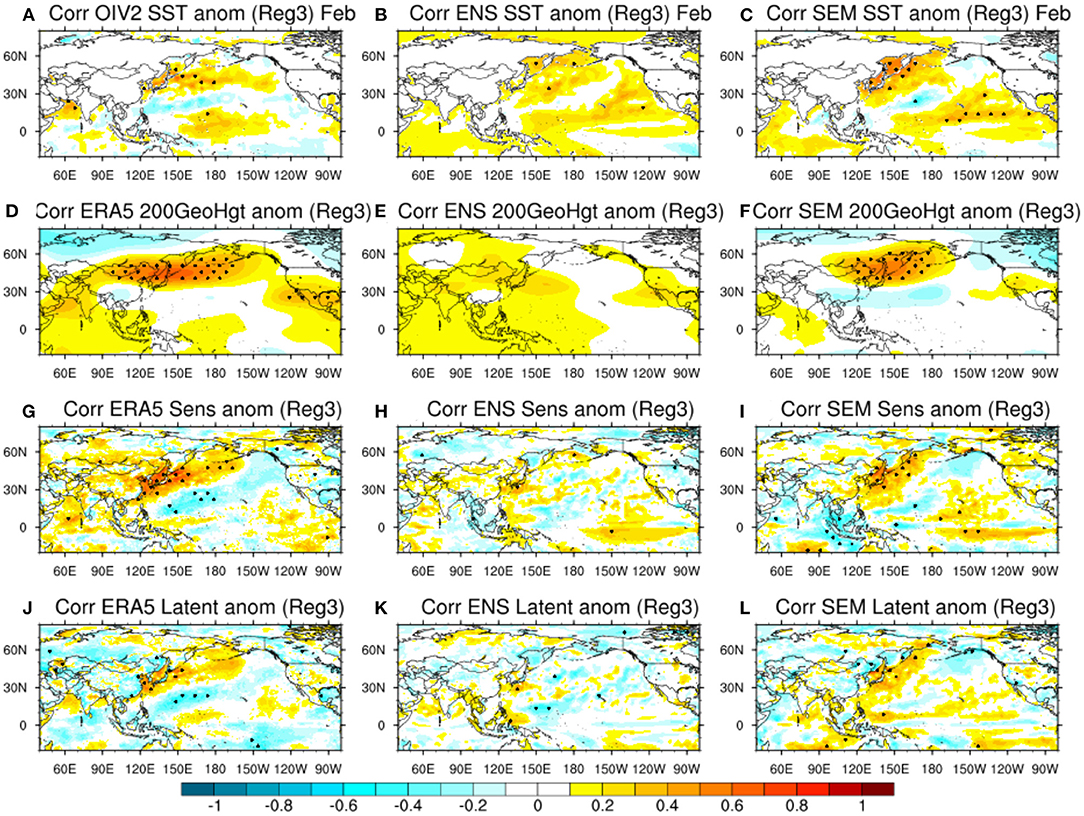
Figure 10. Same as Figure 8 but for February.
Conclusions
In this study we evaluated 120-ensemble predictions of SINTEX-F2 with regard to their skill in predicting SAT anomalies over Japan in the winter months December, January, and February. We used predictions initialized in November for the period 1983/84 to 2019/20.
First, each of the 120 member prediction was evaluated using the ACC skill score and the members with robust ACC skill score were selected and SEM was generated over all the grid points covering Japan. The ENS was generated by averaging all the 120-member predictions. Comparison of the ACC skill scores of the SEM predictions with ENS predictions shows that the ACC skill scores improved significantly in January over central parts of Japan and over Hokkaido in February. In December the ACC skill scores improved in SEM compared to ENS over central Japan and Hokkaido but the differences in the ACC values are not significant. The regions showing significant improvement in ACC values also correspond to regions of increased (decreased) hit rate (false alarm rate).
Correlation of GHCN-CAMS SAT anomalies over regions Reg[1-3] with 200 hPa observed and predicted geopotential anomalies reveals the spatial distribution of the correlation coefficients of the SEM predictions to be closer to the observed patterns in the higher latitudes compared to the spatial patterns of the ENS predictions. This indicates that the SEM has a more realistic distribution of geopotential anomalies than the ENS predictions. The better representation of geopotential height anomalies in the SEM members likely contributed to the improved ACC skill scores over the regions Reg[1-3].
This study brings out the merits and limitations of using SEM to predict the SAT anomalies over Japan in the winter months. The SEM shows improvement in the ACC skill score over most parts of Japan in December though the improvements are small in magnitude and well below the ACC score of 0.6 which is generally considered as the threshold for useful skill. In January, SEM had significant improvement in ACC scores over central parts of Japan but the skill of the SEM prediction deteriorated compared to ENS over Hokkaido. The ACC skill scores are improved over most parts of Japan in SEM compared to ENS in February but significant improvements are seen only over Hokkaido. Thus, the SEM technique is a useful technique to improve skills of SAT predictions but the improvements are significant only over some limited regions.
Although the SEM technique is useful to improve the predictions over regions of Japan, there are a few caveats associated with the technique relating to (a) no systematic relation of the SEM members to initial conditions and (b) the varying members in SEM for each month and year. Our analysis shows no systematic relation between initial conditions/model physical perturbation and the members selected for the SEM and this limits our ability to pin-point the exact physical process for selecting a SINTEX-F2 member for the SEM.
The number of members in SEM for each month and year are based on the criteria of ACC being robust. The members which are just below the values satisfying the criteria sometimes satisfy the criteria due to the increased amplitude of the anomalies in that training dataset in some years. This leads to the members being different in different months and years. As shown in Figure 7 there are some members which are common in all the years and some additional members which satisfy the condition set for selection appear in some years. We will be addressing these issues in our future studies by adopting a more rigorous and physical based criteria to select the members to make the SEM techniques more skillful.
Data Availability Statement
The datasets presented in this article are not readily available because due to confidentiality agreements, supporting SINTEX-F2 model data can only be made available to bona fide researcher's subject to a non-disclosure agreement. Details of the data and how to request access are available from the authors. The NOAA_OI_SST_V2, and GHCN-CAMS data were provided by NOAA PSL, Boulder, Colorado, USA, (https://psl.noaa.gov/data/gridded/index.html). The ERA5 data was downloaded from the Copernicus climate change service (c3s) climate data store. Requests to access the datasets should be directed to TD, dGFrZXNoaS5kb2lAamFtc3RlYy5nby5qcA==.
Author Contributions
JR conceived the idea and carried out the experiments. The SINTEX-F2 predictions were generated by TD. All authors contributed equally to the analysis and manuscript preparation. All authors contributed to the article and approved the submitted version.
Funding
The research was partly supported by JSPS KAKENHI Grant JP19H05701.
Conflict of Interest
The authors declare that the research was conducted in the absence of any commercial or financial relationships that could be construed as a potential conflict of interest.
Publisher's Note
All claims expressed in this article are solely those of the authors and do not necessarily represent those of their affiliated organizations, or those of the publisher, the editors and the reviewers. Any product that may be evaluated in this article, or claim that may be made by its manufacturer, is not guaranteed or endorsed by the publisher.
Acknowledgments
The authors would like to thank the editor and reviewers for their comments and suggestions, which helped to improve the manuscript. The authors would like to thank NOAA PSL and ECMWF for providing the datasets used in the study.
References
Ashok, K., Behera, S. K., Rao, S. A., Weng, H., and Yamagata, T. (2007): El Nino Modoki its possible teleconnection. J. Geophys. Res. 112, C11007. doi: 10.1029/2006JC003798
Becker, E., Dool, H., and van den Zhang, Q. (2014). Predictability and forecast skill in NMME. J. Clim. 27, 5891–5906. doi: 10.1175/JCLI-D-13-00597.1
Canty, A., and Ripley, B. D. (2021). Boot: Bootstrap R (S-Plus) Functions. Available online at: https://CRAN.R-project.org/package=boot
Chen, J.-H., and Lin, S.-J. (2013). Seasonal predictions of tropical cyclones using a 25-km-resolution general circulation model. J. Clim. 26, 380–398. doi: 10.1175/JCLI-D-12-00061.1
Davison, A. C., and Hinkley, D. V. (1997). Bootstrap Methods and Their Applications. Cambridge: Cambridge University Press.
Doi, T., Behera, S. K., and Yamagata, T. (2016). Improved seasonal prediction using the SINTEX-F2 coupled model. J. Adv. Model. Earth Syst. 8, 1847–1867. doi: 10.1002/2016MS000744
Doi, T., Behera, S. K., and Yamagata, T. (2019). Merits of a 108-member ensemble system in ENSO and IOD predictions. J. Clim. 32, 957–972. doi: 10.1175/JCLI-D-18-0193.1
Doi, T., Behera, S. K., and Yamagata, T. (2020). Wintertime impacts of the 2019 super IOD on east Asia. Geophys. Res. Lett. 47. doi: 10.1029/2020GL089456
Doi, T., Storto, A., Behera, S. K., Navarra, A., and Yamagata, T. (2017). Improved prediction of the indian ocean dipole mode by use of subsurface ocean observations. J. Clim. 30, 7953–7970. doi: 10.1175/JCLI-D-16-0915.1
Efron, B., and Tibshirani, R. (1994). An Introduction to the Bootstrap. New York, NY: Chapman and Hall.
Fan, Y., and van den Dool, H. (2008). A global monthly land surface air temperature analysis for 1948–present. J. Geophys. Res. 113. doi: 10.1029/2007JD008470
Fichefet, T., and Morales Maqueda, M. A. (1997). Sensitivity of a global sea ice model to the treatment of ice thermodynamics and dynamics. J. Geophys. Res. Oceans 102, 12609–12646. doi: 10.1029/97JC00480
Hersbach, H., Bell, B., Berrisford, P., Hirahara, S., Horányi, A., Muñoz-Sabater, J., et al. (2020). The ERA5 global reanalysis. Q. J. R. Meteorol. Soc. 146, 1999–2049. doi: 10.1002/qj.3803
Johnson, S. J., Stockdale, T. N., Ferranti, L., Balmaseda, M. A., Molteni, F., Magnusson, L., et al. (2019). SEAS5: The new ECMWF seasonal forecast system. Geosci. Model Dev. 12, 1087–1117. doi: 10.5194/gmd-12-1087-2019
Lee, D. Y., Ashok, K., and Ahn, J.-B. (2011). Toward enhancement of prediction skills of multimodel ensemble seasonal prediction: a climate filter concept. J. Geophys. Res. 116, D06116. doi: 10.1029/2010JD014610
Mason, S. J. (2008). Understanding forecast verification statistics. Meteorol. Appl. 15, 31–40. doi: 10.1002/met.51
Mason, S. J., and Graham, N. E. (1999). Conditional probabilities, relative operating characteristics, and relative operating levels. Weather Forecast. 14, 713–725. doi: 10.1175/1520-0434(1999)014<0713:CPROCA>2.0.CO;2
Masson, S., Terray, P., Madec, G., Luo, J.-J., Yamagata, T., and Takahashi, K. (2012). Impact of intra-daily SST variability on ENSO characteristics in a coupled model. Clim. Dyn. 39, 681–707. doi: 10.1007/s00382-011-1247-2
Nishimura, M., and Yamaguchi, M. (2015). Selective ensemble mean technique for tropical cyclone track forecasts using multi-model ensembles. Trop. Cyclone Res. Rev. 4, 71–78. doi: 10.6057/2015TCRR02.03
Palmer, T. N., and Anderson, D. L. T. (1994). The prospects for seasonal forecasting—A review paper. Q. J. R. Meteorol. Soc. 120, 755–793. doi: 10.1002/qj.49712051802
Qi, L., Yu, H., and Chen, P. (2014). Selective ensemble-mean technique for tropical cyclone track forecast by using ensemble prediction systems: ensemble-mean Technique for Tropical Cyclone Track Forecast. Q. J. R. Meteorol. Soc. 140, 805–813. doi: 10.1002/qj.2196
R Core Team (2021). R: A Language and Environment for Statistical Computing. Vienna: R Foundation for Statistical Computing. Available online at: https://www.R-project.org/
Ratnam, J. V., Doi, T., Morioka, Y., Oettli, P., Nonaka, M., and Behera, S. K. (2021). Improving predictions of surface air temperature anomalies over Japan by the selective ensemble mean technique. Weather Forecast. 36, 207–217. doi: 10.1175/WAF-D-20-0109.1
Reynolds, R. W., Rayner, N. A., Smith, T. M., Stokes, D. C., and Wang, W. (2002). An improved in situ and satellite SST analysis for climate. J. Clim. 15, 1609–1625. doi: 10.1175/1520-0442(2002)015<1609:AIISAS>2.0.CO;2
Roeckner, E., and Coauthors. (2003). The atmospheric general circulation model ECHAM5. Part I: Model description. Max-Planck-Institut für Meteorologie Rep. 349, 140. Available online at: https://www.mpimet.mpg.de/fileadmin/publikationen/Reports/max_scirep_349.pdf
Sasaki, W., Richards, K. J., and Luo, J.-J. (2013). Impact of vertical mixing induced by small vertical scale structures above and within the equatorial thermocline on the tropical Pacific in a CGCM. Clim. Dyn. 41, 443–453. doi: 10.1007/s00382-012-1593-8
Scaife, A. A., Arribas, A., Blockley, E., Brookshaw, A., Clark, R. T., Dunstone, N., et al. (2014). Skillful long-range prediction of European and North American winters. Geophys. Res. Lett. 41, 2514–2519. doi: 10.1002/2014GL059637
Scher, S., and Messori, G. (2019). Selective ensemble mean technique for severe european windstorms. Q. J. R. Meteorol. Soc. 145, 376–385. doi: 10.1002/qj.3408
Takaya, Y., Hirahara, S., Yasuda, T., Matsueda, S., Toyoda, T., Fujii, Y., et al. (2018). Japan Meteorological Agency/Meteorological Research Institute-Coupled Prediction System version 2 (JMA/MRI-CPS2): atmosphere–land–ocean–sea ice coupled prediction system for operational seasonal forecasting. Clim. Dyn. 50, 751–765. doi: 10.1007/s00382-017-3638-5
Keywords: SINTEX-F2, atmospheric teleconnections, Hokkaido, central Japan, selected ensemble mean
Citation: Ratnam JV, Doi T, Richter I, Oettli P, Nonaka M and Behera SK (2022) Using Selected Members of a Large Ensemble to Improve Prediction of Surface Air Temperature Anomalies Over Japan in the Winter Months From Mid-Autumn. Front. Clim. 4:919084. doi: 10.3389/fclim.2022.919084
Received: 13 April 2022; Accepted: 26 May 2022;
Published: 16 June 2022.
Edited by:
Karumuri Ashok, University of Hyderabad, IndiaReviewed by:
Debashis Nath, Sun Yat-sen University, ChinaNagaraju Chilukoti, National Institute of Technology Rourkela, India
Copyright © 2022 Ratnam, Doi, Richter, Oettli, Nonaka and Behera. This is an open-access article distributed under the terms of the Creative Commons Attribution License (CC BY). The use, distribution or reproduction in other forums is permitted, provided the original author(s) and the copyright owner(s) are credited and that the original publication in this journal is cited, in accordance with accepted academic practice. No use, distribution or reproduction is permitted which does not comply with these terms.
*Correspondence: J. V. Ratnam, anZyYXRuYW1AamFtc3RlYy5nby5qcA==
†Present Address: Pascal Oettli, Department of Earth and Planetary Science, Graduate School of Sciences, The University of Tokyo, Tokyo, Japan
 J. V. Ratnam
 Takeshi Doi
 Ingo Richter
 Pascal Oettli
 Masami Nonaka
 Swadhin K. Behera