
94% of researchers rate our articles as excellent or good
Learn more about the work of our research integrity team to safeguard the quality of each article we publish.
Find out more
ORIGINAL RESEARCH article
Front. Clim., 07 June 2022
Sec. Climate, Ecology and People
Volume 4 - 2022 | https://doi.org/10.3389/fclim.2022.861477
This article is part of the Research TopicAdvances in Marine Heatwave InteractionsView all 18 articles
 Saurabh Rathore1,2*
 Rishav Goyal3,4
 Babita Jangir5
 Caroline C. Ummenhofer6,7
 Ming Feng8,9
 Mayank Mishra10
Interactions are diagnosed between a marine heatwave (MHW) event and tropical super cyclone Amphan in the Bay of Bengal. In May 2020, an MHW developed in the Bay of Bengal driven by coupled ocean-atmosphere processes which included shoaling of the mixed layer depth due to reduced wind speed, increased net surface shortwave radiation flux into the ocean, increased upper ocean stratification, and increased sub-surface warming. Ocean temperature, rather than salinity, dominated the stratification that contributed to the MHW development and the subsurface ocean warming that also increased tropical cyclone heat potential. The presence of this strong MHW with sea surface temperature anomalies >2.5°C in the western Bay of Bengal coincided with the cyclone track and facilitated the rapid intensification of tropical cyclone Amphan to a super cyclone in just 24 h. This rapid intensification of a short-lived tropical cyclone, with a lifespan of 5 days over the ocean, is unprecedented in the Bay of Bengal during the pre-monsoon period (March-May). As the cyclone approached landfall in northern India, the wind-induced mixing deepened the mixed layer, cooled the ocean's surface, and reduced sub-surface warming in the bay, resulting in the demise of the MHW. This study provides new perspectives on the interactions between MHWs and tropical cyclones that could aid in improving the current understanding of compound extreme events that have severe socio-economic consequences in affected countries.
Anomalously high sea surface temperature (SST) values sustained for a period of time in regional ocean basins are known as marine heatwaves (MHWs), which are observed across the global ocean (Sen Gupta et al., 2020). MHWs can have catastrophic impacts on marine habitats and species of socio-economic importance, re-organizing ecosystem structure by supporting a certain species and suppressing others (Wernberg et al., 2013, 2016; Frölicher et al., 2018; Smale et al., 2019). A MHW event is defined when the SST exceeds a seasonally varying threshold (usually the 90th percentile) for at least five consecutive days (Hobday et al., 2016). MHWs occur throughout the year. Local processes, large-scale climate modes, and teleconnections are all important drivers for MHWs: they include ocean currents, air-sea fluxes (warming through the ocean surface from the atmosphere), and winds that can enhance and suppress MHWs (Holbrook et al., 2019). Further, underlying anthropogenic warming of the ocean as well as climate phenomena such as the El Niño Southern Oscillation (ENSO) can also change the likelihood of MHW events occurring in certain regions (Sen Gupta et al., 2020).
Dzwonkowski et al. (2020) recently showed that a MHW event in the northern Gulf of Mexico was generated due to ocean stratification from the compounding effects of tropical cyclone (Gordon) followed by an atmospheric heatwave. These compounding conditions led to the intensification of the subsequent hurricane Michael due to the extremely warm state of the underlying coastal ocean. Furthermore, it has been suggested that extreme climate/weather events are likely exacerbated in a warming world: For example, the Tasman Sea MHW in 2015–16 affected much of the southeast Australian coastal region, particularly off Tasmania, with the extreme MHW event resulting from natural variability (e.g., ENSO) and anthropogenic climate change (Collins et al., 2019). Also, recent severe Atlantic hurricanes Harvey, Irma, and Maria during 2017 were attributed to surface ocean warming due to anthropogenic climate change (Collins et al., 2019). Hence our study contributes to understanding compound events and their complex interactions in a warming world.
This study focuses on the Bay of Bengal (BoB; Figure 1) whose dynamics are very complex due to the strong stratification from freshwater input, high SST values, and its vulnerability toward tropical cyclones that form during the pre-monsoon (March-May) and post-monsoon (October-November) seasons. The North Indian Ocean accounts for the highest number of fatalities globally from tropical cyclones (Mohanty et al., 2015), and the BoB experiences ~5 to 7% of the total number of tropical cyclones that occur globally each year (Neetu et al., 2012; Jangir et al., 2020, 2021). Out of 23 recorded deadly storms with fatalities > 10,000 in the last 300 years, 20 tropical cyclones formed over the BoB (Mohanty et al., 2015).
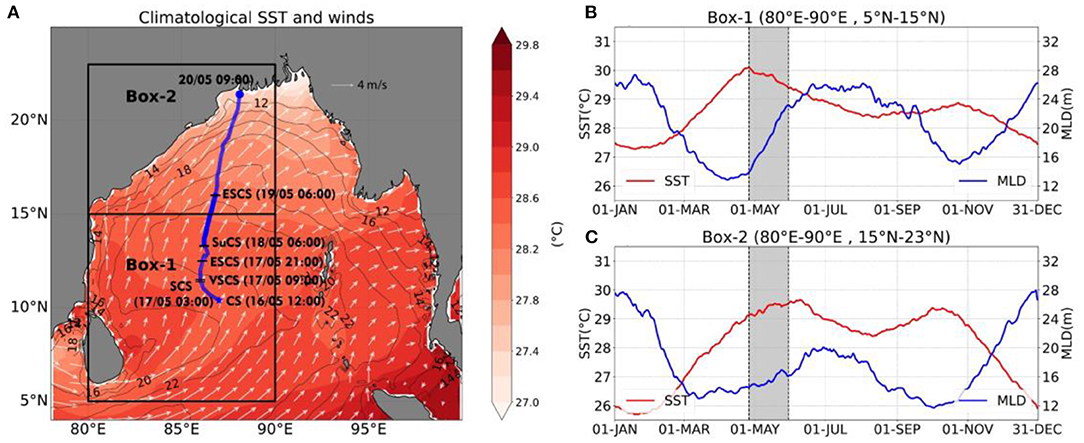
Figure 1. (A) Study region of the Bay of Bengal (70–100°E and 0–25°N) delineated by the boxes for the subregions of the bay i.e., box 1 (80–90°E and 5–15°N), box 2 (80–90°E and 15–23°N) with annual mean sea surface temperature (°C, shaded), overlaid by the contours of annual mean mixed layer depth (m) and vectors of annual mean surface winds (ms−1), and the track of Tropical cyclone Amphan with the dates of cyclogenesis (CS, 16-May-2020), intensification into a super cyclonic storm (SuCS, 18-May-2020), and landfall as extremely severe cyclonic storm (ESCS, 20-May-2020), (B) daily climatology for the area-averaged sea surface temperature and mixed layer depth for box 1 with gray shading indicating the time of year that is the focus of the current study (26-Apr to 30-May), (C) same as (B) but for box 2.
The BoB in the northeastern part of the Indian Ocean maintains basin-wide SST of 28°C and above with a shallow mixed layer depth (MLD) throughout the year (Shenoi, 2002). The BoB also receives freshwater through excess rain and river runoff from major river systems. Consequently, the BoB is characterized by low salinity; and the bay's warm and fresh surface water (owing to its tropical location) overlays cold and salty water at depth. This configuration of surface and subsurface water forms a barrier layer due to enhanced near-surface stratification (Neetu et al., 2012). The presence of a barrier layer is one of the main reasons for the high SST values in the BoB that are maintained throughout the year (Rahaman et al., 2020) and that serves as a breeding ground for tropical cyclones (Jangir et al., 2021).
Tropical cyclone Amphan during May 2020 was the first super cyclone in the BoB in the last 21 years; it intensified from category 1 (cyclonic storm) to category 5 (super cyclone) in <36 h (Balasubramanian and Chalamalla, 2020). According to the World Meteorological Organization (WMO), Amphan was the costliest tropical cyclone on record in the North Indian Ocean, with reported economic losses in India of approximately $14 billion [World Meteorological Organization (WMO), 2021] and 129 casualties across India and Bangladesh. Here, we investigate what allowed the rapid intensification of tropical cyclone Amphan from a cyclonic storm to a super cyclone over an unusually short period of time.
The study region encompasses the BoB (70–100°E and 0–25°N) as shown in Figure 1A. We focus on two subregions according to Indian summer monsoon inflow i.e., for box 1 (80–90°E and 5–15°N) and high freshwater discharge from major river system for box 2 (80–90°E and 15–23°N) (Jana et al., 2015; Jangir et al., 2021). These boxes cover the cyclone track of Amphan where the cyclogenesis occurred in box 1 and landfall in box 2.
The detection of MHW events is carried out following the definition of Hobday et al. (2016) and implemented with a software package developed by Oliver et al. (2017). A MHW is defined from the daily SST time series as a discrete prolonged anomalously warm water event when the daily SST at a grid point exceeds the seasonally varying 90th percentile for at least five consecutive days (Oliver et al., 2018). Two events with a gap of <3 days are considered as a single MHW event. The daily anomalies are computed by removing the daily climatology for the respective variable. The base period of 1981 to 2020 was used to compute the daily anomalies and 90th percentile for the detection of MHW events.
For the categorization of the MHW, we followed the definition from Hobday et al. (2018). They defined the MHW category (θ) as (SST−SST_climatology)/(SST_90th_Percentile−SST_climatology) where the numerator denotes the intensity of the MHW and is scaled by the difference between the climatological 90th percentile and the climatological mean SST. Hence, the MHW can be categorized as moderate (1 ≤ θ <2, Category I), strong (2 ≤ θ <3, Category II), severe (3 ≤ θ <4, Category III), and extreme (4 ≤ θ, Category IV).
For a mechanistic understanding underlying the MHW event and its interaction with tropical cyclone Amphan, we performed a mixed layer heat budget analysis (Sen et al., 2021). In the mixed layer heat budget, the vertically integrated temperature of the mixed layer is equal to the sum of horizontal advection, air-sea heat flux exchange, and residual processes “R” which represent vertical advection, vertical diffusion, and entrainment at the base of the mixed layer. The following equation 1 is used to estimate the anomalous mixed layer heat budget component.
Where QNet = Qswf+Qlwf+Qshf+Qlhf, QNet is the net surface heat flux, Qswf is the net surface shortwave radiation flux, Qlwf is the net surface longwave radiation flux, Qshf is the surface sensible heat flux, and Qlhf is the surface latent heat flux. The sign convention of ERA five products are positive downward i.e., into the ocean and all the fluxes are with the sense of direction i.e., Qswf is positive (into the ocean) and the rest of the fluxes are negative (out of the ocean) in sign.
Where T denotes the mixed layer (h) temperature; u, v are the horizontal ocean currents, the first term in the RHS represents horizontal advection, the second term in the RHS represents the air-sea heat flux exchange where ρ0 is potential density, Cp is specific heat capacity. In our study, we used the MLD provided by Copernicus in the analysis and reanalysis data. The MLD is defined by the sigma_theta (σθ) criterion. It is the depth where the density increase compared to the density at 10 m depth corresponds to a temperature decrease of 0.2°C relative to local surface conditions [Temperature (θ10m), Salinity (S10m), Surface Pressure (P0 = 0 dbar)].
We have also estimated the freshwater content following Sengupta et al. (2016) to understand the role of freshwater in the stratification and generation of the MHW. The freshwater content is computed using the following Equation (2), where h is mixed layer depth, S(z) is the salinity in the mixed layer and Sref is reference salinity, which is taken here as 35 psu.
To estimate the stratification in the ocean we computed the Brunt–Väisälä frequency (N2) from the GSW toolbox (https://teos-10.github.io/GSW-Python/) defined as where g is the gravitational acceleration (9.81 ms−2). To isolate the role of temperature and salinity for the total N2, we divide N2 into two components namely N2-temperature and N2-salinity. N2-temperature is computed by using 0–200 m depth-averaged salinity in the N2 computation thereby removing the effects from changes in salinity. N2-salinity is then estimated as N2 minus N2-temperature (Fan et al., 2020).
We also computed the tropical cyclone heat potential (TCHP) to understand the effect of subsurface heat accumulation for the compound extreme event of MHW and tropical cyclone. The TCHP is defined following Equation (3)
where D26 is the depth of the 26°C isotherm in the ocean (Jangir et al., 2021).
The vertical wind shear magnitude (m s−1) is computed using the daily horizontal (zonal and meridional) winds vectors (u, v) from ERA5 as a difference between the 200 hPa and 850 hPa levels.
For the MHW detection, we used high-resolution daily SST data from NOAA OI SST V2 (Reynolds et al., 2007) spanning from 1981 to 2020 at 0.25° horizontal resolution.
We used ocean temperature and salinity data from two products provided by the Copernicus Marine Service GLOBAL_REANALYSIS_PHY_001_031 (Reanalysis hereafter) and GLOBAL_ANALYSISFORECAST_PHY_CPL_001_015 (Analysis hereafter). The Reanalysis product is the ensemble mean of four products which include GLORYS2V4, ORAS5, GloSea5, and C-GLORS05. The Analysis product is the output of the weakly coupled ocean-atmosphere data assimilation and forecast system and is used to provide 10 days of 3D global ocean forecasts, at 0.25°spatial resolution, updated daily (Lea et al., 2015). The Reanalysis product is available from Jan-1993 to June-2019 whereas, the Analysis product is available from Dec-2015 to the present (Dec-2020 for our study). Both products have daily temporal resolution with a 0.25°horizontal resolution but they have different vertical levels, 75 levels in the Reanalysis and 43 levels in the Analysis. So, we linearly interpolated the Reanalysis data in the vertical onto the grid of the Analysis data. Due to the longer time span of the Reanalysis product, we used it to create the daily climatology to deduce the daily anomalies from the Analysis product for the year 2020.
For the atmospheric fields (10 m winds and Mean Sea Level Pressure) and surface fluxes (Qswf, Qlwf, Qshf, and Qlhf) we used ECMWF ERA5 data (Hersbach et al., 2020). All the variables used from ERA5 are at a spatial resolution of 0.25° with the temporal resolution of 1 h but converted to daily means.
The best track data for tropical cyclone Amphan is taken from the Indian Meteorological Department (IMD, http://www.rsmcnewdelhi.imd.gov.in/report.php?internal_menu=MzM=). The daily data of near real-time sea-level anomaly (SLA) and geostrophic current vectors are from Copernicus Marine Service (SEALEVEL_GLO_PHY_L4_NRT_OBSERVATIONS_008_046, https://doi.org/10.48670/moi-00149) with a spatial resolution of 0.25°. The geostrophic current vectors are used here to represent mesoscale oceanic eddies. The anomalies of all the data products used in this study are extracted for the period of interest to investigate the interaction between the MHW and tropical cyclone Amphan.
We detected a MHW event in box 1 from 1-May-2020 to 17-May-2020 and one in box 2 from 6-May-2020 to 19-May-2020 as shown in Figure 2 in red shading. This study is focused on investigating the interaction between the MHW and tropical cyclone that coincided forming a compound extreme event.
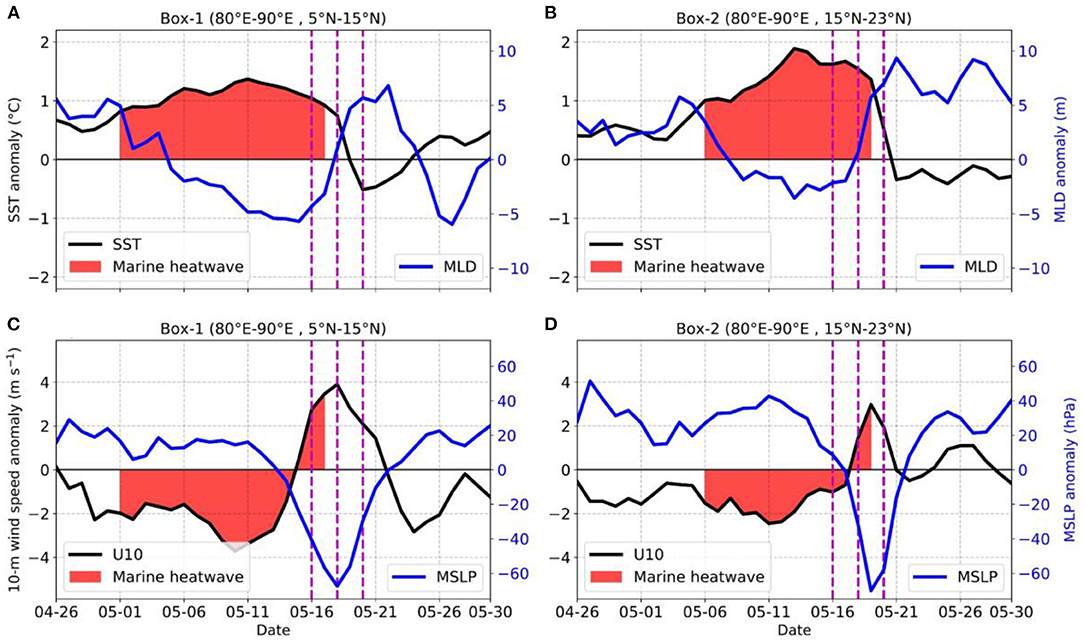
Figure 2. Time series of the sea surface temperature anomaly (black, °C) and mixed layer depth anomaly (blue, m) for (A) box 1, (B) box 2. Time series of 10 m surface wind anomaly (black, m s−1) and mean sea-level pressure anomaly (blue, hPa) for (C) box 1 (D) box 2 for the duration of 26-April-2020 to 30-May-2020 with the red shading representing marine heatwave conditions and the vertical magenta lines representing cyclogenesis (left, 16-May-2020), cyclone intensification (middle, 18-May-2020) and landfall (right, 20-May-2020) for the tropical cyclone Amphan.
MHW conditions in both boxes occurred prior to cyclogenesis. During the MHW, the maximum SST anomaly averaged over box 1 on 11-May-2020 and in box 2 on 13-May-2020 reached close to 1.5 and 2°C (Figures 2A,B) above the climatological SST of 30.2 and 29.7°C, respectively, for the same period of the year (Figures 1B,C). The high SST was associated with an anomalously shallow MLD (Figures 2A,B). This shoaling of the MLD during MHW signified a reduction in mixing and therefore enhanced stratification with a concurrent positive mean sea level pressure (MSLP) anomaly over both boxes and anomalously low wind speeds (Figures 2C,D). The MSLP anomaly was high during the MHW started to drop prior to cyclogenesis, and reached a minimum value close to −65 hPa during the peak of the tropical cyclone. These pre-existing oceanic and atmospheric conditions of anomalously high SST with shallow MLD, and low wind speeds not only favored sustaining the MHW but may have played a role in the cyclogenesis as well.
Tropical cyclone Amphan started to develop from 16-May-2020, marked as the day of cyclogenesis in box 1, and made landfall in box 2 on 20-May-2020. The pre-existing MHW in box 1 coincided with the cyclogenesis whereas, the MHW in box 2 exists till the later stages of cyclone intensification (Figure 2). As the cyclone intensified, the SST anomaly decreased and the MHW eventually disappeared with negative SST and positive MLD anomalies in both boxes (Figures 2A,B). The demise of the MHW i.e., the negative SST anomaly after the passage of the cyclone, was due to the strong wind-induced churning that deepened the mixed layer and upwelled cold water from deeper depths resulting in the cooling of the surface ocean.
Further analysis (Figure 3) shows the ocean area covered by various categories of MHW in the BoB before (averaged over 11–15 May), during (averaged over 16–20 May), and after (averaged over 21–25 May) tropical cyclone Amphan. Prior to cyclogenesis, on 13-May-2020, around 300,000 km2 of the ocean surface area in the bay exhibited strong MHW conditions. However, with the intense forcing of the cyclone which resulted in surface ocean cooling, a rapid contraction was observed in the surface area covered by the strong MHW which reduced to ~160,000 km2 on 18-May-2020, and finally demised on 20-May-2020 (Figure 3A). Before tropical cyclone Amphan, all the regions of the bay were affected by moderate to strong MHW conditions, particularly box 1 and box 2 had patches of strong MHW conditions. The track of tropical cyclone Amphan coincided with a large region exhibiting strong MHW conditions which were present before and during the cyclone (Figure 3B) and resulted in the rapid intensification of the cyclone (Figure 3C).
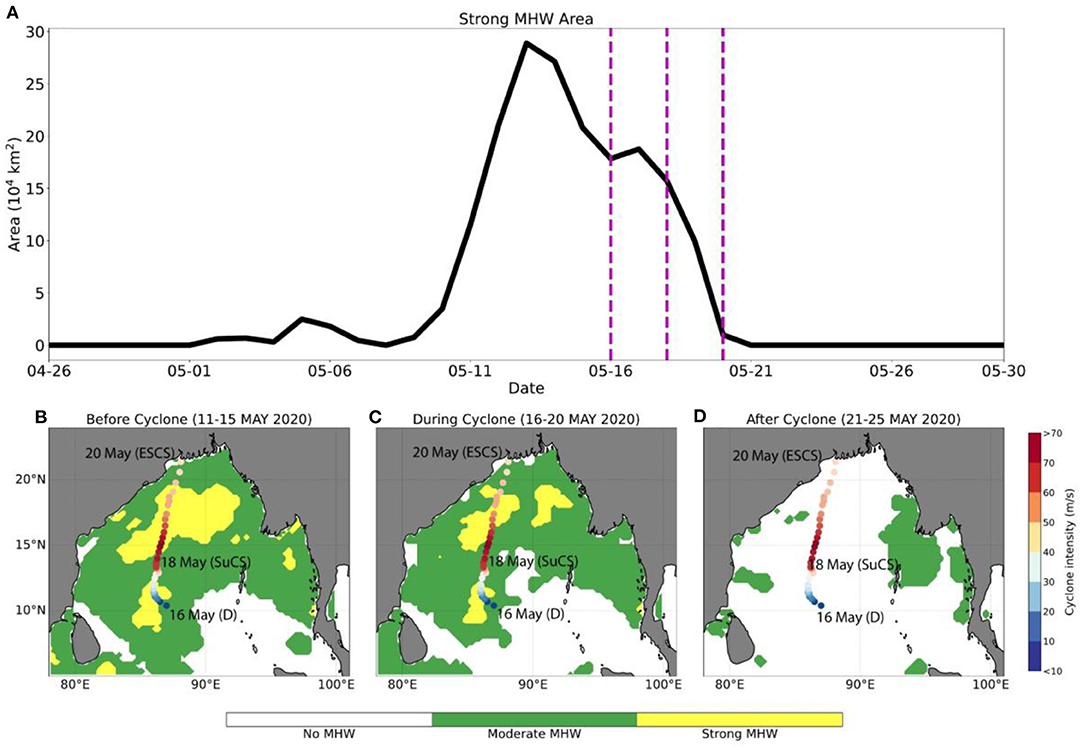
Figure 3. (A) Ocean surface area of the Bay of Bengal covered by strong marine heatwave conditions with vertical magenta lines representing cyclogenesis (left), cyclone intensification (middle) and landfall (right) for tropical cyclone Amphan, (B–D) categories of marine heatwave over the Bay of Bengal before the tropical cyclone Amphan (averaged over 11–15 May 2020), during the cyclone (averaged over 16–20 May 2020) and after the cyclone (averaged over 21–25 May 2020) overlaid by the track of the cyclone which is shaded by the mean daily intensity of the cyclone (m s−1) with the date of cyclogenesis (CS, 16-May-2020), date of super cyclonic storm (SuCS, 18-May-2020) and landfall as extremely severe cyclonic storm (ESCS 20-May-2020).
Table 1 shows the progression of the intensity of the MHW and tropical cyclone in the BoB in box 1 and box 2. As the MHW in box 1 coincided with cyclogenesis, the intensity of the MHW decreased, and as the cyclone intensified into a super cyclone, eventually the MHW in box 1 disappeared (negative MHW intensity) due to wind-induced SST cooling from the cyclone intensification. After the cyclogenesis in box 1, as the cyclone moved into box 2, it coincided with the presence of strong MHW conditions which provided additional energy for its rapid intensification to a super cyclone. When the cyclone reached its peak intensity (62.05 m s−1) on 18-May-2020, the intensity of the MHW was 1.54°C which was sufficiently high to sustain the intensification of the cyclone. This shows a widespread exposure of the ocean surface to extreme temperature conditions which can potentially alter the dynamics and thermodynamics of a tropical cyclone.
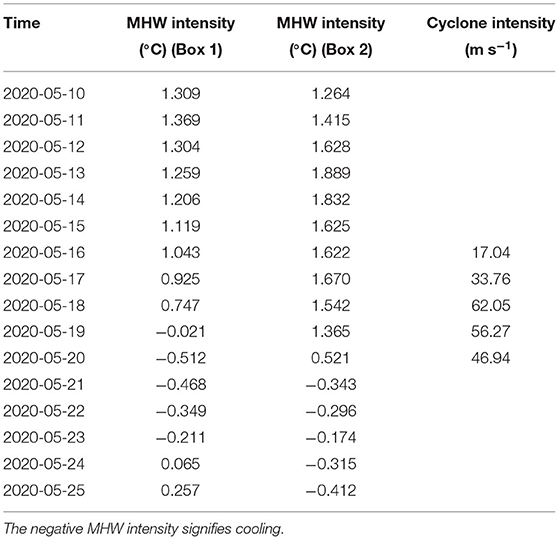
Table 1. Daily mean Intensity of the marine heatwave (°C) and cyclone (m s−1) averaged over box 1 and box 2 from 10 to 25 May 2020.
These analyses show a dynamic link between the MHW and tropical cyclone and provide an understanding of their interactions. The pre-conditioning from the warm ocean surface due to the MHW helped intensification of the cyclone to a super cyclonic storm in just 24 h. The ensuing analysis of the mixed layer heat budget will show the thermodynamic linkages between the MHW and tropical cyclone.
To investigate the physical mechanism of the interaction between the tropical cyclone and MHW, we conducted a mixed layer heat budget analysis. It shows that the mixed layer temperature tendency during the MHW was weakly influenced by the advection in both boxes (Figures 4A,B). Most of the temperature tendency can be explained by changes in the net surface heat flux (QNet). During the MHW, the positive QNet anomaly warmed the surface layer that resulted in stratification as the QNet was directed toward the ocean (positive downwards).
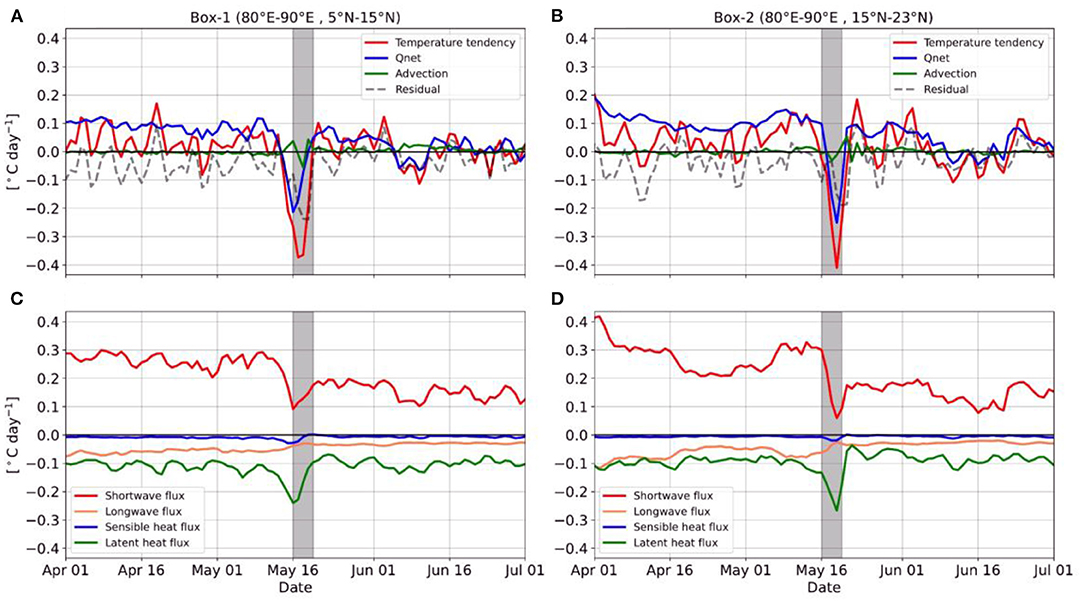
Figure 4. Time series of the mixed layer depth temperature tendency (red, °C day−1), net surface heat flux (blue, °C day−1), advection (green, °C day−1), and residual (gray dash, °C day−1) for (A) box 1, (B) box 2. Time series of net surface shortwave radiation (red, °C day−1), net surface longwave radiation (green, °C day−1), surface sensible heat flux (blue, °C day−1), surface latent heat flux (yellow, °C day−1) for (C) box 1 (D) box 2. The gray shading represents the duration of the tropical cyclone Amphan.
Despite the dominance of the net surface heat flux in the growth of SST anomalies, Alexander and Penland (1996) previously showed that vertical entrainment of water from the base of the mixed layer strongly influences SST anomalies and the upper ocean heat budget by controlling the MLD. However, the changes in the surface heat fluxes from MLD variability during the MHW require a detailed mixed layer heat budget analysis with the resolution of vertical advection, vertical mixing, and entrainment from the base of the mixed layer (Vijith et al., 2020; Sen et al., 2021). We also note the magnitude of the residuals, likely due to biases in surface fluxes in the reanalysis products (Wijesekera et al., 2022) and, in parts, related to changes in horizontal and vertical mixing and entrainment (Sen Gupta et al., 2020; Vijith et al., 2020).
The positive contribution from the QNet toward the mixed layer temperature tendency during the MHW turned negative during the passage of the tropical cyclone. The temperature tendency dropped to −0.4°C day−1 during the cyclone, primarily due to a net heat flux loss. This strong drop (~0.4°C day−1) in the temperature tendency during the intensification of the cyclone shows the cooling of the surface ocean with intense heat loss from the ocean to the atmosphere (negative QNet).
Further analysis of the component of the QNet i.e., Qswf, Qlwf, Qshf, and Qlhf is shown in Figures 4C,D. Fluxes were converted into temperature tendency i.e., dividing by ρCph where h is the MLD. The net surface heat flux was primarily driven by the increased net surface shortwave flux (Qswf) followed by the surface latent heat flux (Qlhf) and net surface longwave flux (Qlwf); and surface sensible heat flux (Qshf) is least.
During the MHW event (since 1-May-2020, in both boxes), the major contribution in the QNet was from Qswfwhich showed a positive change of ~0.1°C day−1 prior to cyclogenesis. This condition of Qswf suggests a clear-sky condition with increased net solar radiation, which warmed the ocean surface to generate a MHW event in the region. This increased positive Qswf during the MHW event is also related to anomalously high MSLP (Figures 2C,D) which results in reduced cloud cover (Holbrook et al., 2019; Sen Gupta et al., 2020). The large positive value of Qswf and the large negative values of Qlhf followed by the Qlwf effectively resulted in a positive QNet into the ocean. The negative value of Qlhf in the BoB shows that the ocean loses heat to the atmosphere in response to the increased SST in the region and this phenomenon will maintain the SST (Zhang and McPhaden, 1995). Zhang and McPhaden (1995) also showed that for low SST conditions Qlhf increases with SST but decreases for the high SST conditions. The later condition is reflected in our analysis that shows a drop in Qlhf during the MHW (from 1-May-2020) i.e., a high SST condition prior to the cyclone.
However, during the cyclogenesis and the intensification phase of the cyclone, the Qswf and Qlhf showed a large drop in magnitude amounting to 0.2°C day−1 from 0.3 to 0.1°C day−1 and 0.1°C day−1 from −0.1 to −0.2°C day−1, respectively in both boxes. This anomalous dip in Qswf suggests the overcast conditions during the cyclone which obstructed incoming solar radiation due to increased cloud cover because of the cyclone, whereas the drop in Qlhf shows a significant heat loss from the ocean to the atmosphere during the cyclone.
Given the surface warming with the shoaling of the MLD, it is worth investigating the role of upper-ocean stratification in the interaction of the MHW and tropical cyclone. To understand the role of stratification cross-track analysis around the cyclone track was conducted for MLD, SST anomaly, sea surface salinity (SSS) anomaly, and freshwater content (FW).
In order to perform this analysis, the location (latitude and longitude) corresponding to the track of the cyclone were selected. Conditions along the track were averaged for 3 degree (~300 km) on either side of the cyclone track (Figure 5). On the Y-axis, zero hence represents the location/center of the cyclone. The analysis was conducted for various parameters for the time starting 10-days prior to the cyclone until 15-days after the cyclone, i.e., for a total of 25 days for the same location (latitude, longitude). This time period is shown in the X-axis where zero represents the day of the cyclone and it shows the variations of the parameters over the 25-days. Similarly, we repeat this procedure for all the latitude points along the cyclone track and then average all these latitudes to generate the composite maps of the parameters in longitudinal distance from the center of the cyclone and their time evolution as shown in Figure 5.
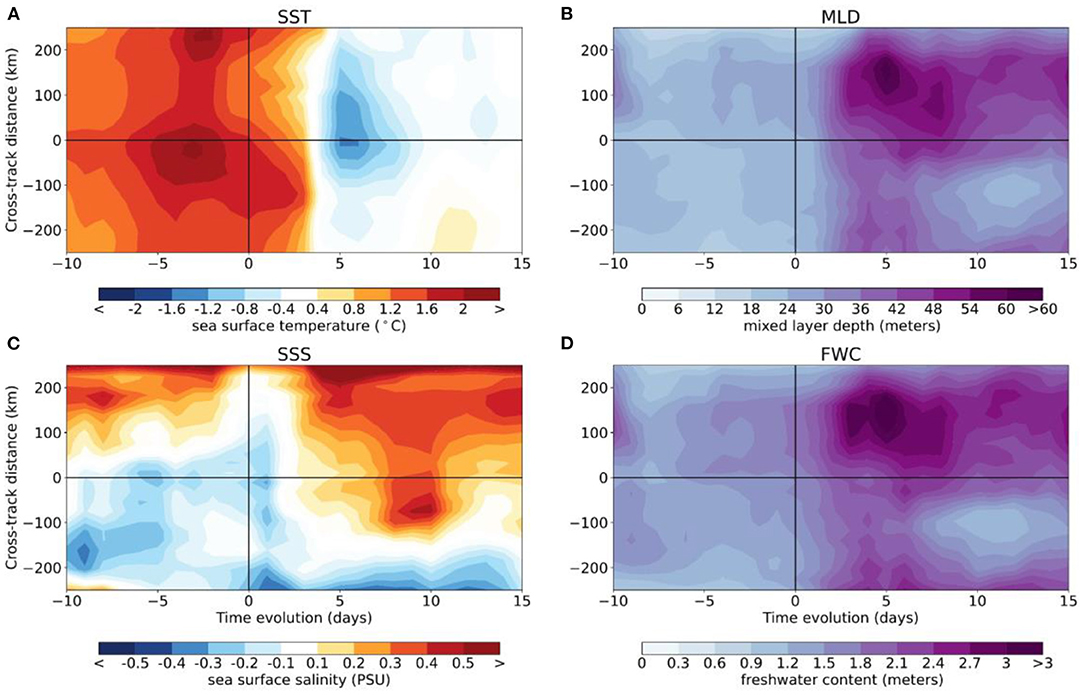
Figure 5. Time evolution of cross cyclone track distribution of (A) sea surface temperature anomaly (°C), (B) mixed layer depth (m), (C) sea surface salinity anomaly (psu), and (D) freshwater content (m). Here negative (positive) y-axis represents left (right) side of the cyclone track, and negative (positive) x-axis represents days before (after) the cyclogenesis.
The SST anomaly (Figure 5A) corroborates the findings from the previous sections and shows the presence of strong MHW conditions before the cyclone and strong cooling after the passage of the cyclone. Figure 5B shows that the MLD was shallow just before the cyclone and deepened after the passage of the cyclone. The SSS anomaly (Figure 5C) was negative before the cyclone but shifted to an anomalously positive value after the cyclone.
This phenomenon is consistent with Reul et al. (2021) where weak storms caused freshening on average, but a strong storm increased the SSS on the right side of the track which is opposite to the SST anomaly that is always negative with muted surface cooling. The formation of a vertical salinity gradient in the upper ocean from a fresher surface and saltier subsurface along with the presence of barrier layers lead to saltier and warmer storm wakes compared to wakes produced over barrier layer free areas (Reul et al., 2021). Interestingly the freshwater content (Figure 5D) was not the primary driver for the MHW event prior to the cyclone. The freshwater content was relatively low during the MHW and prior to the cyclone but increased during the cyclone due to heavy precipitation.
Further analysis of stratification was carried out by computing the Brunt–Väisälä frequency (N2) for the upper 100 m of the ocean for box 1 and box 2 from 26-Apr-2020 to 30-May-2020 (Figure 6). This analysis showed that during the MHW, an anomalously strong stratification was present in the upper 30 m of the ocean in box 1, whereas in box 2 the complete water column (i.e., up to a depth of 100 m) was highly stratified. Box 1 exhibited high stratification with shallow MLD in the presence of the MHW, whereas the stratification with shallow MLD in box 2 with the presence of MHW continued until the intensification of the cyclone (Figures 6A,B). As the cyclone intensified and approached landfall, it disrupted the MHW and broke down the stratification with the deepening of the MLD due to churning from the strong winds.
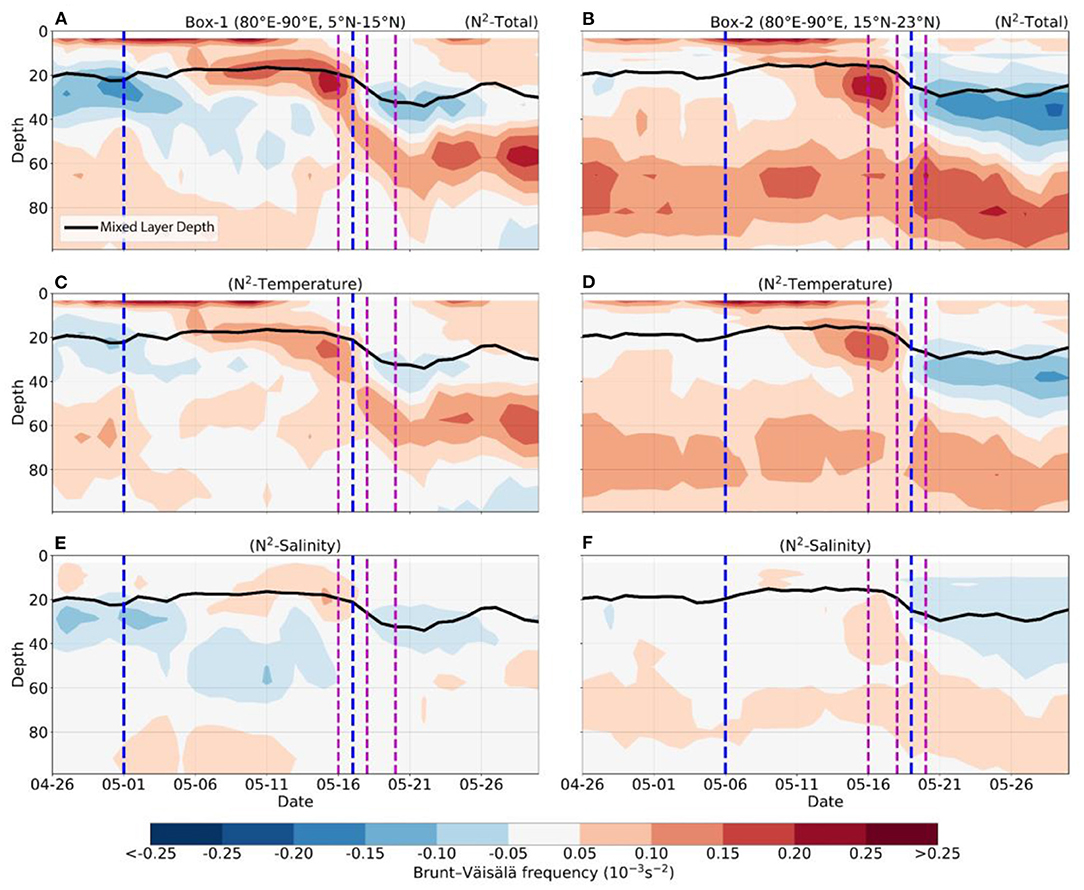
Figure 6. Brunt–Väisälä frequency anomaly (N2, s−2) for the upper 100 m of the ocean for (A) box 1, (B) box 2, N2 contributed from the temperature (N2-Temperature) for (C) box 1 and (D) box 2, N2 contributed from the salinity (N2-Salinity) for (E) box 1 and (F) box 2 for the duration of 26-April-2020 to 30-May-2020 with mixed layer depth (black), vertical blue lines represent marine heatwave duration and vertical magenta lines representing cyclogenesis (left, 16-May-2020), cyclone intensification (middle, 18-May-2020) and landfall (right, 20-May-2020) for the tropical cyclone Amphan.
An important aspect of the MHW in the BoB during 2020 was that it was generated by temperature stratification rather than salinity stratification, as freshwater content was anomalously low during the MHW prior to the cyclone (Figures 6C–F). The stratification of the water column was primarily governed by temperature (Figures 6C,D) as compared to salinity (Figures 6E,F). This suggests that the lower freshwater content due to low river discharge and less precipitation in the BoB during the pre-monsoon period (March-April-May), had little effect on the generation of the MHW, whereas the ocean temperature was found to play an important role.
Apart from the surface ocean, the subsurface ocean also contributed to the interaction between the MHW and tropical cyclone. The role of subsurface warming in terms of TCHP is shown in Figure 7. The build-up of TCHP since March 2020 can be seen for both boxes and this increased TCHP (also considered as ocean heat content) acts as preconditioning to sustain the MHW and tropical cyclone. Previous studies showed that subsurface ocean warming can play a key role in the generation of MHWs (Elzahaby and Schaeffer, 2019; Scannell et al., 2020) as well as tropical cyclones (Jangir et al., 2020, 2021).
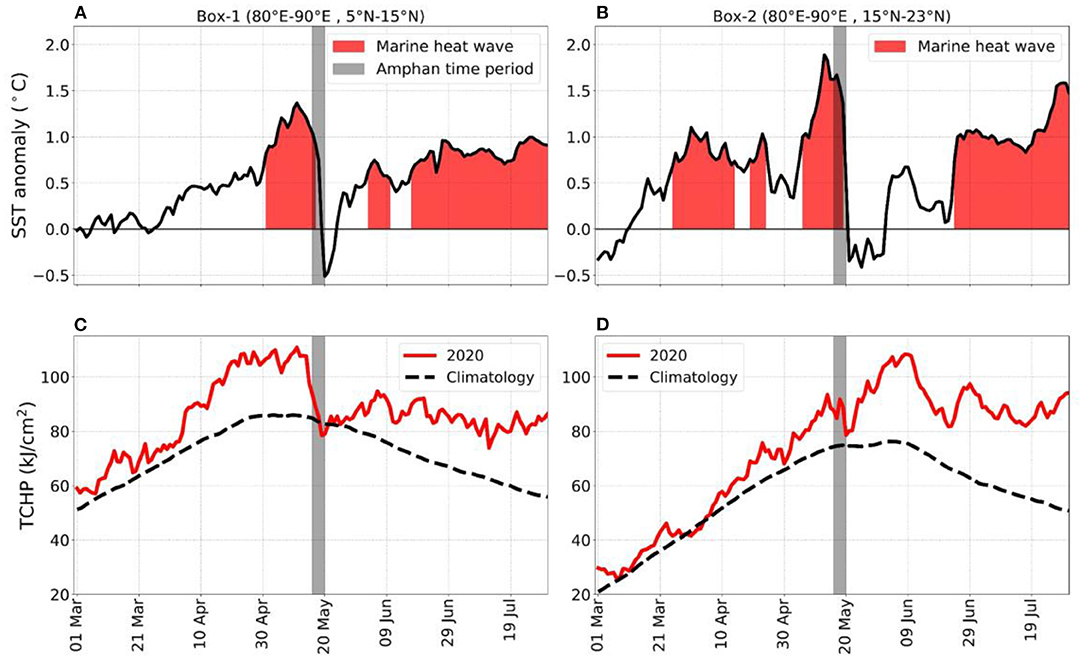
Figure 7. (A,B) Time series of sea surface temperature anomaly (black, °C), (C,D) tropical cyclone heat potential (red, kJ cm−2) for box 1 (left column) and box 2 (right column), for the duration of 26-April-2020 to 31-July-2020 with the red shading representing marine heatwave conditions, daily climatology for (C) sea surface temperature and (D) tropical cyclone heat potential (black), and vertical gray shading representing the duration of tropical cyclone Amphan.
During the cyclogenesis and intensification of the cyclone, the ocean supplies the energy, i.e., the TCHP of the ocean decreases with the evolution of the tropical cyclone. The warm subsurface of high TCHP limits the cyclone's self-induced negative feedback from ocean cooling to favor intensification (Lin et al., 2013; Jangir et al., 2021). This decrease in TCHP is clearly shown in Figures 7C,D with a large drop in Box 1 which encompasses the cyclogenesis and intensification of the cyclone as compared to Box 2 which includes landfall.
TCHP of Box 1 started to drop from the point of cyclogenesis, with a maximum drop of ~20 kJ cm−2 during the intensification till the landfall of the cyclone, and thereafter the TCHP was maintained at a fixed level (Figure 7C). In contrast, the TCHP of Box 2 shows a weak initial drop, recovered quickly afterward, and gained ~25 kJ cm−2, but dropped again by the same amount and was maintained thereafter at a fixed level.
The subsequent period of subsurface warming coincided with the re-emergence of the MHW. This suggests that the energy accumulated by the subsurface ocean not only facilitates and sustains the MHW but also played an important role in the cyclogenesis and intensification of the cyclone. However, the exact mechanism for the re-emergence of the MHW after the tropical cyclone warrants a detailed investigation, and is beyond the scope of this study.
Our analyses show that reduced mixing, increased net heat flux into the ocean, temperature-driven stratification and subsurface warming were all important factors in the generation of this compound extreme event of a MHW and tropical cyclone in the BoB during 2020. Further, as the cyclone intensified, the cyclone-induced cooling in the BoB resulted in the dissipation of the MHW.
MHWs are of growing concern for the global community because of their serious implications for marine ecosystems (Holbrook et al., 2020), and their interactions with other extreme events (Dzwonkowski et al., 2020). In this study, we documented MHW conditions in the BoB during the year 2020 that coincided with the tropical super cyclone “Amphan”. We further explored the interaction between the tropical cyclone and the MHW event.
MHW generation before the onset of the tropical cyclone was due to anomalously high SST with an anomalous shoaling of the MLD and increased solar insolation onto the ocean surface (Figures 2, 4, 5A,B). The shoaling of the MLD was associated with reduced wind-driven mixing due to reduced wind speed, resulting in an anomalously high thermal stratification in the bay (Figures 2C,D, 5B, 6).
The mixed layer heat budget analysis (Figures 4A,B) showed that the temperature tendency during the MHW event was primarily governed by net surface heat flux (Qnet). Further, the increased net surface shortwave flux (Qswf) was the primary driver of the positive Qnet. The rise in TCHP (Figures 7C,D) suggests that the warming of the subsurface ocean also played an important role in sustaining the MHW and provided the heat potential for cyclogenesis as well as intensification.
As the cyclone intensified, the MHW started to fade due to intense surface cooling and the break-down of the stratification resulted in a deepened MLD (Figures 2A,B, 5B, 6). During the passage of the cyclone, the intense mixing with reduced solar insolation due to increased cloud cover and increased heat loss from the ocean to the atmosphere (Qswf and Qlhf) cooled the SST and resulted in the demise of the MHW (Figure 2). Our study also showed that the compound event of the MHW and tropical cyclone is primarily governed by temperature stratification rather than salinity stratification (Figures 5D, 6).
The daily mean intensity of the MHW and tropical cyclone Amphan (Table 1) shows that the intensity of the MHW was initially very high, but started to decrease when approaching cyclogenesis. However, in the northern bay (box 2), strong MHW conditions were present during the first 3 days of the cyclone that provided the additional energy to the cyclone and helped it intensify quickly and attain its maximum intensity (62.05 ms−1) of a super cyclone. This suggests that the presence of the MHW had a profound impact on the intensification of the cyclone.
The pre-existing strong MHW conditions prior to the genesis of tropical cyclone Amphan and its coincidence with the cyclone track are strong evidence for the interaction between two extreme events (Figure 3). Figure 3 shows a large part of the BoB (~300,000 km2) was covered by the MHW and some parts of the BoB especially the ocean area close to the track of the cyclone, exhibited strong MHW conditions. Also, the intensification stage of the cyclone coincided closely with the region of strong MHW in box 2. Further discussion is focused on the rapid intensification of the tropical cyclone Amphan.
Tropical cyclone Amphan was the first cyclone that intensified to a super cyclone in the pre-monsoon season (MAM) in the twenty-first century (Sil et al., 2021) in the BoB. This study investigates why tropical cyclone Amphan rapidly intensified to a super cyclone (category 5) from a cyclonic storm (category 1) over such a short period of time. Such rapid intensification is unusual for short-lived cyclone Amphan as compared to a long-lived cyclone e.g., tropical cyclone Fani which formed during the same season in 2019 and traveled along the same region in the BoB. Tropical cyclone Fani intensified to an extremely severe cyclonic storm (category 4) with the wind speed increasing from 55 to 90 knots in 24h, whereas Amphan rapidly intensified to a super cyclone (category 5) with the wind speed increasing from 55 to 120 knots in 24 h (Sil et al., 2021).
In comparison to Amphan (life span of 5 days over the ocean, 16–20 May 2020), the extremely severe tropical cyclone Fani which formed during the same season in 2019 (April 26 to May 5) remained for 7 days after its formation. This longer time span of tropical cyclone Fani over the ocean provided potentially more moisture input along its longer trajectory (Kumar et al., 2020). Despite remaining over the ocean for longer time, Fani did not turn into a super cyclone as Amphan did in a very short span of time.
We compared the background vertical wind shear during both cyclones. We note that the background vertical wind shear is not the only important factor impacting cyclogenesis and intensification, but it exhibits favorable atmospheric conditions for the cyclogenesis as well as intensification. Prior to the cyclogenesis of Amphan (Figure 8A), vertical wind shear was relatively lower than for Fani (Figure 8D) at the genesis location. However, with the intensification of Amphan (Figure 8B) the wind shear also increased as compared to Fani (Figure 8E). During cyclone Fani, the background vertical wind shear was relatively low as compared to Amphan (Figure 8B), which may have helped in providing conditions conducive for the intensification of cyclone Fani (Figure 8E). In contrast, despite, relatively high vertical wind shear, cyclone Amphan intensified to a super cyclone in a very short time span. This suggests that factors other than vertical wind shear played a substantial role in the intensification of the super cyclone Amphan.
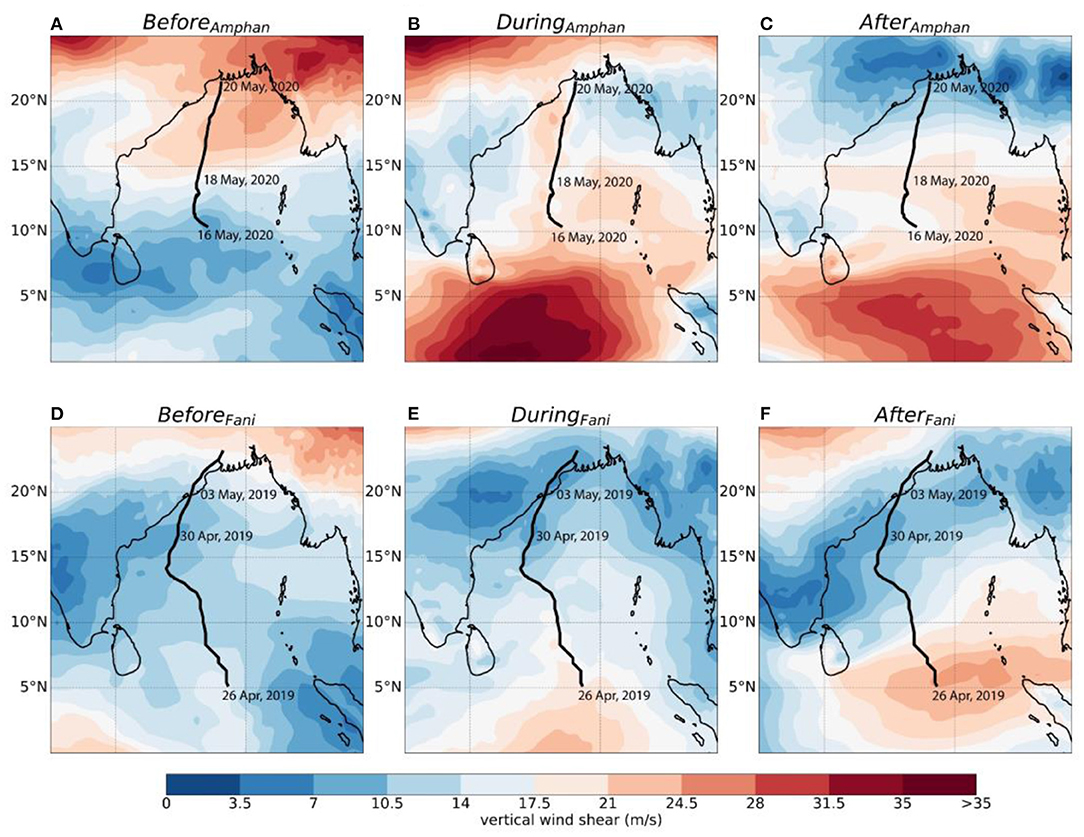
Figure 8. Five days averaged vertical wind shear (m s−1) (A) before Amphan (B) during Amphan (C) after Amphan. (D–F) same as (A–C) but for the cyclone fani. Dates in (A–C) representing cyclogenesis (16-May-2020), intensification (18-May-2020) and landfall (20-May-2020) during Amphan, and dates in (E-F) representing cyclogenesis (26-Apr-2019), intensification (30-Apr-2019), and landfall (3-May-2019) during Fani.
To understand the reasons behind the rapid intensification of cyclone Amphan, we detected the presence of strong MHW before and during the development of the phase of the cyclone as shown in Figure 3, which was not present during cyclone Fani (Figure 9). We found the presence of only a moderate MHW all over the bay before (13-17 April 2019) the genesis of Fani but no strong MHW was found before and during tropical cyclone Fani (Figure 9). In contrast, a strong MHW persisted in the bay during tropical cyclone Amphan (Figure 3). This strong MHW (1120 May 2020) coincided with tropical cyclone Amphan and helped in its rapid intensification into a super cyclone. After the landfall of the cyclone Amphan and Fani the vertical wind shear shows near similar pattern (Figures 8C,F).
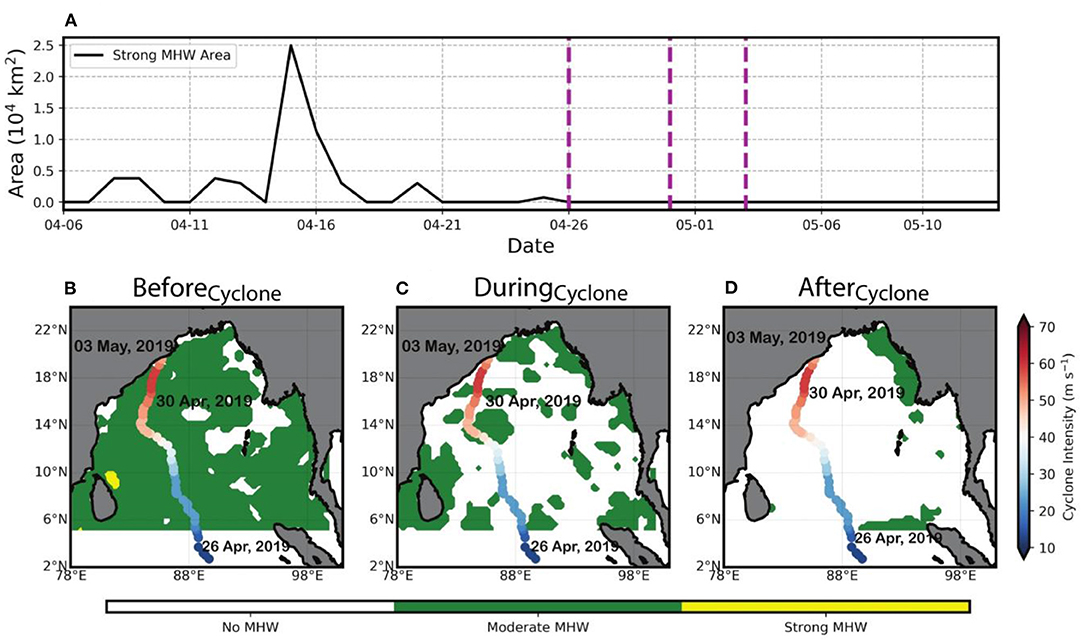
Figure 9. (A) Ocean surface area of the Bay of Bengal covered by strong marine heatwave conditions with vertical magenta lines representing cyclogenesis (left, 26-Apr-2019), cyclone intensification (middle, 30-Apr-2019) and landfall (right, 3-May-2019) for the tropical cyclone Fani, (B–D) categories of marine heatwave over the Bay of Bengal before the tropical cyclone Fani (averaged over 22–25 Apr 2019), during the cyclone (averaged over 26 Apr-3 May 2019) and after the cyclone (averaged over 4–8 May 2019) overlaid by the track of the cyclone which is shaded by its mean daily intensity (m s−1) with the date of genesis (26-Apr-2019), date of extremely severe cyclonic storm (30-Apr-2019) and landfall (3-May-2019) as extremely severe.
The basin-wide effects of the compound event of MHW and tropical cyclone are seen in Figure 10 with the presence of strong MHW conditions in the BoB prior to cyclogenesis with SST anomalies of > 2.5°C and at some locations in the BoB acted as a guiding path for the movement of the cyclone later. After the cyclogenesis, the cyclone moved in the direction of the strong MHW and intensified along the way. During the passage of the cyclone, the SST in the BoB started to cool due to wind-induced intense mixing (Figure 10B), which resulted in the disappearance of the MHW (Figure 10C).
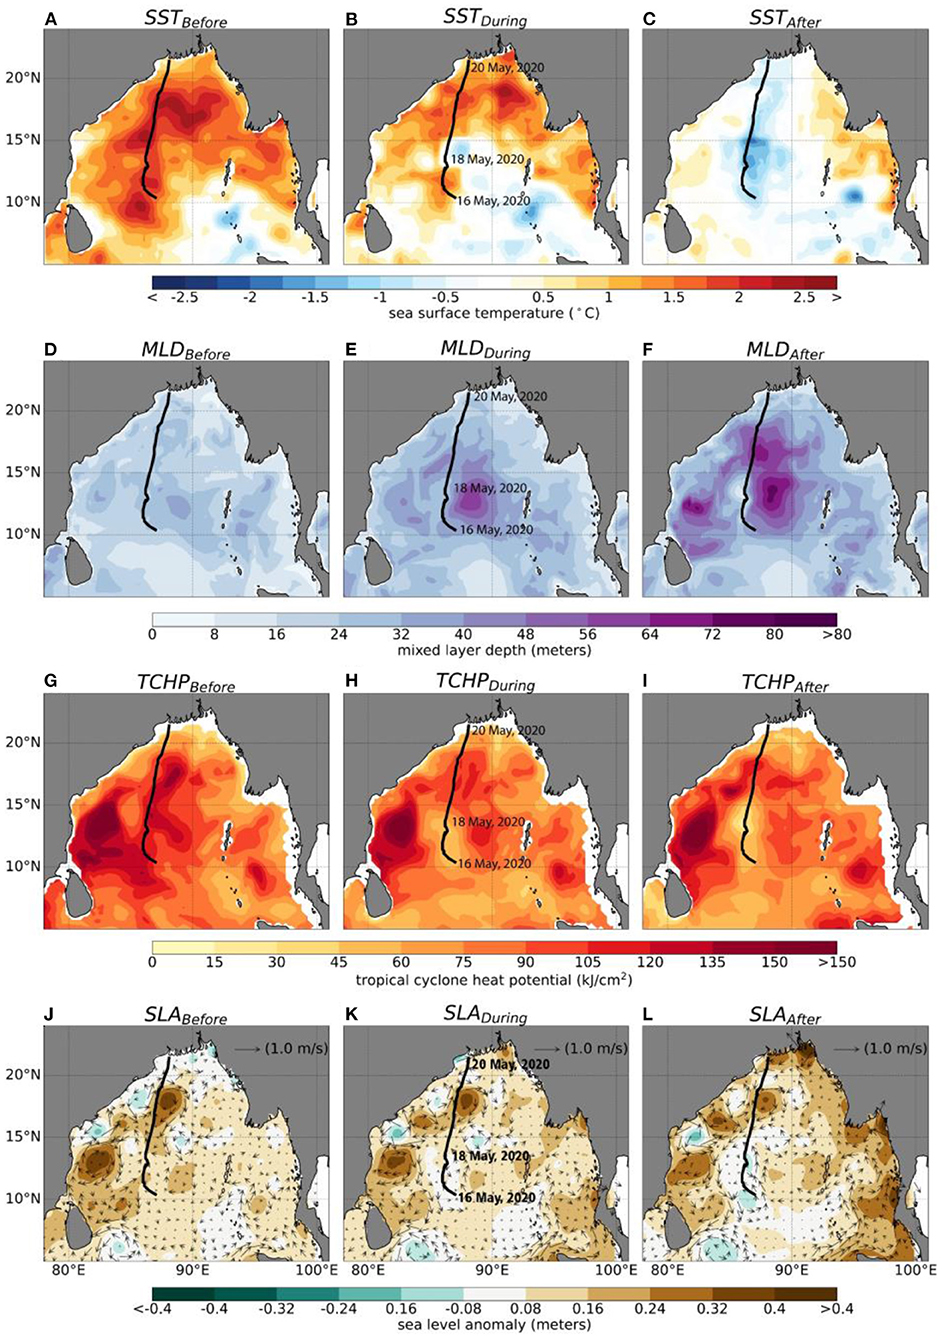
Figure 10. Five days averaged basin-wide features of (A–C) Sea surface temperature anomaly (°C), (D–F) mixed layer depth (M), (G–I) tropical cyclone heat potential (kJ cm−2), (J–L) sea-level anomaly (m) overlaid by the geostrophic current vectors (m s−1) before cyclone (first column), during cyclone (second column), and after cyclone (third column). The black line represents the track of the tropical cyclone Amphan. Dates representing cyclogenesis (16-May-2020), intensification (18-May-2020) and landfall (20-May-2020).
During this whole process, the presence of a shallow MLD prior to the cyclogenesis (Figure 10D) helped in sustaining the MHW through reduced mixing and enhanced stratification. However, as the cyclone intensified the MLD deepened on the right-hand side of the cyclone (Figure 10E) and continued to deepen further as the cyclone approached landfall (Figure 10F). This deepening of the MLD facilitated the dissipation of heat from the surface by increased mixing and upwelling of the relatively cold subsurface water to the ocean surface.
Apart from the surface ocean, the subsurface ocean also played an important role in the generation of the MHW and tropical cyclone. The warm subsurface is shown by high TCHP (135–150 kJ cm−2) prior to the cyclone (Figure 10G). The warm subsurface conditions can also intensify the tropical cyclone by inhibiting the cyclone-induced SST cooling (negative tropical cyclone intensity feedback). Due to the warm subsurface, there is more air-sea enthalpy flux available for the rapid intensification of the tropical cyclone, as suggested by the case study of cyclone Nargis (Lin et al., 2009, 2013; Yu and McPhaden, 2011). However, with the intensification of the cyclone, the subsurface warming reduced along the track of the cyclone (45–105 kJ cm−2) which suggests the breakdown of the stratification with the cyclone-induced churning of the ocean (Figures 10H,I).
We have shown that the intensification of the cyclone was primarily due to the MHW, but anomalously high SLA and anticyclonic eddies (Figures 10J–L) along the track may also have partly contributed to the intensification of the cyclone via the convergence of warm SST anomalies. Jangir et al. (2021) showed that the anticyclonic (warm core) eddies are mostly present in the bay during the pre-monsoon season (March-May) and can play an important role in the cyclone intensification in cases where they coincide with the cyclone track.
Apart from this, Elzahaby and Schaeffer (2019) show that the high SLA and anticyclonic eddies also generate high subsurface temperature anomalies by carrying warm waters and resulting in a deeper MHW. The detailed investigation of the role of SLA and mesoscale eddies on the characteristics of the MHW and tropical cyclone is, however, beyond the scope of the present study.
We also noticed the re-emergence of MHW conditions after 15 days post-landfall of the cyclone (from 5-June-2020) in box 1 and after 35 days (from 25-June-2020) in box 2 (Figure 7). After the first interaction of the MHW with the tropical cyclone, both SST and TCHP dropped (refer to Figures 2, 3, 5A, 7). However, several days after the tropical cyclone, SST started to rise rapidly in both boxes and crossed the threshold to resume MHW conditions (Figures 7A,B), whereas the rise in TCHP is more pronounced in Box 2 (Figure 7D) than in Box 1 (Figure 7C). After a drop of ~20 kJ cm−2 in TCHP of Box 1 during the intensification till the landfall of the cyclone, TCHP was maintained at a fixed level till the re-emergence of the MHW conditions (Figure 7C). In contrast, after a moderate drop in the TCHP of Box 2, it recovered quickly by ~25 kJ cm−2, dropped again by the same amount, and thereafter was maintained at a fixed level. This sustained TCHP between the landfall of the cyclone and the re-emergence of the MHW shows the redistribution of heat within the water column.
This re-emergence of the MHW conditions might be also due to the intense mixing from the cyclone that broke the stratification and homogenized the temperature in the water column (Dzwonkowski et al., 2020). This well-mixed condition quickly re-stratified the ocean and resulted in MHW conditions with a rapid rise in surface temperature. However, this re-emergence of the MHW warrants a detailed investigation of the ocean and atmospheric conditions, e.g., the post-cyclone changes in the air-sea heat flux.
In our study, we did not consider factors of large-scale variability, but previous studies have shown the role of the Madden Julian Oscillation, coupled with a downwelling Kelvin wave in the genesis of tropical cyclone Amphan (Roman-Stork and Subrahmanyam, 2020; Vissa et al., 2021). However, they did not focus on the importance of these large-scale features for the MHW observed during Amphan. Such a study may be a topic for future research to understand the role of large-scale variability in the generation of compound extreme events.
In conclusion, various parameters that link tropical cyclone Amphan with the MHW are shown in Figure 10. The anomalously high SST with a magnitude >2°C before the tropical cyclone represents strong MHW conditions in the bay (Figures 10A–C). This strong MHW also coincided with the cyclone track but dissipated afterward due to cyclone-induced intense mixing and the resulting SST cooling in the bay. The presence of a shallow MLD with QNet into the ocean and high TCHP before cyclogenesis favored a strong MHW event in a highly stratified surface ocean (Figures 2A,B, 4, 6, 10D,G–I). However, the MHW eventually dissipated as the MLD deepened continuously on the right-hand side of the cyclone track as expected during cyclone events (Mao et al., 2000; Reul et al., 2021) with the reduction of TCHP as the cyclone approached intensification and eventually landfall (Figures 2A,B, 7C,D, 10E–I). Our study shows that the extreme events in the ocean and atmosphere can mutually interact (e.g., the MHW intensifies the tropical cyclone and the tropical cyclone dissipates the MHW) and together can generate a compound extreme event.
Hence, this study provides an opportunity to understand the interactions between compound extreme events, such as a tropical cyclone and MHW. Several studies have shown that in future warming scenarios, both MHWs and tropical cyclones are projected to increase in frequency and intensity (Knutson et al., 2015; Frölicher et al., 2018; Holbrook et al., 2020; Zhang et al., 2020) which might have implications for the co-occurrence of such compound events. Our study acknowledges that a detailed analysis of the mixed layer heat budget is required by resolving the vertical advection, vertical mixing, and entrainment, and the role of SLA and mesoscale eddies in the MHW and tropical cyclone (Elzahaby and Schaeffer, 2019; Sen Gupta et al., 2020; Jangir et al., 2021). In summary, this study brings a new perspective of understanding the connections between co-occurring events that could potentially improve their forecast and can aid disaster mitigation and planning for socio-economic benefits.
Publicly available datasets were analyzed in this study. This data can be found here: Daily sea surface temperature high-resolution OI SST V2 is obtained from NOAA's physical science laboratory (https://psl.noaa.gov/data/gridded/data.noaa.oisst.v2.highres.html). Ocean temperature, salinity, and mixed layer depth are obtained from the reanalysis product of Copernicus marine service (https://doi.org/10.48670/moi-00024, Reanalysis), the data used for the year 2020 from (https://doi.org/10.48670/moi-00018, Analysis). Atmospheric wind fields and heat fluxes are obtained from (https://www.ecmwf.int/en/forecasts/datasets/reanalysis-datasets/era5). The cyclone track data is from the Indian meteorological department (Best Tracks Data 1982-2021) (http://www.rsmcnewdelhi.imd.gov.in/report.php?internal_menu=MzM=). The daily sea-level anomaly and geostrophic currents data are obtained from (https://doi.org/10.48670/moi-00149).
SR designed the study and wrote the first draft of the manuscript. MM, RG, and SR performed the analysis in discussion with BJ, CU, and MF. All authors discussed the results and jointly contributed to writing the manuscript.
CU acknowledges support from the James E. and Barbara V. Moltz Fellowship for Climate-Related Research and the Independent Research & Development Program at WHOI. MF was supported by the Centre for Southern Hemisphere Oceans Research (CSHOR), which is a joint initiative between the Qingdao National Laboratory for Marine Science and Technology (QNLM), CSIRO, University of New South Wales, and the University of Tasmania.
The authors declare that the research was conducted in the absence of any commercial or financial relationships that could be construed as a potential conflict of interest.
The handling Editor SP-K declared past co-authorship/collaboration (10.1038/S41598-020-75445-3 (2020)) with authors MF and CU.
All claims expressed in this article are solely those of the authors and do not necessarily represent those of their affiliated organizations, or those of the publisher, the editors and the reviewers. Any product that may be evaluated in this article, or claim that may be made by its manufacturer, is not guaranteed or endorsed by the publisher.
SR, MM, and BJ acknowledge the initial discussions of preliminary results with Dr. Dhrubajyoti Samanta from Nanyang Technological University, Singapore. MF acknowledges the support from the Centre for Southern Hemisphere Oceans Research, a joint initiative between the Qingdao National Laboratory for Marine Science and Technology (QNLM), CSIRO, University of New South Wales, and University of Tasmania. RG acknowledges the support of the Australian Research Council Special Research Initiative, Australian Centre for Excellence in Antarctic Science (Project Number SR200100008). The authors also thank the reviewers for their constructive comments for improving the manuscript.
Alexander, M. A., and Penland, C. (1996). Variability in a mixed layer ocean model driven by stochastic atmospheric forcing. J. Clim. 9, 2424–2442. doi: 10.1175/1520-0442(1996)009<2424:VIAMLO>2.0.CO;2
Balasubramanian, S., and Chalamalla, V. K. (2020). Super Cyclone Amphan: A Dynamical Case Study. Available online at: http://arxiv.org/abs/2007.02982 (accessed January 14, 2021).
Collins, M., Sutherland, M., Bouwer, L., Cheong, S.-M., Frölicher, T. L., Jacot Des Combes, H., et al. (2019). Extremes, Abrupt Changes and Managing Risks. IPCC Special Report on the Ocean and Cryosphere in a Changing Climate, 589–655. Available online at: https://report.ipcc.ch/srocc/pdf/SROCC_FinalDraft_Chapter6.pdf
Dzwonkowski, B., Coogan, J., Fournier, S., Lockridge, G., Park, K., and Lee, T. (2020). Compounding impact of severe weather events fuels marine heatwave in the coastal ocean. Nat. Commun. 11, 4623. doi: 10.1038/s41467-020-18339-2
Elzahaby, Y., and Schaeffer, A. (2019). Observational insight into the subsurface anomalies of marine heatwaves. Front. Mar. Sci. 6, 745. doi: 10.3389/fmars.2019.00745
Fan, K., Wang, X., and He, Z. (2020). Control of salinity stratification on recent increase in tropical cyclone intensification rates over the postmonsoon bay of bengal. Environ. Res. Lett. 15, 094028. doi: 10.1088/1748-9326/ab9690
Frölicher, T. L., Fischer, E. M., and Gruber, N. (2018). Marine heatwaves under global warming. Nature 560, 360–364. doi: 10.1038/s41586-018-0383-9
Hersbach, H., Bell, B., Berrisford, P., Hirahara, S., Horányi, A., Muñoz-Sabater, J., et al. (2020). The ERA5 global reanalysis. Q. J. R. Meteorol. Soc. 146, 1999–2049. doi: 10.1002/qj.3803
Hobday, A., Oliver, E., sen Gupta, A., Benthuysen, J., Burrows, M., Donat, M., et al. (2018). Categorizing and naming marine heatwaves. Oceanography 31, 162–173. doi: 10.5670/oceanog.2018.205
Hobday, A. J., Alexander, L. v, Perkins, S. E., Smale, D. A., Straub, S. C., et al. (2016). A hierarchical approach to defining marine heatwaves. Prog. Oceanogr. 141, 227–238. doi: 10.1016/j.pocean.2015.12.014
Holbrook, N. J., Scannell, H. A., sen Gupta, A., Benthuysen, J. A., Feng, M., Oliver, E. C. J., et al. (2019). A global assessment of marine heatwaves and their drivers. Nat. Commun. 10, 2624. doi: 10.1038/s41467-019-10206-z
Holbrook, N. J., Sen Gupta, A., Oliver, E. C. J., Hobday, A. J., Benthuysen, J. A., Scannell, H. A., et al. (2020). Keeping pace with marine heatwaves. Nat. Rev. Earth Environ. 1, 482–493. doi: 10.1038/s43017-020-0068-4
Jana, S., Gangopadhyay, A., and Chakraborty, A. (2015). Impact of seasonal river input on the Bay of Bengal simulation. Cont. Shelf Res. 104, 45–62. doi: 10.1016/j.csr.2015.05.001
Jangir, B., Swain, D., and Ghose, S. K. (2021). Influence of eddies and tropical cyclone heat potential on intensity changes of tropical cyclones in the North Indian Ocean. Adv. Space Res. 68, 773–786. doi: 10.1016/j.asr.2020.01.011
Jangir, B., Swain, D., Ghose, S. K., Goyal, R., and Bhaskar, T. V. S. U. (2020). Inter-comparison of model, satellite and in situ tropical cyclone heat potential in the North Indian Ocean. Nat. Hazards 102, 557–574. doi: 10.1007/s11069-019-03756-4
Knutson, T. R., Sirutis, J. J., Zhao, M., Tuleya, R. E., Bender, M., Vecchi, G. A., et al. (2015). Global projections of intense tropical cyclone activity for the late twenty-first century from dynamical downscaling of CMIP5/RCP4.5 scenarios. J. Clim. 28, 7203–7224. doi: 10.1175/JCLI-D-15-0129.1
Kumar, S., Lal, P., and Kumar, A. (2020). Turbulence of tropical cyclone ‘Fani' in the Bay of Bengal and Indian subcontinent. Nat. Hazards 103, 1613–1622. doi: 10.1007/s11069-020-04033-5
Lea, D. J., Mirouze, I., Martin, M. J., King, R. R., Hines, A., Walters, D., et al. (2015). Assessing a new coupled data assimilation system based on the met office coupled atmosphere-land-ocean-sea ice model. Monthly Weather Rev. 143, 4678–4694. doi: 10.1175/MWR-D-15-0174.1
Lin, I. -I., Chen, C. -H., Pun, I. -F., Liu, W. T., and Wu, C. -C. (2009), Warm ocean anomaly, air sea fluxes, the rapid intensification of tropical cyclone Nargis (2008). Geophys. Res. Lett. 36, L03817. doi: 10.1029/2008GL035815
Lin, I. I., Goni, G. J., Knaff, J. A., Forbes, C., and Ali, M. M. (2013). Ocean heat content for tropical cyclone intensity forecasting and its impact on storm surge. Nat. Hazards 66, 1481–1500. doi: 10.1007/s11069-012-0214-5
Mao, Q., Chang, S. W., and Pfeffer, R. L. (2000). Influence of large-scale initial oceanic mixed layer depth on tropical cyclones*. Monthly Weather Rev. 128, 4058–4070. doi: 10.1175/1520-0493(2000)129<4058:IOLSIO>2.0.CO;2
Mohanty, U. C., Osuri, K. K., Tallapragada, V., Marks, F. D., Pattanayak, S., Mohapatra, M., et al. (2015). A great escape from the Bay of Bengal “Super Sapphire–Phailin” tropical cyclone: a case of improved weather forecast and societal response for disaster mitigation. Earth Interact. 19, 1–11. doi: 10.1175/EI-D-14-0032.1
Neetu, S., Lengaigne, M., Vincent, E. M., Vialard, J., Madec, G., and Samson, G. (2012), Influence of upper-ocean stratification on tropical cyclone-induced surface cooling in the Bay of Bengal. J. Geophys. Res. 117, C12020. 10.1029/2012JC008433.
Oliver, E. C. J., Benthuysen, J. A., Bindoff, N. L., Hobday, A. J., Holbrook, N. J., Mundy, C. N., et al. (2017). The unprecedented 2015/16 Tasman Sea marine heatwave. Nat. Commun. 8, 1–12. doi: 10.1038/ncomms16101
Oliver, E. C. J., Donat, M. G., Burrows, M. T., Moore, P. J., Smale, D. A., Alexander, L., et al. (2018). Longer and more frequent marine heatwaves over the past century. Nat. Commun. 9, 1–12. doi: 10.1038/s41467-018-03732-9
Rahaman, H., Srinivasu, U., Panickal, S., Durgadoo, J. v, Griffies, S. M., et al. (2020). An assessment of the Indian Ocean mean state and seasonal cycle in a suite of interannual CORE-II simulations. Ocean Model. 145, 101503. doi: 10.1016/j.ocemod.2019.101503
Reul, N., Chapron, B., Grodsky, S. A., Guimbard, S., Kudryavtsev, V., Foltz, G. R., et al. (2021). Satellite observations of the sea surface salinity response to tropical cyclones. Geophys. Res. Lett. 48, e2020GL091478. doi: 10.1029/2020GL091478
Reynolds, R. W., Smith, T. M., Liu, C., Chelton, D. B., Casey, K. S., and Schlax, M. G. (2007). Daily high-resolution-blended analyses for sea surface temperature. J. Clim. 20, 5473–5496. doi: 10.1175/2007JCLI1824.1
Roman-Stork, H. L., and Subrahmanyam, B. (2020). The impact of the madden-julian oscillation on cyclone amphan (2020) and southwest monsoon onset. Remot. Sens. 12, 3011. doi: 10.3390/rs12183011
Scannell, H. A., Johnson, G. C., Thompson, L., Lyman, J. M., and Riser, S. C. (2020). Subsurface evolution and persistence of marine heatwaves in the Northeast Pacific. Geophys. Res. Lett. 47, e2020GL090548. doi: 10.1029/2020GL090548
Sen Gupta, A., Thomsen, M., Benthuysen, J. A., Hobday, A. J., Oliver, E., Alxander, L. V., et al. (2020). Drivers and impacts of the most extreme marine heatwave events. Sci. Rep. 10, 19359. doi: 10.1038/s41598-020-75445-3
Sen, R., Francis, P. A., Chakraborty, A., and Effy, J. B. (2021). A numerical study on the mixed layer depth variability and its influence on the sea surface temperature during 2013–2014 in the Bay of Bengal and Equatorial Indian Ocean. Ocean Dyn. 71, 527–543. doi: 10.1007/s10236-021-01452-1
Sengupta, D., Bharath Raj, G. N., Ravichandran, M., Sree Lekha, J., and Papa, F. (2016). Near-surface salinity and stratification in the north Bay of Bengal from moored observations. Geophys. Res. Lett. 43, 4448–4456. doi: 10.1002/2016GL068339
Shenoi, S. S. C. (2002). Differences in heat budgets of the near-surface Arabian Sea and Bay of Bengal: implications for the summer monsoon. J. Geophys. Res. 107, 1–14. doi: 10.1029/2000JC000679
Sil, S., Gangopadhyay, A., Gawarkiewicz, G., and Pramanik, S. (2021). Shifting seasonality of cyclones and western boundary current interactions in Bay of Bengal as observed during Amphan and Fani. Sci. Rep. 11, 22052. doi: 10.1038/s41598-021-01607-6
Smale, D. A., Wernberg, T., Oliver, E. C. J., Thomsen, M., Harvey, B. P., Straub, S. C., et al. (2019). Marine heatwaves threaten global biodiversity and the provision of ecosystem services. Nat. Clim. Chang. 9, 306–312. doi: 10.1038/s41558-019-0412-1
Vijith, V., Vinayachandran, P. N., Webber, B. G. M., Matthews, A. J., George, J. V., Kannaujja, V. K., et al. (2020). Closing the sea surface mixed layer temperature budget from in situ observations alone: Operation Advection during BoBBLE. Sci. Rep. 10, 7062. doi: 10.1038/s41598-020-63320-0
Vissa, N. K., Anandh, P. C., Gulakaram, V. S., and Konda, G. (2021). Role and response of ocean–atmosphere interactions during Amphan (2020) super cyclone. Acta Geophys. 69, 1997–2010. doi: 10.1007/s11600-021-00671-w
Wernberg, T., Bennett, S., Babcock, R. C., de Bettignies, T., Cure, K., Depczynski, M., et al. (2016). Climate-driven regime shift of a temperate marine ecosystem. Science 353, 169–172. doi: 10.1126/science.aad8745
Wernberg, T., Smale, D. A., Tuya, F., Thomsen, M. S., Langlois, T. J., de Bettignies, T., et al. (2013). An extreme climatic event alters marine ecosystem structure in a global biodiversity hotspot. Nat. Clim. Change 3, 78–82. doi: 10.1038/nclimate1627
Wijesekera, H. W., Teague, W. J., Wang, D. W., Hallock, Z. R., Luecke, C. A., Jarosz, E., et al. (2022). Intraseasonal variability of upper-ocean heat fluxes in the central bay of bengal. J. Phys. Oceanograph. 52, 261–288. doi: 10.1175/JPO-D-21-0161.1
World Meteorological Organization (WMO). (2021). State of the Global Climate 2020: Vol. WMO-No. 1264. Geneva: World Meteorological Organization.
Yu, L., and McPhaden, M. J. (2011). Ocean preconditioning of Cyclone Nargis in the Bay of Bengal: interaction between rossby waves, surface fresh waters, and sea surface temperatures. J. Phys. Oceanogr. 41, 1741–1755. doi: 10.1175/2011JPO4437.1
Zhang, G., Murakami, H., Knutson, T. R., Mizuta, R., and Yoshida, K. (2020). Tropical cyclone motion in a changing climate. Sci. Adv. 6, 1–8. doi: 10.1126/sciadv.aaz7610
Keywords: compound extreme events, marine heatwave, tropical cyclone, Amphan, Fani, super cyclone, rapid intensification, extremely severe cyclone
Citation: Rathore S, Goyal R, Jangir B, Ummenhofer CC, Feng M and Mishra M (2022) Interactions Between a Marine Heatwave and Tropical Cyclone Amphan in the Bay of Bengal in 2020. Front. Clim. 4:861477. doi: 10.3389/fclim.2022.861477
Received: 24 January 2022; Accepted: 12 June 2022;
Published: 07 June 2022.
Edited by:
Sarah Elizabeth Perkins-Kirkpatrick, University of New South Wales Canberra, AustraliaReviewed by:
Takahito Kataoka, Japan Agency for Marine-Earth Science and Technology (JAMSTEC), JapanCopyright © 2022 Rathore, Goyal, Jangir, Ummenhofer, Feng and Mishra. This is an open-access article distributed under the terms of the Creative Commons Attribution License (CC BY). The use, distribution or reproduction in other forums is permitted, provided the original author(s) and the copyright owner(s) are credited and that the original publication in this journal is cited, in accordance with accepted academic practice. No use, distribution or reproduction is permitted which does not comply with these terms.
*Correspondence: Saurabh Rathore, c2F1cmFiaC5yYXRob3JlQHV0YXMuZWR1LmF1; c2F1cmFiaC5yYXRob3JlQGxvY2Vhbi5pcHNsLmZy
Disclaimer: All claims expressed in this article are solely those of the authors and do not necessarily represent those of their affiliated organizations, or those of the publisher, the editors and the reviewers. Any product that may be evaluated in this article or claim that may be made by its manufacturer is not guaranteed or endorsed by the publisher.
Research integrity at Frontiers

Learn more about the work of our research integrity team to safeguard the quality of each article we publish.