
95% of researchers rate our articles as excellent or good
Learn more about the work of our research integrity team to safeguard the quality of each article we publish.
Find out more
ORIGINAL RESEARCH article
Front. Clim. , 03 February 2022
Sec. Climate, Ecology and People
Volume 4 - 2022 | https://doi.org/10.3389/fclim.2022.813787
 Hailong Wang1,2*
 Jinghua Zheng1,2
The ability of the atmosphere to remove water from land surface is measured by potential evapotranspiration (ETp), which is often inferred by the reference evapotranspiration (ETo). Therefore, ETp is often considered only influenced by the above-ground meteorological conditions. Based on its concept, ETp should also link with surface conditions that influence the surface resistance. Such linkages differ in dry and wet regions with different surface covers. Here, we calculated ETo and especially analyzed the effects of surface conditions including vegetation cover indicated by NDVI (Normalized Difference Vegetation Index) and root-zone SWC (soil water content) in a humid subtropical province of China. Results show that ETp, NDVI, wind speed, temperatures have increased significantly during 1982–2015 and relative humidity (RH) has decreased significantly. Linear trends of these variables varied across seasons, but similarities were found between spring and winter and between summer and autumn. Summer saw the greatest changes in ETp per unit of environmental variable change. Solar radiation, RH, and precipitation exerted overall stronger influence on ETp (R2 > 0.50) than other factors. NDVI and SWC were found positively and negatively affecting ETp at all time scales. Partial correlation analysis showed significant influence of NDVI and SWC at the monthly scale; moreover, SWC influenced ETp more significantly in summer than other seasons (p < 0.05). Since actual evapotranspiration is often deducted from ETp by multiplicative stress functions in many hydrologic models, understanding the relationships between ETp and environmental changes can help improve the formulation and estimation of actual evapotranspiration.
Potential evapotranspiration (ETp) is defined by many researchers as the water escaping rate from a well-watered vegetated surface (e.g., Xiang et al., 2020). The characteristics of vegetated surface can vary in different definitions, for example, Rosenberg (1974) defined ETp as “the evaporation from an extended surface of a short green crop which fully shades the ground, exerts little or negligible resistance to the flow of water, and is always well supplied with water,” in which the vegetation features are implicit; while Allen et al. (1998) defined a reference grass with a fixed height of 0.12 m, a surface resistance of 70 s m−1, and an albedo of 0.23, and hence their ETp is also known as the reference evapotranspiration (ETo). Therefore, the main difference between ETp and ETo lies in the parameterization of the surface conditions particularly vegetation type and characteristics. By any definitions, ETp measures the ability of the atmosphere to remove water from land surface through evaporation and transpiration (Kirkham, 2014). The two types of evapotranspiration are often considered for practical purposes of water resource management like guiding crop irrigation (Allen et al., 1998; Wen et al., 2016). ETp is an indispensable input variable for many land surface models and hydrologic models to compute ETa and other water budget components (Chen and Dudhia, 2001; Ala-aho et al., 2017), and plays a significant role in assessing regional dry and wet conditions and variations in meteorological conditions (Vicente-Serrano et al., 2010; Beguería et al., 2014; Yang et al., 2019; Zhang and Wang, 2021; Zhou et al., 2021). Therefore, quantification of ETp determines the performance of such models regarding the water flows, mixing and balance to better understand the interactions between climate and hydrology.
So far, various methods for ETp quantification have been developed, such as the Thornthwaite model (Thornthwaite, 1948), the Priestley-Taylor equation (Priestley and Taylor, 1972), the Penman-Monteith equation (Monteith, 1965), etc. The current physically based methods can be categorized into four major types, i.e., temperature-based, radiation-based, the combination method, and the mass transfer-based methods (which utilize the fundamentals of Dalton's law and the concept of eddy transfer of water vapor from an evaporating surface to the atmosphere). They have been compared extensively across a wide spectrum of climate and geolocation, and the combination method represented by the Penman-Monteith equation is considered superior to others in general (Lu et al., 2005; Oudin et al., 2005; Fisher et al., 2011; Mallick et al., 2013). Based on these methods a rich pool of ETp products have been produced for hydrology and climate research (Rodell et al., 2004; Mu et al., 2007; Miralles et al., 2011; Zhang et al., 2019). It is worth mentioning that more recently, non-physically based soft computing models have also been developed using various machine learning techniques such as these reviewed in Adnan et al. (2021) and Salam and Islam (2020), which have improved both the computing efficiency and simulation accuracy with less demand for input variables.
Composed of evaporation and transpiration, ETp is a function of meteorology and the surrounding near-surface environment (Zhan et al., 2019), therefore, ETp can vary simultaneously with changes in surface conditions, which has been proved by previous studies. For instance, Yang et al. (2011) claimed that relative humidity was the most influential factor followed by solar radiation and wind speed in the Yellow River Basin, whereas Wang et al. (2014) reported that temperature was the main reason for ETp change in a northern China irrigation district, followed by wind speed and relative humidity; Duethmann and Blöschl (2018) found in over 150 Austrian catchments that ETo increased with increased net radiation and temperature; Zhang et al. (2020) found temperature and sunshine hours were the two most influential factors in Shandong province, China, while Jerin et al. (2021) reported the dominant factors for ETo were mean temperature, solar duration and relative humidity in Bangladesh. de Oliveira et al. (2021) found solar radiation was the most important factor controlling ETo in the southern Amazon basin, same with findings in Valle Júnior et al. (2021). These studies demonstrate that the weight of meteorological variables on ETp quantification varies with regions and spatiotemporal scales. Although different in concept between ETp and ETo (Xiang et al., 2020), the latter is often used as the potential ET in these studies due to its simplicity where vegetation parameters are fixed, and because of this, the impact of vegetation cover is rarely explored and can somewhat be reflected in the near-surface meteorological variables if there is a close interaction between plant and atmosphere. Moreover, ETp is considered not limited by water supply by its definition, so the relationship between ETp and soil water condition is also not attended to. This assumption leaves meteorology the only factor governing ETp changes when using the modified Penman-Monteith equation in the well-known FAO56 paper for the reference grass (Allen et al., 1998; Chu et al., 2017; Li et al., 2018). However, because of the connections in the soil-plant-atmosphere continuum regarding water flow and energy transfer, the divergence in the effects of surface conditions on near-surface meteorology and soil water content (Jiao et al., 2021), and the fact that ETp integrates the vegetation impacts through the surface resistance that is influenced by many environmental factors (Zhang et al., 2019; Wang et al., 2020), it is reasonable to hypothesize that ETp can be influenced by the changes in vegetation growth and soil water content besides meteorology, which however draws little attention so far and needs further proof and justification.
Moreover, most of the previous studies are focused in the dryland areas where water availability primarily restrains ecosystem development, and atmospheric demand is usually high with high variabilities due to the high seasonal radiation and low vegetation covers (Hua et al., 2020); yet less is known about the variations of ETp and its connections with vegetation and soil water content in the humid areas. In a previous study in Guangdong, a humid southern province of China, it was found that ETp has decreased by ~1 mm yr−1 during the water years of 2002-2014 (Zhou et al., 2021), comparable to other studies in some dry areas despite different study periods (Yang et al., 2011; Wang et al., 2014; Zhang et al., 2020). Given the role of ETp in the hydrologic cycles, it is important to assess comprehensively the variations of ETp and its influencing factors, especially the interaction with surface conditions. Therefore, the overall aim of this study is to investigate the roles of meteorological variables, soil water content and vegetation growth in the ETp variation across different time scales in a humid subtropical region. The specific objectives are (1) to examine the changes in potential ET and the influencing factors over the past 3 decades or so; and (2) to quantify the multiscale impacts of major meteorological variables, soil water content and vegetation growth on ETp. The results can help improve our understanding of how evapotranspiration varies with environmental changes, thus assist the optimization of water management throughout the ecoengineering projects.
The analysis was carried out in Guangdong province in south China (Figure 1) which has a subtropical monsoonal climate with an area around 180,000 km2. The mean annual temperature is 22°C, mean sunshine duration is around 1,745 h, and mean annual precipitation is 1,780 mm ranging from 1,300 to 2,600 mm. Previous analysis showed that precipitation was overall on the rise in the province especially in the Pearl River Delta (Fu et al., 2016; Yan et al., 2020), while evapotranspiration decreased during 1980 to 2006 (Chen et al., 2015). Alongside the global warming tendency, the province confronts with water shortages induced by population growth, extreme weather and water contamination (Zhang et al., 2011; Chen et al., 2014). Quantification of water loss through evapotranspiration is important for water availability because ET accounts for over half the annual total precipitation on average in the region (Gao, 2010).
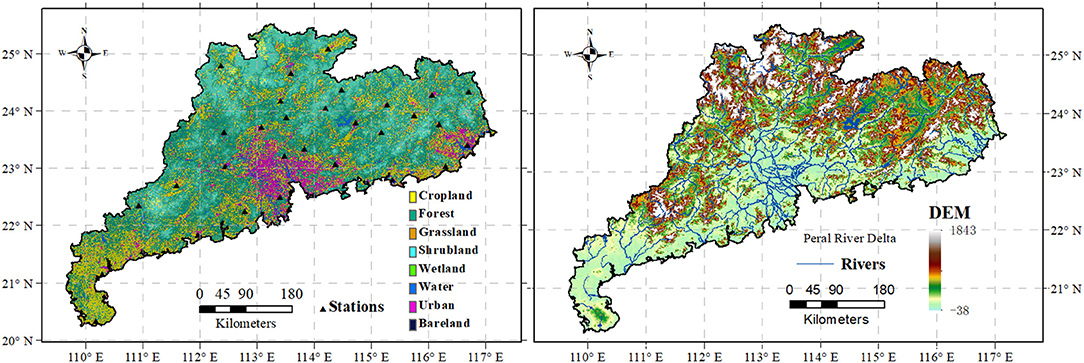
Figure 1. Land use land cover types of Guangdong province at a 30-m resolution (left); and digital elevation map at a 1,000-m resolution (right). Locations of the meteorological stations are marked with black triangles.
Vegetation cover in Guangdong province was low during 1980s, until the province launched a 10-year project to plant trees primarily over the mountains starting from around 1985. At present, 59.4% of the province is covered by forests, followed by croplands (23.8%) and urban areas (12.4%); the rest are covered by grassland, shrubland, and other land use types, based on the 30-m resolution land cover data (http://data.ess.tsinghua.edu.cn). Elevated areas are mostly located in the north, whereas lowlands are in the south where rivers converge and flow into the South China Sea (Figure 1).
We obtained meteorological measurements at 33 stations from Chinese Meteorological Administration (http://data.cma.cn/data), covering different land use types and altitudes (Figure 1). These meteorological variables include the maximum, minimum, and mean air temperature (Tmax, Tmin, and Tavg, respectively), relative humidity (RH), wind speed (Ws) and directions, solar radiation (Rs), air pressure, and precipitation (P) at a monthly scale during 01/1982–12/2015. In addition, we obtained the GLEAM (Miralles et al., 2011) monthly 0.25° root-zone soil water content (SWC) data (https://www.gleam.eu) and the biweekly 1/12° GIMMS NDVI3g (Pinzon and Tucker, 2014) vegetation index data (https://ecocast.arc.nasa.gov/data/pub/gimms/3g.v1) to assist the examination of interlinkages between ETp and surface conditions. The depth of the root zone in GLEAM model is a function of the land-cover type and comprises three model layers for the fraction of tall vegetation (0–10, 10–100, and 100–250 cm), two layers for the fraction of low vegetation (0–10, 10–100 cm), and one layer for the fraction of bare soil (0–10 cm) (Martens et al., 2017). The SWC has been validated using observations from 2,325 soil moisture sensors across a broad range of ecosystems globally; unfortunately, we are not able to validate the SWC data especially the root-zone moisture throughout our study area. This could be a limitation regarding SWC accuracy but may be overcome by ensemble means of different soil moisture datasets in the future. Given that the spatial interpolation with 33 stations across the province would likely result in large uncertainty in the ungauged areas, and accuracy of the rescaled NDVI and SWC are difficult to verify, we only analyzed the temporal dynamics and relationships using the areal average data with their original spatial resolutions.
Reference evapotranspiration based on the Penman-Monteith method (Allen et al., 1998) was calculated following Equation (1), and the results were taken as the potential ET as in other studies.
Rn is net radiation [MJ m−2 day−1] and G is soil heat flux [MJ m−2 day−1]. Δ is slope of saturation vapor pressure curve [kPa°C−1]. γ is psychrometric constant [kPa°C−1]. T is air temperature [°C]. es and ea is saturated and actual vapor pressure [kPa], and their difference is the vapor pressure deficit (VPD). u2 is the wind speed at 2 m height about ground [m s−1], calculated from wind speed observed at 10 m above ground (Ws) at the meteorological stations (Equation 2, where z is the elevation above sea level of the stations). Net radiation and soil heat flux were calculated following the procedures provided in Allen et al. (1998) and the main formulas were given in Equations (3–5).
Where Rns and Rnl are net shortwave and longwave radiation, and Rso is the clear-sky solar radiation. α is surface albedo, prescribed as 0.23 for reference grass, and σ is the Stefan Boltzmann constant. Tmax and Tmin are in Kelvin degree in Equation (5).
The changing trends of ETp and the environmental variables were examined by the Mann-Kendall test. Relationships between ETp and the influencing factors were also analyzed for different seasons under dry and wet conditions by linear regression analysis. Linear trends were removed from the data series before calculating the correlation coefficients for monthly, seasonal and annual scales. For monthly scale analysis, seasonality was also removed before detrending by subtracting the climatological means from monthly data. In addition, partial correlation analysis was applied to quantify the effect of environmental variables on ETp at the annual and monthly scales, which is widely used for studying the linear relationship between two variables after excluding the effect of other independent factors (Fu et al., 2015). It should be noted that the response of ETp to some factors is non-linear, especially at a sub-daily scale because of the hysteresis between ETp and these factors (Zheng et al., 2014) which is more profound in wet periods than dry periods (Wang et al., 2019b); but at a longer time scale such as daily or monthly the relationships can be linearly approximized, at least for some of the environmental factors such as radiation and VPD if not for all (Liu et al., 2014; Xu et al., 2018; Wang et al., 2019b).
In general, the meteorological variables showed various annual dynamics, and the spatial variabilities indicated by standard deviations were also obvious (Figure 2). Precipitation has declined by ~3.7 mm yr−1 on average over the entire period, but it decreased in the first decade or so before fluctuating irregularly. The overall trend was not statistically significant. Root-zone soil water content showed similar variation pattern with precipitation in the first decade, while it decreased sharply around 2004 and then recovered rapidly. The overall trend was not statistically significant like precipitation. Abrupt change around 2004 was also observed for ETp and Rs which shared the most similar dynamic variations. Therefore, data were divided into two subperiods before and after 2004 for further analysis. Among all variables, Ws, Tavg, Tmax, Tmin, ETp, and NDVI saw increases across the years at a rate of 0.1 m s−1, 0.2, 0.3, 0.3 °C, 23.5 mm, and 0.012 per decade, respectively. The trends of these variables were all statistically significant with p < 0.05. Increasing trend also existed for solar radiation but the trend was not statistically significant. Overall significant and insignificant decreasing trend was observed for relative humidity (p < 0.05) and SWC (p > 0.05), respectively, in addition to precipitation. In this regard, the province has been getting dryer since 1980s. In particular, the increase rate over the last 11 years was 3 and 11 times the decrease rate over the first 23 years for RH and SWC, respectively (Table 1). Ws and NDVI increased in both subperiods and the rate in the second subperiod was ~5 times that in the first. In addition, the increase rate of Tavg, Tmin, and ETp in the recent decade was only 5, 32, and 44% of that before 2004, whereas Tmax increased and then decreased over the two consecutive periods.
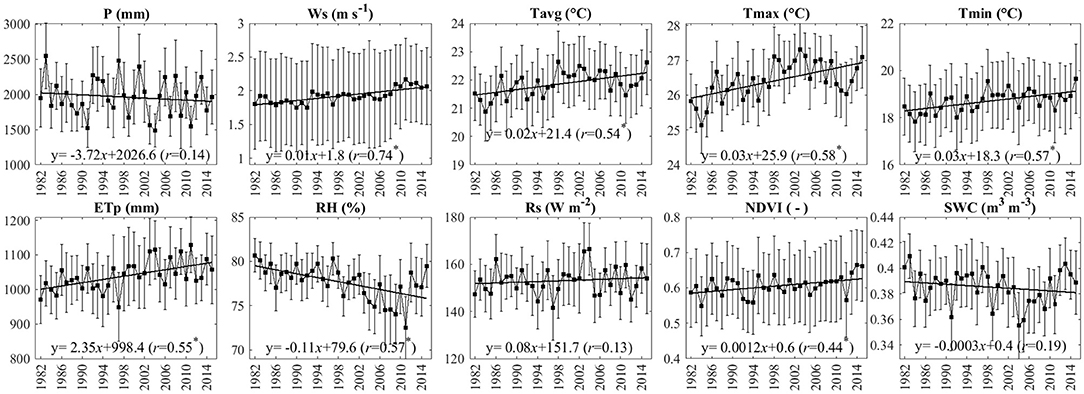
Figure 2. Annual variations of precipitation (P), wind speed (Ws), mean, maximum, minimum temperature (Tavg, Tmax, Tmin), relative humidity (RH), solar radiation (Rs), root-zone soil water content (SWC), normalized difference vegetation index (NDVI), and potential evapotranspiration (ETp). Solid straight lines infer linear trends of the relevant variables. Asterisks mark the significant trends.
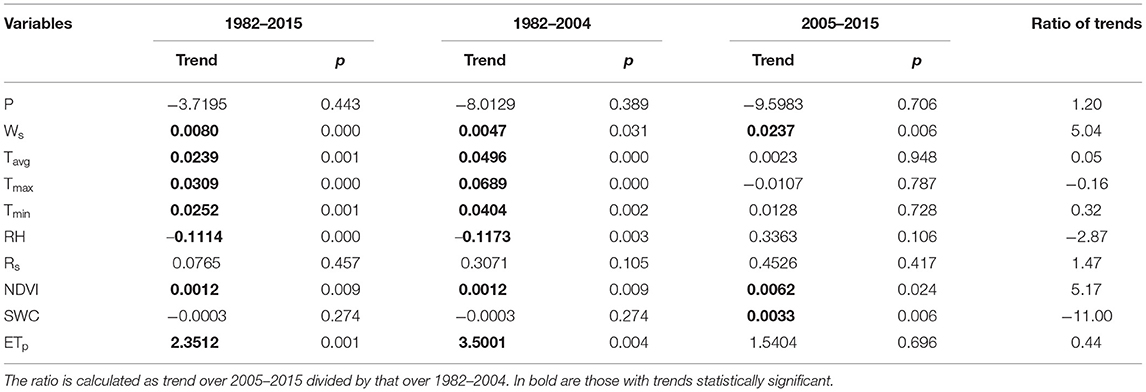
Table 1. Linear trends of the investigated variables during three different periods at the annual scale.
The monthly climatological variations between the two subperiods (Figure 3) were compared in different months of the year. It is observed that all variables showed clear seasonality with different peaking time. P, RH, and SWC peaked in June, and temperatures, ETp and Rs peaked in July. The highest NDVI appeared in mid-autumn (October) and the lowest occurred in early spring (March). Over the two subperiods, wind speed, temperature, vegetation index and potential ET were overall higher while precipitation, relative humidity and soil water content were mostly lower over 2005–2015 than 1982–2004. However, the Wilcoxon rank sum test indicated only wind speed had statistically significant difference between the two subperiods. The comparison also shows that dynamic changes of these variables varied across months. For instance, precipitation was higher during May, June, November and December in the 2nd subperiod than the 1st, and consequently, it was the opposite for solar radiation in these months; December and January became cooler after 2005 than before 2005; vegetation greenness saw a decrease in June and October; and root-zone soil water decreased primarily in spring and increased slightly in summer and autumn. Decrease in ETp in June corresponded to increase in P, decrease in Rs and NDVI.
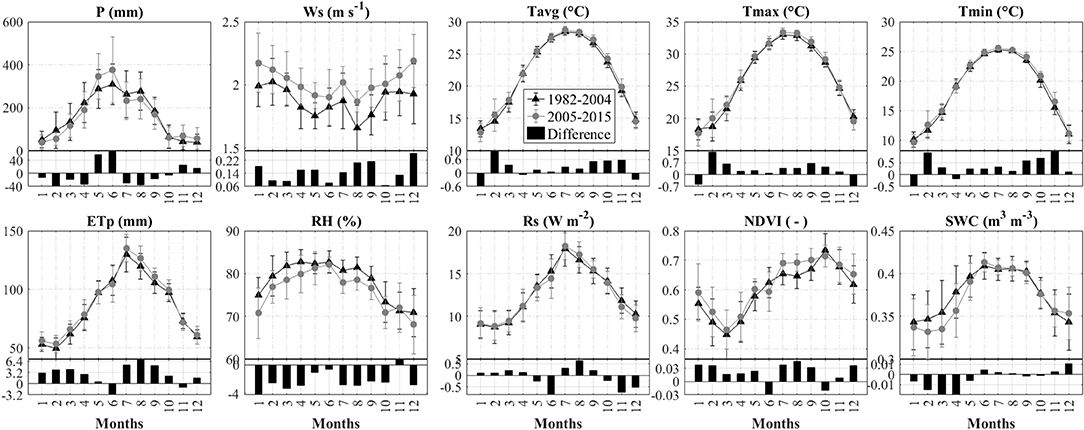
Figure 3. Monthly climatological means of the investigated variables during 1982–2004 and 2005–2015. The bars below are the residuals with values in 2005–2015 subtracted by these in 1982–2004.
Furthermore, we examined their interannual variations in different seasons in Figure 4 and Table 2, which shows various changing patterns. Ws has increased significantly at nearly the same rate across all seasons, while RH has decreased significantly (more in spring and winter than summer and autumn). For temperatures, Tavg, Tmax, and Tmin have all increased across all seasons with different magnitudes, but the significant increase (p < 0.05) appeared in spring and autumn for Tavg, in spring, summer and autumn for Tmax, and in summer and autumn for Tmin. Root-zone SWC saw an increase only in summer and the largest decrease occurred in spring (p < 0.05), consistent with precipitation. Rs has increased in spring and winter and decreased in summer and autumn, but the trends were not statistically significant (p > 0.05 for all). NDVI has increased across all seasons, and significant (p < 0.05) and largest increase appeared in spring and winter. Seasonal ETp trends shared the same characteristics with NDVI in terms of significant increasing trends (p < 0.05) in spring and winter. Apart from the trends, the highs and lows of these variables appeared in different seasons, for example, precipitation, temperatures, radiation, soil water content, and ETp were highest in summer and lowest in winter, while humidity was higher in spring and summer than autumn and winter, and NDVI was highest in autumn and lowest in spring. This may reflect the lag relationship between vegetation growth and hydrometeorological changes.
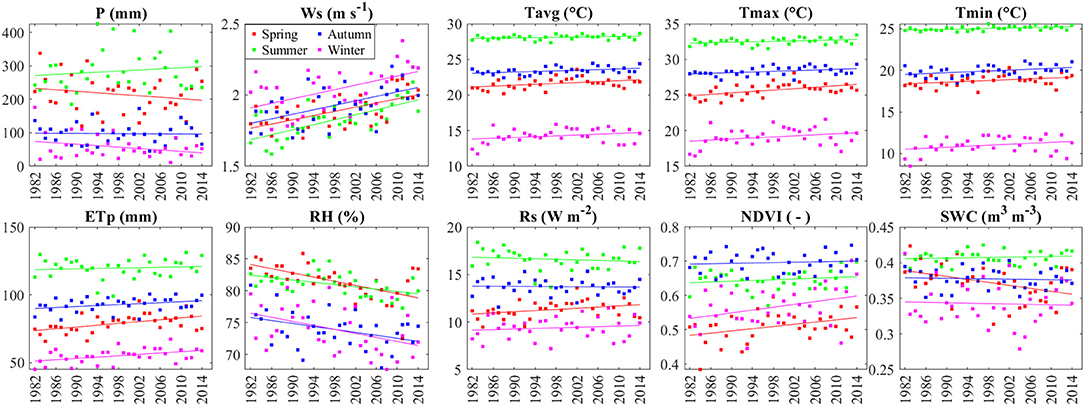
Figure 4. Seasonal trends of the investigated variables over the province during 1982–2015. Lines are linear regressions for different seasons. Data and linear trends are indicated by different colors as given in the legend in the second plot of the upper panel. Statistics are given in Table 2 for these linear regression analyses.
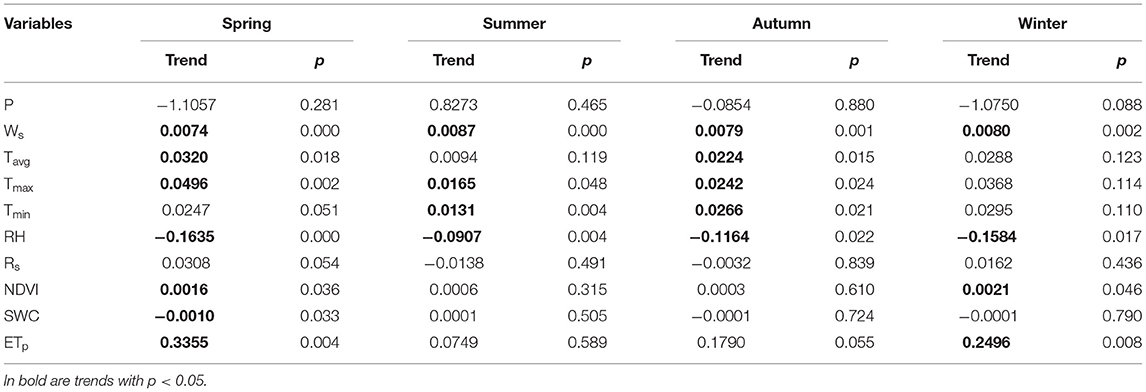
Table 2. Linear trends and p-values for the variables in Figure 4.
The impacts of the factors on ETp were examined by linear regression and partial correlation analysis after detrended at different time scales (and further deseasonalized for monthly scale) as stated in section Calculation of ETp and the Analysis. Figure 5 shows that the linear relationships were significant for P, Tmax, RH, Rs, and SWC (p < 0.05) at the annual scale. The strongest impact factor determined by the correlation coefficient was Rs, followed by P, RH, SWC, and Tmax (r = 0.93, −0.74, −0.71, −0.59, and 0.40, respectively). Correlation coefficients for other factors were mostly <0.20. ETp increased with wind speed, mean and maximum temperatures, solar radiation and vegetation greenness, while decreased with precipitation, minimum temperature, relative humidity and soil water content. Increase in Tmax can promote ETp more than Tavg and Tmin, which indicates that the atmospheric demand in the region would grow strongly with enhanced heatwaves.
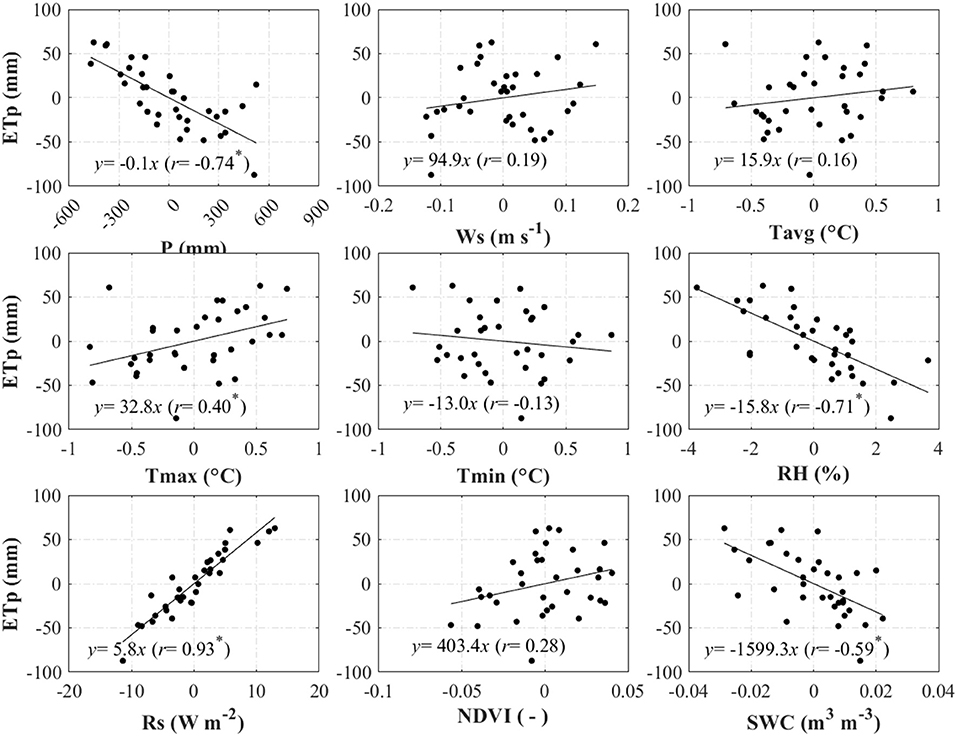
Figure 5. Scatterplots of annual ETp against different variables over the entire province. Data were detrended (for monthly, seasonal and annual data) and deseasonalized (for monthly data) before the partial correlation analysis. Asterisk infers a statistically significant linear relationship.
The relationships showed different characteristics in different seasons (Figure 6). The regression slopes were largest in summer and lowest in winter for almost all variables, that is, ETp was most sensitive to environmental changes in summer and least in winter. The difference between slopes in summer and winter was substantial for temperatures (e.g., Tavg: 19.76 vs. 1.56), RH (16.97 vs. −0.04), NDVI (173.00 vs. 39.26), and SWC (−592.02 vs. −72.95). Opposite effects (positive or negative) of Ws and Tmin across different seasons were observed. Similar to the relationships at the annual scale, seasonal ETp was also most strongly influenced by Rs, P, RH (R2 > 0.50, p < 0.05). For some influencing factors, even if the relationships were not statistically significant at the annual scale, they may be significant in different seasons, e.g., Tavg, Tmin, and ETp in spring and summer. Annual NDVI was not significantly related to ETp but their relationships were significant in every season, which indicates stronger interactions between vegetation and atmospheric demand.
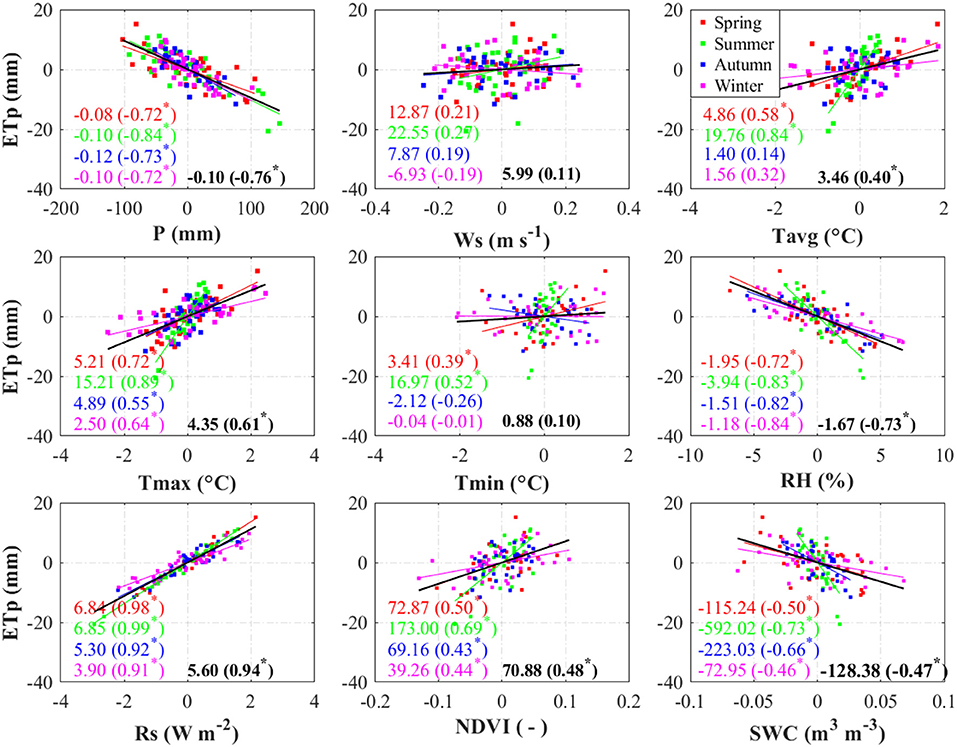
Figure 6. Scatterplots of ETp against different variables in different seasons. Data were detrended. Black lines are regression results for data in all seasons which is equivalent to monthly data regression. Other colors correspond to the four seasons as shown in the legend in the third plot of the upper panel. Numbers outside and inside the brackets are regression slopes and correlation coefficients, respectively. Asterisks infer statistically significant linear regressions.
In Figure 6, the black lines are linear regressions of data pairs in all seasons, which in some way is representative of monthly relationships since the seasonal data were calculated as the mean of the 3 months in each season. The correlation coefficients ranged from 0.10 (for Tmin) to 0.94 (for Rs) and were statistically significant for all except Ws and Tmin (black numbers in Figure 6). The degree of influence reduced in the sequence of Rs, P, RH, Tmax, NDVI, SWC, and Tavg with a correlation coefficient of 0.94, −0.76, −0.73, 0.61, 0.48, −0.47, and 0.40, respectively. To sum up, potential ET increased with wind speed, temperatures, solar radiation and vegetation greenness, and decreased with precipitation, relative humidity and soil water content across different time scales.
To determine the degree of influence of each environmental variable on ETp and the interactions between these variables, we carried out partial correlation analysis which can exclude the influence of other dependent variables when analyzing the relationship between one dependent variable and the independent variable. The partial correlation coefficients were given in Table 3, which showed that the environmental variables played different roles in determining ETp at different time scales. For annual data, the three most influential factors were Rs, RH, and Ws (r = 0.88, −0.87, 0.73, respectively, with p < 0.05); maximum temperature also posed a significant negative effect (r = −0.51). The influence of other environmental factors was not statistically significant. For monthly data, influences of Rs, RH, and Ws were also stronger than others (r = 0.94, −0.46, and 0.33 with p < 0.05), and the influences of Tmax, Tmin, NDVI, and SWC were also statistically significant although correlation coefficients were relatively low. For seasonal data, Rs, RH, and Ws were still the strongest factors affecting ETp, and the impacts were overall stronger in summer and autumn than spring and winter. In summer, SWC also had a significant positive impact on ETp (r = 0.46), while in autumn P and Tmax had significant negative impacts (r = −0.49 and −0.41) in addition to Rs, RH, and Ws. Therefore, in a relatively short time such as a month, ETp tends to be influenced by more environmental variables than in a relatively long time such as a season or a year; and the relationships presented both common and unique characteristics across seasons.
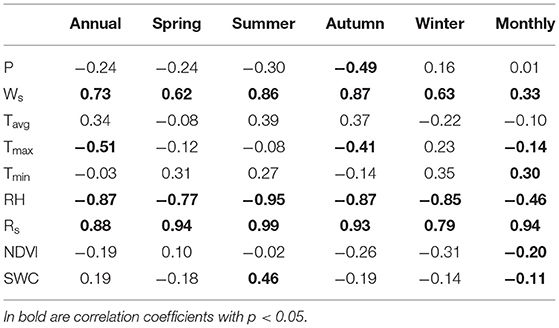
Table 3. Partial correlation coefficients (r) between ETp and the relevant environmental variables.
ETp is an important component in the simple water balance equation to indicate water deficit or surplus (Wu et al., 2019) which integrates the effects of climate and surface conditions and is often deducted by a series of environmental stress functions to estimate actual ET (Guerschman et al., 2009; Mu et al., 2011; Wang et al., 2020). Assessing the changes in ETp and its relationships with major associated influencing factors is necessary toward improving ET estimation and understanding the future climate change impacts on water resources. In this humid subtropical region, we found ETp has increased by ~2.35 mm yr−1 during 1982–2015 (p < 0.05). This is different from results in other part of China such as the Jiangsu province and in the Huai River Basin in eastern China, where ETp was found to decrease in general (Chu et al., 2017; Li et al., 2018). The increase in ETp was accompanied by an overall decrease in P, RH, SWC and an increase in temperatures, Rs, and NDVI. Additionally, the change rate over 2005–2015 was greater than that over 1982–2004 for nearly all variables, which indicates that in the recent decade or so, the climate activities are enhanced (Yang et al., 2018) and the region gets drier and warmer in terms of rising temperature and reduced humidity, precipitation and soil water content. Down to seasons, ETp was highest in summer and lowest in winter, different from that in a province in north China (Zhang et al., 2020). The changes in ETp and the environmental variables presented different seasonal features, e.g., rainfall and SWC increased only in summer, different from the result in Pearl River basin during 1961–2007 by Gemmer et al. (2011); meanwhile, Rs increased in spring and winter while decreased in summer and autumn; ETp and NDVI increased in all seasons and higher increase rate was in spring and winter. The difference in peaking time of these variables indicates the lag interactions between hydrometeorological changes and vegetation growth, which has also been revealed by analyses of climate impact on plant phenology (Estrella et al., 2015; Piao et al., 2015; Wang et al., 2019a). These detailed features are rarely reported before, but important to understand the soil-vegetation-atmosphere interactions across scales in the humid subtropical areas.
The impacts of environmental variables on ETp showed both similarity and difference across time scales. Namely, ETp was negatively correlated with P, RH, and SWC and positively with other variables at the annual scale, which has been found consistent across studies (Chu et al., 2017; Jerin et al., 2021; Valle Júnior et al., 2021). However, when it comes to seasons, ETp is most sensitive to environmental changes in summer and least sensitive in winter indicated by the regression slopes. This implies that the water demand in the region will increase more in summer than other seasons with a certain increase in temperatures (Wang et al., 2018; Zhang et al., 2018). In the meantime, ETp has increased the most in spring and winter, coincident with decreased precipitation and increased temperatures, which indicates that these two seasons are more prone to water shortages with the drying and warming tendency in the region because precipitation is already the lowest in these two seasons in a year causing frequent droughts (Gao et al., 2008; Zhang et al., 2011).
When calculated following the Allen et al. (1998) method in the FAO56 paper, ETp is considered as only affected by meteorological factors because surface vegetation cover is assumed as reference grass with albedo of 0.23 and resistance of 70 s m−1. While in studies carried out in southern Amazon basin in Brazil and northwest China's Qilian mountains (de Oliveira et al., 2021; Yang et al., 2021) the resultant ETp was found to have different values and trends over different land cover types, which implies that ETp is closely related to surface conditions whether or not these conditions are formulated in the reference evapotranspiration equation. If quantified by the Penman-Monteith equation with site-specific surface resistance (Chen and Dudhia, 2001; Mallick et al., 2015; Xiang et al., 2020), rather than a fixed value, ETp would be more strongly related to surface conditions including vegetation and soil moisture. We are aware that the major impact of albedo change on ETp exists in the net radiation. Albedo varies for different surfaces and for the angle of incidence. A green vegetation cover has an albedo of about 0.20–0.25, and 0.25 is recommended for natural vegetation (Seginer, 1969). Surfaces with vegetation cover would have a lower albedo than 0.25 (Chen and Dudhia, 2001). Jackson (1967) found a reduction of ~20% in ETp with an increase of albedo from 0.10 to 0.25. Hua et al. (2020) discovered that the effect of albedo on ETp can be large in arid areas especially for sparsely vegetated surfaces. Our study area is in the humid subtropical south China where 60% of the surface is covered by forests, 24% by croplands, and 12% by constructed lands. The vegetation is mostly evergreen species. Therefore, the effect of albedo on ETp calculation in this study should not be as profound as in arid and sparsely vegetated areas. Nonetheless, the analysis of interaction between ETp and NDVI should also have albedo influence accounted for because albedo is associated with vegetation change. Our study shows that annual ETp varies significantly with root-zone moisture, but insignificantly with vegetation greenness, while the monthly and seasonal relationships are statistically significant. Partial correlation analysis further demonstrates the weights of each variable associated with ETp which are clearly different across time scales and in four seasons. The most weighed factors are Rs and RH. Both NDVI and SWC played a negative role at the monthly scale, while SWC is more influential in summer than other seasons. In summary, through the analysis we are able to identify the role of different environmental factors in regulating potential evapotranspiration in such a humid region, and their influence on ETp varies with time scales and across different seasons. Such analysis would improve our understanding of the connections in the soil-plant-atmosphere continuum, and hence help to better manage and mitigate the climate change impacts on water resources through optimization of the surface conditions at different time of the year.
This study examined the variations in potential evapotranspiration (ETp) and its relationships with the associated environmental factors across time scales. Surrogated by the reference evapotranspiration, ETp is considered to be affected solely by meteorology, however, we found in our humid subtropical region that vegetation and root-zone soil moisture also influenced ETp even though the partial correlation coefficients were relatively low (mostly within ±0.30, and only statistically significant at the monthly scale for both factors and in summer for soil moisture). The most influential factors are solar radiation (positive effect), followed by precipitation and relative humidity (negative effects); the impacts of other factors varied across time scales and seasons. ETp has increased the most in spring and winter, coincident with decreased precipitation and increased temperatures, which indicates that these two seasons are more prone to water shortage issues with the drying and warming tendency in the region. Moreover, changes in ETp with per unit change in environmental variables indicated by the linear regression slopes were highest in summer, which implies likely greater water demand in summer than other seasons with a warming climate. If quantified through the Penman-Monteith equation with site-specific surface resistance, ETp would be more strongly related to vegetation and soil moisture than using reference evapotranspiration, in which situation the realization of surface conditions accounts for the vegetation change impacts on albedo and resistance.
The raw data supporting the conclusions of this article will be made available by the authors, without undue reservation.
JZ conceptualized the work, obtained and analyzed the data, and drafted the work. HW supervised the work and revised the paper. All authors contributed to the article and approved the submitted version.
This work was financially supported by the National Key Research and Development Program of China (2021YFC3200202), the National Natural Science Foundation of China (42171020), and Guangdong Provincial Department of Science and Technology, China (2019ZT08G090).
The authors declare that the research was conducted in the absence of any commercial or financial relationships that could be construed as a potential conflict of interest.
All claims expressed in this article are solely those of the authors and do not necessarily represent those of their affiliated organizations, or those of the publisher, the editors and the reviewers. Any product that may be evaluated in this article, or claim that may be made by its manufacturer, is not guaranteed or endorsed by the publisher.
Adnan, R. M., Mostafa, R., Islam, A. R. M. T., Kisi, O., Kuriqi, A., and Heddam, S. (2021). Estimating reference evapotranspiration using hybrid adaptive fuzzy inferencing coupled with heuristic algorithms. Comput. Electron. Agric. 191:106541. doi: 10.1016/j.compag.2021.106541
Ala-aho, P., Soulsby, C., Wang, H., and Tetzlaff, D. (2017). Integrated surface-subsurface model to investigate the role of groundwater in headwater catchment runoff generation: a minimalist approach to parameterisation. J. Hydrol. 547, 664–677. doi: 10.1016/j.jhydrol.2017.02.023
Allen, R. G., Luis, P. S., Dirk, R., and Smith, M. (1998). Crop Evapotranspiration (Guidelines for Computing Crop Water Requirements). FAO Irrigation and Drainage Paper 56. Rome. Retrieved from: http://www.kimberly.uidaho.edu/water/fao56/fao56.pdf
Beguería, S., Vicente-Serrano, S. M., Reig, F., and Latorre, B. (2014). Standardized precipitation evapotranspiration index (SPEI) revisited: parameter fitting, evapotranspiration models, tools, datasets and drought monitoring. Int. J. Climatol. 34, 3001–3023. doi: 10.1002/joc.3887
Chen, F., and Dudhia, J. (2001). Coupling an advanced land surface–hydrology model with the Penn State–NCAR MM5 modeling system. Part I: model implementation and sensitivity. Mnthly Weather Rev. 129, 569–585. doi: 10.1175/1520-0493(2001)129<0569:CAALSH>2.0.CO;2
Chen, X., Liu, X., Zhou, G., Han, L., Liu, W., and Liao, J. (2015). 50-year evapotranspiration declining and potential causations in subtropical Guangdong province, southern China. Catena 128, 185–194. doi: 10.1016/j.catena.2015.02.001
Chen, Z., Zhu, Z., Yin, L., Wei, S., and Deng, L. (2014). The changing water quality characteristics from urban drinking water sources in Guangdong, China. Water Resour. Manage. 29, 987–1002. doi: 10.1007/s11269-014-0855-0
Chu, R., Li, M., Shen, S., Islam, A. R. M. T., Cao, W., Tao, S., et al. (2017). Changes in reference evapotranspiration and its contributing factors in Jiangsu, a major economic and agricultural province of Eastern China. Water 9, 1–20. doi: 10.3390/w9070486
de Oliveira, R. G., Valle Júnior, L. C. G., da Silva, J. B., Espíndola, D. A. L. F., Lopes, R. D., Nogueira, J. S., et al. (2021). Temporal trend changes in reference evapotranspiration contrasting different land uses in southern Amazon basin. Agric. Water Manage. 250:106815. doi: 10.1016/j.agwat.2021.106815
Duethmann, D., and Blöschl, G. (2018). Why has catchment evaporation increased in the past 40 years? A data-based study in Austria. Hydrol. Earth Syst. Sci. Discuss. 22, 5143–5158. doi: 10.5194/hess-2018-129
Estrella, N., Estrella, N., and Menzel, A. (2015). Responses of leaf colouring in four deciduous tree species to climate and weather in Germany. Clim. Res. 32, 253–267. doi: 10.3354/cr032253
Fisher, J. B., Whittaker, R. J., and Malhi, Y. (2011). ET come home: potential evapotranspiration in geographical ecology. Glob. Ecol. Biogeogr. 20, 1–18. doi: 10.1111/j.1466-8238.2010.00578.x
Fu, S., Li, D., Sun, J., Si, D., Ling, J., and Tian, F. (2016). A 31-year trend of the hourly precipitation over South China and the underlying mechanisms. Atmos. Sci. Lett. 17, 216–222. doi: 10.1002/asl.645
Fu, Y. H., Piao, S., Vitasse, Y., Zhao, H., De Boeck, H. J., Liu, Q., et al. (2015). Increased heat requirement for leaf flushing in temperate woody species over 1980-2012: effects of chilling, precipitation and insolation. Glob. Change Biol. 21, 2687–2697. doi: 10.1111/gcb.12863
Gao, M., Qin, Z., Zhang, H., Lu, L., Zhou, X., and Yang, X. (2008). Remote sensing of agro-droughts in Guangdong Province of China using MODIS satellite data. Sensors 8, 4687–4708. doi: 10.3390/s8084687
Gao, X.. (2010). Actual Evapotranspiration in the Pearl River Basin: Estimation, Spatio-Temporal Variations and Climatic Sensitivities. The Chinese University of Hong Kong. doi: 10.1017/S0033291717001520
Gemmer, M., Fischer, T., Jiang, T., Su, B., and Liu, L. L. (2011). Trends in precipitation extremes in the Zhujiang River basin, South China. J. Clim. 24, 750–761. doi: 10.1175/2010JCLI3717.1
Guerschman, J. P., Van Dijk, A. I. J. M., Mattersdorf, G., Beringer, J., Hutley, L. B., Leuning, R., et al. (2009). Scaling of potential evapotranspiration with MODIS data reproduces flux observations and catchment water balance observations across Australia. J. Hydrol. 369, 107–119. doi: 10.1016/j.jhydrol.2009.02.013
Hua, D., Hao, X., Zhang, Y., and Qin, J. (2020). Uncertainty assessment of potential evapotranspiration in arid areas, as estimated by the Penman-Monteith method. J. Arid Land 12, 166–180. doi: 10.1007/s40333-020-0093-7
Jackson, R. J.. (1967). The effect of slope, aspect and albedo on potential evapotranspiration from hillslopes and catchments. J. Hydrol. 6, 60–69.
Jerin, J. N., Islam, H. M. T., Islam, A. R. M. T., Shahid, S., Hu, Z., Badhan, M. A., et al. (2021). Spatiotemporal trends in reference evapotranspiration and its driving factors in Bangladesh. Theoret. Appl. Climatol. 144, 793–808. doi: 10.1007/s00704-021-03566-4
Jiao, W., Wang, L., Smith, W. K., Chang, Q., Wang, H., and D'Odorico, P. (2021). Observed increasing water constraint on vegetation growth over the last three decades. Nat. Commun. 12, 1–9. doi: 10.1038/s41467-021-24016-9
Kirkham, M. B.. (2014). “Potential evapotranspiration,” in Principles of Soil and Plant Water Relations, ed C. Janco (Waltham: Elsevier), 501–514. doi: 10.1016/b978-0-12-420022-7.00028-8
Li, M., Chu, R., Shen, S., and Islam, A. R. M. T. (2018). Quantifying climatic impact on reference evapotranspiration trends in the Huai River Basin of Eastern China. Water 10:144. doi: 10.3390/w10020144
Liu, B., Zhao, W., Wen, Z., and Zhang, Z. (2014). Response of water and energy exchange to the environmental variable in a desert-oasis wetland of Northwest China. Hydrol. Process. 28, 6098–6112. doi: 10.1002/hyp.10098
Lu, J., Sun, G., McNulty, S. G., and Amatya, D. M. (2005). A comparison of six potential evapotranspiration methods for regional use in the southeastern United States. J. Am. Water Resour. Assoc. 41, 621–633. doi: 10.1111/j.1752-1688.2005.tb03759.x
Mallick, K., Boegh, E., Trebs, I., Alfieri, J. G., Kustas, W. P., Prueger, J. H., et al. (2015). Reintroducing radiometric surface temperature into the Penman-Monteith formulation. Water Resour. Res. 51, 6214–6243. doi: 10.1002/2014WR016106
Mallick, K., Jarvis, A., Fisher, J. B., Tu, K. P., Boegh, E., and Niyogi, D. (2013). Latent heat flux and canopy conductance based on Penman-Monteith, Priestley-Taylor equation, and Bouchet's complementary hypothesis. J. Hydrometeorol. 14, 419–442. doi: 10.1175/JHM-D-12-0117.1
Martens, B., Miralles, D. G., Lievens, H., Van Der Schalie, R., De Jeu, R. A. M., Fernández-Prieto, D., et al. (2017). GLEAM v3: Satellite-based land evaporation and root-zone soil moisture. Geosci. Model Dev. 10, 1903–1925. doi: 10.5194/gmd-10-1903-2017
Miralles, D. G., De Jeu, R. A. M., Gash, J. H., Holmes, T. R. H., and Dolman, A. J. (2011). Magnitude and variability of land evaporation and its components at the global scale. Hydrol. Earth Syst. Sci. 15, 967–981. doi: 10.5194/hess-15-967-2011
Monteith, J. L.. (1965). Evaporation and Environment. Swansea: Symposia of the Society for Experimental Biology.
Mu, Q., Heinsch, F. A., Zhao, M., and Running, S. W. (2007). Development of a global evapotranspiration algorithm based on MODIS and global meteorology data. Remote Sens. Environ. 111, 519–536. doi: 10.1016/j.rse.2006.07.007
Mu, Q., Zhao, M., and Running, S. W. (2011). Improvements to a MODIS global terrestrial evapotranspiration algorithm. Remote Sens. Environ. 115, 1781–1800. doi: 10.1016/j.rse.2011.02.019
Oudin, L., Hervieu, F., Michel, C., Perrin, C., Andréassian, V., Anctil, F., et al. (2005). Which potential evapotranspiration input for a lumped rainfall-runoff model? Part 2 - Towards a simple and efficient potential evapotranspiration model for rainfall-runoff modelling. J. Hydrol. 303, 290–306. doi: 10.1016/j.jhydrol.2004.08.026
Piao, S., Tan, J., Chen, A., Fu, Y. H., Ciais, P., Liu, Q., et al. (2015). Leaf onset in the northern hemisphere triggered by daytime temperature. Nat. Commun. 6:7911. doi: 10.1038/ncomms7911
Pinzon, J. E., and Tucker, C. J. (2014). A non-stationary 1981-2012 AVHRR NDVI3g time series. Remote Sens. 6, 6929–6960. doi: 10.3390/rs6086929
Priestley, C. H. B., and Taylor, R. J. (1972). On the Assessment of Surface Heat Flux and Evaporation Using Large-Scale Parameters. Retrieved from: https://journals.ametsoc.org/view/journals/mwre/100/2/1520-0493_1972_100_0081_otaosh_2_3_co_2.xml
Rodell, M., Houser, P. R., Jambor, U., Gottschalck, J., Mitchell, K., Meng, C. J., et al. (2004). The global land data assimilation system. Bull. Am. Meteorol. Soc. 85, 381–394. doi: 10.1175/BAMS-85-3-381
Rosenberg, N. J.. (1974). Microclimate: The Biological Environment. New York, NY: John Wiley and Sons, Inc.
Salam, R., and Islam, A. R. M. T. (2020). Potential of RT, bagging and RS ensemble learning algorithms for reference evapotranspiration prediction using climatic data-limited humid region in Bangladesh. J. Hydrol. 590:125241. doi: 10.1016/j.jhydrol.2020.125241
Seginer, I.. (1969). The effect of albedo on the evapotranspiration rate. Agric. Meteorol. 6, 5–31. doi: 10.1016/0002-1571(69)90031-4
Thornthwaite, C. W.. (1948). An approach toward a rational classification of climate. Geograph. Rev. 38:55. doi: 10.2307/210739
Valle Júnior, L. C. G., Do Vourlitis, G. L., Curado, L. F. A., Palácios, R. S., Nogueira, J. S., Lobo, F. A., et al. (2021). Evaluation of fao-56 procedures for estimating reference evapotranspiration using missing climatic data for a Brazilian tropical savanna. Water 13, 1–17. doi: 10.3390/w13131763
Vicente-Serrano, S. M., Beguería, S., and López-Moreno, J. I. (2010). A multiscalar drought index sensitive to global warming: the standardized precipitation evapotranspiration index. J. Clim. 23, 1696–1718. doi: 10.1175/2009JCLI2909.1
Wang, H., Guan, H., Liu, N., Soulsby, C., Tetzlaff, D., and Zhang, X. (2020). Improving the Jarvis-type model with modified temperature and radiation functions for sap flow simulations. J. Hydrol. 587:124981. doi: 10.1016/j.jhydrol.2020.124981
Wang, H., Tetzlaff, D., Buttle, J., Carey, S. K., Laudon, H., McNamara, J. P., et al. (2019a). Climate-phenology-hydrology interactions in northern high latitudes: assessing the value of remote sensing data in catchment ecohydrological studies. Sci. Tot. Environ. 656, 19–28. doi: 10.1016/j.scitotenv.2018.11.361
Wang, H., Tetzlaff, D., and Soulsby, C. (2019b). Hysteretic response of sap flow in Scots pine (Pinus sylvestris) to meteorological forcing in a humid low-energy headwater catchment. Ecohydrology 12:e2125. doi: 10.1002/eco.2125
Wang, X. M., Liu, H. J., Zhang, L. W., and Zhang, R. H. (2014). Climate change trend and its effects on reference evapotranspiration at Linhe Station, Hetao Irrigation District. Water Sci. Eng. 7, 250–266. doi: 10.3882/j.issn.1674-2370.2014.03.002
Wang, Z., Zhong, R., Lai, C., Zeng, Z., Lian, Y., and Bai, X. (2018). Climate change enhances the severity and variability of drought in the Pearl River Basin in South China in the 21st century. Agric. For. Meteorol. 249, 149–162. doi: 10.1016/j.agrformet.2017.12.077
Wen, X., Yang, B., Sun, X., and Lee, X. (2016). Evapotranspiration partitioning through in-situ oxygen isotope measurements in an oasis cropland. Agric. Forest Meteorol. 230–231, 89–96. doi: 10.1016/j.agrformet.2015.12.003
Wu, X., Guo, W., Liu, H., Li, X., Peng, C., Allen, C. D., et al. (2019). Exposures to temperature beyond threshold disproportionately reduce vegetation growth in the northern hemisphere. Nat. Sci. Rev. 6, 786–795. doi: 10.1093/nsr/nwy158
Xiang, K., Li, Y., Horton, R., and Feng, H. (2020). Similarity and difference of potential evapotranspiration and reference crop evapotranspiration – a review. Agric. Water Manage 232. doi: 10.1016/j.agwat.2020.106043 [Epub ahead of print].
Xu, S., Yu, Z., Yang, C., Ji, X., and Zhang, K. (2018). Trends in evapotranspiration and their responses to climate change and vegetation greening over the upper reaches of the Yellow River Basin. Agric. Forest Meteorol. 263, 118–129. doi: 10.1016/j.agrformet.2018.08.010
Yan, M., Chan, J. C. L., and Zhao, K. (2020). Impacts of urbanization on the precipitation characteristics in Guangdong Province, China. Adv. Atmos. Sci. 37, 696–706. doi: 10.1007/s00376-020-9218-3
Yang, L., Feng, Q., Adamowski, J. F., Alizadeh, M. R., Yin, Z., Wen, X., et al. (2021). The role of climate change and vegetation greening on the variation of terrestrial evapotranspiration in northwest China's Qilian Mountains. Sci. Total Environ. 759, 143532. doi: 10.1016/j.scitotenv.2020.143532
Yang, L. E., Chan, F. K. S., and Scheffran, J. (2018). Climate change, water management and stakeholder analysis in the Dongjiang River basin in South China. Int. J. Water Resour. Dev. 34, 166–191. doi: 10.1080/07900627.2016.1264294
Yang, Y., Roderick, M. L., Zhang, S., McVicar, T. R., and Donohue, R. J. (2019). Hydrologic implications of vegetation response to elevated CO2 in climate projections. Nat. Clim. Change 9, 44–48. doi: 10.1038/s41558-018-0361-0
Yang, Z., Liu, Q., and Cui, B. (2011). Distribution spatiale et variation temporelle de l'évapotranspiration de référence pendant la période 1961-2006 dans le bassin du Fleuve Jaune, en Chine. Hydrol. Sci. J. 56, 1015–1026. doi: 10.1080/02626667.2011.590810
Zhan, S., Song, C., Wang, J., Sheng, Y., and Quan, J. (2019). A global assessment of terrestrial evapotranspiration increase due to surface water area change. Earths Future 7, 266–282. doi: 10.1029/2018EF001066
Zhang, F., Liu, Z., Zhangzhong, L., Yu, J., Shi, K., and Yao, L. (2020). Spatiotemporal distribution characteristics of reference evapotranspiration in Shandong province from 1980 to 2019. Water 12, 1–16. doi: 10.3390/w12123495
Zhang, H., and Wang, L. (2021). Analysis of the variation in potential evapotranspiration and surface wet conditions in the Hancang River Basin, China. Sci. Rep. 11:8607. doi: 10.1038/s41598-021-88162-2
Zhang, Q., Li, J., Gu, X., and Shi, P. (2018). Is the Pearl River basin, China, drying or wetting? Seasonal variations, causes and implications. Glob. Planet. Change. 166, 48–61. doi: 10.1016/j.gloplacha.2018.04.005
Zhang, Q., Zhang, W., Chen, Y. D., and Jiang, T. (2011). Flood, drought and typhoon disasters during the last half-century in the Guangdong province, China. Nat. Hazards. 57, 267–278. doi: 10.1007/s11069-010-9611-9
Zhang, Y., Kong, D., Gan, R., Chiew, F. H. S., McVicar, T. R., Zhang, Q., et al. (2019). Coupled estimation of 500 m and 8-day resolution global evapotranspiration and gross primary production in 2002–2017. Remote Sens. Environ. 222, 165–182. doi: 10.1016/j.rse.2018.12.031
Zheng, H., Wang, Q., Zhu, X., Li, Y., and Yu, G. (2014). Hysteresis responses of evapotranspiration to meteorological factors at a diel timescale: patterns and causes. PLoS ONE 9:e98857. doi: 10.1371/journal.pone.0098857
Keywords: potential evapotranspiration, soil water content, vegetation cover, climate change, time scales
Citation: Wang H and Zheng J (2022) Assessing the Effects of Surface Conditions on Potential Evapotranspiration in a Humid Subtropical Region of China. Front. Clim. 4:813787. doi: 10.3389/fclim.2022.813787
Received: 12 November 2021; Accepted: 03 January 2022;
Published: 03 February 2022.
Edited by:
Xuhui Zhou, East China Normal University, ChinaReviewed by:
Fenghui Yuan, University of Minnesota Twin Cities, United StatesCopyright © 2022 Wang and Zheng. This is an open-access article distributed under the terms of the Creative Commons Attribution License (CC BY). The use, distribution or reproduction in other forums is permitted, provided the original author(s) and the copyright owner(s) are credited and that the original publication in this journal is cited, in accordance with accepted academic practice. No use, distribution or reproduction is permitted which does not comply with these terms.
*Correspondence: Hailong Wang, d2FuZ2hsb25nM0BtYWlsLnN5c3UuZWR1LmNu
Disclaimer: All claims expressed in this article are solely those of the authors and do not necessarily represent those of their affiliated organizations, or those of the publisher, the editors and the reviewers. Any product that may be evaluated in this article or claim that may be made by its manufacturer is not guaranteed or endorsed by the publisher.
Research integrity at Frontiers
Learn more about the work of our research integrity team to safeguard the quality of each article we publish.