
94% of researchers rate our articles as excellent or good
Learn more about the work of our research integrity team to safeguard the quality of each article we publish.
Find out more
ORIGINAL RESEARCH article
Front. Clim., 22 July 2022
Sec. Climate Services
Volume 4 - 2022 | https://doi.org/10.3389/fclim.2022.798618
This article is part of the Research TopicUrban ecohydrology & hydrometeorology: Integrating water and greenery management to improve climate resilience in citiesView all 6 articles
 Hieu Ngo1,2
 Roshanka Ranasinghe1,3,4Chris Zevenbergen1,2
 Ebru Kirezci5Dikman Maheng1,2,6
 Mohanasundar Radhakrishnan7
 Assela Pathirana1,8,9*
Risk-informed flood risk management requires a comprehensive and quantitative risk assessment, which often demands multiple (thousands of) river and flood model simulations. Performing such a large number of model simulations is a challenge, especially for large, complex river systems (e.g., Mekong) due to the associated computational and resource demands. This article presents an efficient probabilistic modeling approach that combines a simplified 1D hydrodynamic model for the entire Mekong Delta with a detailed 1D/2D coupled model and demonstrates its application at Can Tho city in the Mekong Delta. Probabilistic flood-hazard maps, ranging from 0.5 to 100 year return period events, are obtained for the urban center of Can Tho city under different future scenarios taking into account the impact of climate change forcing (river flow, sea-level rise, storm surge) and land subsidence. Results obtained under present conditions show that more than 12% of the study area is inundated by the present-day 100 year return period of water level. Future projections show that, if the present rate of land subsidence continues, by 2050 (under both RCP 4.5 and RCP 8.5 climate scenarios), the 0.5 and 100 year return period flood extents will increase by around 15- and 8-fold, respectively, relative to the present-day flood extent. However, without land subsidence, the projected increases in the 0.5 and 100 year return period flood extents by 2050 (under RCP 4.5 and RCP 8.5) are limited to between a doubling to tripling of the present-day flood extent. Therefore, adaptation measures that can reduce the rate of land subsidence (e.g., limiting groundwater extraction), would substantially mitigate future flood hazards in the study area. A combination of restricted groundwater extraction and the construction of a new and more efficient urban drainage network would facilitate even further reductions in the flood hazard. The projected 15-fold increase in flood extent projected by 2050 for the twice per year (0.5 year return period) flood event implies that the “do nothing” management approach is not a feasible option for Can Tho.
Flooding is one of the most frequently occurring and damaging natural disasters in the world (Hirabayashi et al., 2013; Kundzewicz et al., 2014; Arnell and Gosling, 2016; Alfieri et al., 2017; Forzieri et al., 2017; Mora et al., 2018). Coastal and delta areas are among the most flood hazard-prone areas of the world (Nicholls, 2004; Nicholls et al., 2007; Wong et al., 2014; Neumann et al., 2015; Pasquier et al., 2019), and flood intensity and frequency are already increasing, especially in coastal and delta cities, due to changes in river flows, downstream sea-level and local changes in rainfall and land use (Merz et al., 2010; Balica et al., 2012; Huong and Pathirana, 2013; Chen et al., 2018). Coastal and delta regions are also among the most densely populated areas of the world, which have experienced a rapid expansion of settlements, urbanization, infrastructure, economic activities, and tourism especially over the last 5 decades or so (Small and Nicholls, 2003; Valiela, 2006; Ranasinghe and Jongejan, 2018).
Flood risk assessment is performed to facilitate the implementation of risk-informed measures aimed at minimizing (or mitigating) flood damage (Hall et al., 2003; Meyer et al., 2009; Bureau Reclamation, 2020; Mishra and Sinha, 2020). Flood hazard estimation, which computes the probability and intensity of a possible event (Pappenberger et al., 2012; Alfieri et al., 2013; De Moel et al., 2015) is the first step in flood risk assessment (Penning-Rowsell et al., 2005; De Moel et al., 2015; Foudi et al., 2015; Kvočka et al., 2016). However, flood risk management and planning decisions in many parts of the world have historically utilized flood hazard or risk maps associated with one or two pre-determined return period water levels. While this may have been sufficient in the past, the need to move from stationary to innovative time-dependent (non-stationary) flood hazard and risk modeling approaches that can account for the uncertainty, arising from anthropogenic and climatic induced stressors, is rapidly increasing (Mosavi et al., 2018).
Climate change is now recognized as a major global challenge in the twenty-first century and beyond. Future projections indicate that climate change will have implications on the trends of sea level rise due to global warming and extreme events (e.g., extreme precipitation and hurricanes), which may lead to increases of flooding in the future (Panagouliaas and Dimoub, 1997; Menzel et al., 2002; Nicholls and Cazenave, 2010; IPCC, 2013, 2022; Prudhomme et al., 2013; Alfieri et al., 2015). Besides the challenges posed by climate change, the population in coastal and delta zones is projected to increase in all Shared Socioeconomic Pathways (SSPs) by 2050, with especially the population living in the low elevated coastal zone projected to exceed one billion (by 2050) in all SSPs (Merkens et al., 2016) and likely to reach 1.4 billion by 2060 under the high end growth assumption (Neumann et al., 2015). Increases in population inevitably increase water demand, which is often satisfied by excessive groundwater extraction, which, more often than not, leads to land subsidence, further exacerbating the flood hazard due to increased inundation levels and frequency. Lowering of the inundated areas as well as the river banks due to land subsidence can contribute to this increase. The combination of increased flood hazard and increased population/infrastructure will, in turn, lead to an increase in flood risk in these vulnerable areas (Nicholls et al., 2007; Lenderink and Van Meijgaard, 2008; Syvitski et al., 2009; Min et al., 2011; Balica et al., 2012; Rojas et al., 2013; Wong et al., 2014; Takagi et al., 2015). However, projections of these trends contain uncertainties. This particularly holds for deltas due to their multi-faceted and dynamic character (Nicholls et al., 2020).
The present study attempts to address the challenge of estimating non-stationary fluvial flood hazard in a way it can inform risk modeling via a computationally efficient modeling approach based on a simplified 1D hydrodynamic model for the entire Mekong Delta (area of 40,577 km2) that is coupled with a detailed 1D/2D coupled model and demonstrates its application at the urban center of Can Tho city (Ninh Kieu district) in the Mekong Delta.
Robust quantification of flood risk assessment typically requires multiple (thousands of) river and flood model simulations to derive probabilistic flood hazard assessments. This constitutes a major challenge, especially for large river systems, such as the Mekong, due to the associated computational and resource demands. Although the last decade has witnessed a great improvement in computational capabilities and models, traditional modeling approaches still pose significant challenges in terms of computational time required to obtain fully probabilistic flood hazard estimates (McMillan and Brasington, 2007; Neal et al., 2012). Therefore, developing computationally efficient modeling approaches to circumvent this particular bottleneck remains an important challenge.
Many studies have attempted to improve the computational performance of 1D and 2D hydraulic models in different ways. These attempts include methods such as:
(i) Model simplification—incorporating simpler representations of the physical processes to reduce the complexity of the model structure, e.g., ignoring certain terms such as inertia to simplify 2D shallow water equation (Bates and De Roo, 2000; Seyoum Solomon et al., 2012); applying Cellular Automata approaches in 1D drainage networks (Austin et al., 2014), and 2D overland flows (Ghimire et al., 2013); using conceptual models (Wolfs and Willems, 2013; Teng et al., 2015).
(ii) Detail reduction—reducing the level of detail and input details of the model, and/or simulation time-step, e.g., using simplified drainage networks (Davidsen et al., 2017), simplified river networks (Ngo et al., 2018), or lower resolution topographic data (Savage et al., 2016).
(iii) Using superior computational resources: parallel computation in 1D (Burger et al., 2014) and 2D models (Leandro et al., 2014; Zhang et al., 2014), and Cloud computing (Glenis et al., 2013).
These approaches significantly reduce model simulation times (Davidsen et al., 2017; Ngo et al., 2018), especially simplified models. Simplifying the model usually reduces the expressive ability (due to reduction of the behavioral complexity), statistical precision and sometimes the statistical accuracy of the model. The appropriateness of a simplified model should be looked at in terms of the purpose of the intended model application. According to the “fit for purpose model” concept, the choice of a model for flood simulation should be done such that the model that can provide predictions with an acceptable level of statistical accuracy at a reasonable computational time and cost (Wright and Esward, 2013; Haasnoot et al., 2014). Statistical methods including cross-validation (often used with machine learning models), computation of goodness-of-fit with a normalized statistic like NSE (Nash-Sutcliffe efficiency, typically used with hydrologic models Nash and Sutcliffe, 1970), are used to establish the appropriateness of a simplified model to represent results at a point of interest.
In addition to the computational performance of the models, the number of simulations is also a factor influencing the computational cost, especially time consuming 2D simulations. Flood risk assessment in the modern context often calculates flood water levels for different return periods (e.g., 5, 10, 20, 50, and 100 year). This reduces the number of 2D simulations that need to be executed while still achieving probabilistic flood hazard distributions.
Availability of historical data is a factor that influences flood hazard and risk assessment, in terms of flood frequency analysis (Machado et al., 2015; Engeland et al., 2018). Flood frequency analysis is used to determine the peak of flood events corresponding to a specified return period (Bayliss and Reed, 2001) in order to design flood risk reduction measures. However, the length of observed data is not always sufficient for robust flood frequency analysis. However, synthetic data approaches, such as the synthetic streamflow generator developed by Giuliani et al. (2017), provide to the means to generate a large numbers of time series data based on limited historical data.
In summary, key features of an effective non-stationary fluvial flood hazard modeling approach may therefore include (a) model reduction—a substantially simplified 1D model of the river system which can complete a simulation in short time span [e.g., completing a 1 year simulation of river flow (with daily time step) in around a minute (Ngo et al., 2018)], (b) strategic use of limited input data (e.g., using a synthetic streamflow generator to generate a large number (e.g., 1,000) time series of river flow based on limited historical data (Giuliani et al., 2017), (c) reduction of the number of time-consuming 1D/2D coupled model runs required to achieve probabilistic flood hazard results via flood frequency analysis while also considering flood hydrograph patterns, (d) derivation of probabilistic flood hazard quantification.
Model reduction is achieved in this study by gradually reducing the complexity of the detailed 1D model of the river system, using trials with varying levels of complexity (Ngo et al., 2018). Here the main river artery is retained while systematically removing small and medium distributaries, based on their size and/or distance from the target area (in this case, Can Tho city). In doing this, nodes at essential locations in the river system (e.g., at branching points, places at which the direction of flow changes, locations at which there are large change in river cross-sectional area) are retained, and nodes at less crucial positions are sequentially removed. After each stage of the model reduction, the model is run for a specific period (Ngo et al., 2018). The model simulated water levels are compared with the measured water level data at the area of interest to evaluate the accuracy of the model. If the model performance is still good enough, the process of reduction is continued until the simplest level of detail that still provides accurate predictions of water levels in the area of interest is obtained. The final model thus obtained is referred to hereon as the simplified model.
In this application, due to limited data availability, the synthetic streamflow generator developed by Giuliani et al. (2017) is used to generate 1,000 synthetic river flow time series. This synthetic streamflow generator uses the non-parametric method to re-sample flows from the recorded data, which combines the methods of Nowak et al. (2010) and Kirsch et al. (2012). First, Kirsch's method is used to generate flows on a monthly time step. Specifically, the monthly flows in the historical data are log-transformed and standardized, which are then randomly sampled to generate standard normal monthly synthetic flows. Subsequently, Nowak's method is used to disaggregate these monthly flows to daily flows. In detail, historical monthly flows are used to calculate the k nearest neighbors for each generated monthly flow. The k-nearest neighbors are then sorted from the closest to the furthest, and probabilistically selected for proportionally scaling flows in disaggregation. After a neighbor (i.e., one of the historical months) is selected, all historical daily flows from the selected neighbor are proportionally scaled to generate synthetic daily flows (Quinn et al., 2017). This synthetic streamflow generator is available on Github (https://github.com/julianneq/Kirsch-Nowak_Streamflow_Generator). Here, Matlab code was used to generate correlated synthetic historical data at multiple sites, while Python code was used to validate the synthetic historical data statistically (https://waterprogramming.wordpress.com/2017/08/29/open-source-streamflow-generator-part-i-synthetic-generation/).
Can Tho (population 1.6 million in 2016) is one of the five cities that are directly administered by the Central Government of Vietnam, and is located in the center of the Mekong Delta, next to the Hau River (Bassac River) (Figure 1A). In the coming decades, Can Tho is expected to be a dynamic city not only in the Mekong Delta but also in the entire southern region of Vietnam (Huong and Pathirana, 2013; MDP, 2013). The city includes five urban districts (Ninh Kieu, Binh Thuy, Cai Rang, O Mon, and Thot Not) and four rural districts (Phong Dien, Thoi Lai, Vinh Thanh, Co Do) (Figure 1B).
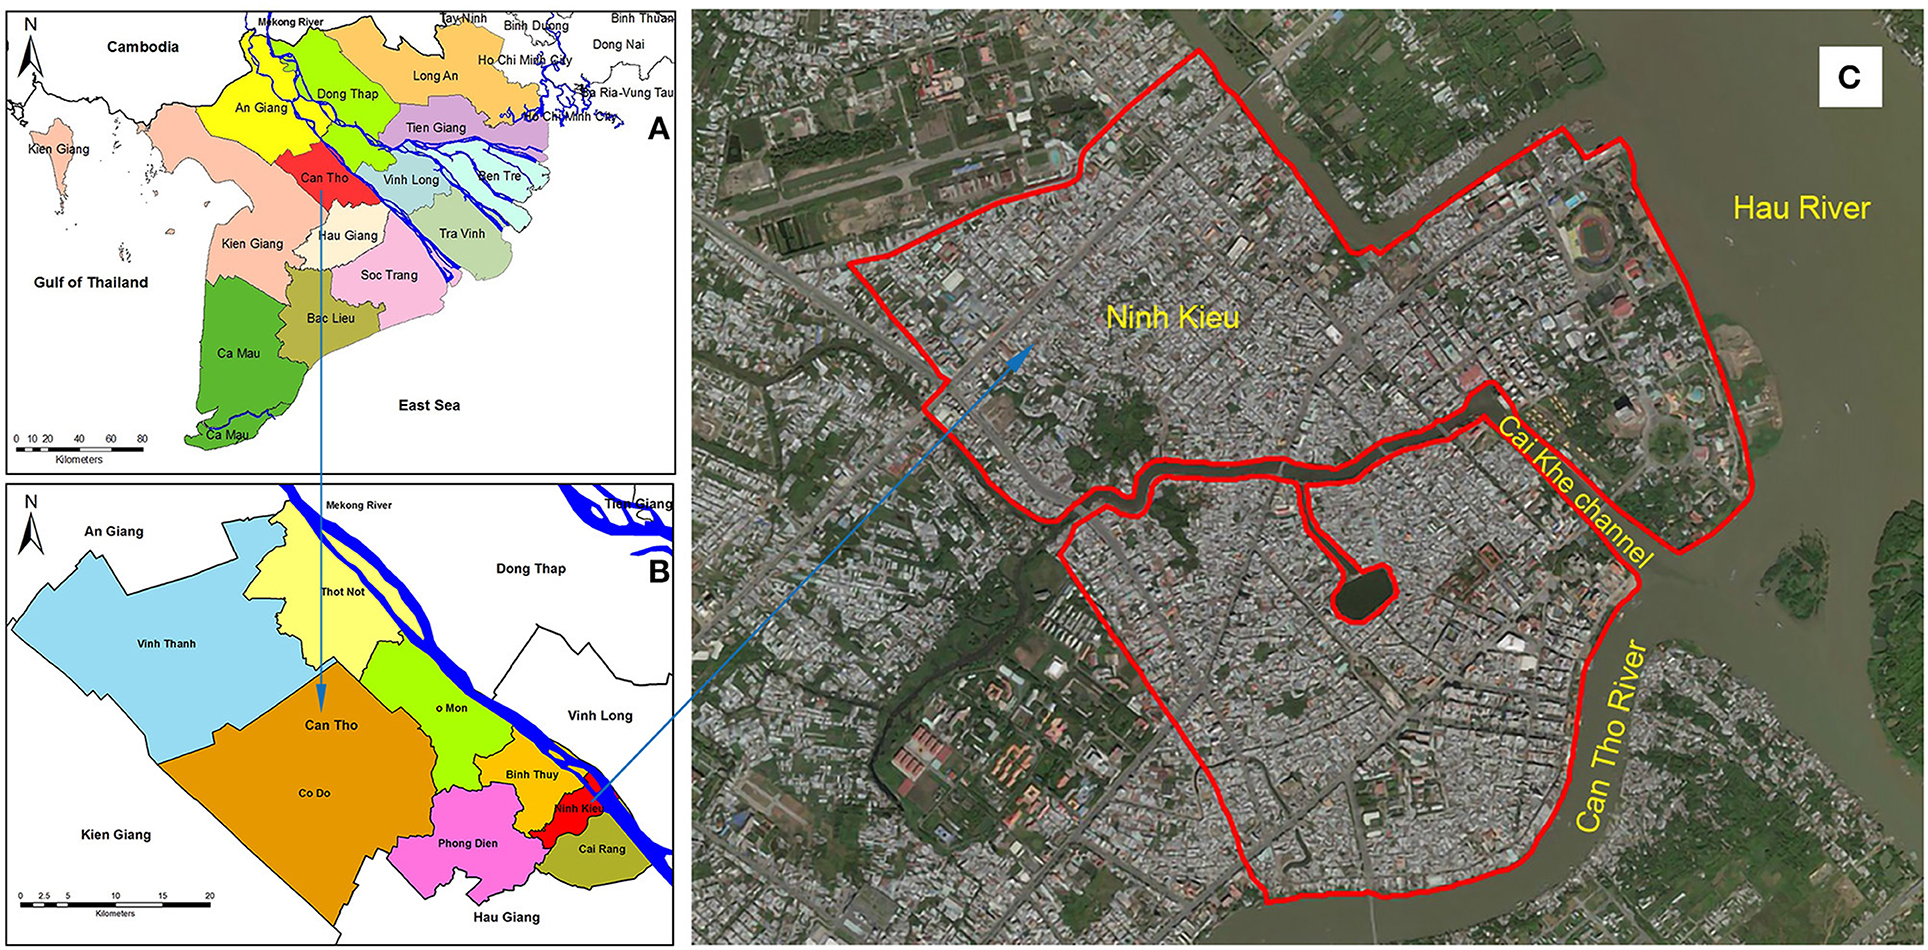
Figure 1. (A) Map of Mekong delta and surrounding provinces, (B) Can Tho city, (C) Study area (bounded by red line) within the Ninh Kieu district in Can Tho city (Base map is from Bing Maps satellite© Microsoft).
Situated in a tropical monsoon climate region, Can Tho has two distinct seasons: rainy and dry season. The rainy season usually starts from May and lasts until the end of November, with rainfall during this season accounting for 90% of the annual rainfall (Can Tho City People's Committee, 2010), while the dry season lasts from December to April with low rainfall.
Frequent flooding is a major problem in Can Tho (Huong and Pathirana, 2013; Ngo et al., 2018), at least 2–3 times per year, with inundation depths of up to 50 cm at some places in the city center. Although Can Tho city is some 80 km upstream from the ocean, it is impacted by tidal water level variations, thus making the city vulnerable to the effects of projected sea-level rise and storm surges. Additionally, Can Tho is already facing many challenges from rapid urbanization, population growth, and poor infrastructure (e.g., city flood drainage network)—all of which combine to increases the city's vulnerability to floods. Figure 2 shows the highest observed flood water levels in Can Tho since 2000 and official flood water level alarms in Can Tho.
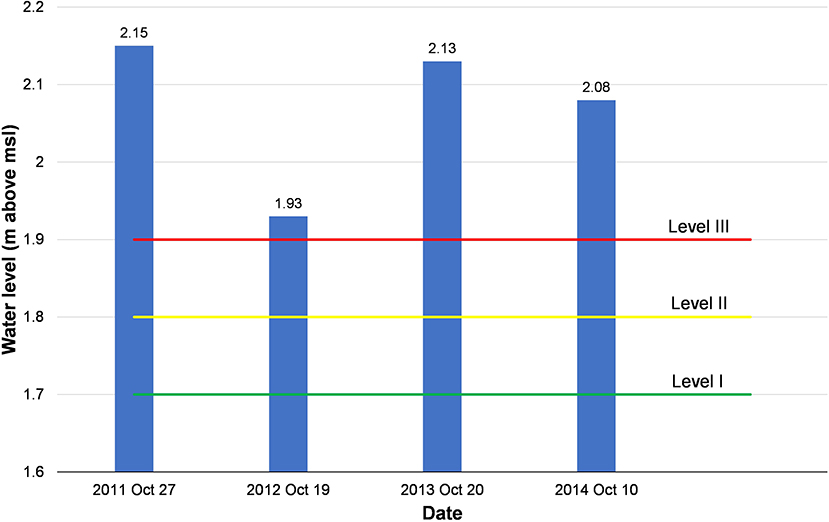
Figure 2. Highest measured water levels of the flooding years since 2000 and flood water level alarms in Can Tho (flood water level alarms are implemented following Decision No. 632/QÐ-TTg issued on May 10th, 2010).
This study focuses on a part of Ninh Kieu district (population 280,000 in 2019) which is the central area of Can Tho city (Figure 1C). Ninh Kieu is the most developed district of Can Tho and home to many trade centers, urban areas, and residential areas.
To achieve the goal of producing probabilistic flood hazard estimates for the study area (for the present and 2050), the method adopted here broadly comprised four methodological steps: (a) Model reduction—a substantially simplified 1D model for the entire Mekong Delta developed and validated by Ngo et al. (2018), (b) strategic use of limited input data (seven years data of river flow) to generate 1,000 time series data of river flow at Kratie using the synthetic streamflow generator, (c) reduction of the number of 1D/2D coupled model runs required by flood frequency analysis while also considering the flood hydrograph patterns, and (d) derivation of probabilistic flood hazard quantification for the present and for 2050 under RCP 4.5 and 8.5, with and without land subsidence. The methodology adopted is summarized in Figure 3. Data sources used for this study are shown in Table 1 and the way in which these data were used here is explained in detail below.
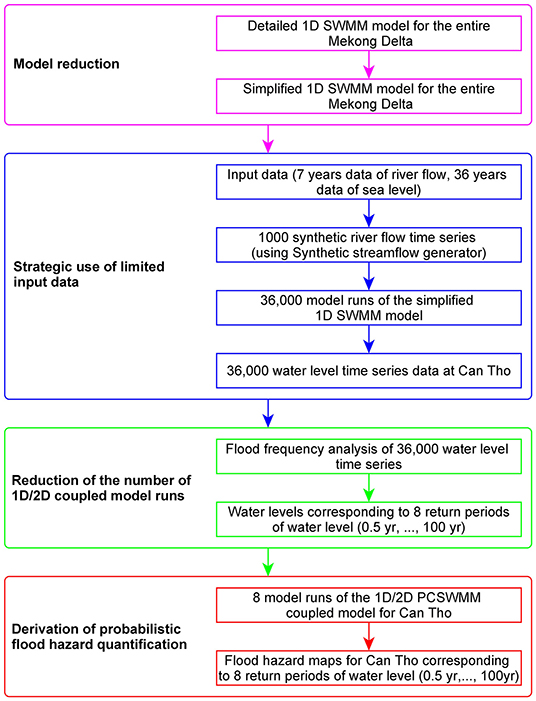
Figure 3. The methodological framework adopted to derive probabilistic flood hazard estimates for the study area. This process was applied for the present and for 2050 (RCP 4.5 and RCP 8.5 together with 3 different local land subsidence scenarios).
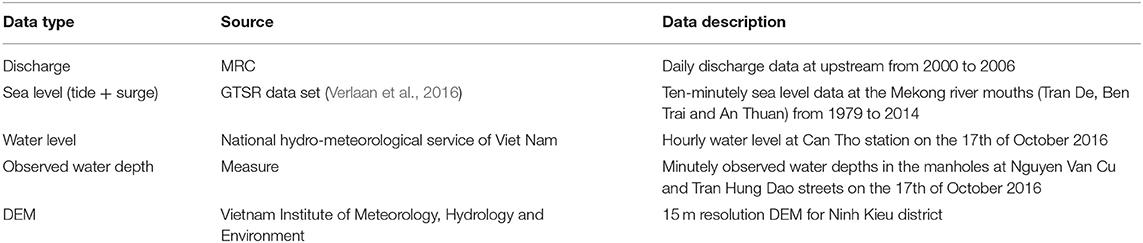
Table 1. Data source used in this study.
A simplified 1D model for the entire Mekong Delta, which is developed using the open-source dynamic rainfall-runoff simulation model SWMM (Storm Water Management Model, Rossman, 2015) is used to derive the river water levels at Can Tho. Here, first, a detailed SWMM model of the entire Mekong Delta was built based on an existing ISIS model, which comprised 575 nodes and 592 links (Figure 4A). Using trial simulations with the varying levels of complexity, nodes and links were systematically removed to arrive at a much reduced SWMM model comprising 37 nodes and 40 links (Figure 4B) which was able to accurately simulate 1-year of river water levels at Can Tho city in under 1 min. The model was calibrated with the year 2000 observed water level data and then validated with the years measured water level data at Chau Doc, Tan Chau and Can Tho gauging stations in 2001, 2002, and 2011 (Ngo et al., 2018). Years 2001 and 2002 are years that typical flood events occurred, while 2011 is a year that an extreme event occurred (on 27th October) (Figure 2). The simplified model was validated for the 2011 event with the goal of investigating the model's capability to simulate the extreme events, which may occur more often in the future due to Climate change (Panagouliaas and Dimoub, 1997; Menzel et al., 2002; Prudhomme et al., 2013; Alfieri et al., 2015). The general model performance ratings with respect to the October 2011 event based on two indicators NSE (Nash-Sutcliffe efficiency) and RMAE (Relative Mean Absolute Error) are 0.77 (very good) and 0.04 (excellent), respectively (Ngo et al., 2018).
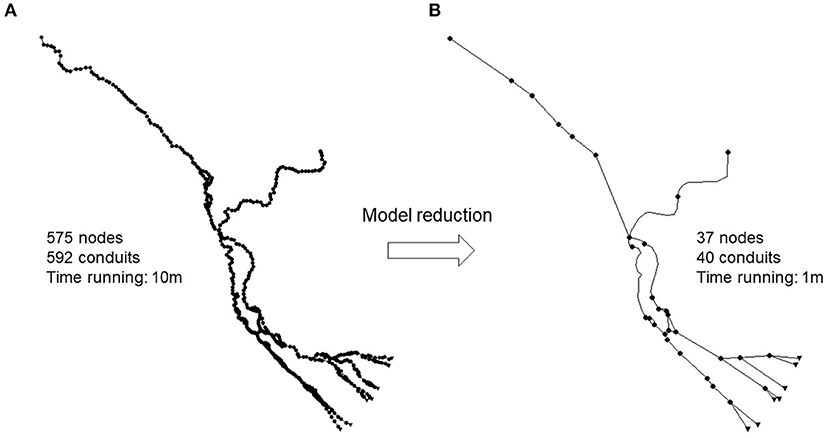
Figure 4. The detailed 1D SWMM model (A) and the simplified 1D SWMM model (B) for the Mekong Delta. The simulation time for a 1-year simulation corresponding to the detailed and simplified model is 10 and 1 min, respectively.
The simplification of the model (e.g., removing small and medium distributaries, not considering the irrigation systems along the river) for the entire Mekong Delta leads to a degradation of the precision and accuracy of its results at locations far away from Can Tho, specifically at Chau Doc and Tan Chau (Ngo et al., 2018). Moreover, the simplified model is a 1D model, which cannot accurately simulate flood propagation, especially on floodplains, even though the floodplains have been included in cross-sections and assigned appropriated roughness coefficients. Therefore, the simplified 1D model is used here as a type of surrogate model for simulating water levels along the main rivers, bearing in mind that it may not provide reliable information on water levels and inundation dynamics in areas that are far away from Can Tho or located some distance from the main rivers on the floodplains.
In the application here, 7 years (2000–2006) of observed flow data at the upper boundary location “Kratie” were used as forcing for the above described simplified 1D model of the Mekong River. As 7 years of data is not sufficient to derive probabilistic results, here a synthetic streamflow generator developed by Giuliani et al. (2017) was used to generate 1,000 synthetic flow time series (each 1 year long) for each scenario in Table 2 (current and future). While it is acknowledged that this approach does not fully replace the utility of long term observational data, due to the probabilistic nature of the streamflow generator, it nevertheless captures the statistical variation of upstream flows compared to simply using the 7 years of available data, which is important in flood hazard modeling.
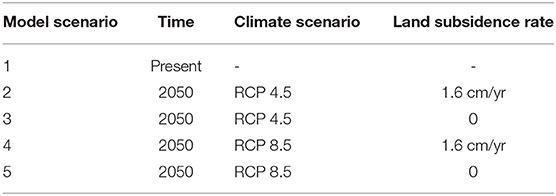
Table 2. Model scenarios adopted with the 1D/2D coupled flood PCSWMM model.
For the future simulations that include the effects of climate change, here we used the annual river discharge projections of Hoang et al. (2016) under RCP 4.5 and 8.5 as the basis for generating the future river flow data. Hoang et al.'s (2016) projections indicate that annual river flow for RCP 4.5 and RCP 8.5 at Kratie in 2050 are expected to change between 3 to 8% and −7 to 11%, respectively, relative to the 1971–2000 baseline period adopted in that study. Future river flow data were generated by combining the flow of each year in 7 years of observed flows used here with a randomly selected % change of these projected changes in the flow corresponding to each RCP. Subsequently, the streamflow generator was used to generate 1,000 future riverflow time series (each 1 year long) corresponding to RCP 4.5 and RCP 8.5.
Thirty 6 years (1979–2014) of model simulated extreme sea level (tide + surge) data were extracted at the Mekong river mouths (Tran De, Ben Trai, and An Thuan) from the GTSR data set presented by Verlaan et al. (2016) to use as the downstream boundary condition of the 1D model.
For the future simulations, the above present-day extreme sea levels from the GTSR data were combined with the 2050 regional sea level rise projections presented by the Viet Nam Ministry of Nature Resource and Environment (MONRE, 2016) under RCP 4.5 and RCP 8.5 for the region containing the aforementioned river mouths. The projected regional sea level rise in the area by 2050 (relative to 1986–2005) for RCP 4.5 and RCP 8.5 are 13–32 cm and 16–35 cm, respectively.
The simplified 1D model was then executed with 1 year time series of the above described boundary conditions to generate river water level at Can Tho. In all, 36,000 simulations were undertaken corresponding with the total number of possible combinations of upstream (1,000 1-year time series of riverflow) and downstream (36 1-year time series of sea level) boundary conditions, resulting in 36,000 water level time series data (each 1-year long) at Can Tho per considered scenario (current and future).
From the 36,000 1-year long water level time series at Can Tho, the maximum water level of each year in the 36,000 simulation years was extracted and used to fit an extreme value distribution (Gumbel or Type I). The water level at Can Tho corresponding to each return period for each scenario (current or future) was determined based on the fitted Gumbel distribution.
Apart from the maximum water levels, it is also important in flood hazard modeling to represent the shape of hydrograph around the peak water level. To achieve this, here we used a threshold-based method, as is commonly used in flood frequency analysis (Lang et al., 1999; Bezak et al., 2014). A threshold value of 2.15 m (i.e., maximum measured water level at Can Tho, see Figure 2) was adopted here and annual water level time series (of the full 36,000 series) that contain at least one water level value exceeding 2.15 m were identified.
For each peak flood value, 24 h long time series around each peak value (12 h earlier to 12 h later) were extracted. Due to there can be many different hydrograph shapes whose peak coincides with a design water level. Such time series each can have a unique shape, requiring, in principle, 1D/2D simulation run for each such time series. Since 1D/2D coupled model is the most expensive in terms of computational effort, this is a practically impossible task. This was circumvented by first, identifying a small number of representative flood hydrograph patterns and assuming that all flood hydrograph shapes with peak value H can adequately be represented by a hydrograph shape with peak value H can adequately be represented by a hydrograph shape Fi, H (t) with unique hydrograph shape patterns i = {1,…, n}. For each pattern i, first the hydrograph shape having the maximum peak (called is typical flood hydrograph shape) within that pattern was selected as a representative pattern (fi (t)). Fi,H (t) is calculated as follow:
Where tmax is the time at which the maximum value in representative pattern occurs.
Several different flood parameters can be used to quantify the flood hazard, including inundation level, flow velocity, frequency of flooding, and flood duration, etc. (Ramsbottom et al., 2003; Ward et al., 2011; De Moel et al., 2015). Of these, inundation level (water depth) and flow velocity are considered the most important parameters (Penning-Rowsell et al., 1994; Wind et al., 1999; Merz et al., 2007; Kreibich et al., 2009). However, due to the relatively flat terrain combined with small inundation depths in Can Tho, the effect of the flow velocity is expected to be small compared to that of the flood inundation depth (Dinh et al., 2012). While in agricultural contexts as well as indirect damages (e.g., loss of livelihoods and nuisance), the duration plays an important role, in the context of urban property damage (e.g., buildings, furniture, and road), inundation depth is much more important than the duration. Hence, this study considers inundation levels as the main indicator of the flood hazard in the study area.
To simulate the effect of flood drainage network on flooding in the study area, here we used the detailed 1D urban model developed for the study area by Huong and Pathirana (2013). This model comprises 479 junctions, 612 conduits, 48 outfalls, and 303 sub-catchments (Figure 5).
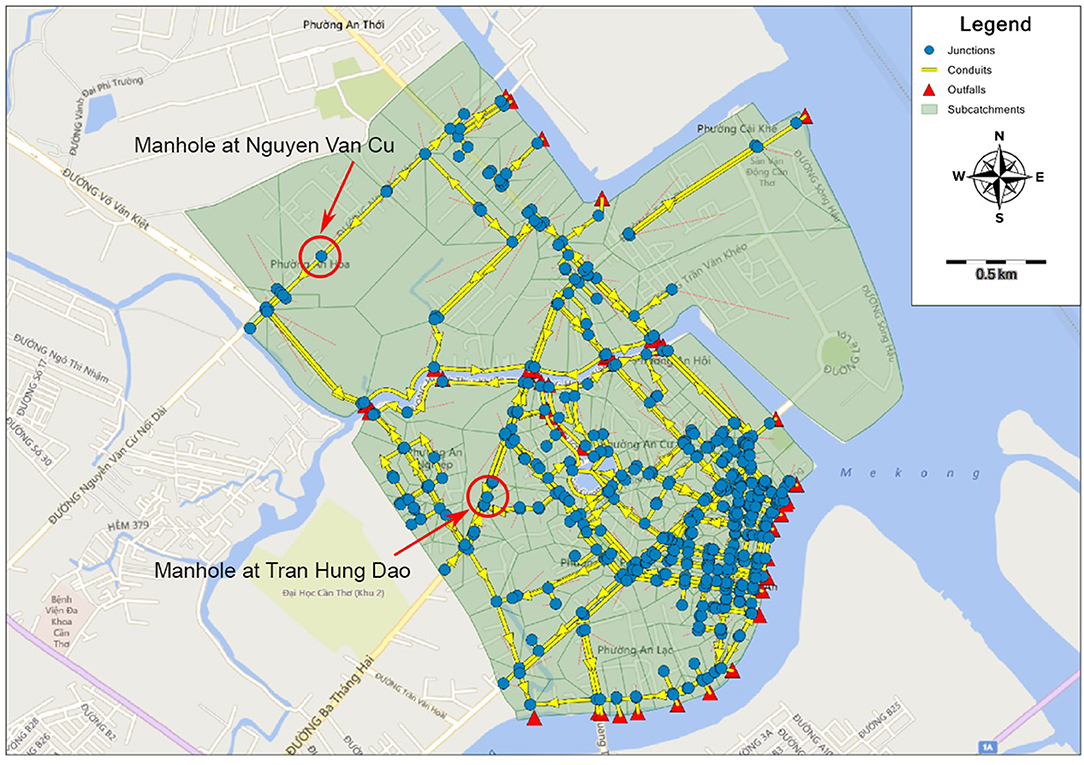
Figure 5. The detailed 1D urban flood drainage model for the study area developed by Huong and Pathirana (2013) (Base map is from Bing Maps Road© Microsoft).
The model parameters were calibrated for the flood event on the 17th of October 2016 based on the observed water depths (at 1-min measurement interval) in the manholes at Nguyen Van Cu and Tran Hung Dao streets (Figure 5). These are the only available observed flood water depths in the study area. Here, SWMM5-EA software (Pathirana, 2014), was used to calibrate the most uncertain parameters, i.e., Manning's roughness coefficient of conduits, Manning's roughness coefficient of the previous/impervious surfaces of the sub-catchments and the slope of the sub-catchments. The detailed 1D urban model performance was evaluated by using the NSE indicator, which determines the relative magnitude of the modeled variance compared to the observed data variance (Nash and Sutcliffe, 1970). NSE is computed as shown in Equation (1) in Appendix.
The calibrated 1D urban model was then used to establish an integrated 1D/2D model using PCSWMM software (http://www.chiwater.com/Software/PCSWMM). This 1D/2D coupled model was validated based on inundation depths and flood extent as given in the report of Can Tho Water Supply and Drainage Construction Company for the same flood event on the 17th of October 2016.
Flood simulations were undertaken for water levels with return periods ranging from 0.5 to 100 year obtained from the flood frequency analysis described in section Strategic Use of Limited Input Data for each model scenario in Table 1. A 15 m resolution DEM developed by the Vietnam Institute of Meteorology, Hydrology, and Environment was used in all simulations. In the simulations that include land subsidence, an average subsidence rate of 1.6 cm/year for the entire Mekong Delta (Erban et al., 2014; Minderhoud et al., 2015) was used to consider the effect of land subsidence on the flood hazard at Ninh Kieu district. Being an urban area with generally less groundwater recharge and potentially more groundwater pumping combined with the contribution of other possible human-induced drivers (e.g., loading by infrastructure), it is very likely that Can Tho's subsidence rate is much higher than the average for the Mekong Delta. Although, in recent studies by Minderhoud et al., the average subsidence rate in the Mekong Delta was estimated to be 1.1 cm year−1 (Minderhoud et al., 2017) and 1.31 cm year−1 corresponding to B2 scenario (no-mitigation with a steady annual increase of 4% of the 2018 volume) (Minderhoud et al., 2020). However, this subsidence rate is likely to increase in the future due to increased groundwater demand (Minderhoud et al., 2017, 2020). Thus, this study used a subsidence rate of 1.6 cm year−1 in considering the effect of land subsidence on the flood hazard at Ninh Kieu district in the future.
For all model scenarios indicated in Table 1, flood inundation maps were first developed for water level return periods ranging from 0.5 to 100 year (eight inundation maps for each model scenario). The flood maps thus obtained were added into ArcMap under shapefiles, which were then converted to raster files to extract the maximum inundation depths (during the flood events) corresponding to each return period by using the “Polygon to Raster” tool in Conversion tools of ArcToolbox. Subsequently, maximum inundation depths at all grid cells were aggregated to generate flood hazard maps for each return period.
Figures 6A–C show flood frequency curves at Can Tho for the present, and for 2050 corresponding to RCP 4.5 and RCP 8.5, obtained from the Gumbel distributions that were fitted to the modeled maximum water level at Can Tho based on the results of 1D hydrodynamic model described in Section Model Reduction. Table 3 shows the water level at Can Tho with return periods ranging from 0.5 to 100 year determined from the flood frequency analysis for each model scenario.
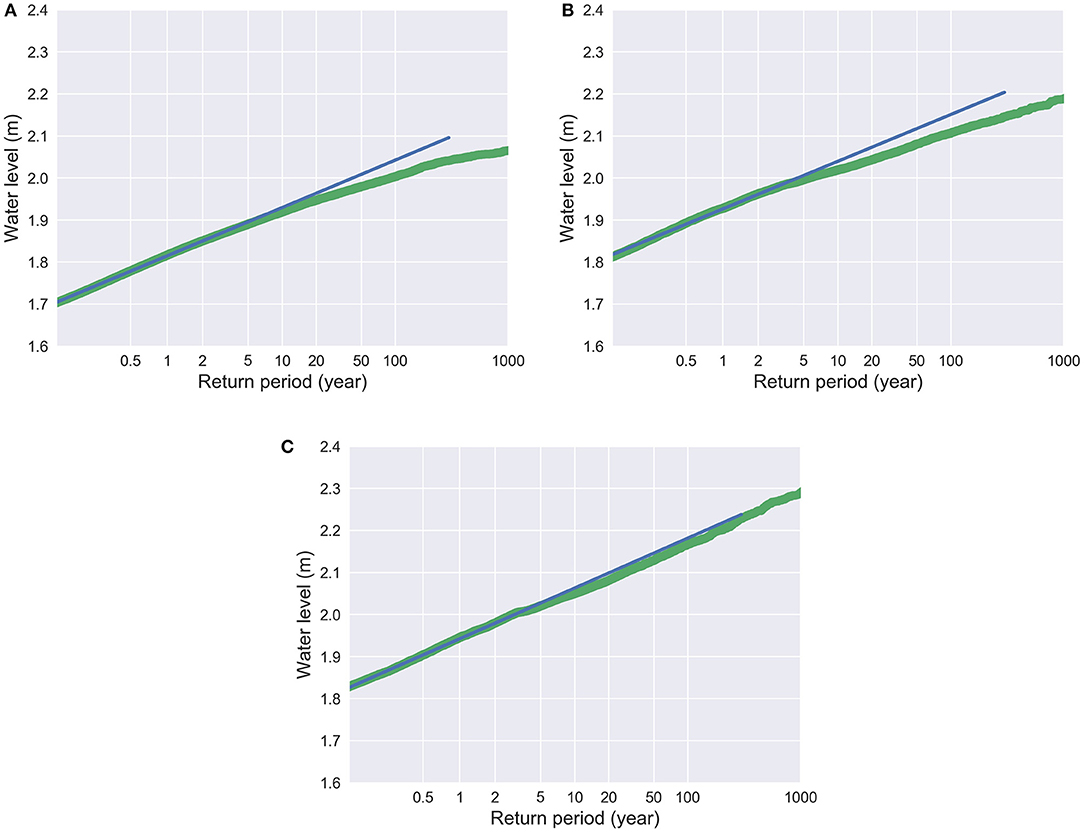
Figure 6. Flood frequency curves at Can Tho for Present (A), and for 2050 corresponding RCP 4.5 (B) and RCP 8.5 (C). Blue line indicates the fitted Gumbel distribution while the green line indicates 1D hydrodynamic model output.
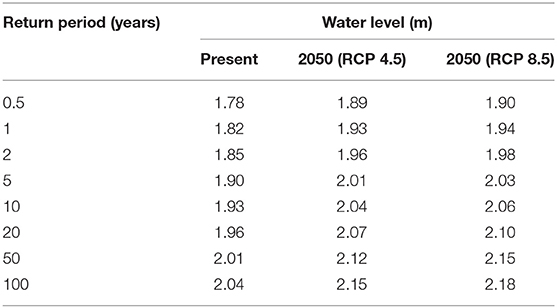
Table 3. Water levels at Can Tho corresponding to different return period for Present, and for 2050 under RCP 4.5 and RCP 8.5.
The calibration results for the 1D urban drainage model for the flood event of October 2016 are shown in Figure 7. The NSE indicator values between the measured and simulated (present conditions) water depths in the manholes at Nguyen Van Cu and Tran Hung Dao streets is 0.75 (good) and 0.95 (very good), respectively. Thus, the 1D urban drainage model performance for the study area can be considered to be sufficiently accurate.
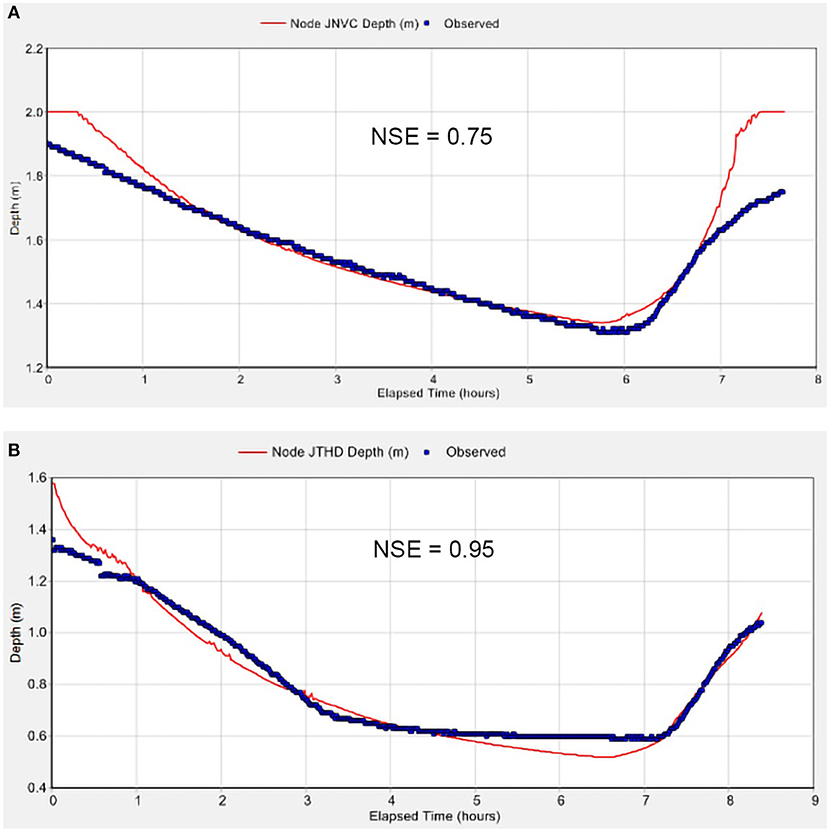
Figure 7. Comparison between simulated and observed water depths in the manholes at Nguyen Van Cu (A) and Tran Hung Dao (B) streets on October 17, 2016.
The calibration of 2D results (inundation extent and depth) proved to be much more challenging due to the lack of observed data. An indirect visual approach was used to compare observed spot values of inundation heights with simulated depths. The validation results for the 1D/2D coupled model for the flood event of October 2016 are shown in Figure 8. Simulated flood extent and inundation depths at many different streets in Ninh Kieu district are presented in the description of the flooding situation and observed inundation depths in the report of Can Tho Water Supply and Drainage Construction Company regarding this event. The comparison shows a good agreement between the simulated flood extent and inundation depths and observations.
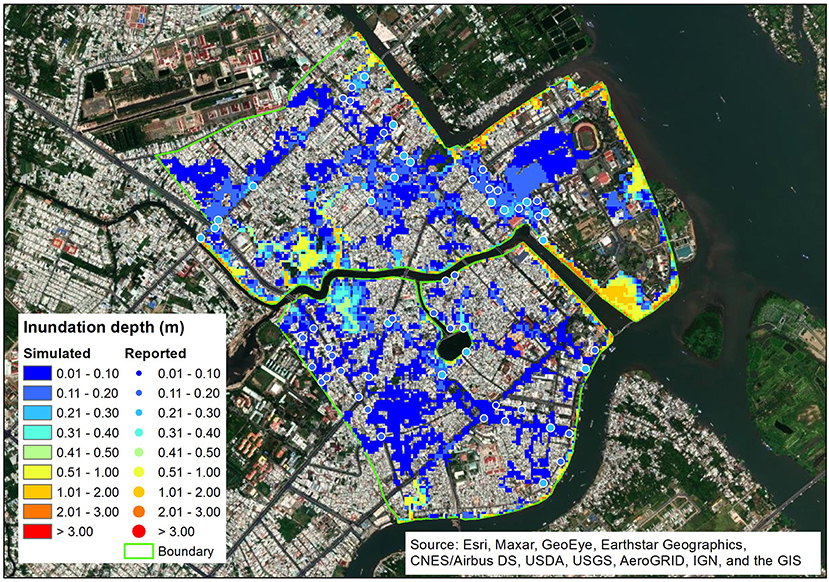
Figure 8. Flood inundation map (flood extent and the maximum simulated inundation depth) and the measured inundation depth (dots) at streets in Ninh Kieu district corresponding to the flood event October 2016.
Figure 9 shows the shape of the 24-h time series of all the modeled extreme water level (i.e., peaks greater than the threshold value of 2.15 m) time series at Can Tho (of all 36,000 annual time series) corresponding to RCP 4.5 and RCP 8.5. There are two dominant hydrograph shapes in the two RCPs considered (indicated by Pattern 1 and Pattern 2 in Figures 9A,B), but it is clearer in RCP 8.5.
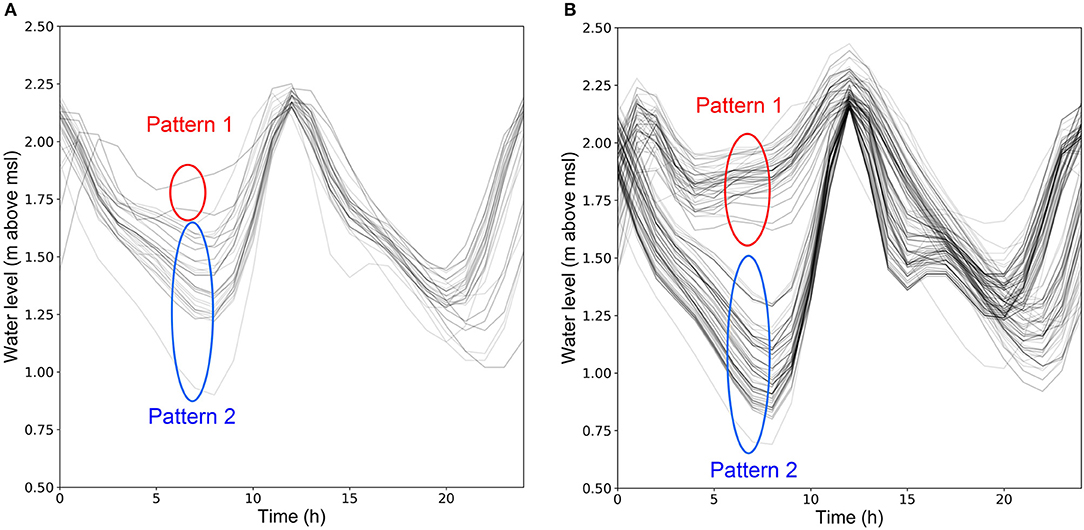
Figure 9. Analysis of 24-h time series around modeled peak water levels indicating two flood hydrograph patterns in the future scenario, (A) 2050 (RCP4.5), (B) 2050 (RCP 8.5).
Equations (1) was as used to calculate the 24-h long water level time series for a water level corresponding to 100-year return period (Table 3) for Pattern 1 and Pattern 2 to create the 24-h boundary condition time series for the 1D/2D flood model to examine the response of different river water level hydrograph shapes on flooding.
The results (Figure 10) indicate that flood extent and inundation depths associated with Pattern 1 are greater than those associated with Pattern 2. The inundated area (for cells with maximum inundation depths ≥ 0.02 m) corresponding to 100-year return period water level for RCP 4.5 and RCP 8.5 with Pattern 1 are 1.96 and 2.30 km2, respectively. The corresponding flooded areas for Pattern 2 are lower at 1.41 and 1.81 km2. Therefore, in this study, the typical water level time series following Pattern 1 above was used to calculate flood hydrograph shape for each water level corresponding to each return period (Table 3) for each scenario based on Equation (1) to create the 24-h boundary condition time series for the 1D/2D. This was a necessary simplification to reduce the complexity and computational burden of computing flood inundation.
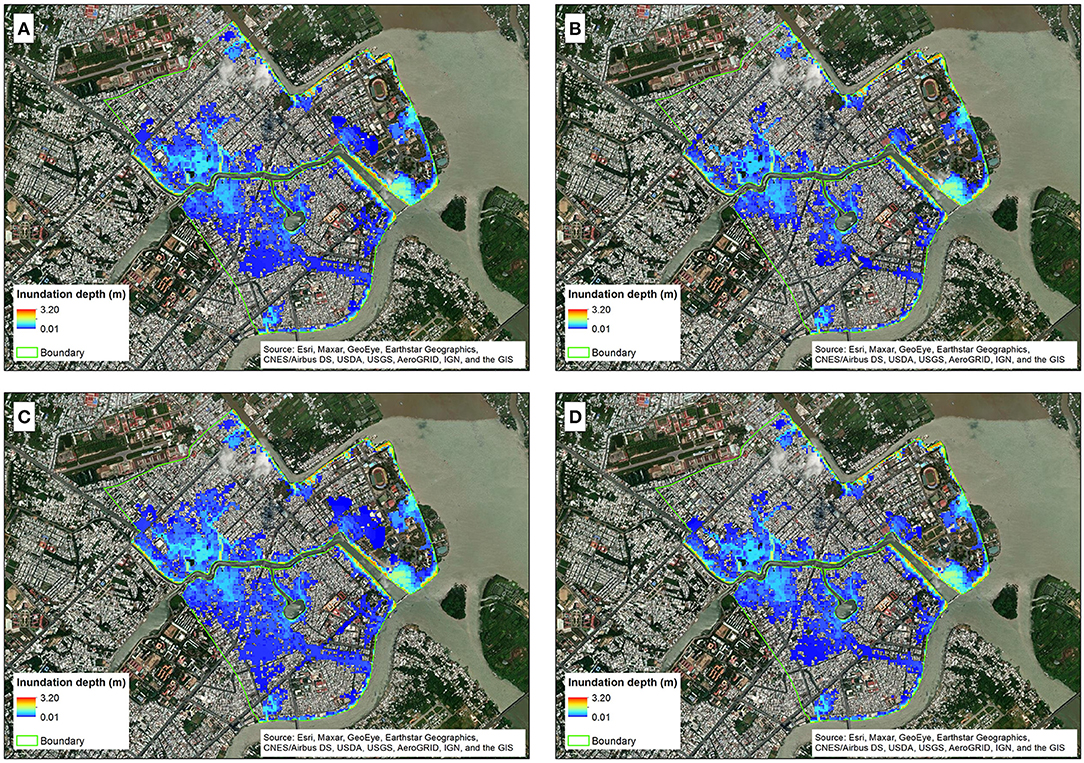
Figure 10. Flood hazard maps (i.e., maximum flood depths) for the 100-year return period of water level for hydrograph shape Pattern 1 (left) and Pattern 2 (right) under RCP 4.5 (A,B) and RCP 8.5 (C,D) (without land subsidence). The inundated area (for cells with maximum inundation depths ≥ 0.02 m) for RCP 4.5 and RCP 8.5 corresponding to Pattern 1 are 1.96 and 2.30 km2, respectively, while for Pattern 2 are 1.41 and 1.81 km2, respectively.
Figure 11 shows flood hazard maps corresponding to 5 and 100 year return period water levels (at Can Tho) for the present (model scenario #1), and 2050 under RCP 4.5 and RCP 8.5 (without land subsidence) (model scenarios #3 and #5, respectively). The remaining flood hazard maps which correspond to 0.5, 1, 2, 10, 20, and 50 year return period water levels for these scenarios are shown in Appendix Figures A1–A3.
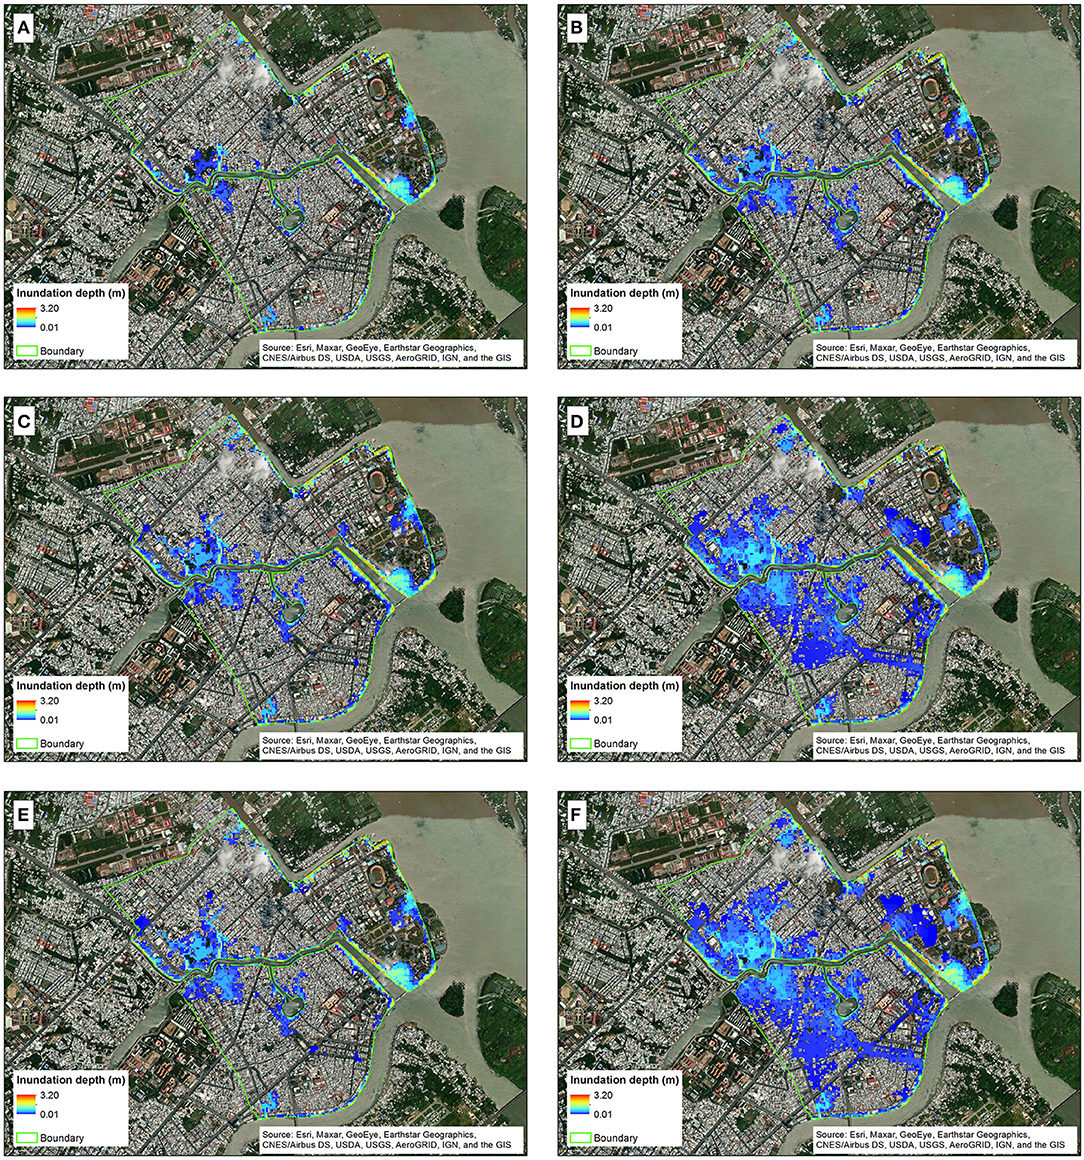
Figure 11. Flood hazard maps corresponding to 5 year and 100 return period of water level for the present (model scenario #1) (A,B), 2050 under RCP 4.5 (model scenarios #3) (C,D), and RCP 8.5 (model scenarios #5) (E,F), respectively.
Figure 12 and Appendix Figure A1 show that, under present conditions, 4.9% of the study area will be flooded even with the 0.5 year return period water level at Can Tho, especially some areas along the canals and lakes in the city that are connected to the Can Tho River and Cai Khe channel. Notably, there is a large area of Cai Khe ward (shown by the red circle of Appendix Figure A1a), which is located close to the junction of Hau river, Can Tho river and Cai Khe channel (see Figure 1C) that is inundated under this condition.
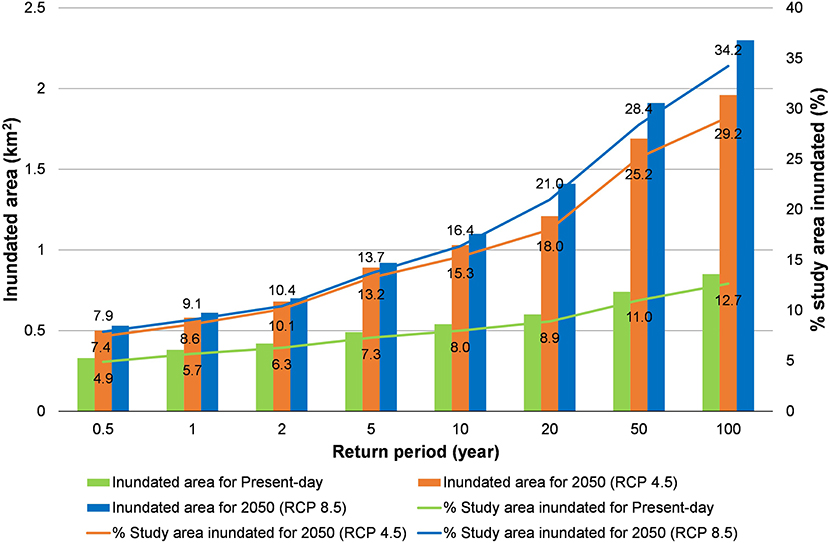
Figure 12. The inundated area and percentage of the flooded area relative to total study area (also indicated by numerics along the solid lines in this figure) corresponding to each return period of water level (without land subsidence).
At the other higher end of the modeled return periods under present conditions, Figures 11B, 12 show that the inundated area with a 100 year return period water level at Can Tho, is more than double that with a 0.5 year return period water level at Can Tho increasing from 4.9% (0.5 year RP) to 12.7% (100 year RP).
For the future modeled scenarios (without land subsidence; model scenarios #3 and #5), the % inundated areas for the 100 year RP water level at Can Tho are 29.2 and 34.2%, under RCP 4.5 and RCP 8.5, respectively, representing more than a doubling of the inundated area by 2050, relative to the present.
Flood hazard maps corresponding to 5 and 100 year return period water levels (at Can Tho) for the future scenarios (2050—under RCP 4.5 and RCP 8.5) that do take into account land subsidence (model scenarios #2 and #4) are shown in Figure 13. The remaining flood hazard maps which correspond to 0.5, 1, 2, 10, 20, and 50 year return period water levels for these scenarios are shown in Appendix Figures A4, A5. The difference is immediately visible with a large increase in the inundated area compared to when land subsidence is not taken into account.
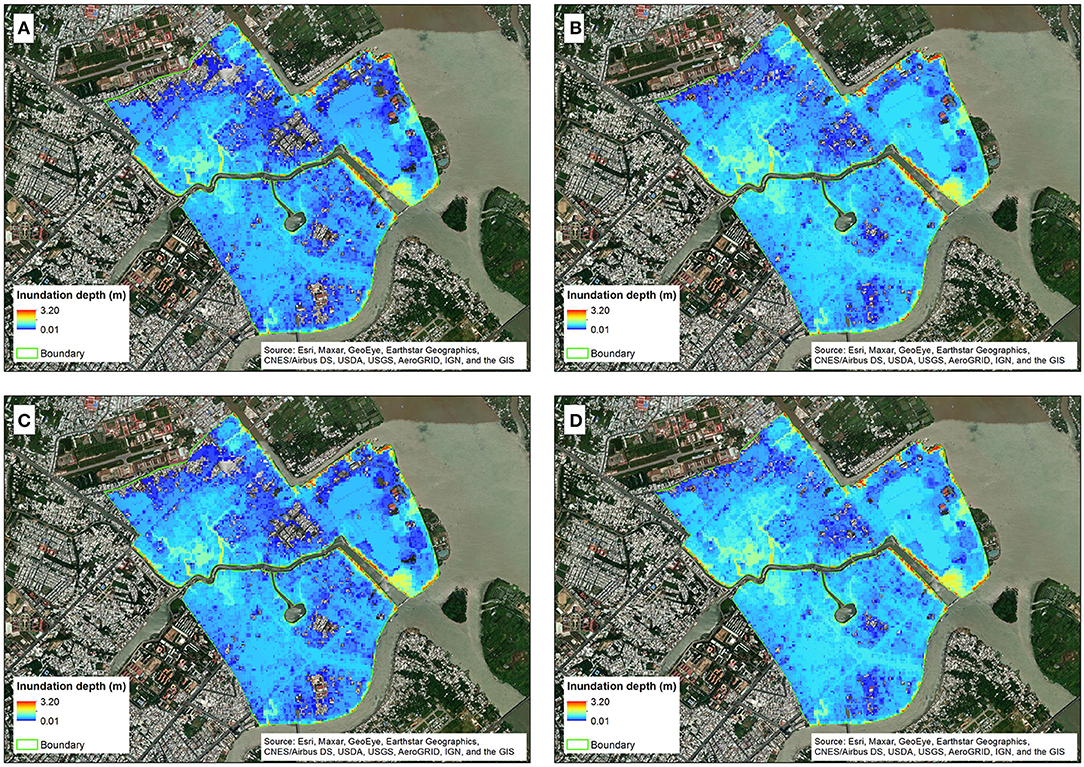
Figure 13. Flood hazard maps corresponding to 5 year and 100 return period of water level for 2050 under RCP 4.5 (model scenario #2) (A,B), and RCP 8.5 (model scenarios #4) (C,D), respectively.
Figure 13 show severe flooding in a vast majority of the study area for all return periods of water level. The percentage area flooded by the 0.5 year RP water level under RCP 4.5 and RCP 8.5 are 73.4 and 75.3%, respectively (Figure 14), almost a 10-fold increase relative the comparable projections without land subsidence and a 15-fold increase relative to present-day flooding due to the same RP water level. For the 100 year RP water level, the percentage area flooded under RCP 4.5 and RCP 8.5 projected to be 95.2 and 96.4%, respectively, representing a 3-fold increase relative to the comparable projections without land subsidence and a 8-fold increase relative to present-day flooding by the same RP water level. It is also noteworthy that the maximum inundation depths for the 100-year return period water level under RCP 4.5 and 8.5 are not much different at 3.17 and 3.20 m, respectively.
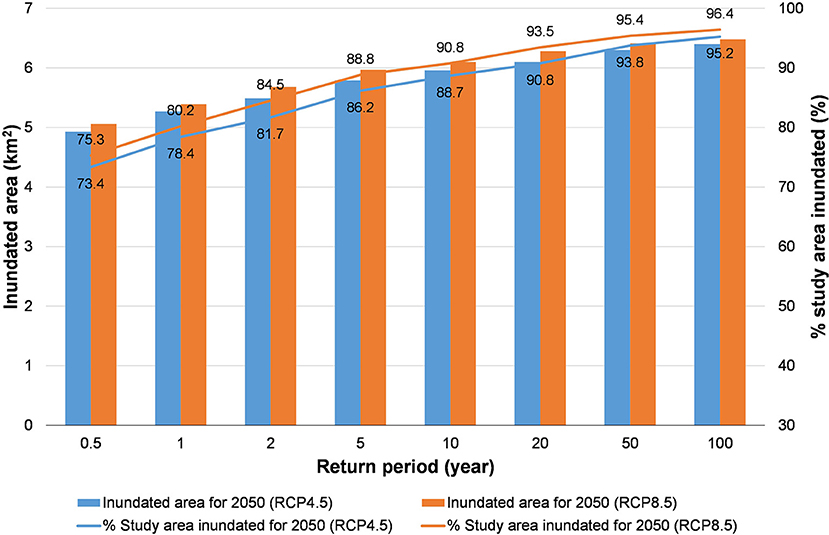
Figure 14. The inundated area and percentage of the flooded area relative to total study area (also indicated by numerics along the solid lines in this figure) corresponding to each return period of water level for model scenarios (including land subsidence).
The above results highlight that while climate change will increase the flood hazard in the study area, land subsidence has a much greater effect than climate change driven variations in river flow on the flood hazard in the study area. Furthermore, clearly, the existing urban drainage network is not able to effectively drain flood waters even for present-day conditions, and this will be felt more severely in the coming decades. A significant reduction in groundwater extraction, which is the main cause of land subsidence in Can Tho (Erban et al., 2014) combined with a new and substantially efficient urban drainage network may be able to mitigate the projected flood hazard in the study area. It is recommended that the efficacy of these mitigation measures be investigated in detail in future modeling studies.
In this section, we discuss three aspects that are important in interpreting the findings of this paper: First, we explain the reason for using a short period of flow data in conjunction of a synthetic streamflow generator as opposed to a longer duration of observed data. Next, the rationale and limitations of using a probability distribution function (Gumbel distribution in this case) instead of empirical probabilities are discussed. There were several studies that discussed flood hazard/risk of Can Tho city. Of particular relevance is the study by Apel et al. (2016). So, finally we compare the current study with this past study.
The most obvious reason to use synthetic hydrology stems from the fact that there is little or no data for the system (Lamontagne, 2015). This study used the synthetic streamflow generator to generate 1,000 annual synthetic river flow time series based on 7 years of discharge data at the upper boundary point, Kratie.
The river flow data is publicly available (e.g., the website of the Mekong River Commission) covering periods 1924–1970 and 2000–2018. Therefore, the rationale for using short data series to generate synthetic river flow data series in this study need to be justified.
The purpose of this study was to quantify climate change driven variations in the flood hazard between the present period and future time periods. Therefore, it is important to ensure that the selected baseline period (and baseline simulations) are in fact representative of the present-day period. This is important because, not only has the climate change signal emerged in several climate variables over the last 50 years or so (i.e., signal is clearly discernible from the inter-annual variability) (King et al., 2015), but also human activities (e.g., reservoirs) have led to noticeable changes in the natural regimes that may have existed earlier in the twentieth century (see Ranasinghe et al., 2019 for example in China). Both of these phenomena may change the probability distribution of climate variables over time (Chadwick et al., 2019).
The discharge time series at Kratie was analyzed, based on the 66 years of data (1924–1970 and 2000–2018). The analysis showed that the peak discharge at Kratie has indeed noticeably decreased over time, and particularly after 2000 (Figures 15, 16), likely due to irrigation expansion and upstream dam construction in recent years (MRC, 2010; Piman et al., 2013).
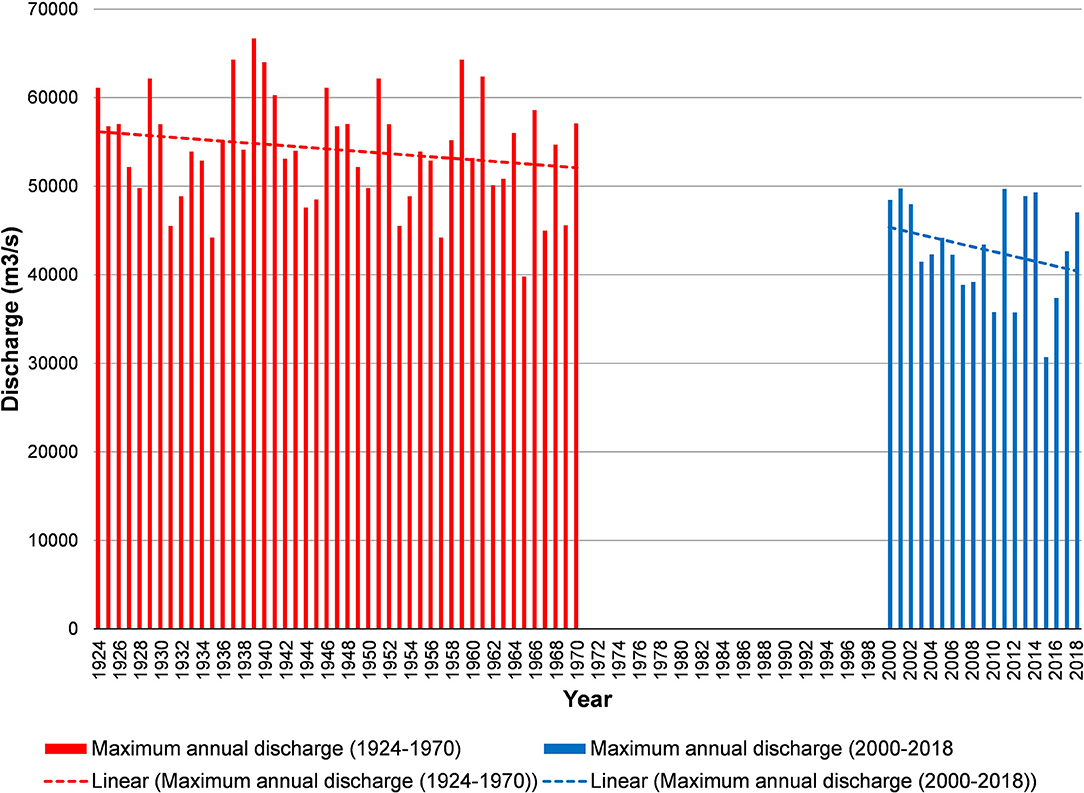
Figure 15. Maximum annual discharge at Kratie from 1924 to 1970 and 2000 to 2018.
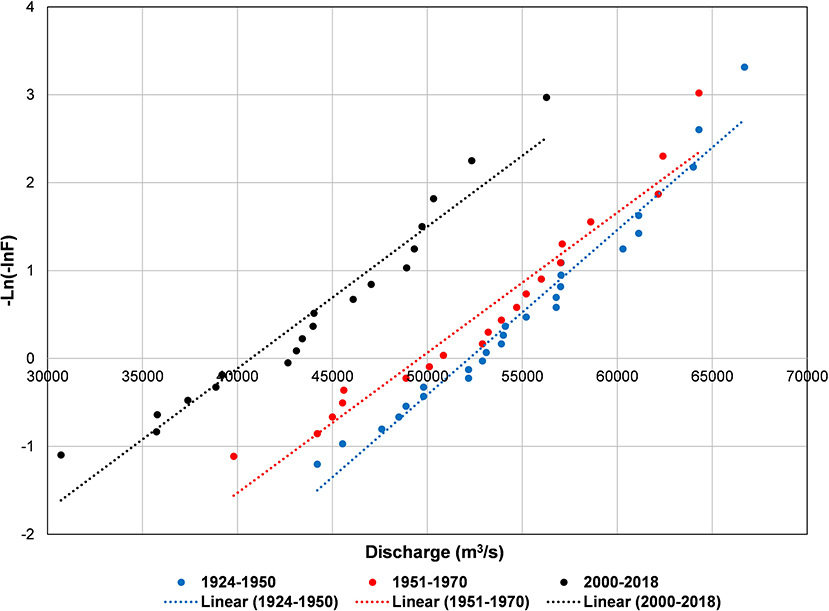
Figure 16. Gumbel distribution of discharge peaks at Kratie corresponding to three periods (1924–1950), (1951–1970), and (2000–2018).
The use of the full discharge time series at Kratie to develop flood frequency curves is therefore inappropriate in the present study which aims to quantify climate change driven variations in the flood hazard, and further, risk relative to present-day conditions, in order to inform the development of climate-resilient flood risk reduction measures for the urban center of Can Tho city. The use of the full observed discharge data at Kratie, including pre-2000 flow with large flood peaks, can lead to an overestimation of flood hazard and risk. Therefore, for the purposes of this study, only the post-2000 discharge data were used to represent baseline conditions.
Figure 17 shows several representations of synthetic flow time series that are generated based on the 7 years of observed discharge data used here, and their corresponding statistics and extreme values.
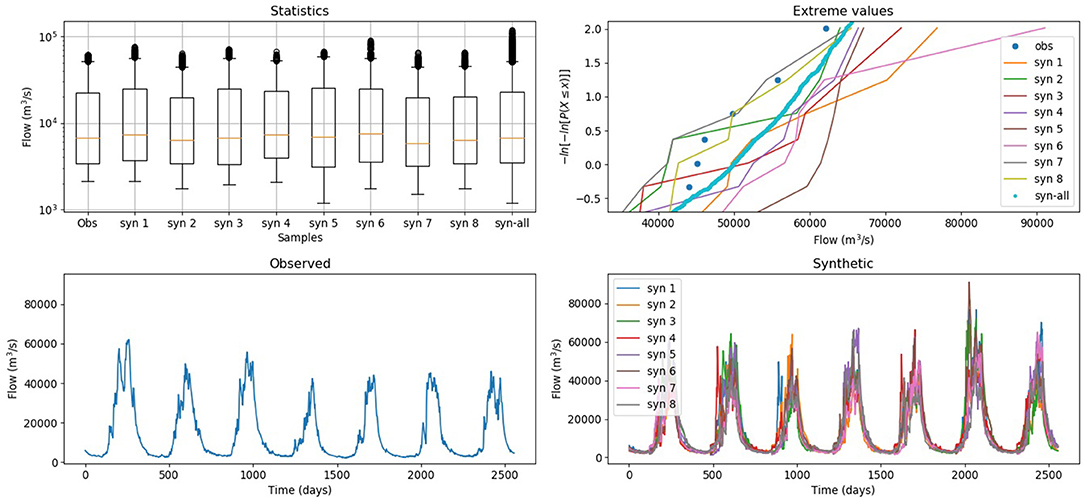
Figure 17. Several representations of synthetic flow time series are generated based on seven years of observed discharge data, and their corresponding statistic and extreme values.
In all, 1,000 synthetic flow time series were created, which were then combined with 36 sea level time series to have 36,000 different water level time series at Can Tho. Using these 36,000 water level time series, does not add any information that was originally not present in the observed data. However, as the sea-level and river flow time series are independent of each other, these combinations of statistical realizations of streamflow with observed sea-level are assumed to improve the joint-probability manifestation in the resulting longer time series. It should be noted that the synthetic generator is not the only approach to achieve this. For example, a time-shifting one set of series against the other may give a similar outcome.
In this study, Gumbel distribution was used to model this distribution of the maximum water levels of the water level time series to select design water levels corresponding to each return period. However, there is a difference in probabilities between the empirical and distribution quantiles corresponding to the present and RCP 4.5 scenarios (Figures 6A,B). Using the log-log-linearity of the Gumbel distribution might introduce a bias to the very extreme values. In contrast, using the empirical distribution might result in less information loss. However, it will include all the random artifacts in the observed (and generated) data. Additionally, such an analysis needs a long series of data that are largely devoid of non-stationarities (or them being carefully removed). The flow database used here, which was limited in length due to the climate change impact focus of the study does not provide the necessary data quality or quantity to do such an analysis. Therefore, using the Gumbel distribution here is more reasonable in our view. Additionally, the difference in water levels corresponding to large return periods between the empirical and distribution quantiles is small. Furthermore, the Gumbel distribution was well-fitted in scenario RCP 8.5 with higher water levels (Figure 6C).
Computation of present-day flood hazard and probabilistic flood maps using 2D models for Ninh Kieu district has also been done before by Apel et al. (2016). However, the approach adopted in the present study differs from that adopted in previous studies and has added value by improving the computation of flood hazard of Ninh Kieu district. Furthermore, this study takes a step forward from previous studies, being the first study to probabilistically compute future flood hazard in the study area under climate change. The main value additions of this study, compared to Apel et al.'s (2016) study, are discussed below.
One of the biggest differences between the present study and that reported by Apel et al. (2016) is the length of the river discharge time series used for flood frequency analysis. This difference is, in part, due to the different aims of the two studies: Apel et al.'s (2016) aim was to develop flood hazard maps for the present-day while the focus of the present study is to quantify climate change driven variations in the flood hazard.
Consistent with the aim of their study, Apel et al. (2016) used flood frequency curves at Kratie of Dung et al. (2015), which were constructed based on the longest possible time series of river discharge at Kratie, spanning 88 years (1924–2011). In contrast, as mentioned in Section Reliability of Using the Synthetic Streamflow Generator and Short Discharge Data, the purpose of the current study was to quantify climate change driven variations in the flood hazard between the present period and future time periods. Therefore, it is important to ensure that the selected baseline period (and baseline simulations), is in fact representative of the present-day period.
While Apel et al.'s (2016) introduced flood probabilities at Kratie into a combined large-scale inundation model (arguably a more realistic representation than the current 1D model) for the entire Mekong Delta (Dung et al., 2011) with a (more detailed) 2D representation of the Ninh Kieu district. Floods strongly vary over space (Nied et al., 2017; Vorogushyn et al., 2018). This spatial variability of flooding would influence the flood levels at Can Tho which is about 430 km downstream of Kratie. Moreover, the river water level at Can Tho and the resulting flood extent and inundation depth in the Ninh Kieu district are affected by the downstream sea level, especially high tides and storm surges (Huong and Pathirana, 2013). Thus, using flood probabilities at Kratie to develop probabilistic fluvial flood hazard maps for the Ninh Kieu district without considering the effects of spatial variation of flood probabilities and downstream sea level could lead to some uncertainties in the flood hazard computed at Can Tho. The present study overcomes these shortcomings by undertaking 2D flood modeling for Ninh Kieu district based on flood frequency analysis at Can Tho (as opposed to Kratie) and by taking into account both river discharges and downstream sea level in computing the river water levels near Can Tho.
Comparison of the results between the two studies shows substantial differences in the flood extent corresponding to different return periods for present-day. The inundated area corresponding to 2, 5, 10, 20, 50, and 100 year return period in Apel et al.'s (2016) study was 2.37, 3.33, 3.71, 4.30, 4.98, and 5.29 km2, respectively. In contrast, the inundated area for the present-day in this study was 0.42, 0.49, 0.54, 0.60, 0.74, and 0.85 km2, respectively. Apart from the two key methodological differences between the two studies highlighted above, there are also two other reasons that may have led to these differences in estimated present-day flood extents.
While the present study explicitly accounted for the effect of the urban drainage system in Ninh Kieu district on flooding, Apel et al. (2016) considered the entire district to be impervious. This has significant implications in terms of flood hazard estimations. The river water level in Can Tho varies following the downstream tidal fluctuation (semi-diurnal tide), as the urban center of Can Tho (Ninh Kieu district) is connected with the Hau River and Can Tho River via the open sewer channel and urban drainage system. Therefore, for, e.g., if during the flood phase of tide, the river water level rises above the lowest elevation of the top of the manholes in the city, although without necessarily being higher than the crest elevation of the river embankment, this will lead to flooding in the city center due to backwater flow through the urban drainage/sewer systems (Figure 18) (note: while the drainage outlets have flap-gates provided, they are largely dysfunctional due to solid waste blockages and lack of maintenance in Ninh Kieu district). This is consistent with the flood situation in Can Tho, which was described by Nguyen (2016) (http://www.cantholib.org.vn:84/Ebook.aspx?p=27B9F975353796A6E64627B93B65654746C6B65637B91B857557). When the river water level drops during the ebbing phase of the tide, the inundation level is also reduced mostly as flood water is drained through the urban drainage/sewer systems. Hence, incorporating the effects of the flood drainage system, as done in the present study is crucial for correctly estimating flooding in this study area.
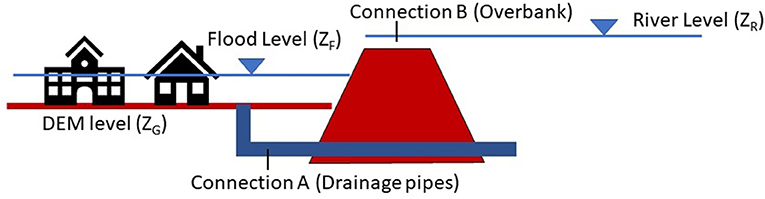
Figure 18. Urban flood water in Can Tho can be hydraulically connected to the river by two means: (A) Numerous drainage pipe outlets, (B) Surface (overbank).
Both studies used the DEM presented by Huong and Pathirana (2013) for the study area as the input data of the 2D model. However, stemming from the above mentioned lack of consideration of the effects of the urban drainage/sewage systems, Apel et al. (2016) adjusted the elevation of the DEM data by subtracting 0.5 m from the original DEM in order to achieve an acceptable validation of their 2D model. Apel at al. (2016) justify this decision referring to the two large fluvial flood events that occurred in 2011, with “extraordinary” peak water levels, but “the banks as given in the DEM were not overtopped, and thus no inundation would occur”. However, revisiting the data of water levels at Can Tho station in 2011, used in Ngo et al. (2018) to validate the 1D simplified model for the entire Mekong Delta, the peak water levels of these two events occurred on the 28th of September and 27th of October with peak water levels of 2.04 and 2.15 m, respectively. Both these water levels are higher than the bank elevation extracted from the original DEM data (~1.9–2.0 m) at the surveyed point in Apel et al. (2016). Thus, these two flood events would, in reality, have caused flooding in the Ninh Kieu district by both backflow through the urban drainage system and by direct overtopping of the river embankment. Urban floods like those of Can Tho are complex and highly non-linear processes. Therefore, compensating with a different variable (DEM datum) to address the issue of neglecting another (numerous connections between river and the city below the embankment level) does not result in reliable model performance. The lowering of the entire DEM is therefore the likely cause for the substantially larger present-day flood extents estimated by Apel et al. (2016), relative to those computed in the present study.
An efficient modeling approach that combines a simplified 1D hydrodynamic model with a detailed 1D/2D coupled model was developed and demonstrated at Can Tho city in the Mekong Delta. Key features of the modeling approach include (a) Model reduction—a substantially simplified 1D model for the entire Mekong Delta (area of 40,577 km2) which can simulate 1 year of riverflow (with an hourly time step) in under 60 s, (b) strategic use of limited input data (7 years data of river flow) to generate 1,000 time series data of river flow at Kratie using the synthetic streamflow generator, (c) reduction of the number of 1D/2D coupled model runs required by performing flood frequency analysis while also considering flood hydrograph patterns, and (d) derivation of probabilistic flood hazard quantification for the present and for 2050 under RCP 4.5 and 8.5, with and without land subsidence. The detailed 1D/2D coupled model was successfully calibrated and validated against measured flood depths at two manholes, inundation depths and flood extent at many streets in Ninh Kieu district during the October 2016 flood event. Important improvements of this study over those of the past covering the same area are: (1) Consideration of the drainage network that provides hydraulic connections between the city and the river below the embankments; (2) Establishing the inundation hazard and risk as a function of the river levels near Can Tho, which is influenced both by upstream flow and downstream sea-level impact; (3) Develop a relatively numerically inexpensive approach to connect probabilistic urban flood hazard to up and downstream boundary conditions of the larger Mekong Delta area.
Flood hazard maps showing the maximum inundation depth during a flood event were developed for water level return periods ranging from 0.5 to 100 year. Analysis of the flood hazard maps indicates that even under present conditions, more than 12% of the study area will be inundated by the 100 year return period water level. With climate change, but without land subsidence, the 100 year return period flood extent is projected to more than double by 2050, with not much of difference between the two climate scenarios considered (RCP 4.5 and RCP 8.5). However, if the present rate of land subsidence will continue in the future, by 2050 and under both RCP 4.5 and RCP 8.5, the 0.5 and 100 year return period flood extents are projected to increase by around 15- and 8-fold, respectively, relative to the present-day flood extent.
These results indicate that reducing the rate of land subsidence, for example, by limiting ground water extraction, would substantially mitigate future flood hazards in the study area. Combining such a measure with a new and more efficient urban drainage network would further reduce the flood hazard. Future modeling studies are needed to quantitatively assess the hazard and risk reduction afforded by these adaptation measures, which could directly feed into risk informed adaptation measures and pathways. For Can Tho, the “do-nothing” management option does not appear to be an option given especially the 15-fold increase in flood extent projected by 2050 for even the twice per year (0.5 year return period) flood event.
The related data can be made available upon publication. Requests to access these datasets should be directed to AP YS5wYXRoaXJhbmFAdW4taWhlLm9yZw==.
HN, AP, and RR prepared the initial version and the edited versions of the manuscript. All authors reviewed the manuscript and provided editorial input. All authors contributed to the article and approved the submitted version.
HN was supported by IHE Delft Projects OPTIRISK, DURA FR Research Fund, and AXA CC&CR. RR was supported by the AXA Research Fund and the Deltares Strategic Research Programme Coastal and Offshore Engineering.
MR was employed by Agile Lotus Advisory.
The remaining authors declare that the research was conducted in the absence of any commercial or financial relationships that could be construed as a potential conflict of interest.
All claims expressed in this article are solely those of the authors and do not necessarily represent those of their affiliated organizations, or those of the publisher, the editors and the reviewers. Any product that may be evaluated in this article, or claim that may be made by its manufacturer, is not guaranteed or endorsed by the publisher.
The authors would like to thank CHI (Computational Hydraulics International) for providing the PCSWMM license and SURFsara for giving the grant to use the e-infra/SURFsara HPC Cloud.
The Supplementary Material for this article can be found online at: https://www.frontiersin.org/articles/10.3389/fclim.2022.798618/full#supplementary-material
Alfieri, L., Bisselink, B., Dottori, F., Naumann, G., Wyser, K., Feyen, L., et al. (2017). Future global projections of river flood risk in a warmer world. Earth's Future. 5, 171–182. doi: 10.1002/2016EF000485
Alfieri, L., Burek, P., Dutra, E., Krzeminski, B., Muraro, D., Thielen, J., et al. (2013). GloFAS – global ensemble streamflow forecasting and flood early warning. Hydrol. Earth Syst. Sci. 17, 1161–1175. doi: 10.5194/hess-17-1161-2013
Alfieri, L., Burek, P., Feyen, L., and Forzieri, G. (2015). Global warming increases the frequency of river floods in Europe. Hydrol. Earth Syst. Sci. 19, 2247–2260. doi: 10.5194/hess-19-2247-2015
Apel, H., Trepat, O. M., Hung, N. N., Chinh, D. T., Merz, B., and Dung, N. V. (2016). Combined fluvial and pluvial urban flood hazard analysis?: concept development and application to Can Tho city, Mekong Delta, Vietnam. Nat. Hazards Earth Syst. Sci. 16, 941–961. doi: 10.5194/nhess-16-941-2016
Arnell, N. W., and Gosling, S. N. (2016). The impacts of climate change on river flood risk at the global scale. Clim. Change. 134, 387–401. doi: 10.1007/s10584-014-1084-5
Austin, R. J., Chen, A. S., Savić, D. A., and Djordjević, S. (2014). Quick and accurate Cellular Automata sewer simulator. J. Hydroinformatics 16, 1359–1374. doi: 10.2166/hydro.2014.070
Balica, S. F., Wright, N. G., and van der Meulen, F. (2012). A flood vulnerability index for coastal cities and its use in assessing climate change impacts. Nat Hazards. 64, 73–105. doi: 10.1007/s11069-012-0234-1
Bates, P. D., and De Roo, A. P. J. (2000). A simple raster-based model for flood inundation si- mulation. J. Hydroinform. 236, 54–77. doi: 10.1016/S0022-1694(00)00278-X
Bayliss, C., and Reed, D. W. (2001). The use of historical data in flood frequency estimation. Manual, 87. Available online at: http://nora.nerc.ac.uk/8060/1/BaylissRepN008060CR.pdf
Bezak, N., Brilly, M., and Šraj, M. (2014). Comparison between the peaks-over-threshold method and the annual maximum method for flood frequency analysis. Hydrol. Sci. J. 59, 959–977. doi: 10.1080/02626667.2013.831174
Bureau Reclamation (2020). Available online at: https://www.usbr.gov/ssle/damsafety/risk/methodology.html (accessed May 11, 2020).
Burger, G., Sitzenfrei, R., Kleidorfer, M., and Rauch, W. (2014). Parallel flow routing in SWMM 5. Environ. Model. Softw 53, 27–34. doi: 10.1016/j.envsoft.2013.11.002
Can Tho City People's Committee (2010). Can Tho City Climate Change Resilience Plan. an Tho City People's Committee, Can Tho, Vietnam.
Chadwick, R., Ackerley, D., Ogura, T., and Dommenget, D. (2019). Separating the influences of land warming, the direct CO2 effect, the plant physiological effect, and SST warming on regional precipitation changes. J. Geophys. Res. Atmosp. 124, 624–640. doi: 10.1029/2018JD029423
Chen, R., Zhang, Y., Xu, D., and Liu, M. (2018). “Climate change and coastal megacities: disaster risk assessment and responses in Shanghai City,” in Climate Change, Extreme Events and Disaster Risk Reduction. Sustainable Development Goals Series, eds. S. Mal, R. Singh, C. Huggel (Cham: Springer).
Davidsen, S., Löwe, R., Thrysøe, C., and Arnbjerg-Nielsen, K. (2017). Simplification of one-dimensional hydraulic networks by automated processes evaluated on 1D/2D deterministic flood models. J. Hydroinform. 19, 686–700. doi: 10.2166/hydro.2017.152
De Moel, H., Jongman, B., Kreibich, H., and Merz, B. (2015). Flood risk assessments at different spatial scales. Mitig. Adapt. Strateg. Glob. Change. 20, 865–890. doi: 10.1007/s11027-015-9654-z
Dinh, Q., Balica, S., Popescu, I., and Jonoski, A. (2012). Climate change impact on flood hazard, vulnerability and risk of the Long Xuyen Quadrangle in the Mekong Delta Climate change impact on flood hazard, vulnerability and risk of the Long Xuyen. Int. J. River Basin Manag. 10, 103–120. doi: 10.1080/15715124.2012.663383
Dung, N. V., Merz, B., Bárdossy, A., and Apel, H. (2015). Handling uncertainty in bivariate quantile estimation – an application to flood hazard analysis in the Mekong Delta. J. Hydrol. 527, 704–717. doi: 10.1016/j.jhydrol.2015.05.033
Dung, N. V., Merz, B., Bárdossy, A., Thang, T. D., and Apel, H. (2011). Multi-objective automatic calibration of hydrodynamic models utilizing inundation maps and gauge data. Hydrol. Earth Syst. Sci. 15, 1339–1354. doi: 10.5194/hess-15-1339-2011
Engeland, K., Wilson, D., Borsányi, P., Roald, L., and Holmqvist, E. (2018). Use of historical data in flood frequency analysis: a case study for four catchments in Norway. Hydrol. Res. 49, 466–486. doi: 10.2166/nh.2017.069
Erban, L. E., Gorelick, S. M., and Zebker, H. A. (2014). Groundwater extraction, land subsidence, and sea-level rise in the Mekong Delta, Vietnam. Environ. Res. Lett. 9, 10. doi: 10.1088/1748-9326/9/8/084010
Forzieri, G., Cescatti, A., Batista, F., and Feyen, L. (2017). Articles increasing risk over time of weather-related hazards to the European population: a data-driven prognostic study. Lancet Planet Heal. 1, e200–e208. doi: 10.1016/S2542-5196(17)30082-7
Foudi, S., Osés-eraso, N., and Tamayo, I. (2015). Integrated spatial flood risk assessment: the case of Zaragoza land use policy integrated spatial flood risk assessment. Land Use Policy. 42, 278–292. doi: 10.1016/j.landusepol.2014.08.002
Ghimire, B., Chen, A. S., Guidolin, M., Keedwell, E. C., Djordjević, S., and Savić, D. A. (2013). Formulation of a fast 2D urban pluvial flood model using a cellular automata approach. J. Hydroinform. 15, 676–686. doi: 10.2166/hydro.2012.245
Giuliani, M., Herman, J. D., and Quinn, J. D. (2017). Kirsch-Nowak_Streamflow_Generator. Available online at: https://github.com/julianneq/Kirsch-Nowak_Streamflow_Generator (accessed April 11, 2022).
Glenis, V., McGough, A. S., Kutija, V., Kilsby, C., and Woodman, S. (2013). Flood modelling for cities using Cloud computing. J. Cloud Comput. 2, 1–14. doi: 10.1186/2192-113X-2-7
Haasnoot, M., van Deursen, W. P. A., Guillaume, J. H. A., Kwakkel, J. H., van Beek, E., and Middelkoop, H. (2014). Fit for purpose? Building and evaluating a fast, integrated model for exploring water policy pathways. Environ. Model. Softw. 60, 99–120. doi: 10.1016/j.envsoft.2014.05.020
Hall, J. W., Dawson, R. J., Sayers, P. B., Rosu, C., Chatterton, J. B., and Deakin, R. (2003). A methodology for national-scale flood risk assessment. Water Maritime Eng. 156, 235–247. doi: 10.1680/wame.2003.156.3.235
Hirabayashi, Y., Mahendran, R., Koirala, S., Konoshima, L., Yamazaki, D., Watanabe, S., et al. (2013). Global flood risk under climate change. Nat. Clim. Chang. 3, 4–6. doi: 10.1038/nclimate1911
Hoang, L. P., Lauri, H., Kummu, M., Koponen, J., Vliet, M. T. H. Van, Supit, I., et al. (2016). Mekong River flow and hydrological extremes under climate change. Hydrol. Earth Syst. Sci. 20, 3027–3041. doi: 10.5194/hess-20-3027-2016
Huong, H. T. L., and Pathirana, A. (2013). Urbanization and climate change impacts on future urban flooding in Can Tho city, Vietnam. Hydrol. Earth Syst. Sci. 17, 379–394. doi: 10.5194/hess-17-379-2013
IPCC (2013). Working Group I Contribution to the IPCC Fifth Assessment Report, Climate Change 2013: The Physical Science Basis, Summary for Policymakers. Geneva: IPCC. Available online at: https://www.ipcc.ch/site/assets/uploads/2018/02/WG1AR5_all_final.pdf (accessed April 8, 2022).
IPCC (2022). The Ocean and Cryosphere in a Changing Climate. Cambridge; New York, NY: Cambridge University Press. p. 755. doi: 10.1017/9781009157964
King, A. D., Donat, M. G., Fischer, E. M., Hawkins, E., Alexander, L. V., Karoly, D. J., et al. (2015). The timing of anthropogenic emergence in simulated climate extremes. Environ. Res. Lett. 10, 094015. doi: 10.1088/1748-9326/10/9/094015
Kirsch, B. R., Characklis, G. W., and Zeff, H. B. (2012). Evaluating the impact of alternative hydro-climate scenarios on transfer agreements: practical improvement for generating synthetic streamflows. J. Water Resour. Plan. Manag 139, 396–406. doi: 10.1061/(ASCE)WR.1943-5452.0000287
Kreibich, H., Piroth, K., Seifert, I., Maiwald, H., Kunert, U., Schwarz, J., et al. (2009). Is flow velocity a significant parameter in flood damage modelling? Nat. Hazards Earth Syst. Sci. 9, 1679–1692. doi: 10.5194/nhess-9-1679-2009
Kundzewicz, Z. W., Kanae, S., Seneviratne, S. I., Handmer, J., Nicholls, N., and Peduzzi, P. (2014). Flood risk and climate change: global and regional perspectives. Hydrol. Sci. J. 59, 1–28. doi: 10.1080/02626667.2013.857411
Kvočka, D., Falconer, R. A., and Bray, M. (2016). Flood hazard assessment for extreme flood events. Nat. Hazards. 84, 1569–1599. doi: 10.1007/s11069-016-2501-z
Lamontagne, J. (2015). Representation of Uncertainty and Corridor Dp for Hydropower, 272 Optimization, PhD Edn. Ithaca, NY: Cornell University.
Lang, M., Ouarda, T. B. M. J., and Bobée, B. (1999). Towards operational guidelines for over-threshold modeling. J. Hydrol. 225, 103–117. doi: 10.1016/S0022-1694(99)00167-5
Leandro, J., Chen, A. S., and Schumann, A. (2014). A 2D parallel diffusive wave model for floodplain inundation with variable time step (P-DWave). J. Hydrol. 517, 250–259. doi: 10.1016/j.jhydrol.2014.05.020
Lenderink, G., and Van Meijgaard, E. (2008). Increase in hourly precipitation extremes beyond expectations from temperature changes. Nat. Geosci. 1, 511–514. doi: 10.1038/ngeo262
Machado, M. J., Botero, B. A., López, J., Francés, F., Díez-Herrero, A., and Benito, G. (2015). Flood frequency analysis of historical flood data under stationary and non-stationary modelling. Hydrol. Earth Syst. Sci. 19, 2561–2576. doi: 10.5194/hess-19-2561-2015
McMillan, H. K., and Brasington, J. (2007). Reduced complexity strategies for modelling urban floodplain inundation. Geomorphology 90, 226–243. doi: 10.1016/j.geomorph.2006.10.031
MDP (2013). Mekong Delta plan - long-term vision and strategy for a safe, prosperous and sustainable delta. Ministry of Natural Rescources and Environment - Vietnam, Ministry of Agriculture and Rural Development - Vietnam, Kingdom of Netherlands, Consortium of Royal HaskoningDHV, Wageningen University and Research Centre, Deltares, Rebel, Water.nl, Amersfoot.
Menzel, L., Niehoff, D., Bürger, G., and Bronstert, A. (2002). “Climate change impacts on river flooding: a modelling study of three meso-scale catchments,” in Climatic Change: Implications for the Hydrological Cycle and for Water Management, ed M. Beniston (Springer). 249–269.
Merkens, J., Reimann, L., Hinkel, J., and Vafeidis, A. T. (2016). Gridded population projections for the coastal zone under the Shared Socioeconomic Pathways. Glob. Planet. Change 145, 57–66. doi: 10.1016/j.gloplacha.2016.08.009
Merz, B., Hall, J., Disse, M., and Schumann, A. (2010). Fluvial flood risk management in a changing world. Nat. Hazards Earth Syst. Sci. 10, 509–527. doi: 10.5194/nhess-10-509-2010
Merz, B., Thieken, A., and Gocht, M. (2007). “Flood risk mapping at the local scale: concepts and challenges,” in Flood Risk Management in Europe, Advances in Natural and Technological Hazards Research, Vol 25, eds. S. Begum, M. J. F. Stive, J. W. Hall (Dordrecht: Springer), 231–251.
Meyer, V., Haase, D., and Scheuer, S. (2009). Flood risk assessment in European river basins–concept, methods, and challenges exemplified at the Mulde River. Integr. Environ. Assess Manag. 5, 17–26. doi: 10.1897/IEAM_2008-031.1
Min, S.-K., Zhang, X., Zwiers, F. W., and Hegerl, G. C. (2011). Human contribution to more-intense precipitation extremes. Nature. 470, 378–381. doi: 10.1038/nature09763
Minderhoud, P. S. J., Erkens, G., Pham, V. H., Bui, V. T., Erban, L., Kooi, H., et al. (2017). Impacts of 25 years of groundwater extraction on subsidence in the Mekong delta, Vietnam. Environ. Res. Lett. 12,aa7146. doi: 10.1088/1748-9326/aa7146
Minderhoud, P. S. J., Erkens, G., Pham, V. H., Vuong, B. T., and Stouthamer, E. (2015). Assessing the potential of the multi-aquifer subsurface of the Mekong Delta (Vietnam) for land subsidence due to groundwater extraction. Proc. Int. Assoc. Hydrol. Sci. 372, 73–76. doi: 10.5194/piahs-372-73-2015
Minderhoud, P. S. J., Middelkoop, H., Erkens, G., and Stouthamer, E. (2020). Groundwater extraction may drown mega-delta: projections of extraction-induced subsidence and elevation of the Mekong delta for the 21st century. Environ. Res. Commun. 2, 011005. doi: 10.1088/2515-7620/ab5e21
Mishra, K., and Sinha, R. (2020). Geomorphology Flood risk assessment in the Kosi megafan using multi-criteria decision analysis: a hydro-geomorphic approach. Geomorphology 350, 106861. doi: 10.1016/j.geomorph.2019.106861
MONRE (2016). Climate Change and Sea Level Rise Scenarios for Vietnam. Hanoi: Ministry of Natural Resources and Environment.
Mora, C., Spirandelli, D., Franklin, E. C., Lynham, J., Kantar, M. B., Miles, W., et al. (2018). Hazards intensified by greenhouse gas emissions. Nat. Clim. Chang. 8, 1062–1071. doi: 10.1038/s41558-018-0315-6
Mosavi, A., Ozturk, P., and Chau, K.-W. (2018). Flood prediction using machine learning models: literature review. Water. 10, 536. doi: 10.3390/w10111536
MRC (2010). Assessment of Basin-wide Development Scenarios, Basin Development Plan Programme Phase 2. Vientiane: Mekong River Commission.
Nash, J. E., and Sutcliffe, J. V. (1970). River flow forecasting through conceptual models part I—a discussion of principles. J. Hydrol. 10, 282–290. doi: 10.1016/0022-1694(70)90255-6
Neal, J., Villanueva, I., Wright, N., Willis, T., Fewtrell, T., and Bates, P. (2012). How much physical complexity is needed to model flood inundation? Hydrol. Processes 26, 2264–2282. doi: 10.1002/hyp.8339
Neumann, B., Vafeidis, A. T., Zimmermann, J., and Nicholls, R. J. (2015). Future coastal population growth and exposure to sea-level rise and coastal flooding - a global assessment. PLoS ONE. 10, e0131375. doi: 10.1371/journal.pone.0131375
Ngo, H., Pathirana, A., Zevenbergen, C., and Ranasinghe, R. (2018). An effective modelling approach to support probabilistic flood forecasting in coastal cities - case study: Can Tho, Mekong Delta, Vietnam. J. Mar. Sci. Eng. 6, 1–19. doi: 10.3390/jmse6020055
Nguyen, N. H. (2016). Planning, Developing new urban areas in peri-urban areas and the problem of urban flooding - Lessons from An Khanh and An Hoa areas, Vietnam. Constr. Plan. Mag. 76, 58–63. Available online at: http://www.cantholib.org.vn:84/Ebook.aspx?p=27B9F975353796A6E64627B93B65654746C6B65637B91B857557
Nicholls, R.J., Wong, P. P., Burkett, V., Codignotto, J., Hay, J., McLean, R., et al. (2007). “Coastal systems and low-lying areas,” in Climate Change 2007: Impacts, Adaptation and Vulnerability. Contribution of Working Group II to the Fourth Assessment Report of the Intergovernmental Panel on Climate Change, eds M. L. Parry, O. F. Canziani, J.P. Palutikof, P. J. van der Linden, and C. E. Hanson (Cambridge: Cambridge University Press), 315–356. Available online at: http://ro.uow.edu.au/scipapers/164/
Nicholls, R. J. (2004). Coastal flooding and wetland loss in the 21st century: changes under the sres climate and socio-economic scenarios. Global Environ. Change. 14, 69–86. doi: 10.1016/j.gloenvcha.2003.10.007
Nicholls, R. J., Adger, W. N., Hutton, C. W., and Hanson, S. E. (2020). “Delta challenges and trade-offs from the holocene to the anthropocene,” in Deltas in the Anthropocene, eds R. Nicholls, W. Adger, C. Hutton, S. Hanson (Cham: Palgrave Macmillan).
Nicholls, R. J., and Cazenave, A. (2010). Sea-level rise and its impact on coastal zones. Science 328, 1517–1520. doi: 10.1126/science.1185782
Nied, M., Schröter, K., Lüdtke, S., Nguyen, V. D., and Merz, B. (2017). What are the hydro-meteorological controls on flood characteristics? J. Hydrol. 545, 310–326. doi: 10.1016/j.jhydrol.2016.12.003
Nowak, K., Prairie, J., Rajagopalan, B., and Lall, U. (2010). A nonparametric stochastic approach for multisite disaggregation of annual to daily streamflow. Water Resour. Res. 46, 530. doi: 10.1029/2009WR008530
Panagouliaas, D., and Dimoub, G. (1997). Sensitivity of flood events to global climate change. J. Hydrol. 1694, 208–222. doi: 10.1016/S0022-1694(96)03056-9
Pappenberger, F., Dutra, E., Wetterhall, F., and Cloke, H. L. (2012). Deriving global flood hazard maps of fluvial floods through a physical model cascade. Hydrol. Earth Syst. Sci. 19, 4143–4156. doi: 10.5194/hess-16-4143-2012
Pasquier, U., He, Y., Hooton, S., Goulden, M., and Hiscock, K. M. (2019). An integrated 1D−2D hydraulic modelling approach to assess the sensitivity of a coastal region to compound flooding hazard under climate change. Nat. Hazards 98, 915–937. doi: 10.1007/s11069-018-3462-1
Pathirana, A. (2014). “SWMM5-EA-A tool for learning optimization of urban drainage and sewerage systems with genetic algorithms,” in Proceedings of the 11th International Conference on Hydroinformatics. New York, NY: CUNY Academic Works, 17–21.
Penning-Rowsell, E., Floyd, P., Ramsbottom, D., and Surendran, S. (2005). Estimating injury and loss of life in floods: a deterministic framework. Nat. Hazards. 36, 43–64. doi: 10.1007/s11069-004-4538-7
Penning-Rowsell, E. C., Fordham, M., Correia, F. N., Gardiner, J., Green, C., Hubert, G., et al. (1994). “Flood hazard assessment, modelling and management: Results from the EUROflood project,” in Floods Across Europe: Flood Hazard Assessment, Modelling and Management, eds. E. C. Penning-Rowsell, and M. Fordham (London: Middlesex University Press).
Piman, T., Lennaerts, T., and Southalack, P. (2013). Assessment of hydrological changes in the lower Mekong basin from basin-wide development scenarios. Hydrol. Process. 27, 2115–2125. doi: 10.1002/hyp.9764
Prudhomme, C., Crooks, S., and Kay, A. L. (2013). Climate change and river flooding?: Part 1 classifying the sensitivity of british catchments climate change and river flooding?: part 1 classifying the sensitivity of British catchments. Clim. Change. 119, 933–948. doi: 10.1007/s10584-013-0748-x
Quinn, J., Giuliani, M., and Herman, J. (2017). Description of Kirsch-Nowak Streamflow Generator, Vol. 1. p. 1–10. Available online at: https://github.com/julianneq/Kirsch-Nowak_Streamflow_Generator/blob/master/ModelDescription.pdf
Ramsbottom, D., Floyd, P., and Penning-Rowsell, E. (2003). Flood Risks to People: Phase 1. RandD Technical Report FD2317. London: Department for the Environment, Food and Rural Affairs (DEFRA); UK Environment Agency.
Ranasinghe, R., and Jongejan, R. (2018). Climate change, coasts and coastal risk. J. Mar. Sci. Eng. 6, 6–9. doi: 10.3390/jmse6040141
Ranasinghe, R., Wu, C. S., Conallin, J., Duong, T. M., and Anthony, E. J. (2019). Disentangling the relative impacts of climate change and human activities on fluvial sediment supply to the coast by the world's large rivers: Pearl River Basin, China. Sci. Rep. 9, 1–10. doi: 10.1038/s41598-019-45442-2
Rojas, R., Scientific, T. C., and Watkiss, P. (2013). Climate change and river floods in the European Union: socio-economic consequences and the costs and benefits of adaptation. Glob. Environ. Change 23, 1737–1751. doi: 10.1016/j.gloenvcha.2013.08.006
Savage, J. T. S., Bates, P., Freer, J., Neal, J., and Aronica, G. T. (2016). When does spatial resolution become spurious in probabilistic flood inundation predictions? Hydrol. Processes 30, 2014–2032. doi: 10.1002/hyp.10749
Seyoum Solomon, D., Vojinovic, Z., Price Roland, K., and Weesakul, S. (2012). Coupled 1D and noninertia 2D flood inundation model for simulation of urban flooding. J. Hydraul. Eng. 138, 23–34. doi: 10.1061/(ASCE)HY.1943-7900.0000485
Small, C., and Nicholls, R. (2003). A global analysis of human settlement in coastal zones. J. Coast Res. 19, 584–599. Available online at: http://www.jstor.org/stable/4299200
Syvitski, J. P. M., Kettner, A. J., Overeem, I., Hutton, E. W. H., Hannon, M. T., Brakenridge, G. R., et al. (2009). Sinking deltas due to human activities. Nature Geosci. 2, 681–686. doi: 10.1038/ngeo629
Takagi, H., Ty, T. V., Thao, N. D., and Esteban, M. (2015). Ocean tides and the influence of sea-level rise on floods in urban areas of the Mekong Delta. J. Flood Risk Manage. 8, 292–300. doi: 10.1111/jfr3.12094
Teng, J., Vaze, J., Dutta, D., and Marvanek, S. (2015). Rapid inundation modelling in large floodplains using LiDAR DEM. Water Resour. Manag. 29, 2619–2636. doi: 10.1007/s11269-015-0960-8
Verlaan, M., Winsemius, H. C., Aerts, J. C. J. H., Ward, P. J., and Muis, S. (2016). A global reanalysis of storm surges and extreme sea levels. Nat. Commun. 7, 11969. doi: 10.1038/ncomms11969
Vorogushyn, S., Bates, P. D., de Bruijn, K., Castellarin, A., Kreibich, H., Priest, S., et al. (2018). Evolutionary leap in large-scale flood risk assessment needed. Wiley Interdiscipl. Rev. Water 5, e1266. doi: 10.1002/wat2.1266
Ward, P. J., De Moel, H., and Aerts, J. C. J. H. (2011). How are flood risk estimates affected by the choice of return-periods? Nat. Hazards Earth Syst. Sci. 11, 3181–3195. doi: 10.5194/nhess-11-3181-2011
Wind, H. G., Nieron, T. M., De Blois, C. J., and De Kok, J. L. (1999). Analysis of flood damages from the 1993 and 1995 Meuse floods. Water Resour. Res. 35, 3459–3465. doi: 10.1029/1999WR900192
Wolfs, V., and Willems, P. (2013). A data driven approach using Takagi-Sugeno models for computationally efficient lumped floodplain modelling. J. Hydrol. 503, 222–232. doi: 10.1016/j.jhydrol.2013.08.020
Wong, P. P., Losada, I. J., Gattuso, J.-P., Hinkel, J., Khattabi, A., McInnes, K. L., et al. (2014). “Coastalsystems and low-lying areas,” in Climate Change 2014: Impacts, Adaptation, and Vulnerability. Part A: Global and Sectoral Aspects. Contribution of Working Group II to the Fifth Assessment Report of theIntergovernmental Panel on Climate Change, eds C. B. Field, V. R. Barros, D. J. Dokken, K. J. Mach, M. D. Mastrandrea, T. E. Bilir, M. Chatterjee, K. L. Ebi, Y. O. Estrada, R. C. Genova, B. Girma, E. S. Kissel, A. N. Levy, S. MacCracken, P. R. Mastrandrea, and L. L. White (New York, NY; Cambridge: Cambridge University Press), 361–409.
Wright, L., and Esward, T. J. (2013). Fit for purpose models for metrology: a model selection methodology. J. Phys. Conf. Series. 459, 2039. doi: 10.1088/1742-6596/459/1/012039
Keywords: urban flood, surrogate model, 1D/2D modeling, urban drainage, Mekong Delta, Vietnam
Citation: Ngo H, Ranasinghe R, Zevenbergen C, Kirezci E, Maheng D, Radhakrishnan M and Pathirana A (2022) An Efficient Modeling Approach for Probabilistic Assessments of Present-Day and Future Fluvial Flooding. Front. Clim. 4:798618. doi: 10.3389/fclim.2022.798618
Received: 20 October 2021; Accepted: 14 June 2022;
Published: 22 July 2022.
Edited by:
Surendra Kumar Chandniha, Indira Gandhi Agricultural University, IndiaReviewed by:
Edmundo Molina-Perez, Tecnologico de Monterrey, MexicoCopyright © 2022 Ngo, Ranasinghe, Zevenbergen, Kirezci, Maheng, Radhakrishnan and Pathirana. This is an open-access article distributed under the terms of the Creative Commons Attribution License (CC BY). The use, distribution or reproduction in other forums is permitted, provided the original author(s) and the copyright owner(s) are credited and that the original publication in this journal is cited, in accordance with accepted academic practice. No use, distribution or reproduction is permitted which does not comply with these terms.
*Correspondence: Assela Pathirana, YXNzZWxhQHBhdGhpcmFuYS5uZXQ=
Disclaimer: All claims expressed in this article are solely those of the authors and do not necessarily represent those of their affiliated organizations, or those of the publisher, the editors and the reviewers. Any product that may be evaluated in this article or claim that may be made by its manufacturer is not guaranteed or endorsed by the publisher.
Research integrity at Frontiers
Learn more about the work of our research integrity team to safeguard the quality of each article we publish.