 Inés Camilloni
 Natalia Montroull1,2,3
 Carla Gulizia
 Ramiro I. Saurral
95% of researchers rate our articles as excellent or good
Learn more about the work of our research integrity team to safeguard the quality of each article we publish.
Find out more
ORIGINAL RESEARCH article
Front. Clim. , 26 April 2022
Sec. Climate Risk Management
Volume 4 - 2022 | https://doi.org/10.3389/fclim.2022.763983
This article is part of the Research Topic Climatic Hazards and Disaster Risk Reduction in South-Central America and the Caribbean View all 6 articles
This study analyses the La Plata Basin (LPB) hydroclimate response to Solar Radiation Modification (SRM) with Stratospheric Aerosol Injection (SAI) in terms of changes in mean and extreme temperature, rainfall, and river flows simulations from the Geoengineering Large Ensemble (GLENS). The GLENS data used consists of three members simulations of a single model under the high anthropogenic emission scenario RCP8.5 with and without sulfur injection in the tropical stratosphere. The response of such an intervention is compared to a historical period (1980–2010) and to projections under the RCP8.5 scenario for two time slices: 2021–2050 and 2051–2080. The analysis of changes in extreme temperature and precipitation focuses on a subset of climate indices from the Expert Team of Climate Change Detection and Indices (ETCCDI). To determine the possible effects of SRM in the LPB water cycle, we use the distributed Variable Infiltration Capacity (VIC) hydrologic model in combination with daily extreme temperature and precipitation outputs from GLENS. Systematic errors in both fields were corrected by the application of a statistical bias correction method. Results show robust impacts on the water cycle of the LPB due to SRM implementation, particularly associated with increased precipitation over the northern part of the region and a general reduced warming compared to the RCP8.5 scenario. These variations would lead to regional-dependent responses in the river flows, mostly related to reductions in the severity of the extremely low flow conditions. Additionally, under the SRM scenario a reduction in extreme precipitation and a cooling effect on extreme temperatures could be expected over the LPB.
The La Plata Basin (LPB) is a transboundary river basin in South America, situated between ~67°W and 43°W and 15°S and 38°S latitude (Figure 1). It is bounded to the west by the Pampean ridges and the pre-mountain range of the Andes and to the northeast and the east by the Brazilian Plateau and the Serra do Mar, respectively. It is the fifth largest freshwater basin in the world, and the second in the continent, after the Amazon basin.
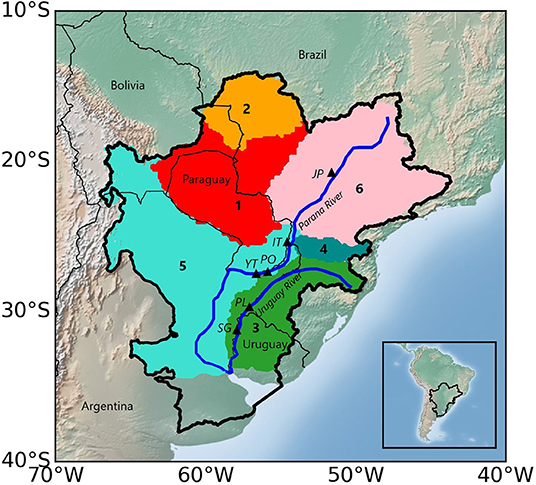
Figure 1. Location of the LPB in South America and the six sub-basins considered in the study: (1) the lower and (2) upper Paraguay River basins, (3) the Uruguay River basin, (4) the Iguazú River basin and (5) the lower and (6) upper Paraná River basins. The black triangles indicate the location of the considered closing points and river dams: Jupiá (JP), Itaipú (IT), Posadas (PO), Yacyretá (YT), Paso de los Libres (PL), and Salto Grande (SG). The inset in the lower right corner of the figure shows the location of LPB within South America.
During the last decades, this region experienced a robust positive precipitation trend attributed to the increase of anthropogenic greenhouse gases (Vera and Díaz, 2015; Zhang et al., 2016; GHG). Also, the LPB has been subject to other climate trends such as increased precipitation and river flows as well as extreme temperatures and rainfall (Barros et al., 2015; Cavalcanti et al., 2015; Dai, 2016; Cerón et al., 2021). Consequently, large areas along the margins of the middle and lower sections of the Paraná and Uruguay rivers, the main tributaries of La Plata River in terms of discharges, were subject to large floods that led to critical streamflow and considerable damage (Barros et al., 2015). As a result of an increase in the atmospheric GHG concentration, the LPB is projected to get warmer in the upcoming decades, with a more noticeable temperature increase in its northern half section. At the same time, projections suggest that there would be an increase in precipitation, mainly over the southern part of the basin (Montroull et al., 2018; Zaninelli et al., 2018). Additionally, a trend toward a gradual increase in streamflow was found for most of the rivers (Saurral et al., 2013; Betts et al., 2018) with more frequent and longer-lasting fluvial flooding events in the lower basin (Camilloni et al., 2013).
In addition to mitigation and adaptation and considering the ambitious climate targets of the Paris Agreement to limit global warming to well below 2°C and pursue efforts to limit it to 1.5°C compared to the preindustrial era (UNFCCC, 2015), other options for counteracting climate change have been proposed, such as climate interventions in the form of geoengineering (Crutzen, 2006; Wigley, 2006; MacCracken, 2009; Keith and MacMartin, 2015). Solar radiation modification (SRM) is a geoengineering strategy suggested to intentionally reduce the sun's incoming radiation and to cool the climate. SRM implementation has been presented as a possible pathway to avoid some of the worst consequences of global warming and to meet the Paris Agreement warming targets (Lawrence et al., 2018) while society transitions to carbon-free energy solutions. However, SRM is a controversial strategy and would come with benefits but also risks and concerns, and socio-political implications. Quantifying these potential benefits and risks must occur prior to any implementation of SRM. For example, it has been found that while the intensity of the global hydrological cycle is expected to enhance in response to GHG-induced warming due to the increases in lower tropospheric water vapor and net downward radiative flux (Held and Soden, 2006), solar geoengineering would lead to a less intense global water cycle with potentially significant changes in regional precipitation patterns (Bala et al., 2008; Robock et al., 2008; Tilmes et al., 2013; Dagon and Schrag, 2016).
Although the technical and financial feasibility of SRM is still under debate, a key area of concern is the insufficient knowledge about the potential impacts at regional scale. Stratospheric aerosol injection (SAI) is one SRM method that aims to replicate the cooling effect of volcanoes by spraying reflective sulfate particles into the stratosphere (e.g., Brovkin et al., 2009; Robock et al., 2013). Different studies show that maintaining global mean temperatures at a given level by SRM through SAI results in diverse regional climate impacts (Robock et al., 2008; Simpson et al., 2019; Da-Allada et al., 2020; Odoulami et al., 2020; Pinto et al., 2020; Abiodun et al., 2021). Recently, Irvine and Keith (2020) studied the fraction of regions where SAI could exacerbate or moderate climate impact when SAI is applied to halve the warming produced by doubling CO2. They found that almost none of the four analyzed variables (annual mean temperature, yearly maximum temperature, maximum annual precipitation rate and precipitation minus evaporation) are exacerbated when averaged over the Intergovernmental Panel on Climate Change (IPCC) Special Report on Extremes (SREX) regions (Seneviratne et al., 2012). This is the case for the southern South America (SSA) region of which the LPB is part. However, this result cannot be extrapolated to the LPB as SSA is large enough to encompass sub-regions with different climate regimes leading to a recent update of the IPCC climate reference regions (Iturbide et al., 2020).
The objective of this paper is to evaluate the LPB hydroclimate response to SRM in comparison to a high emission scenario in terms of changes in water availability, mean temperature and rainfall, and hydrological and climate extremes using simulations from the Geoengineering Large Ensemble (GLENS). The structure of the manuscript is as follows: the study area, methods and data used in this analysis are explained in section study area, data and methodology, the main results are shown in section results, and a discussion and conclusions are provided in section discussions and conclusions.
The LPB covers 3.1 million km2, comprising southern Brazil, southeastern Bolivia, a great part of Uruguay, Paraguay, and an extensive area of central and northern Argentina. It can be divided into six sub-basins: lower and upper Paraguay, Uruguay, Iguazú, lower and upper Paraná. The three main river systems in the LPB are: the Paraguay River, with an annual average flow of 2,800 m3/s at Asunción, the Paraná River with an annual average flow of 12,000 m3/s at Itaipú and the Uruguay River, with an annual average flow of 4,700 m3/s at Salto Grande. These latter two rivers come together to form La Plata River, draining into the southwestern Atlantic Ocean, with an average output of 25,000 m3/s. The Paraná River has a drainage basin of 2.6 million km2 while the Uruguay River basin is the only large river in the LPB that is not a tributary of the Paraná, and its area covers around 10% of the LPB area. Both the Paraguay and the Iguazú rivers end at the Paraná River.
The LPB population is estimated at ~110 million inhabitants that represents about 60 percent of the combined population of the five countries of the basin. It hosts 50 big cities, 75 dams and more than 30 large hydropower plants that produce around 73% of the total energy demand (Popescu et al., 2014). The LPB is the core of the southeastern South American region with socio-economic activities like agriculture and livestock that generate around 70% of the per capita Gross Domestic Product of the LPB countries.
The Stratospheric Aerosol Geoengineering Large Ensemble (GLENS) project (Tilmes et al., 2018) includes a suite of simulations made with the Community Earth System Model using the Whole Atmosphere Community Climate Model CESM1 (WACCM) as its atmospheric component (Mills et al., 2017). The model horizontal resolution is 0.95° latitude × 1.25° longitude, with 70 vertical layers extending up to 145 km altitude. The simulations consist in simultaneous injection of sulfur dioxide into the stratosphere at four locations, 30°S, 15°S, 15°N, and 30°N at 180°E and at an altitude around 5 km above the climatological tropopause height at the injection latitudes. The goal of the GLENS geoengineering simulations was to maintain the global mean surface temperature and the interhemispheric and equator-to-pole surface temperature gradients at 2020 levels over the period 2020–2099 under the high GHG emission scenario RCP8.5 (Meinshausen et al., 2011). The GLENS data used here consists of three members that use prescribed GHG forcing concentrations following the RCP 8.5 (control simulations) and three members that also follow the RCP8.5 scenario combined with increasing sulfur injections for the geoengineering (feedback simulations). A more detailed description of the data and simulations used in this study is available in Tilmes et al. (2018).
The distributed Variable Infiltration Capacity (VIC) hydrology model (Liang et al., 1994; Nijssen et al., 1997) is used to assess the potential impacts of SAI on the hydroclimate of LPB. The model's inputs are information on soil type, topography, and vegetation, and daily information on selected meteorological variables (daily maximum and minimum temperatures and precipitation). Its skill to simulate the main hydrologic features of various basins worldwide has been proved extensively (e.g., Mattheussen et al., 2000; Wood et al., 2002) and it has already been successfully applied to the LPB as well (Su and Lettenmaier, 2009; Saurral, 2010; Montroull et al., 2018). Soil type and vegetation information were obtained from the 5-min Global Soil Data Task dataset of the Distributed Active Archive Center (2000) and the University of Maryland's 1-km Global Land Cover product (Hansen et al., 2000), respectively. Topography data was taken from the Global 30 arc-second elevation (GTOPO30) dataset (United States Geological Survey, 1997).
The VIC model, setup as in Saurral (2010), was forced using the daily meteorological data from GLENS after a re-gridding into a regular 1/8°latitude × 1/8°longitude grid to increase the horizontal resolution of the hydrological simulations. To overcome the biases in GLENS climate simulations as the input data for the VIC model, we used the method developed for the Inter-Sectoral Impact Model Intercomparison Project Phase 2b (ISIMIP2b; Frieler et al., 2017). This bias correction method adjusts the daily variability of simulated climate data to observations preserving the climate signal (long-term trend) using a constant offset for air temperature and a multiplicative correction factor in the case of precipitation. Different temperature and precipitation databases were used for the bias correction: the CLARIS LPB database (Penalba et al., 2014) and the Global Precipitation Climatology Project (GPCC; Adler et al., 2003) version 2.3 for precipitation and the WFDEI dataset (Weedon et al., 2014) for temperature. The calibration period for the bias correction process was 1980–1990, while the validation period was 1991–2000. Outputs from VIC consist of daily, monthly, and annual mean values of evapotranspiration and surface and sub-surface runoff which are integrated afterwards using a routing model (Lohmann et al., 1998) to derive streamflow data at selected closing points in two sub-basins: Jupiá, Itaipú and Posadas for the Paraná River sub-basin, and Paso de los Libres and Salto Grande for the Uruguay River sub-basin (Figure 1). Some of the points were selected because there are large hydropower plants in or close to these locations (the Itaipú, the Yacyretá, and the Salto Grande river dams) and any relevant variation in the rivers' flows could have severe consequences on the energy production. The Itaipú reservoir on the Paraná River is shared between Brazil and Paraguay. It is the largest dam in the basin with a total capacity of 29,000 million m3 and it is one of the largest hydroelectric plants in the world with a total installed capacity of 14,000 MW. The Yacyretá dam, also on the Paraná River and 100 km downstream of Posadas, is located on the border between Argentina and Paraguay. The total capacity of the dam is 21,000 million m3. The hydropower generated by this dam, which has a total capacity of 3,200 MW, is mainly used by Argentina. The Salto Grande dam, on the Uruguay River, is placed on the border between Argentina and Uruguay, and has a capacity of 5,500 million m3. The power plant has a total capacity of 1,890 MW, which covers part of the power demand of Argentina and more than half of the power needs of Uruguay (FAO, 2016).
The analysis is focused on a subset of six extreme climate indices from the Expert Team of Climate Change Detection and Indices (ETCCDI, Frich et al., 2002; Klein Tank et al., 2009; Zhang et al., 2011) summarized in Table 1. The indices were selected in order to characterize different aspects of daily temperature and precipitation extremes with recurrence times of a year or less. They have been widely used previously, both for observed weather (Donat et al., 2013) and model outputs from different CMIPs (e.g., Sillmann et al., 2013; Kim et al., 2020) and geoengineering simulations (e.g., Curry et al., 2014; Ji et al., 2018; Pinto et al., 2020).
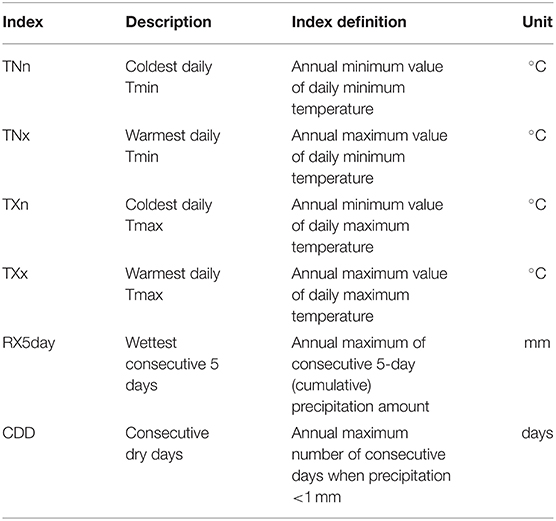
Table 1. Subset of the temperature and precipitation extreme indices from ETCCDI used in this study.
Changes in selected mean hydrometeorological variables (maximum and minimum temperature, precipitation, evapotranspiration, runoff, and river discharges) and in extreme indices derived from GLENS and from the VIC model over the LPB are calculated by computing the difference between the three-member ensemble mean values for two future 30-year periods (2021–2050 and 2051–2080) and the mean values over the historical period, 1980–2010. Projected changes are assumed robust when the absolute value of the multi-member ensemble mean of the computed differences exceeds the standard deviation of the changes in the individual ensemble members. The latter definition of robustness was applied in previous studies (Meehl et al., 2007; Donnelly et al., 2017; Montroull et al., 2018). Robust changes are stippled in the maps presented in section results.
The deployment of SAI as simulated by the GLENS feedback experiment results in much smaller regional annual temperature changes than the RCP8.5 simulations (control) for both future time slices (Figure 2). Under the RCP8.5 scenario (Figure 2A) there is over the whole basin a robust and almost uniform warming in the mean, maximum and minimum temperatures in the range of 1–2°C for the 2021–2050 period, which increases to more than 3°C for 2051–2080. However, for this last period the increases in the three temperature variables are less (between 2 and 3°C) but still robust in a limited area of the southern section of the basin. With values under 1°C for the two time slices, temperature changes in a SAI scenario (Figure 2B) are mostly positive and robust but, as expected, they are moderate in comparison with the RCP8.5 one. There are only small areas where there is a cooling effect of the SAI in comparison with the historical period. This is more noticeable in the yearly minimum temperature for the 2051–2080 period with a temperature decrease smaller than −1°C in the northern central region. Overall, the result of contrasting the feedback and control simulations is robust and shows almost the same magnitudes and spatial patterns for the mean, maximum and minimum temperatures (Figure 2C). For the 2021–2050 period, SAI results in a temperature decrease between −1°C and −2°C in most of the LPB with the lowest changes (up to −1°C) in the southeastern corner. The cooling is more extreme for the medium future (2051–2080) in the northern half section of the basin (more than −3°C) and between −2°C and −3°C in the south. This asymmetric north–south response in temperature could be related to the different land cover between both regions (Abelen et al., 2015) and consequently in the albedo feedback.
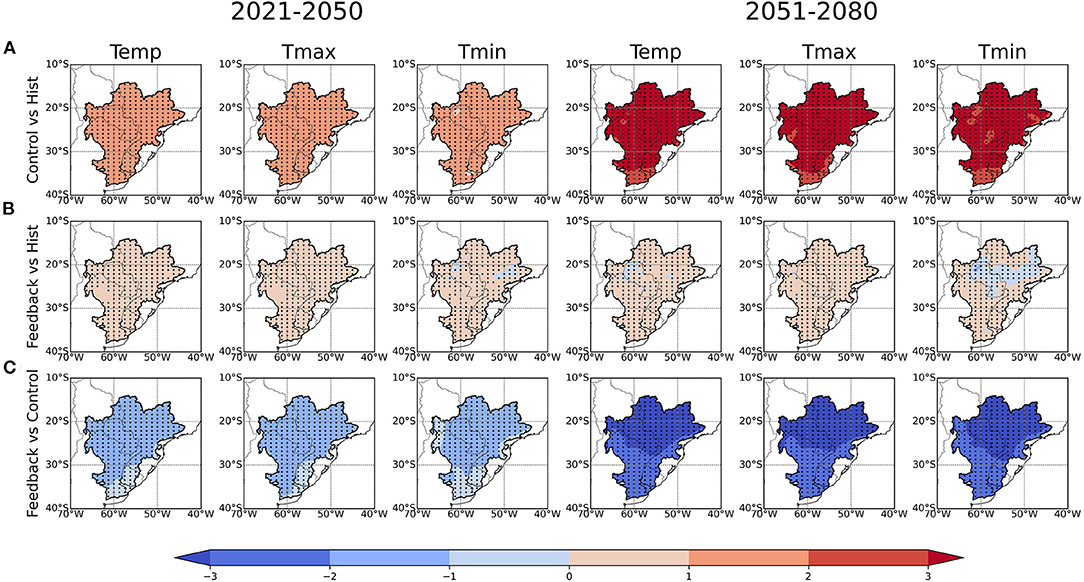
Figure 2. Annual projected changes in mean, maximum, and minimum temperature (°C) derived from the three-member ensemble mean values for two future 30-year periods (2021–2050 and 2051–2080) and the mean values over the historical period (1980–2010): (A) Projected changes under the RCP8.5 emission scenario (control simulations) relative to historical, (B) projected changes for the geoengineering simulations combined with the RCP8.5 pathway (feedback simulations) relative to historical, and (C) the difference between (A,B). Stippling indicates robust changes according to the definition of robustness adopted in this study [see section projections in the text for further details].
Figure 3 shows the projected changes of annual mean precipitation, evapotranspiration and runoff for the control and feedback experiments and for the comparison between them. Regarding precipitation, for the 2021–2050 period under the RCP8.5 scenario (Figure 3A) parts of the basin are likely to feature robust increases in rainfall between 0.1 and 0.3 mm/day at the border between the upper Paraguay and Paraná sub-basins in the northern section of the LPB and in the west area that represents the south limit between the same sub-basins. Robust positive changes are larger (up to 0.5 mm/day) and cover a more extensive area of the lower Paraguay and upper Paraná sub-basins for the 2051–2080 period. Toward the south of the LPB, including lower Paraná and Uruguay basins, there are small non-robust decreases in both time slices Evapotranspiration changes are mostly positive and robust (around 0.1 mm/day for the 2021–2050 period and up to 0.5 mm/day for 2051–2080) in the northern section of the upper Paraná and Iguazú sub-basins and in the Uruguay basin upstream of Salto Grande. The only negative and non-robust changes are in the lower Paraná and Paraguay, the same region with negative changes in precipitation. Finally, changes in runoff for the control simulations are quite similar to those in precipitation and evapotranspiration: in the areas where precipitation is projected to increase, runoff changes are positive in both periods. The precipitation response to SAI (Figure 3B) is not uniform geographically: robust increases to the north of the LPB in the upper Paraná and Paraguay sub-basins and reductions in the lower Paraná and Uruguay sub-basins in both periods. In comparison with the control simulation (Figure 3C), projected changes have higher magnitude indicating a robust wetting of a large fraction of the LPB basin for the near term and a dipole for the long term: more rainfall in the upper Paraná and Paraguay, Iguazú and southern Uruguay and drying in the lower Paraná and northern Uruguay sub-basins. The overall effect of SAI is to increase evapotranspiration and runoff in vast areas of the LPB (Figure 3B) that compared with the RCP8.5 scenario results in robust higher magnitudes of runoff in the Paraguay, Uruguay, and most of the Paraná sub-basins (Figure 3C). This is the case particularly for the 2051–2080 period. Consequences on river flows will be discussed in section river discharges.
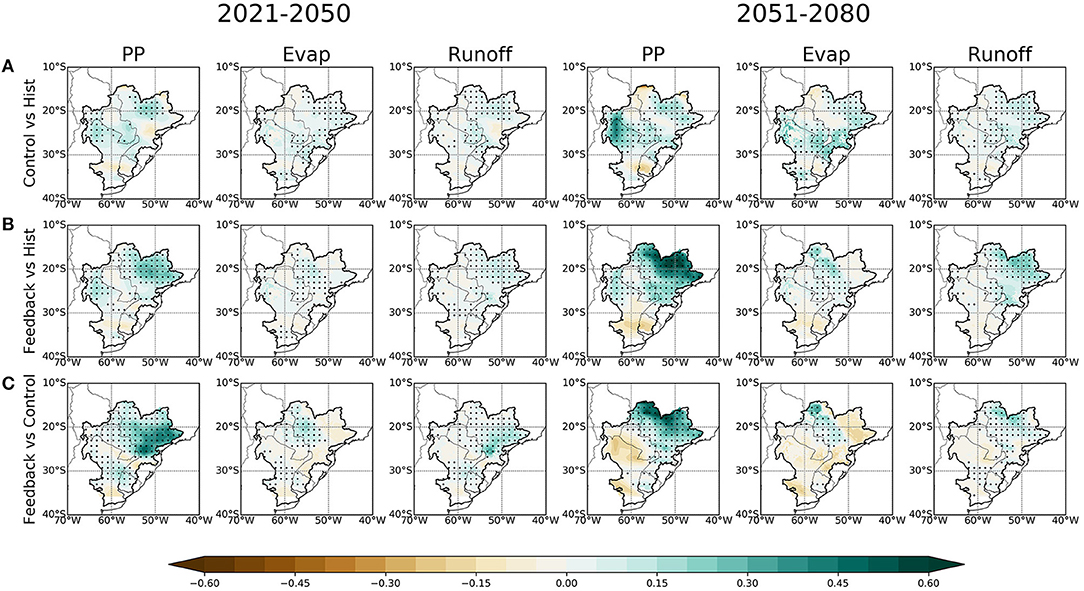
Figure 3. Annual projected changes in total precipitation, evaporation, and runoff (mm/day) derived from the three-member ensemble mean values for two future 30-year periods (2021–2050 and 2051–2080) and the mean values over the historical period (1980–2010): (A) Projected changes under the RCP8.5 emission scenario (control simulations) relative to historical, (B) projected changes for the geoengineering simulations combined with the RCP8.5 pathway (feedback simulations) relative to historical, and (C) the difference between (A,B). Stippling indicates robust changes according to the definition of robustness adopted in this study [see section projections in the text for further details].
This section presents results for the six ETCCDI indices describing temperature and precipitation extremes presented in section models. For the control simulations, the projected increases in TNn, TNx, TXn and TXx, are robust across the whole basin for the two time slices (Figure 4A). The spatial pattern of changes in TNn, TNx, and TXn are similar with the largest increases exceeding 2°C over the northern section of the LPB for the 2021–2050 period and higher than 4°C in most of the basin for the 2051–2080. TXx exhibits the largest changes that are maxima in the section of the basin north of 30°S reaching up to 4°C for the first period and above 6°C for the second one. The same relation of projected changes in TNn and TXx were identified in this region for the end of the twenty-first century using a multi-model ensemble from the Coupled Model Intercomparison Project Phase 5 (CMIP5) (Sillmann et al., 2013). Under the SAI scenario, the projected changes in the four temperature indices are moderate (Figure 4B). The magnitude of the changes is significantly weaker when compared to projected changes in the control simulations (Figure 4A) and generally smaller than 2°C for the two periods. For all the indices except TXn there are some areas where temperatures are smaller compared to historical values. This is evident for TNx with robust negative changes between −1°C and −2°C in the upper Paraná and Paraguay sub-basins for the period 2051–2080. The comparison between the feedback and control simulations (Figure 4C) shows that the cooling effect of the SAI in comparison with the RCP8.5 scenario is robust and reaches the highest magnitude up to −6°C for TNx and TXx over the upper Paraná and Paraguay sub-basins for the last period. Overall, regional temperature extremes under the SAI and increased GHG scenario as represented by the feedback simulations almost offsets the warming under RCP8.5 at the LPB keeping the spatial mean temperature increases for TNn, TNx, and TXx with magnitudes lower than 1°C.
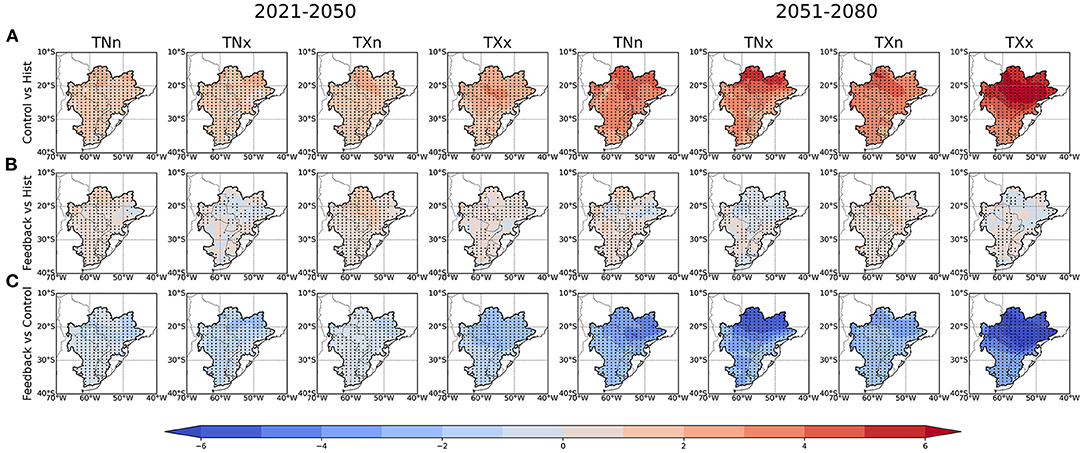
Figure 4. Annual projected changes in temperature extreme indices: TNn (coldest daily Tmin), TNx (warmest daily Tmin), TXn (coldest daily Tmax) and TXx (warmest daily Tmax) (°C) derived from the three-member ensemble mean values for two future 30-year periods (2021–2050 and 2051–2080) and the mean values over the historical period (1980–2010): (A) Projected changes under the RCP8.5 emission scenario (control simulations) relative to historical, (B) projected changes for the geoengineering simulations combined with the RCP8.5 pathway (feedback simulations) relative to historical, and (C) the difference between (A,B). Stippling indicates robust changes according to the definition of robustness adopted in this study [see section projections in the text for further details].
Figure 5 shows the projected changes in the precipitation indices RX5day and CDD at annual timescales in response to increases in GHG and SAI forcing and the differences between both. Under the RCP8.5 scenario (Figure 5A), changes in RX5day show a quite similar spatial pattern as the yearly mean precipitation (Figure 3A) with robust increases over most of the basin with greater magnitudes (up to 30%) for the second period. Similarly, the annual maximum number of consecutive dry days CDD shows robust increases for the two time slices reaching more than 10 days for 2051–2080 in a large section of the basin. Changes in RX5day associated with the SAI forcing are moderate in comparison to the control simulations (Figure 5B) reducing the magnitude over most of the basin. The effect on CDD is different and in some regions like the upper Paraguay sub-basin to the north of the LPB, there are robust decreases in the 2021–2050 period. The area of the LPB with robust negative changes in CDD is more extensive for the 2051–2080 period although there are robust positive changes in the southernmost region of the Paraná sub-basin and in the western section of the Uruguay sub-basin. The contrast in the projected changes of RX5day and CDD derived from the feedback and control simulations (Figure 5C) indicates that the SAI forcing moderates the magnitude of both indices resulting in a greater reduction in CDD in the northern section of the LPB over the upper Paraná and Paraguay sub-basins for the last period.
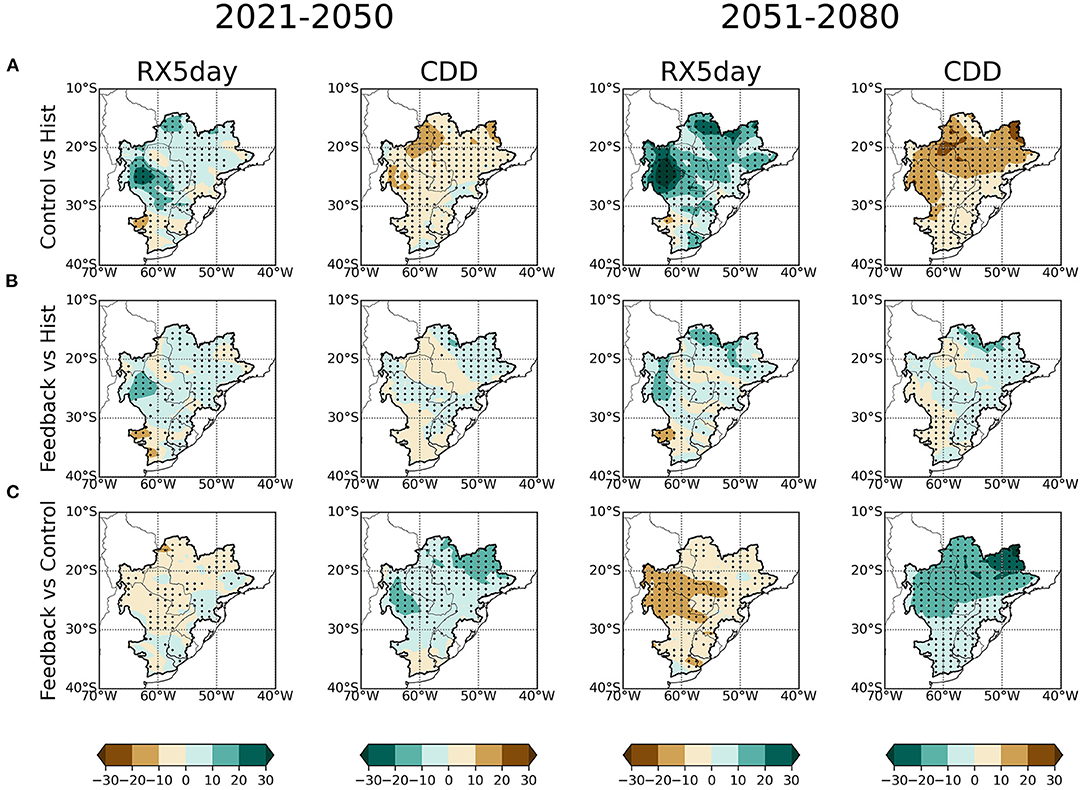
Figure 5. Annual projected changes in precipitation extreme indices: RX5day (wettest consecutive 5days) (%) and CDD (consecutive dry days) (days) derived from the three-member ensemble mean values for two future 30-year periods (2021–2050 and 2051–2080) and the mean values over the historical period (1980–2010) considering (A) projected changes under the RCP8.5 emission scenario (control simulations) relative to historical, (B) projected changes for the geoengineering simulations combined with the RCP8.5 pathway (feedback simulations) relative to historical, and (C) the difference between (A,B). Stippling indicates robust changes according to the definition of robustness adopted in this study [see section projections in the text for further details].
The changes in temperature, precipitation, evapotranspiration, and runoff described previously under different forcing scenarios will certainly impact the annual mean streamflow of the main rivers of the LPB. This section presents the projected changes in the mean and extreme flows of the Paraná River at the closing points of Jupiá, Itaipú, and Posadas and in Paso de los Libres and Salto Grande on the Uruguay River (see Figure 1 for the location of the closing points). The atmospheric input data for the hydrologic modeling are the bias-corrected GLENS control and feedback simulations of the daily minimum and maximum temperatures and precipitation. Maximum and minimum simulated temperatures are highly spatially correlated with observations for the validation period for both uncorrected and corrected data (>0.9 in all cases) indicating a good performance of the GLENS temperature simulations and not significant value added by the bias correction method (Figures not shown). Figure 6 shows the yearly mean precipitation fields in the LPB derived from the GPCC database, and from GLENS uncorrected and bias-corrected outputs for the validation period (1991–2000). It is important to stress that the observed data presented in this figure played no role in the computation of corrected data and it is shown only for comparison and validation. It is evident that the corrected field is quite similar to the observations. In particular, it can be noted that the biases are well-removed over the region with steep terrain of the pre-mountain range of the Andes. Also, both the location and magnitude of the precipitation maximum over the Iguazú sub-basin are adequately represented after the bias correction.
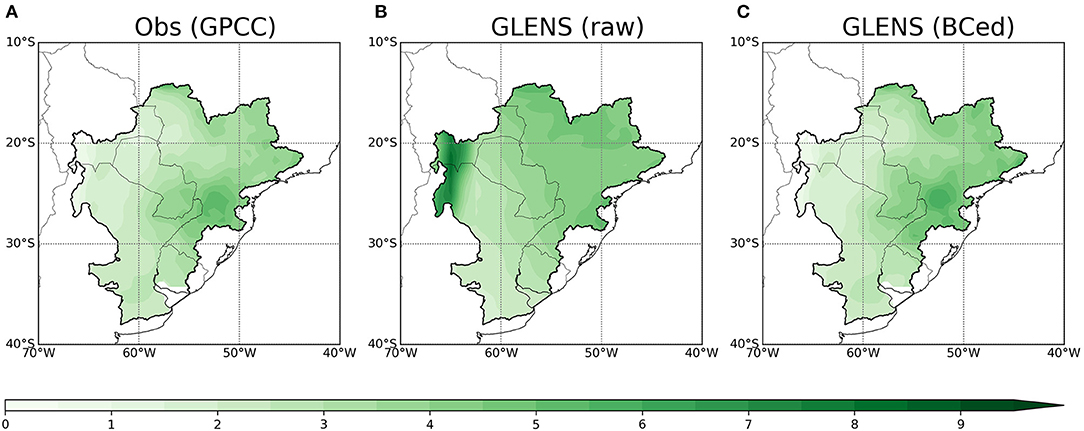
Figure 6. Annual (A) observed, (B) simulated, and (C) bias-corrected precipitation (mm/day) for the validation period (1991–2000).
The projected changes in the annual mean and extreme flows of the Paraná and Uruguay rivers at the selected points for the control and feedback simulations and the periods 2021–2050 and 2051–2080 are presented in Tables 2, 3. Flows are computed as the ensemble mean of the hydrologic simulations resulting from the three members of the GLENS outputs. Minimum and maximum flows are defined as the 5th and 95th percentiles, respectively. The positive changes in rainfall in the upper-middle Paraná River basin under the SAI feedback scenario (Figure 3B) lead to a uniform increase close to 10% (20%) in the mean flow of the river at the three closing points in 2021–2050 (2051–2080) relative to the historical period (Table 2). At the same time, this is accompanied by a marked increase in the value of the 5th percentile in both future periods, reaching a maximum of 75% at Jupiá in 2051–2080. Without SAI (control scenario), changes are mostly negative for these low flow conditions, which would translate into even lower streamflow values under drought conditions compared to the historical period. Interestingly, the magnitude of increase is much smaller for the extremely high flows (95th percentile) and only reach 4–5% in 2021–2050 and 9–14% in 2051–2080, which are comparable to values obtained under the RCP8.5 scenario. Results for the Uruguay River (Table 3) show a different behavior, since geoengineering strategies would lead to minor changes in the mean river flows (0–4% depending on the future period under consideration) while also bringing an increase in the 5th percentile flow values and little variations (ranging from −3 to 6%, depending on the period and closing point considered) in the 95th percentile flow values.
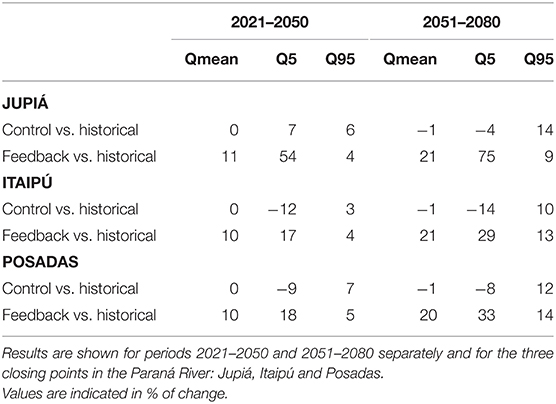
Table 2. Changes in the mean (Qmean), extremely low (represented by the 5th percentile; Q5) and extremely high (95th percentile; Q95) Paraná River streamflow simulated by the VIC hydrology model considering control vs. historical and feedback vs. historical GLENS simulations.
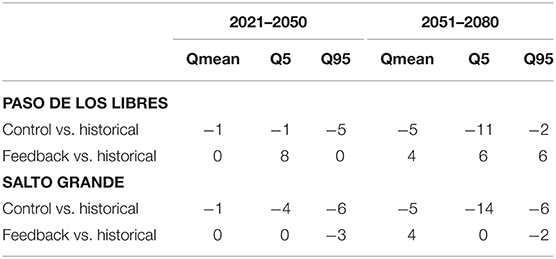
Table 3. As in Table 2 but for the closing points in the Uruguay River: Paso de los Libres and Salto Grande.
This article provides a first overview of the LPB hydroclimate response to SAI using simulations from the Geoengineering Large Ensemble (GLENS) Project. The goal of the geoengineering simulations was to maintain the global mean surface temperature and the interhemispheric and equator-to-pole surface temperature gradients at 2020 levels under a RCP8.5 GHG scenario by simultaneously injecting sulfur dioxide in the stratosphere at four locations.
Results show that, relative to the historical conditions (1980–2010), SAI can offset the projected increase in the magnitude of mean and extreme temperatures when compared to the RCP8.5 scenario for the periods 2021–2050 and 2051–2080. The cooling effect of SAI is more significant in the northern section of the basin. The response of SAI on precipitation is not uniform geographically, indicating an increase in the northern sector of the LPB including the upper Paraná and Paraguay sub-basins and a reduction to the south in the lower Paraná and Uruguay sub-basins. In terms of precipitation extremes, they are projected to decrease with different magnitudes depending on the location, but in general under the SAI scenario a reduction can be expected in both RX5day and CDD.
The possible effects of SAI on the LPB water cycle were assessed with the VIC hydrologic model in combination with daily extreme temperature and precipitation outputs from GLENS. SAI mostly increases mean and extreme flows of the main rivers of LPB with respect to the historical period and the RCP8.5 scenario. Still, it is worth noting that over the Paraná River the marked increase in the extremely low flow values (5th percentile) under SAI in the upcoming decades (2021–2080) would become accompanied by smaller increases in the extremely high values (95th percentile), suggesting a reduction in the flow variability of the river and less severe drought conditions over the basin. However, this latter advantage could come at the expense of a slightly larger risk of flooding under extremely high flow conditions.
In conclusion, the overall effect of solar geoengineering in LPB, as derived from the single climate model considered in the GLENS experiment, is to reduce climate impacts associated with high GHG emissions for most of the basin, although for some areas it could make them worse compared to the RCP8.5 scenario without SAI: i.e., increase in high flows of the Paraná River at Itaipú dam and for the 2021–2050 period more dry days in the southern section of the basin. Therefore, even within the LPB, SAI involves trade-offs, as some regions will experience a greater compensation of the anthropogenic global mean temperature rise than others that could see drawbacks, leading to concerns about equity and climate justice. However, considering that results were obtained from multiple ensemble members of a single climate model, more research is needed assessing geoengineering simulations from different climate models.
The raw data supporting the conclusions of this article will be made available by the authors, without undue reservation.
IC conceived this paper and wrote it. NM and RS performed the hydrological simulations. CG conducted the analysis of the extreme indices. All authors contributed to the article and approved the submitted version.
We acknowledge the financial support of the DECIMALS fund of the Solar Radiation Management Governance Initiative (SRMGI), which was set up in 2010 by the Royal Society, Environmental Defense Fund and The World Academy of Sciences (TWAS) and was funded by the Open Philanthropy Project. This work was also supported by the Agencia Nacional de Promoción Científica y Tecnológica - Argentina Innovadora 2020 (PICT2016-1422) and the University of Buenos Aires (UBACYT- 20020170100666BA).
The authors declare that the research was conducted in the absence of any commercial or financial relationships that could be construed as a potential conflict of interest.
All claims expressed in this article are solely those of the authors and do not necessarily represent those of their affiliated organizations, or those of the publisher, the editors and the reviewers. Any product that may be evaluated in this article, or claim that may be made by its manufacturer, is not guaranteed or endorsed by the publisher.
We thank Simone Tilmes and Pete Irvine for the useful discussions during the process of this research. We also thank Daniele Visioni and three reviewers for their valuable comments and helpful advice.
Abelen, S., Seitz, F., Abarca-del-Rio, R., and Güntner, A. (2015). Droughts and floods in the La Plata Basin in Soil Moisture Data and GRACE. Remote Sens. 7, 7324–7349. doi: 10.3390/rs70607324
Abiodun, B. J., Odoulami, R. C., Sawadogo, W., Oloniyo, O. A., Abatan, A. A., New, M., et al. (2021). Potential impacts of stratospheric aerosol injection on drought risk managements over major river basins in Africa. Clim. Change 169:31. doi: 10.1007/s10584-021-03268-w
Adler, R. F., Huffman, G. J., Chang, A., Ferraro, R., Xie, P.-P., Janowiak, J., et al. (2003). The Version-2 Global Precipitation Climatology Project (GPCP) monthly precipitation analysis (1979–Present). J. Hydrometeorology 4, 1147–1167. doi: 10.1175/1525-7541(2003)004<1147:TVGPCP>2.0.CO;2
Bala, G., Duffy, P. B., and Taylor, K. E. (2008). Impact of geoengineering schemes on the global hydrological cycle. Proc. Natl. Acad. Sci. U.S.A. 105, 7664–7669. doi: 10.1073/pnas.0711648105
Barros, V. R., Boninsegna, J. A., Camilloni, I. A., Chidiak, M., Magrín, G. O., and Rusticucci, M. (2015). Climate change in Argentina: trends, projections, impacts and adaptation. WIREs Clim. Change 6, 151–169. doi: 10.1002/wcc.316
Betts, R. A., Alfieri, L., Bradshaw, C., Caesar, J., Feyen, L., Friedlingstein, P., et al. (2018). Changes in climate extremes, fresh water availability and vulnerability to food insecurity projected at 1.5°C and 2°C global warming with a higher-resolution global climate model. Philos. Trans. A Math. Phys. Eng. Sci. 376:20160452. doi: 10.1098/rsta.2016.0452
Brovkin, V., Petoukhov, V., Claussen, M., Bauer, E., Archer, D., and Jaeger, C. (2009). Geoengineering climate by stratospheric sulfur injections: earth system vulnerability to technological failure. Clim. Change 92, 243–259. doi: 10.1007/s10584-008-9490-1
Camilloni, I. A., Saurral, R. I., and Montroull, N. B. (2013). Hydrological projections of fluvial floods in the Uruguay and Paraná basins under different climate change scenarios. Intl. J. River Basin Manag. 11, 389–399. doi: 10.1080/15715124.2013.819006
Cavalcanti, I. F. A., Carril, A. F., Penalba, O. C., Grimm, A. M., Menéndez, C. G., Sanchez, E., et al. (2015). Precipitation extremes over La Plata Basin – Review and new results from observations and climate simulations. J. Hydrol. 523, 211–230. doi: 10.1016/j.jhydrol.2015.01.028
Cerón, W. L., Kayano, M. T., Andreoli, R. V., Avila-Diaz, A., Ayes, I., Freitas, E. D., et al. (2021). Recent intensification of extreme precipitation events in the La Plata Basin in Southern South America (1981–2018). Atmos. Res. 249:105299. doi: 10.1016/j.atmosres.2020.105299
Crutzen, P. J. (2006). Albedo enhancements by stratospheric sulfur injections: a contribution to resolve a policy dilemma? Clim. Change 77, 211–219, doi: 10.1007/s10584-006-9101-y
Curry, C. L., Sillmann, J., Bronaugh, D., Alterskjaer, K., Cole, J. N. S., Ji, D., et al. (2014). A multimodel examination of climate extremes in an idealized geoengineering experiment. J. Geophys. Res. Atmos. 119, 3900–3923. doi: 10.1002/2013JD020648
Da-Allada, C. Y., Baloïtcha, E., Alamou, E. A., Awo, F. M., Bonou, F., Pomalegni, Y., et al. (2020). Changes in West African summer monsoon precipitation under stratospheric aerosol geoengineering. Earths Future 8:e2020EF001595. doi: 10.1029/2020EF001595
Dagon, K., and Schrag, D. P. (2016). Exploring the effects of solar radiation management on water cycling in a coupled land–Atmosphere model. J. Clim. 29, 2635–2650, doi: 10.1175/JCLI-D-15-0472.1
Dai, A. (2016). Historical and Future Changes in Streamflow and Continental Runoff: A Review. doi: 10.1002/9781118971772.ch2
Distributed Active Archive Center (2000). Global Soil Data Products (IGBP-DIS). Oak Ridge National Laboratory Distributed Active Archive Center. Available online at: https://daac.ornl.gov/cgi-bin/dsviewer.pl?ds_id=565 (accessed April 8, 2022).
Donat, M. G., Alexander, L. V., Yang, H., Durre, I., Vose, R., and Caesar, J. (2013). Global land-based datasets for monitoring climatic extremes. Bull. Am. Meteorol. Soc. 94, 997–1006. doi: 10.1175/BAMS-D-12-00109.1
Donnelly, C., Greuell, W., Andersson, J., Gerten, D., Pisacane, G., Roudier, P., et al. (2017). Impacts of climate change on European hydrology at 1.5, 2 and 3 degrees mean global warming above preindustrial level. Clim. Change 143, 13–26. doi: 10.1007/s10584-017-1971-7
FAO (2016). AQUASTAT Transboundary River Basin Overview – La Plata. Food and Agriculture Organization of the United Nations (FAO). Rome, Italy.
Frich, P., Alexander, L. V., Della-Marta, B., Gleason, B., Haylock, M., Klein, T. A., et al. (2002). Observed coherent changes in climatic extremes during the second half of the twentieth century. Clim. Res. 19, 193–212. doi: 10.3354/cr019193
Frieler, K., Lange, S., Piontek, F., Reyer, C. P. O., Schewe, J., Warszawski, L., et al. (2017). Assessing the impacts of 1.5°C global warming – simulation protocol of the InterSectoral Impact Model Intercomparison Project (ISIMIP2b). Geosci. Model Dev. 10, 4321–4345. doi: 10.5194/gmd-10-4321-2017
Hansen, M. C., DeFries, R. S., Townshend, J. R., and Sohlberg, R. (2000). Global land cover classification at 1 km resolution using a classification tree approach. Int. J. Remote Sens. 21, 1331–1364. doi: 10.1080/014311600210209
Held, I. M., and Soden, B. J. (2006). Robust responses of the hydrological cycle to global warming. J. Climate 19, 5686–5699. doi: 10.1175/JCLI3990.1
Irvine, P. J., and Keith, D. W. (2020). Halving warming with stratospheric aerosol geoengineering moderates policy-relevant climate hazards. Environ. Res. Lett. 15:044011. doi: 10.1088/1748-9326/ab76de
Iturbide, M., Gutiérrez, J. M., Alves, L. M., Bedia, J., Cerezo-Mota, R., Cimadevilla, E., et al. (2020). An update of IPCC climate reference regions for subcontinental analysis of climate model data: definition and aggregated datasets. Earth Syst. Sci. Data 12, 2959–2970. doi: 10.5194/essd-12-2959-2020
Ji, D., Fang, S., Curry, C. L., Kashimura, H., Watanabe, S., Cole, J. N. S., et al. (2018). Extreme temperature and precipitation response to solar dimming and stratospheric aerosol geoengineering. Atmos. Chem. Phys. 18, 10133–10156. doi: 10.5194/acp-18-10133-2018
Keith, D., and MacMartin, D. (2015). A temporary, moderate and responsive scenario for solar geoengineering. Nature Clim Change. 5, 201–206. doi: 10.1038/nclimate2493
Kim, Y.-H., Min, S.-K., Zhang, X., Sillmann, J., and Sandstad, M. (2020). Evaluation of the CMIP6 multi-model ensemble for climate extreme indices. Weather Clim. Extremes 29:100269. doi: 10.1016/j.wace.2020.100269
Klein Tank, A. M. G., Zwiers, F. W., and Zhang, X. (2009). Guidelines on Analysis of Extremes in a Changing Climate in Support of Informed Decisions for Adaptation. WMO-TD No. 1500/WCDMP-No. 72, Geneva (52 pp).
Lawrence, M. G., Schäfer, S., Muri, H., Scott, V., Oschlies, A., Vaughan, N. E., et al. (2018). Evaluating climate geoengineering proposals in the context of the Paris Agreement temperature goals. Nat. Commun. 9:3734. doi: 10.1038/s41467-018-05938-3
Liang, X., Lettenmaier, D. P., Wood, E. F., and Burges, S. J. (1994). A simple hydrologically based mode of land surface water and energy fluxes for GSMs. J. Geophys. Res. 99, 14415–14428. doi: 10.1029/94JD00483
Lohmann, D., Rashke, E., Nijssen, B., and Lettenmaier, D. P. (1998). A large-scale horizontal routing model to be coupled to land surface parameterization schemes. Tellus A 48, 708–721. doi: 10.3402/tellusa.v48i5.12200
MacCracken, M. C. (2009). On the possible use of geoengineering to moderate specific climate change impacts. Environ. Res. Lett. 4:045107doi: 10.1088/1748-9326/4/4/045107
Mattheussen, B., Kirschbaum, R. L., Goodman, I. A., O'Donnell, G. M., and Lettenmaier, D. P. (2000). Effects of land cover change on streamflow in the interior Columbia River basin (USA and Canada). Hydrol. Processes 14, 867–885. doi: 10.1002/(SICI)1099-1085(20000415)14:5<867::AID-HYP975>3.0.CO;2-5
Meehl, G. A., Covey, C., Delworth, T., Latif, M., McAvaney, B., Mitchell, J. F. B., et al. (2007). The WCRP CMIP3 multimodel dataset: a new era in climate change research. Bull. Am. Meteorological Soc. 88, 1383–1394. doi: 10.1175/BAMS-88-9-1383
Meinshausen, M., Smith, S. J., Calvin, K., Daniel, J. S., Kainuma, M. L. T., Lamarque, J. F., et al. (2011). The RCP greenhouse gas concentrations and their extensions from 1765 to 2300. Clim. Change 109:213. doi: 10.1007/s10584-011-0156-z
Mills, M. J, Richter, S., Tilmes, B., Kravitz, D., MacMartin, A., et al. (2017). Radiative and chemical response to interactive stratospheric sulfate aerosols in fully coupled CESM1 (WACCM). J. Geophys. Res. Atmos. 122, 13061–13078. doi: 10.1002/2017JD027006
Montroull, N. B., Saurral, R. I., and Camilloni, I. A. (2018). Hydrological impacts in La Plata basin under 1.5, 2 and 3°C global warming above the pre-industrial level. Int. J. Climatol. 38, 3355–3368. doi: 10.1002/joc.5505
Nijssen, B. N., Lettenmaier, D. P., Liang, X., Wetzel, S. W., and Wood, E. F. (1997). Streamflow simulation for continental-scale river basins. Water Resour. Res. 33, 711–724. doi: 10.1029/96WR03517
Odoulami, R. C., New, M., Wolski, P., Guillemet, G., Pinto, I., Lennard, C., et al. (2020). Stratospheric aerosol geoengineering could lower future risk of ‘Day Zero' level droughts in Cape Town. Environ. Res. Lett. 15:124007. doi: 10.1088/1748-9326/abbf13
Penalba, O. C., Rivera, J. A., and Pántano, V. C. (2014). The CLARIS LPB database: constructing a long-term daily hydro-meteorological dataset for La Plata Basin, Southern South America. Geosci. Data J. 1, 20–29. doi: 10.1002/gdj3.7
Pinto, I., Jack, C., Lennard, C., Tilmes, S., and Odoulami, R. C. (2020). Africa's climate response to solar radiation management with stratospheric aerosol. Geophys. Res. Lett. 47:e2019GL086047. doi: 10.1029/2019GL086047
Popescu, I., Brandimarte, L., and Peviani, M. (2014). Effects of climate change over energy production in La Plata Basin. Int. J. River Basin Manag. 12, 319–327. doi: 10.1080/15715124.2014.917317
Robock, A., MacMartin, D. F., Duren, R., and Christensen, M. W. (2013). Studying geoengineering with natural and anthropogenic analogs. Clim. Change 121, 445–458. doi: 10.1007/s10584-013-0777-5
Robock, A., Oman, L., and Stenchikov, G. L. (2008). Regional climate responses to geoengineering with tropical and Arctic SO2 injections. J. Geophys. Res. 113:D16. doi: 10.1029/2008JD010050
Saurral, R. I. (2010). The hydrologic cycle of the La Plata Basin in the WCRP-CMIP3 multi-model dataset. J. Hydrometeor. 5, 1083–1102. doi: 10.1175/2010JHM1178.1
Saurral, R. I., Montroull, N. B., and Camilloni, I. A. (2013). Development of statistically unbiased 21st century hydrology scenarios over La Plata Basin.Intl. J. River Basin Manag. 11, 329–343. doi: 10.1080/15715124.2014.885440
Seneviratne, S. I., Nicholls, N., Easterling, D., Goodess, C. M., Kanae, S., Kossin, J., et al. (2012). “Changes in climate extremes and their impacts on the natural physical environment,” in Managing the Risks of Extreme Events and Disasters to Advance Climate Change Adaptation, eds C. B. Field, V. Barros, T. F. Stocker, D. Qin, D. J. Dokken, K. L. Ebi, M. D. Mastrandrea, K. J. Mach, G.-K. Plattner, S. K. Allen, M. Tignor, and P.M. Midgley. A Special Report of Working Groups I and II of the Intergovernmental Panel on Climate Change (IPCC) (Cambridge; New York, NY: Cambridge University Press), 109–230. doi: 10.1017/CBO9781139177245.006
Sillmann, J., Kharin, V. V., Zwiers, F. W., Zhang, X., and Bronaugh, D. (2013). Climate extremes indices in the CMIP5 multimodel ensemble: part 2. Future climate projections. J. Geophys. Res. Atmos. 118, 2473–2493. doi: 10.1002/jgrd.50188
Simpson, I. R., Tilmes, S., Richter, J. H., Kravitz, B., MacMartin, D. G., Mills, M. J., et al. (2019). The regional hydroclimate response to stratospheric sulfate geoengineering and the role of stratospheric heating. J. Geophys. Res. Atmos. 124, 12587–12616. doi: 10.1029/2019JD031093
Su, F., and Lettenmaier, D. P. (2009). Estimation of surface water budget of La Plata Basin. J. Hydrometeorology 10, 981–998. doi: 10.1175/2009JHM1100.1
Tilmes, S., Fasullo, J., Lamarque, J. F., Marsh, D. R., Mills, M., Alterskjær, K., et al. (2013). The hydrological impact of geoengineering in the Geoengineering Model Intercomparison Project (GeoMIP). J.Geophys. Res. Atmos. 118, 11036–11058. doi: 10.1002/jgrd.50868
Tilmes, S., Richter, J. H., Kravitz, B., MacMartin, D. G., Mills, M. J., Simpson, I. R., et al. (2018). CESM1(WACCM) Stratospheric aerosol geoengineering large ensemble project. Bull. Am. Meteorol. Soc. 99, 2361–2371. doi: 10.1175/BAMS-D-17-0267.1
UNFCCC (2015). Adoption of the Paris Agreement. United Nations Framework Convention on Climate Change Rep., 32p.
United States Geological Survey (1997). (USGS)USGS 30 ARC-second Global Elevation Data, GTOPO30. Research Data Archive at the National Center for Atmospheric Research, Computational and Information Systems Laboratory.
Vera, C. S., and Díaz, L. (2015). Anthropogenic influence on summer precipitation trends over South America in CMIP5 models. Int. J. Climatol. 35, 3172–3177. doi: 10.1002/joc.4153
Weedon, G. P., Balsamo, G., Bellouin, N., Gomes, S., Best, M. J., and Viterbo, P. (2014). The WFDEI meteorological forcing data set: WATCH forcing data methodology applied to ERA-Interim reanalysis data. Water Resour. Res. 50, 7505–7514. doi: 10.1002/2014WR015638
Wigley, T. M. (2006). A combined mitigation/geoengineering approach to climate stabilization. Science 314, 452–454. doi: 10.1126/science.1131728
Wood, A. W., Maurer, E. P., Kumar, A., and Lettenmaier, D. P. (2002). Long-range experimental hydrologic forecasting for the eastern United States. J. Geophys. Res. 107:ACL61–ACL615. doi: 10.1029/2001JD000659
Zaninelli, P. G., Menéndez, C. G., Falco, M., López-Franca, N., and Carril, A. F. (2018). Future hydroclimatological changes in South America based on an ensemble of regional climate models Clim.Dyn. 52, 819–830. doi: 10.1007/s00382-018-4225-0
Zhang, H., Delworth, T. L., Zeng, F., Vecchi, G., Paffendorf, K., and Jia, L. (2016). Detection, attribution, and projection of regional rainfall changes on (Multi-) Decadal time scales: a focus on Southeastern South America. J. Clim. 29, 8515–8534. doi: 10.1175/JCLI-D-16-0287.1
Keywords: climate change, extremes, solar geoengineering, GLENS, hydrologic model, South America
Citation: Camilloni I, Montroull N, Gulizia C and Saurral RI (2022) La Plata Basin Hydroclimate Response to Solar Radiation Modification With Stratospheric Aerosol Injection. Front. Clim. 4:763983. doi: 10.3389/fclim.2022.763983
Received: 24 August 2021; Accepted: 29 March 2022;
Published: 26 April 2022.
Edited by:
Jose A. Marengo, Centro Nacional de Monitoramento e Alertas de Desastres Naturais (CEMADEN), BrazilReviewed by:
Daniele Visioni, Cornell University, United StatesCopyright © 2022 Camilloni, Montroull, Gulizia and Saurral. This is an open-access article distributed under the terms of the Creative Commons Attribution License (CC BY). The use, distribution or reproduction in other forums is permitted, provided the original author(s) and the copyright owner(s) are credited and that the original publication in this journal is cited, in accordance with accepted academic practice. No use, distribution or reproduction is permitted which does not comply with these terms.
*Correspondence: Inés Camilloni, aW5lc0BjaW1hLmZjZW4udWJhLmFy
Disclaimer: All claims expressed in this article are solely those of the authors and do not necessarily represent those of their affiliated organizations, or those of the publisher, the editors and the reviewers. Any product that may be evaluated in this article or claim that may be made by its manufacturer is not guaranteed or endorsed by the publisher.
Research integrity at Frontiers
Learn more about the work of our research integrity team to safeguard the quality of each article we publish.