
94% of researchers rate our articles as excellent or good
Learn more about the work of our research integrity team to safeguard the quality of each article we publish.
Find out more
ORIGINAL RESEARCH article
Front. Clim., 25 January 2023
Sec. Predictions and Projections
Volume 4 - 2022 | https://doi.org/10.3389/fclim.2022.1080978
This article is part of the Research TopicDynamics and Impacts of Tropical Climate Variability: Understanding Trends and Future ProjectionsView all 7 articles
 Boris Dewitte1,2,3,4*
 Emilio Concha4
 Diego Saavedra5
 Oscar Pizarro6,7
 Cristian Martinez-Villalobos8,9Daria Gushchina10
 Marcel Ramos2,3Aldo Montecinos6
Previous studies have investigated the role of the Pacific meridional mode (PMM), a climate mode of the mid-latitudes in the Northern and Southern Hemisphere, in favoring the development of the El Niño Southern Oscillation (ENSO). However little is known on how ENSO can influence the development of the PMM. Here we investigate the relationship between ENSO and the South Pacific Meridional Mode (SPMM) focusing on strong SPMM events that follows strong El Niño events. This type of events represents more than 60% of such events in the observational record and the historical simulations of the CESM Large ensemble (CESM-LE). It is first shown that such a relationship is rather stationary in both observations and the CESM-LE. Our analyses further reveal that strong SPMM events are associated with a coastal warming off northern central Chile peaking in Austral winter resulting from the propagation of waves forced at the equator during the development of El Niño events. The time delay between the ENSO peak (Boreal winter) and this coastal warming (Austral winter) can be understood in terms of the differential contribution of the equatorially-forced propagating baroclinic waves to the warming along the coast. In particular, the difference in phase speeds of the waves (the high-order mode the wave the slower) implies that they do not overlap along their propagation south of 20°S. This contributes to the persistence of warm coastal SST anomalies off Central Chile until the Austral summer following the concurrent El Niño event. This coastal warming is favorable to the development of strong SPMM events as the South Pacific Oscillation become active during that season. The analysis of the simulations of the Coupled Intercomparison Project phases 5 and 6 (CMIP5/6) indicates that very few models realistically simulate this ENSO/SPMM relationship and associated oceanic teleconnection.
The El Niño-Southern Oscillation (ENSO) phenomenon represents the strongest fluctuation of the global climate system. Despite extensive research over the last five decades (Neelin et al., 1998; McPhaden et al., 2020) it has remained difficult to predict (Barnston et al., 2012; L'Heureux et al., 2020). While this is partly associated to the non-linearity of ENSO dynamics, which could make prediction sensitive to initial conditions, it is also related to the nature of the external excitation processes of ENSO (hereafter referred to as “external forcing”), which has multiples sources and facets [e.g., Dommenget and Yu (2017) and Thomas et al. (2018) among many others]. One important issue in ENSO research in recent years has been to determine how external forcing outside the equatorial Pacific can modulate either the background state, the atmospheric noise along the equator (i.e., Westerly Wind Bursts, hereafter WWBs), or both (Kug et al., 2020). In fact external forcing has been recently considered as an integral part of the so-called ENSO complexity (Timmermann et al., 2018), that refers to the mechanisms that produce amplitude and temporal asymmetry of the ENSO cycle, and different ENSO patterns. Studies have also highlighted that the low-frequency part of the noise is certainly as important as the high-frequency part for ENSO development (Roulston and Neelin, 2000; Levine and Jin, 2010; Lopez et al., 2013; Cai et al., 2018; Capotondi et al., 2018; Takahashi et al., 2018), although both are linked (Jin et al., 2007; Seiki and Takayabu, 2007; Tziperman and Yu, 2007).
Among the sources of low-frequency external forcing to ENSO one finds the so-called Pacific Meridional Modes (PMM). These refer to a seasonally evolving mode of coupled climate variability linking the tropics and the extra-tropics through the Wind-Evaporation-Sea Surface Temperature (WES) feedback mechanism (Xie and Philander, 1994; Xie, 1999; Vimont et al., 2001; Chiang and Vimont, 2004; Yu and Kim, 2011; Larson and Kirtman, 2013). In this feedback, the low-level atmosphere responds to warm/cold SST anomalies occurring underneath the subtropical branch of the trade winds: During warm SST anomalies, the concurrent reduction in surface winds tend to reduce evaporation and produces a positive feedback for SST anomalies along with favoring its propagation in the direction of the trade winds. Most of the literature on PMMs has focused on the North Pacific Meridional Mode (hereafter NPMM), which represents the second leading mode of North Pacific ocean-atmosphere variability (Chiang and Vimont, 2004; hereafter CV04). The NPMM has been shown to influence the ENSO diversity that refers to the existence of two types of El Niño events, the Central Pacific (CP) El Niño and the Eastern Pacific (EP) El Niño (Capotondi et al., 2020). Vimont et al. (2014) showed in particular that the NPMM is linked to the occurrence of CP El Niño events, although there is also indication of a significant role of natural variability and that this relationship may not be stationary (Thomas and Vimont, 2016). While it is usually assumed that the NPMM is a forcing of CP El Nino events, Stuecker (2018) also suggests that there is in fact a positive feedback between the NPMM and CP El Niño development implying a quasi-in phase relationship, contrasting with former studies (Chang et al., 2007; Yu and Kim, 2011; Vimont et al., 2014) suggesting a delayed relationship (NPMM leads CP El Niño). Although there is still a debate on the existence of a selection mechanism of El Niño type through the forcing of the NPMM, it is generally accepted that the realistic simulation of the NPMM/ENSO relationship in forecast models may reduce ENSO forecasting error (Amaya, 2019).
Recently a similar mode in the South Pacific was documented called the South Pacific Meridional Mode (hereafter SPMM) (Zhang et al., 2014). Like for the North Pacific, this mode integrates the stochastic forcing from the South Hemisphere extratropics [South Pacific Oscillation (SPO), (You and Furtado, 2017)] and injects interannual to decadal-scale variance into the tropical system through the equatorward/westward propagation of SST anomalies [cf. Di Lorenzo et al. (2015) for the North Pacific]. The SPMM has thus also the potential to influence ENSO evolution and diversity. In particular, it has been suggested that SPMM could be associated with the development of EP El Niño events based on modeling studies (Zhang et al., 2014; Larson et al., 2018) and Reanalysis data (Min et al., 2017). However, the mechanisms behind the SPMM/ENSO relationship remain unclear. While Zhang et al. (2014) suggest that the SPMM triggers ENSO in a similar manner than the NPMM does, that is by influencing westerlies in the equatorial-central Pacific, Larson et al. (2018) suggests that the SPMM influences thermal damping in the NINO3 [90–150°W; 5°S−5°N] region, which modulates the amplitude of ENSO if it has developed. In the former mechanism, the SPMM acts as a trigger of the deterministic ENSO dynamics (e.g., reduced trade winds yield the equatorial westerlies that can excite downwelling Kelvin waves), while in the latter, it is an external forcing acting as a “booster” of the ENSO strength through reduction of thermal damping. The statistical analysis of Min et al. (2017) suggests that the SPMM mainly favors the development of SST anomalies (SSTAs) in the eastern equatorial Pacific. However in their composite evolution analysis of SPMM events, the variance of ENSO is not removed, which implies no statistical independence at near zero lag. On the other hand, the residual definition of the PMMs as in CV04 through removing the influence of a single ENSO index [i.e., the Cold Tongue Index, the SSTAs averaged over 6°S−6°N and 180°-90°W (Deser and Wallace, 1990)], has some limitations because of the diversity of ENSO that needs to be accounted for by two indices at least (Takahashi et al., 2011; Capotondi et al., 2020). In that definition the PMMs still contain some ENSO variance not necessarily exclusively associated with the WES feedback. A statistical definition of the SPMM is thus not straightforward when it comes to investigate its relationship with ENSO near zero lag. Here, recognizing the current limitations of the statistical definition of the PMMs to infer quasi-in phase relationship (Stuecker, 2018), we focus on the SPMM/ENSO relationship at “long” lags, that is beyond two seasons which corresponds to a timescale for which the persistence of ENSO is significantly reduced. Additionally, observing that the SPMM tends to lag EP El Niño event by ~10 months (well manifested during strong EP El Niño events; see purple shading in Figure 1B), we focus on investigating the SPMM/ENSO relationship when ENSO is a precursor signal of the SPMM. This does not discard the fact that the SPMM can also acts as a precursor signal of ENSO, but our results suggest that this relationship is weaker within the considered assumptions (i.e., statistical independence at zero lag between indices).
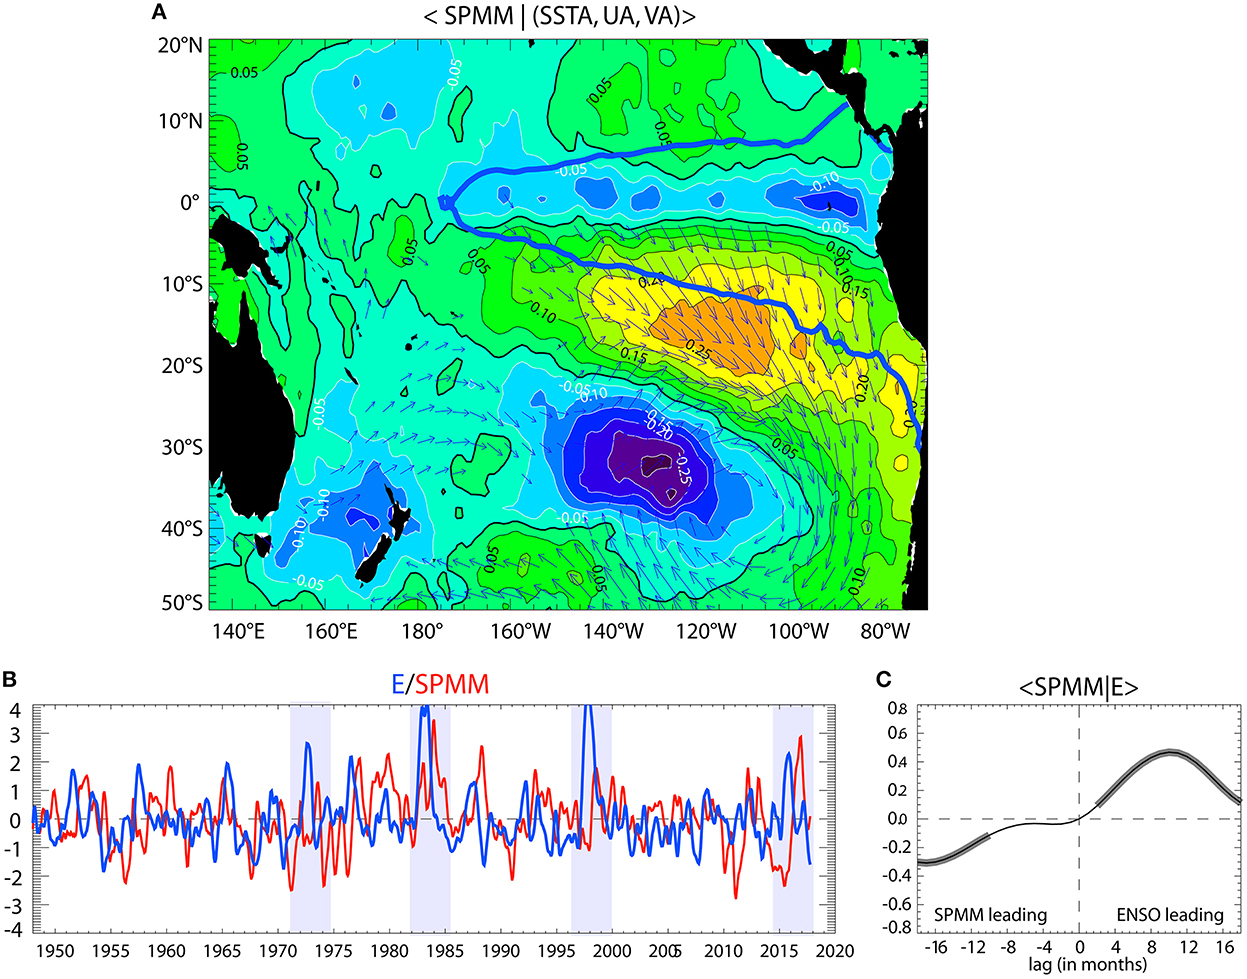
Figure 1. (A) Regression map of the SVD leading mode SST/Wind expansion coefficients for the SST and 10-m wind vectors. The expansion coefficients have been normalized so that units are °C and m/s for SST and wind respectively. The longest arrow on the maps corresponds to a wind amplitude of 0.66 m/s. The mode explains 70% of the covariance between the variables. The contour in thick blue line corresponds to the iso-contour 0.25°C of the E mode pattern. (B) Time series of the SPMM index (i.e., expansion coefficient of the first SVD mode for SST) and the E index. The shading indicates periods of strong EP El Niño events (1972/73, 1982/83, 1997/98 and 2015/16). (C) Lagged correlation analysis between the SPMM and E indices. The segments in thick line indicate when the correlation is statistically significant at the 99% level based on a Student's t-test. Negative lags mean that the SPMM index is ahead the E index.
Our aim is thus to investigate the dynamical linkage behind this relationship considering its relevance for understanding ENSO complexity (Timmermann et al., 2018). Our motivation also extends to the need to evaluate how model participating in the Coupled Models Intercomparison Project (CMIP) accounts for such an SPMM/ENSO relationship. In particular CMIP models still suffer persistent biases in their representation of the ENSO cycle (Timmermann et al., 2018), which calls for better understanding external excitation processes.
The paper is organized as follows: Section 2 describes the data sets and the methods. Section 3 analyses the lead-lagged relationship between the SPMM and ENSO diversity in the observations and the CESM-LE, while section 4 provides evidences of the role of oceanic teleconnection along the coast in the development of the ENSO-induced SPMM. Section 5 is a discussion based on an analysis of the CMIP (Phases 5 and 6) models in terms of the SPMM/ENSO relationship, which is followed by concluding remarks.
The SSTs analyzed in this study are taken from the HadISST v1.1. data set (Rayner et al., 2003) covering the period 1948–2017 and released by the Met Office Hadley Center. 10-m wind data were taken from the National Centers for Environmental Prediction/National Center for Atmospheric Science (NCEP/NCAR) reanalysis data for the same period (Kalnay et al., 1996).
In order to overcome limitations associated to the relatively short data set used here for addressing decadal variability in the SPMM/ENSO relationship, we use long-term simulations of the NCAR Community Earth System Model (CESM) (Kay et al., 2015), a Coupled General Circulation Model skillful in representing ENSO diversity (Karamperidou et al., 2015; Dewitte and Takahashi, 2017; Cai et al., 2018; Carréric et al., 2020) and the NPMM characteristics (Liguori and Di Lorenzo, 2019). The 42 members of the historical runs (1920–2005) of the CESM Large Ensemble Project (CESM-LE) are used here consisting in a total of 3,600 years. This allows to estimate the spread between the members and thus uncertainties due to internal climate variability in some diagnostics. Additionally we use 62 models from the CMIP archive (Phases 5 and 6) (see Table 1).
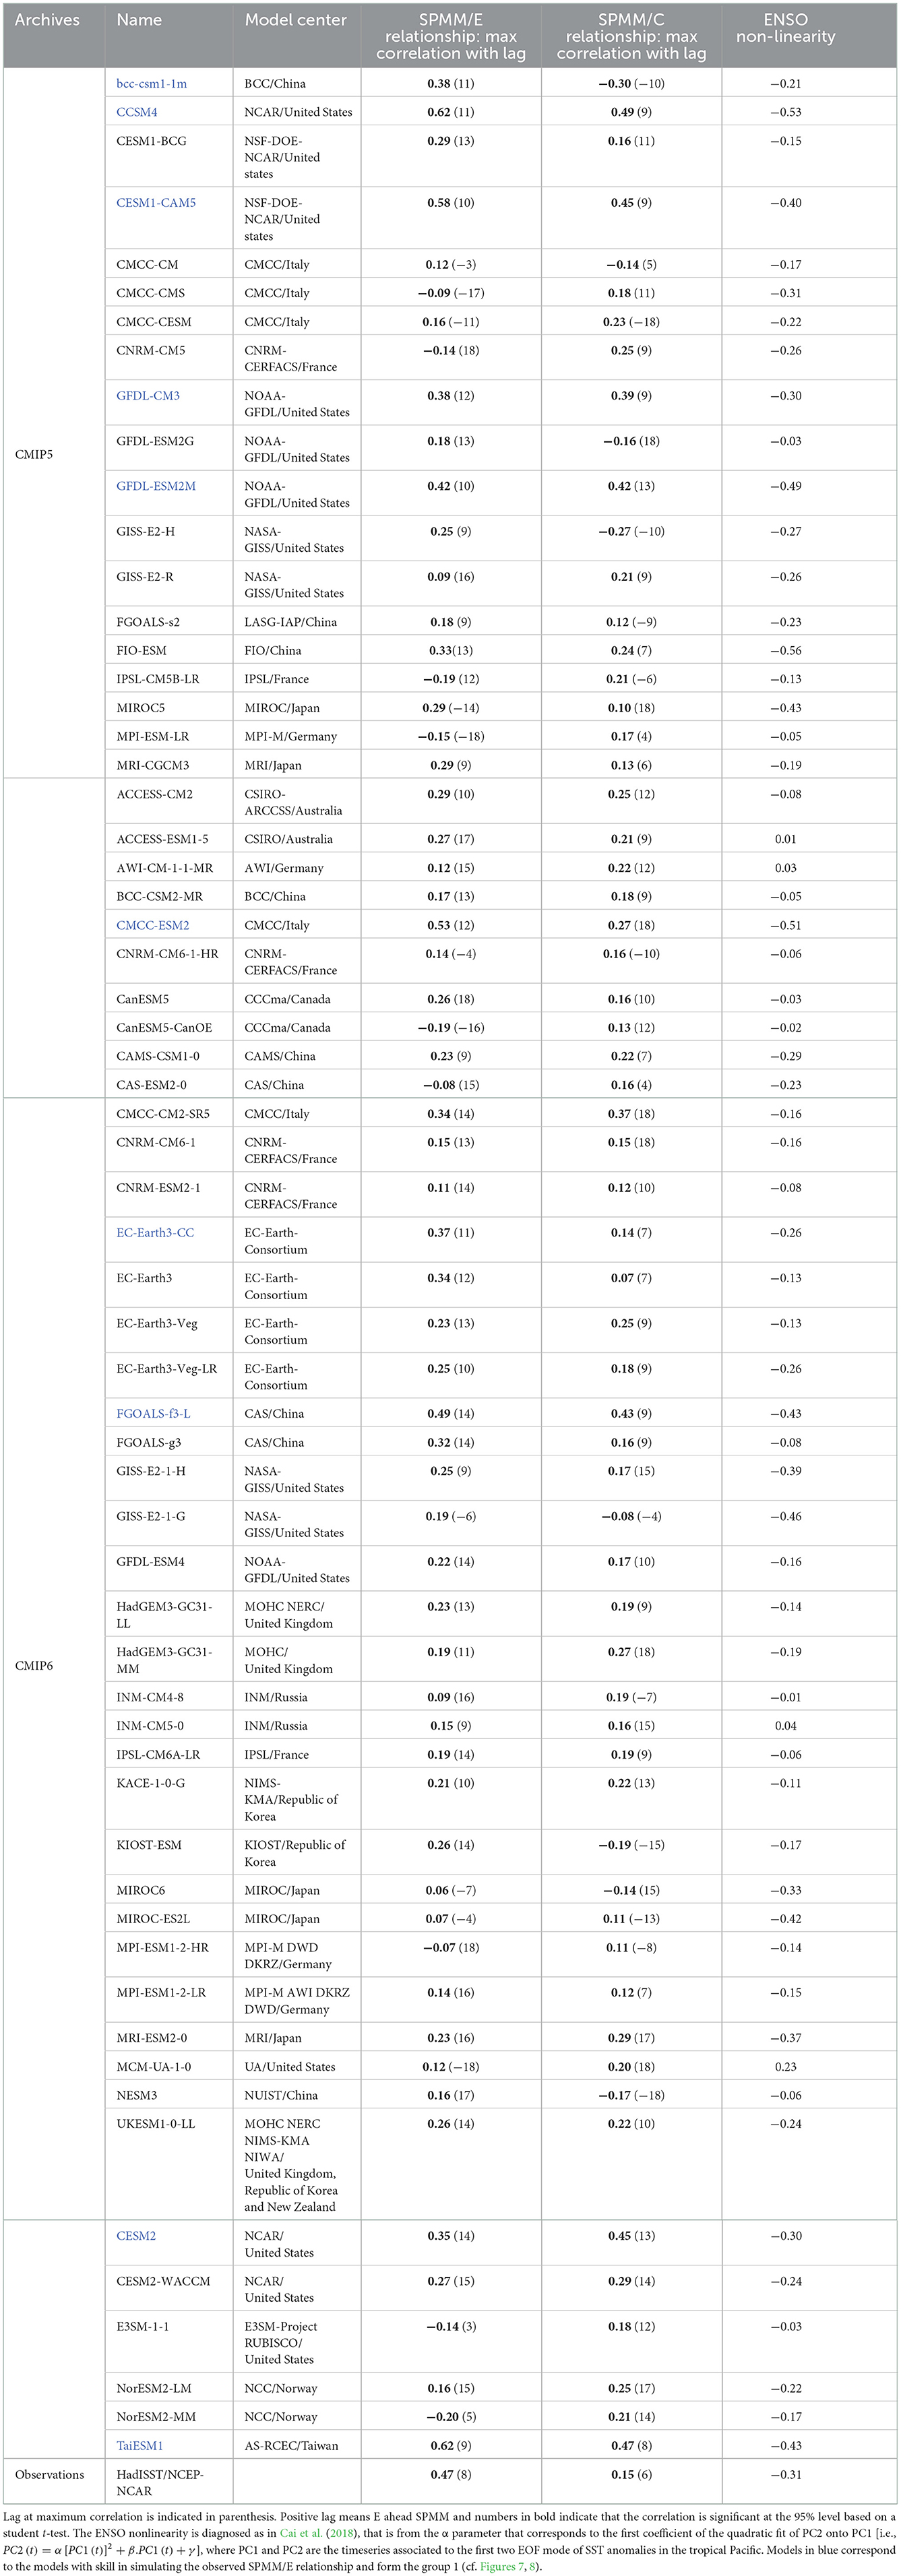
Table 1. Description of the selected 62 models and statistics: The SPMM/E relationship is diagnosed from the maximum value of the correlation between the SPMM and E indices.
To characterize ENSO variability in the tropical domain, we use the E and C indices of Takahashi et al. (2011) defined as E = (PC1+PC2)/√2 and C = (PC1-PC2)/√2 where the PC1 and PC2 are the principal component (PC) timeseries (normalized) of the first two EOF (Extended Orthogonal Function) modes of SST anomalies in the tropical Pacific [11°S−11°N; 120–290°E]. E and C are thus linearly uncorrelated by construction and can be conveniently used for deciphering the influence of ENSO types on a particular field or vice-versa. The E index accounts for EP El Niño events and captures extreme El Niño events (and is thus positively skewed, see blue curve on Figure 1B), while the C index accounts for CP El Niño and La Niña events (see Takahashi et al., 2011).
To derive the SPMM index, we follow Chiang and Vimont (2004) and use Singular Value Decomposition (SVD) analysis (Bretherton et al., 1992) to derive the eigenvectors and eigenvalues of the covariance matrix between 10-meter winds and SST anomalies that have been previously filtered out from ENSO influence (See first eigenvector and eigenvalue in Figures 1A, B). The SVD is carried out over the region (140°W−90°W; 40°S−0°). While CV04 remove from the original fields the regression on the Cold Tongue Index (i.e., SST anomalies averaged over the region (180°-90°W; 6°S−6°N), hereafter CTI) prior to the SVD analysis, here we remove from the SST and 10-meter wind fields (linear trend removed) the contribution of both the E and C indices. This is motivated by the fact that two indices at least should be used in order to account for the different location of peak SST anomalies during ENSO (Takahashi et al., 2011). In particular the approximate CTI index obtained through bilinear regression onto the E and C indices over the period 1948–2017 yields CTI_approx = 0.46E + 0.51C, (which explains 99% of the CTI variance), so that the CV04's method only removes a certain percentage of the share associated to the EP and CP El Niño variability. This limits the interpretation of the lead-lag relationship between the SPMM and ENSO indices near zero lag since part of this relationship would be associated to the persistence of ENSO. Another difference with CV04's method is that, instead of projecting the full SST field on the SVD mode pattern for SST to derive the index, we use as an index the timeseries associated to the SVD modes, which ensures the orthogonality of the index with ENSO indices at zero lag while easing the interpretation of the inferred SPMM/ENSO relationship. In particular the index accounts for the exact share of the variability in SST (winds) that covaries with the winds (SST) and is thus not “contaminated” by noise (i.e., uncoupled variability). For the observations, anomalies are relative to the seasonal cycle calculated over the period 1950–2014 for all fields and are detrended. A 3-month running mean is applied to the anomalies prior to any manipulation. For the models anomalies are relative to the seasonal cycle over the period 1920–2005.
The South Pacific Oscillation (SPO) index is calculated following You and Furtado (2017) and thus corresponds to the normalized PC timeseries of the first EOF model of sea level pressure anomalies over the domain (10–45°S; 160–70°W).
In order to diagnose equatorial and along-shore propagation in sea level in the CESM-LE simulations, it is convenient to estimate the contributions of the gravest baroclinic modes to the variability. Each mode is associated with a particular phase speed and dissipation rate (the smaller the mode order the faster the wave) so that their summed-up contributions (or the total sea level anomaly) is somewhat difficult to interpret. The method consists in projecting the pressure field onto the vertical modes derived from the mean vertical stratification at each grid point (Dewitte et al., 2008). Following Dewitte et al. (1999), for the equatorial region, we further project the zonal current field in order to derive the equatorial Kelvin waves' amplitude. We fill focus on the first three baroclinic modes because they capture most of the sea level energy in the far eastern Pacific along with exhibiting clear propagating characteristics.
To examine thermodynamical processes associated with SST variability along the coast of Central Chile, we have performed a mixed-layer heat budget analysis of the CESM simulations. The formulation of the heat-budget follows Carréric et al. (2020):
The prime denotes the monthly mean anomaly relative to the mean climatology. T is the 4D-potential temperature, u, v and w are respectively 4-D zonal, meridional and vertical currents. Square brackets indicate vertical integration over the surface layer, whose depth h is set at 50 m. The first three right hand side terms correspond respectively to the zonal, meridional and vertical advections. Qnet is the net downward surface heat fluxes, composed of shortwave (SW) and longwave (LW) radiation, latent (LH) and sensible (SH) heat fluxes to which we remove the shortwave radiation transmitted at 50 m following the parametrization of Pacanowski and Griffies (1999). The coefficients ρ0 and Cp are respectively the sea-water reference density (kg/m3) and the specific heat content [J/(kg.C)]. The residual term R includes the horizontal and vertical diffusion of heat, and errors associated with the off-line calculation and the use of monthly mean outputs. A Reynolds decomposition of the advection terms is further performed to examine the contribution of linear and non-linear processes.
We estimate the lagged correlation between ENSO and the SPMM indices (SST and winds) over the full period (1948–2017). The results are presented in Figure 2. First we note that the correlation at zero lag between the SPMM index and ENSO indices is zero by construction. The Figure 2A indicates that the correlation between the SPMM index and the ENSO indices reach statistically significant values for both positive and negative lags. However, the relationship is stronger for positive lags. In particular, the lag-correlation between the SPMM index and the E index peaks at 0.5 at lag 10 months for SST while it is much weaker (not significant) for the C index, indicating that the SPMM relates more to EP El Niño events than to CP El Niño. We checked that the results are only weakly impacted when the fields are not filtered prior to performing the SVD analysis to derive the SPMM index (not shown). The peak negative correlation (r = −0.3) is reached for a lag of ~17 months (SPMM leads ENSO), meaning that a positive phase of the SPMM tends to yield a reduction of the E index almost 1 year and a half later. In order to evaluate the stationarity of the relationship between SPMM and El Niño types, we extend the previous analysis by considering the lead-lagged relationship of the El Niño indices (NINO34, E and C) and the SPMM index over 21-years running segments (Figures 2B–D). Results indicate that the SPMM/E relationship for positive lags is rather stationary (E leads SPMM by ~10 months over most of the record) although its strength is enhanced (i.e., larger values of maximum correlation) after 1975 probably due to the enhanced variability of the E index (e.g., stronger ENSO) after the 1977 climate shift (An and Wang, 2000). For negative lags (SPMM leads ENSO), the inverse relationship between the SPMM and E is mostly observed over the period 1950–1995. On the other hand, the SPMM/NINO34 relationship (Figure 2B) exhibits a change from before and after 1980, which is similar to that of the SPMM/C relationship (Figure 2D). There is in particular a strong negative relationship between the SPMM-induced SST and the C index (SPMM ahead C) during the period 1984–2000, indicating that SPMM tends to precede La Niña events. This can be interpreted as resulting from some SPMM events culminating after El Niño events that are followed by La Niña events, like for the 1987/88 and 1997/98 El Niño events.
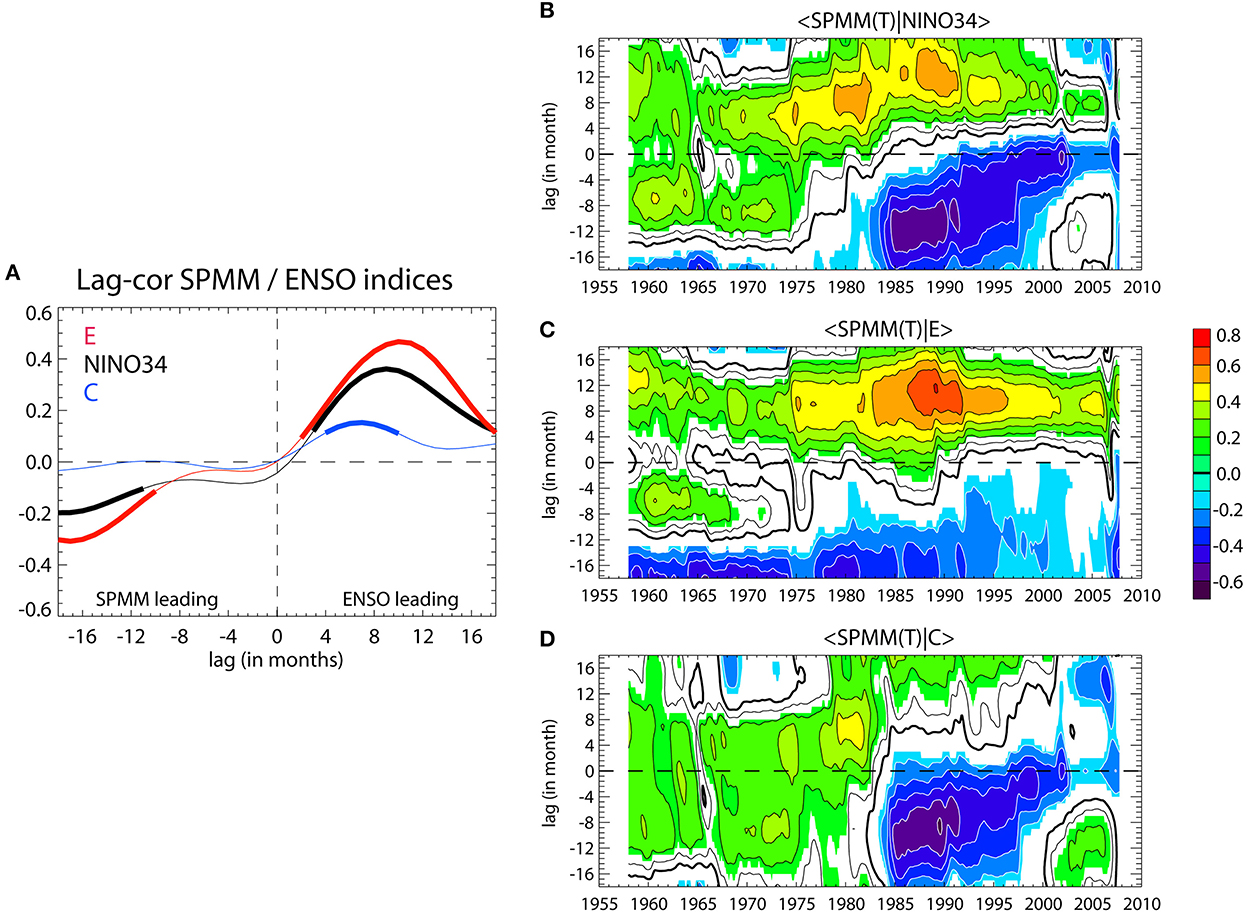
Figure 2. (A) Lagged correlation analysis between the SPMM index and ENSO indices: The color code refers to the ENSO indices (black is NINO34, red is E and blue is C). The segments in thick line indicate when the correlation is statistically significant at the 99% level based on a Student's t-test. Negative lags mean that the SPMM index leads the ENSO indices. (B–D) 21-year running mean correlation between the SPMM index and the ENSO indices [(B): NINO34, (C): E, and (D): C]. Shading is for correlation values significant at the 95% level. Positive lags mean that the ENSO indices lead the SPMM index.
Due to limitations associated with the short observational record, we used the CESM-LE simulations to access a larger number of events and evaluate the influence of natural variability on the SPMM/ENSO relationship. The CESM model has also been shown to be skillful in accounting for ENSO diversity and asymmetry (Karamperidou et al., 2017; Cai et al., 2018; Carréric et al., 2020) and used for investigating aspects of the Meridional Modes (Liguori and Di Lorenzo, 2018, 2019). The SPMM variability is also rather realistic (Figure 3A), which motivates the comparison with observation (Figure 1). Figure 3B shows the ensemble mean lead-lagged correlation between the SPMM index and the E and C indices. It indicates that, like in the observations, that the SPMM/ENSO relationship is strongest for positive lags, that is when ENSO leads. The maximum correlation is reached for lag ~10 months and is larger for the E index than for the C index, like in the observations. On the other hand, the SPMM leads the C index with an inverse relationship (i.e., negative correlation), meaning that in this model a positive phase of the SPMM tends to precede La Nina conditions by ~7 months, which is distinct from what is observed (Figure 2A). The dispersion of the correlation amongst the ensemble is relatively weak (see shading in Figure 2A), suggesting a rather stable SPMM/ENSO relationship in this model. As a further evaluation of the role of low-frequency variability onto the statistics, 21-year running lagged-correlation analysis are performed on the 42 members of the historical runs (1920–2005) of the model yielding a total of 33,264 realizations of lead-lag correlation values between the SPMM index and the ENSO indices (E and C). The density function as a function of lag is then estimated, providing the distribution of the correlation values associated to the expected SPMM/ENSO relationship (Figures 3C, D). The “shape” of the distribution provides a metric of the decadal variability of the SPMM/ENSO relationship. Where it is wide and/or deviate from Gaussianity, this indicates that decadal modulation is likely and that the observational record may have limitations, assuming a “perfect” model. Note that the dashed blue line in Figures 3B, C corresponds to the ensemble mean of the lagged correlation between the SPMM and ENSO indices (i.e., curves of Figure 3C). The deviation of the value of correlation corresponding to the peak of the distribution (~50% percentile in case the distribution is close to Gaussianity) from this mean value would also indicate that decadal modulation in the SPMM/ENSO relationship is notable; This is because this would mean that a large number of correlation values for 21-years chunks does not match with the mean value of the correlation between SPMM and ENSO indices over the whole record. As an indication of the structure of the distribution, we indicated on the panels where the distribution passes the “dip test” (Hartigan, 1985) at the 95% level. This test is based on the hypothesis that the given data have more than one mode in their distribution. The test generates an unimodal distribution function that has the smallest difference values from the empirical distribution function (EDF). The maximum of these differences is referred to as “dip statistic”. The larger the value of the “dip statistic”, the more probable the empirical data have multiple modes. Where the distribution is either likely multimodal (at lags where red diamonds are indicated in Figures 3C, D) or skewed, this indicates a deviation from Gaussianity and therefore the influence of decadal variability on the statistics of the SPMM/ENSO relationship. Overall, results indicate some spread in the lagged correlation that can be visualized by the distance between the 10 and 90% percentiles (curves in thick black lines). Despite this spread, the SPMM index has almost no delayed influence on the E mode (i.e., SPMM leading E) because the correlation values for the 10 and 90% percentiles remains low. However, the distribution for negative lags of the relationship between the SPMM and the C mode (Figure 6C) suggests that there can be periods when the correlation reaches −0.5 (10% percentiles) from lag ~6 months and beyond, suggesting that the SPMM could be a precursor of either CP El Niño or La Niña events over some particular decades. That is a positive (negative) phase of the SPMM would precede a CP La Niña (CP El Niño) event. For positive lags (i.e., ENSO leads SPMM) and the E index, the model is in good agreement with the observations (i.e., the E index preceding the SPMM by ~10 months; Figure 3B). This is consistent with the distribution having a more leptokurtic shape than for negative lags, with a high value for frequency at correlation values near 0.5 (peak correlation at lag 10 months is 0.47 in the observations). This means that this high correlation coefficient is a robust feature with regards to the sensitivity to the period over which the statistics is done. Note that the correlation at lag 10 months reaches 0.70 for the 90% percentiles, indicating that for some decades, the SPMM is tightly linked to EP El Niño events. The 10-month lag indicates that the SPMM enters its peak phase when the coincident EP El Niño event enters either in its decay phase or has reversed into a La Niña event as it is often the case for strong EP El Niño events in that model (Okumura and Deser, 2010; DiNezio et al., 2017). This can explain why the SPMM is ahead the C index with an inverse relationship (i.e., negative correlation) because the C index captures La Niña events. Overall, this indicates that the SPMM follows EP El Niño events in both observations and the CESM-LE simulations. This is further illustrated by the scatter plots of the maximum value of the SPMM index between June and February vs. the DJF E index (Figure 4). The latter reveals in particular that strong SPMM events (i.e., events for which the amplitude of the SPMM index is larger than 1.75 time its standard deviation) are associated with El Niño events with a DJF E index larger than 1, which approximately corresponds to strong El Niño events based on the NINO34 index (i.e., events for which DJF NINO34 larger than 1.75 time its standard deviation). This has taken place 2 times over the observational record (2015/16, 1982/83); that is 66% of the time. Note, while the 1997/98 El Niño does not enter this category it is however associated with a moderate SPMM event. In the CESM-LE, this situation concerns 60% of the SPMM events (Table 2).
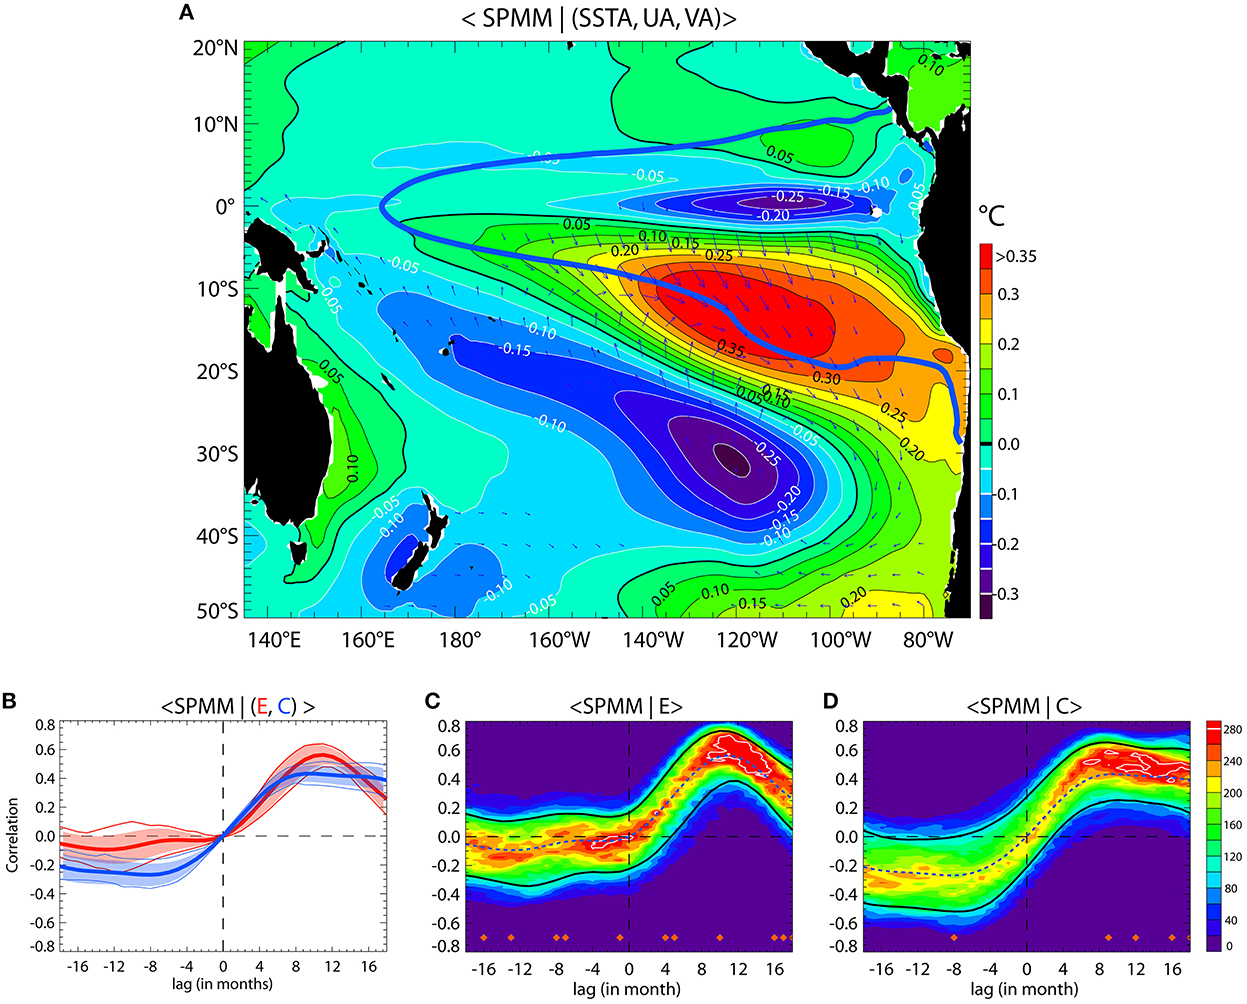
Figure 3. (A) Regression map of the SVD leading mode SST/Wind expansion coefficients for the SST and 10-m wind vectors. The expansion coefficients have been normalized so that units are °C and m/s for SST and wind respectively. The longest arrow on the maps corresponds to a wind amplitude of 0.89 m/s. The covariance of the mode is 83 ± 3.4%. The contour in thick blue line corresponds to the iso-contour 0.25°C of the E mode pattern. (B) Ensemble mean lagged correlation between the SPMM index and (red) E and (blue) C indices. The shading in corresponding color indicates ± the standard deviation amongst the ensemble, while the thin lines indicate the 10% and 90% percentiles. Negative lag means SPMM ahead E/C. (C, D) Distribution of the correlation between the SPMM index and the (C) E and (D) C indices as a function of lead time for 20-year periods chunks of the historical runs of the CESM model. The black lines indicate the 10 and 90% percentiles. The dashed line in blue corresponds to the ensemble mean of the lagged correlation [i.e., curves of (B)]. The red diamonds indicate where the “dip test” for multimodality yields a p value lower than 0.05 (i.e., passing the 95% level).
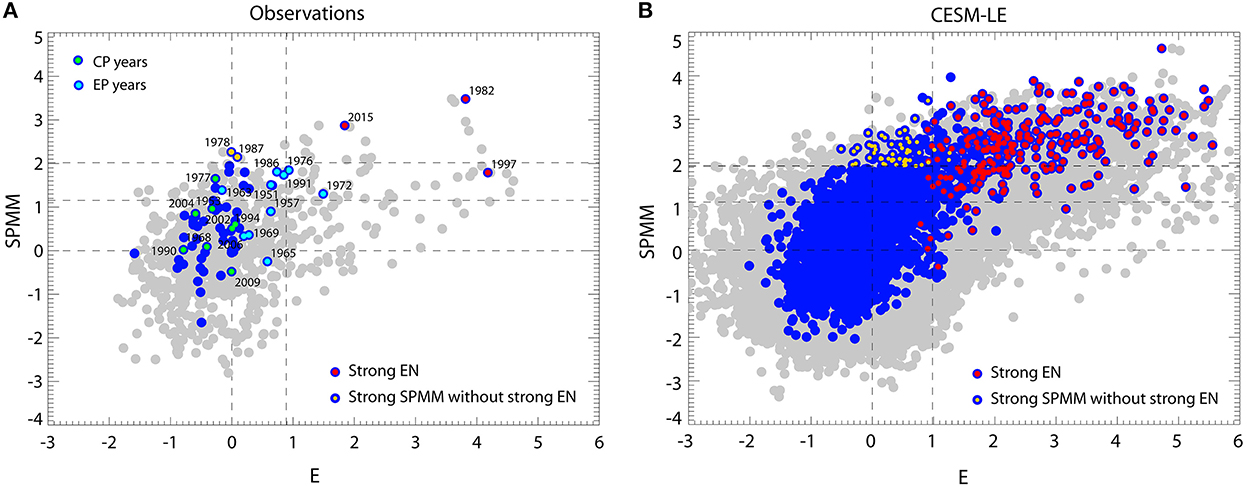
Figure 4. Scatterplot between SPMM and the E indices in the (A) observations and (B) the CESM-LE. Gray dots correspond to the monthly mean indices phase-shifted by 10 months (E ahead SPMM). The blue dots correspond to the DJF E index and the maximum value of the SPMM index between June and February. The inner red and orange dots indicate the strong El Niño events (based on the DJF NINO34) and the strong SPMM events without preceding strong El Niño, respectively. In (A), we also indicate the CP and EP El Niño years with their dates. Note that 1978 is not an El Niño year. The dashed horizontal line indicates the one and 1.75 time the standard deviation of the SPMM index (max. value over June-Feb), while the dashed vertical lines indicate the value of the standard deviation of the DJF E index.
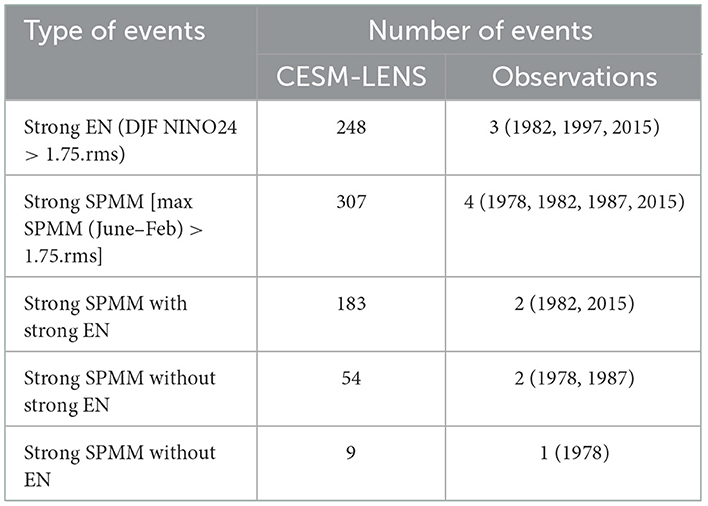
Table 2. Number of event types in observations and the CESM-LENS.
Considering the strong relationship between the E index and SPMM, we hypothesize that strong SPMM events are triggered/favored by coastal warming along the coast of central Chile and that the latter is induced by the equatorial oceanic teleconnection during EP El Niño event. As a first step, in order to diagnose the oceanic teleconnection along the coast, we estimate the lead-lagged correlation between the SPMM index and SST and sea level height (SSH) anomalies along the west coast of South America in the CESM-LE simulations (Figure 5). It shows that maximum correlation is found for positive lags (SPMM behind SST/SSH) and that the latter reduces with increasing latitude, implying a poleward propagation of SST/SSH anomalies of equatorial origin in relation with the SPMM. The correlation peaks in the latitude range 15°-30°S (15°-35°S) for SST (SSH), which corresponds to the location where the SPMM pattern seems to originate from the coast and has a strong loading (see Figure 3A). In order to infer the remote forcing mechanisms of these propagating SST/SSH anomalies, we estimate the composite evolution of SST and decomposed SSH anomalies (cf. method section) along the coast during strong SPMM events (Figure 6). Since upwelling favorable winds along the coast are modulated by the ENSO atmospheric teleconnection through fluctuation of the SPO, we also consider the composite evolution of 10-meter winds (brown arrows in the bottom panels) along with that of the SPO index (brown curves on the top panels). Figure 6 first indicates that strong SPMM events are associated with El Niño conditions as evidenced by the composite evolution of the equatorial Kelvin wave in the eastern Pacific that peak around DJF (year Y0).
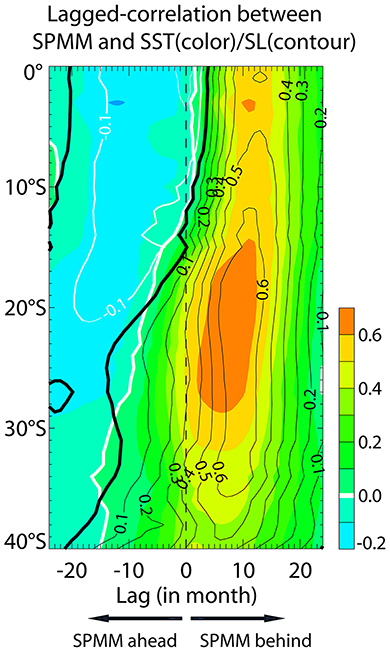
Figure 5. Ensemble mean lagged-correlation between the SPMM index and SST (color)/SSH (contours) anomalies along the west coast of South America (2°-width coastal fringe) between 0° and 40°S. Positive lags indicate SPMM behind SST/SSH.
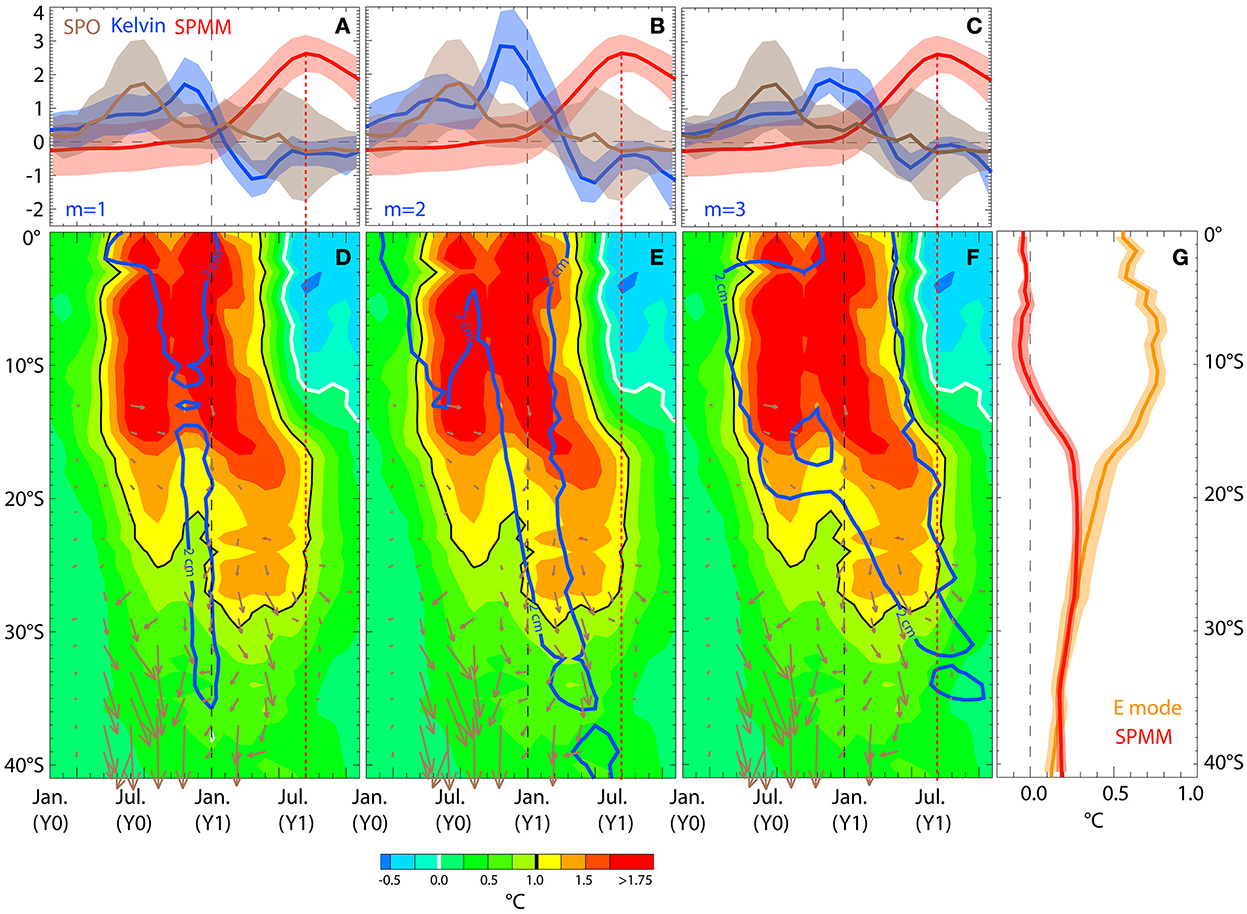
Figure 6. Composite evolution during strong SPMM events (Number of events is 307) of the: (A–C) SPO index (brown line), the contribution of the mth baroclinic mode Kelvin wave to SSH anomalies at 95°W along the equator [blue line, (A) m = 1, (B) m = 2, and (C) m = 3], and the SPMM index (red line). (D–F) The SST (color), surface winds (brown arrows, for clarity arrows are only drawn to the south of 12°S and for negative meridional wind stress anomalies) and decomposed SSH (contours in blue line) anomalies along the west coast of South America (average within a 2°-width coastal fringe). Only the contour at 2 cm is displayed for the decomposed SSH. (G) Displays the ensemble mean spatial pattern of the E mode (orange) and SPMM (red) modes (in °C) along the west coast of South America (average within a 2°-width coastal fringe) and allows visualizing the region of influence of the two modes along the coast. The shading in corresponding color in all the panels indicates the dispersion amongst the ensemble (i.e., ± the standard deviation amongst the ensemble). The vertical dotted line in red indicates the culminating phase of the SPMM event.
Another manifestation of the occurrence of El Niño is the increase magnitude of the SPO index in Austral winter (Y0) (You and Furtado, 2017). The latter is associated with reduced upwelling favorable winds along the coast of Chile south of ~30°S (brown arrows). The coastal conditions feature a double-dip warming associated with downwelling waves originating from the equatorial region, the first one in Austral winter (Y0) and the other one at the peak of El Niño in Austral summer. Note that these waves are either Rossby waves that radiate from the coast or Kelvin waves trapped along the coast or a combination of the two kinds. In particular in Austral winter, El Niño start developing in conjunction with the forcing of intraseasonal Kelvin waves that are trapped along the coast while as El Niño culminates an interannual Kelvin wave is forced and radiate along the western coast as Rossby waves (Clarke and Shi, 1991), which results in a mixed-type of waves along the coast. While the sucessive SST anomalies off Peru are well defined with comparable propagating characteristics, they tend to dissipate from 15°S with altered southward propagation. In particular, the SST anomalies peaking in Austral summer propagates much slower from 15°S until 20°S, which is associated with the third baroclinic mode wave. In particular, the maximum amplitude of the third baroclinic mode contribution to sea level anomalies along the coast coincides with the persistent warming between 15°S and 30°S until Austral winter (Y1). This is the season when the El Niño event has transitioned to neutral to cold conditions [see reversal of SST anomalies from July (Y1) within 0° and 10°S] and the SPO activity is enhanced as evidenced by the large dispersion of the SPO index (brown shading). The coastal warming off Central Chile along with episodic positive SPO events is favorable for the triggering of a SPMM event. Values of the SPO [JJA Y(1)] index above its standard deviation take place 30% of the time during strong SPMM events associated with strong El Niño events in CESM, while 25% of these same SPMM events are associated with a negative SPO index in JJA (Y1) (i.e., below minus the standard deviation). This means that a large portion of the strong SPMM events following strong El Niño events (70%) can take place independently of a favorable state of the SPO, supporting the key role of the oceanic teleconnection along the coast of Peru/Chile in favoring the SPMM growth.
In this section we evaluate how models participating in the CMIP behave in terms of the SPMM/ENSO relationship evidenced here. We find that only a few models (10 out of 62) simulate to some extent this observed SPMM/ENSO relationship (Figure 7). Interestingly, this is independent of whether or not they can simulate realistically ENSO diversity (see Table 1), although the few models with skill (i.e., max correlation between SPMM and E index superior or equal to 0.35) do simulate a realistic ENSO non-linearity/diversity ( −0.39 ± 0.11, see Table 1). The large number of models with low skill can be interpreted as resulting from biases in both mean state and equatorial variability. In particular the warm bias in the eastern Pacific (Cai et al., 2020) extends poleward along the coast (Figure 8), which may decouple surface processes with wave dynamics through deepening the thermocline and/or favoring faster wave propagation. This in turn may weaken the equatorial oceanic teleconnection associated with the SPMM. Also models with low skill have on average a weaker ENSO non-linearity than observations ( −0.17 ± 0.14, see Table 1), which is associated to a tendency to simulate weaker EP El Niño events and therefore a weaker oceanic teleconnection along the west coast of South America. They have also a larger mean SST bias on average (Figure 8), which may affect both the oceanic teleconnection and regional air-sea interactions propitious for the development of the SPMM.
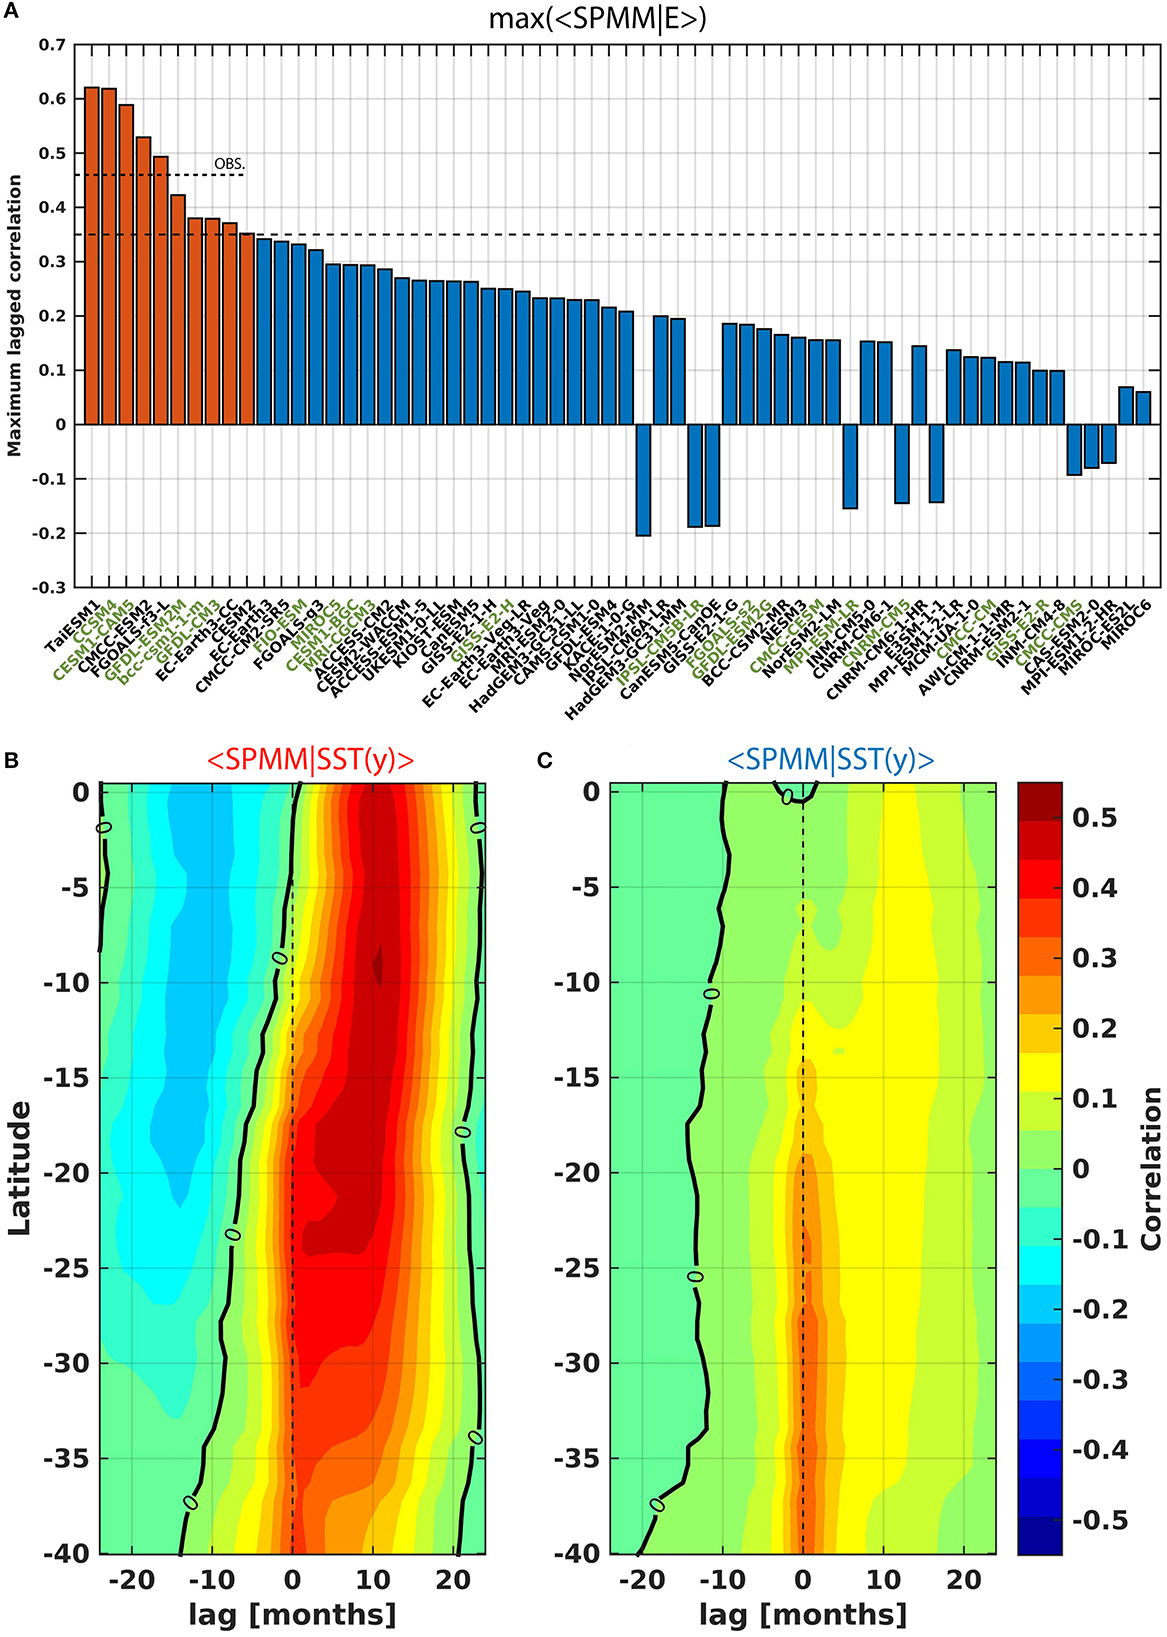
Figure 7. The SPMM/E relationship in models participating to CMIP Phases 5 and 6: (A) maximum/minimum correlation between the SPMM and E indices (lag of maximum correlation is provided in Table 1). The model names in black are for CMIP6 while those in light green are for CMIP5; Ensemble mean lead-lagged correlation between the SPMM index and SST anomalies along the coast (2° width coastal fringe) between the equator and 40°S (B) amongst models with a “strong” SPMM/E relationship [red bars in (A)] and (C) amongst models with a “weak” SPMM/E relationship [blue bars in (A)].
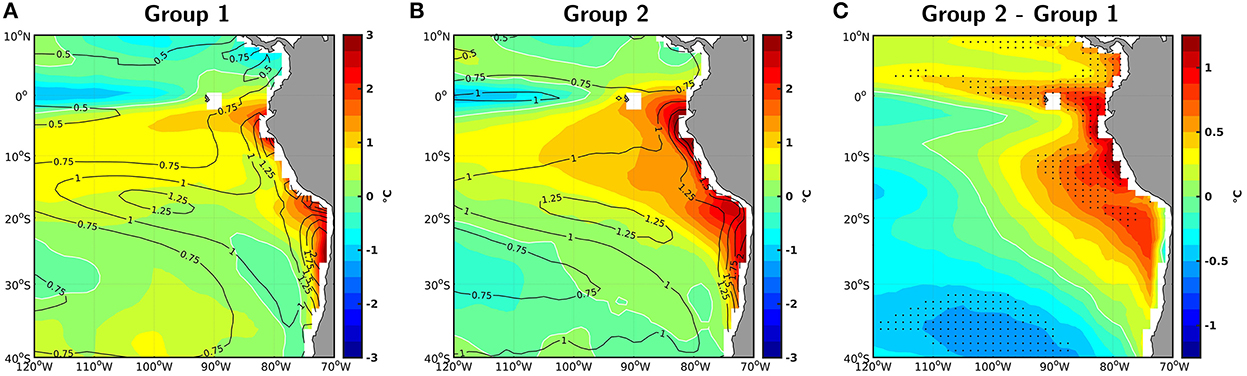
Figure 8. Ensemble mean SST bias (in °C) with respect to HadISST data (1948-2020) for (A) the models with a “strong” SPMM/E relationship (group 1), and for (B) those with a “weak” SPMM/E relationship (group 2). Groups are defined based on (A). The contours in (A) and (B) stands for the standard deviation of the mean SST bias amongst the corresponding ensemble (also in °C). (C) Difference between (B) and (A). Dots show grid points where the difference between the 2 groups is statistically significant at 90% based on a two-sample Student's t-test.
While previous studies have suggested that the SPMM is a precursor of ENSO events (Zhang et al., 2014; Min et al., 2017), here we show that the relationship is stronger in the other direction. We find that strong SPMM events can be forced by ENSO, observing a strong lead-lagged relationship at about 3 seasons (~10 months) when ENSO is ahead SPMM. We show that this ENSO/SPMM relationship arises from EP El Niño events that produce warm SST anomalies along the coast of Central Chile through oceanic teleconnection ~6 months after the concurrent El Niño peak, favoring to the development of the SPMM. This coastal warming has been recently documented by Xue et al. (2020) from Reanalysis data and was termed “Chile El Niño”. In their composite analysis, Xue et al. (2020) suggest that Chile El Niño events are tightly linked to the SPMM. In the CESM-LE, we also find that Chile El Niño events, as defined by Xue et al. (2020), are tied to the SPMM development [maximum correlation coefficient between the SPMM and Chile El Niño indices is 0.64 (lag = 0)], which supports our interpretation of ENSO-induced coastal warming off Central Chile favoring SPMM development. While Xue et al. (2020) suggests the existence of a positive “coastal Bjerknes feedback” for which warm SST anomalies are associated with anomalous southward alongshore surface winds suppressing the coastal upwelling and mixing, they did not investigate the remote forcing mechanisms of this type of event. Here we show that remote forcing of equatorial origin can induce advection processes associated with the propagation of coastal Kelvin wave and/or extra-tropical Rossby waves during ENSO development, which in turn triggers air-sea interactions favorable to the development of the coastal warming and subsequent SPMM. We find that in the CESM-LE, the relationship between SPMM growth rate () and the mixed-layer heat-budget terms along the coast of Central Chile (Figure 9) indicates that the SPMM precursor signal along the coast is dominated by the advection terms consistent with the mechanism of oceanic teleconnection proposed here. In particular, each advection term and their decomposition exhibit distinct phase relationship reflecting the differential response of the mixed-layer processes to the various baroclinic waves. Furthermore, sensible heat acts as the main damping term in this model (Figure 9B) probably due to the strong warm bias in the model off Central Chile (not shown) while long wave and latent heat contribute to the persistence of coastal warm anomalies once the SPMM has fully developed.
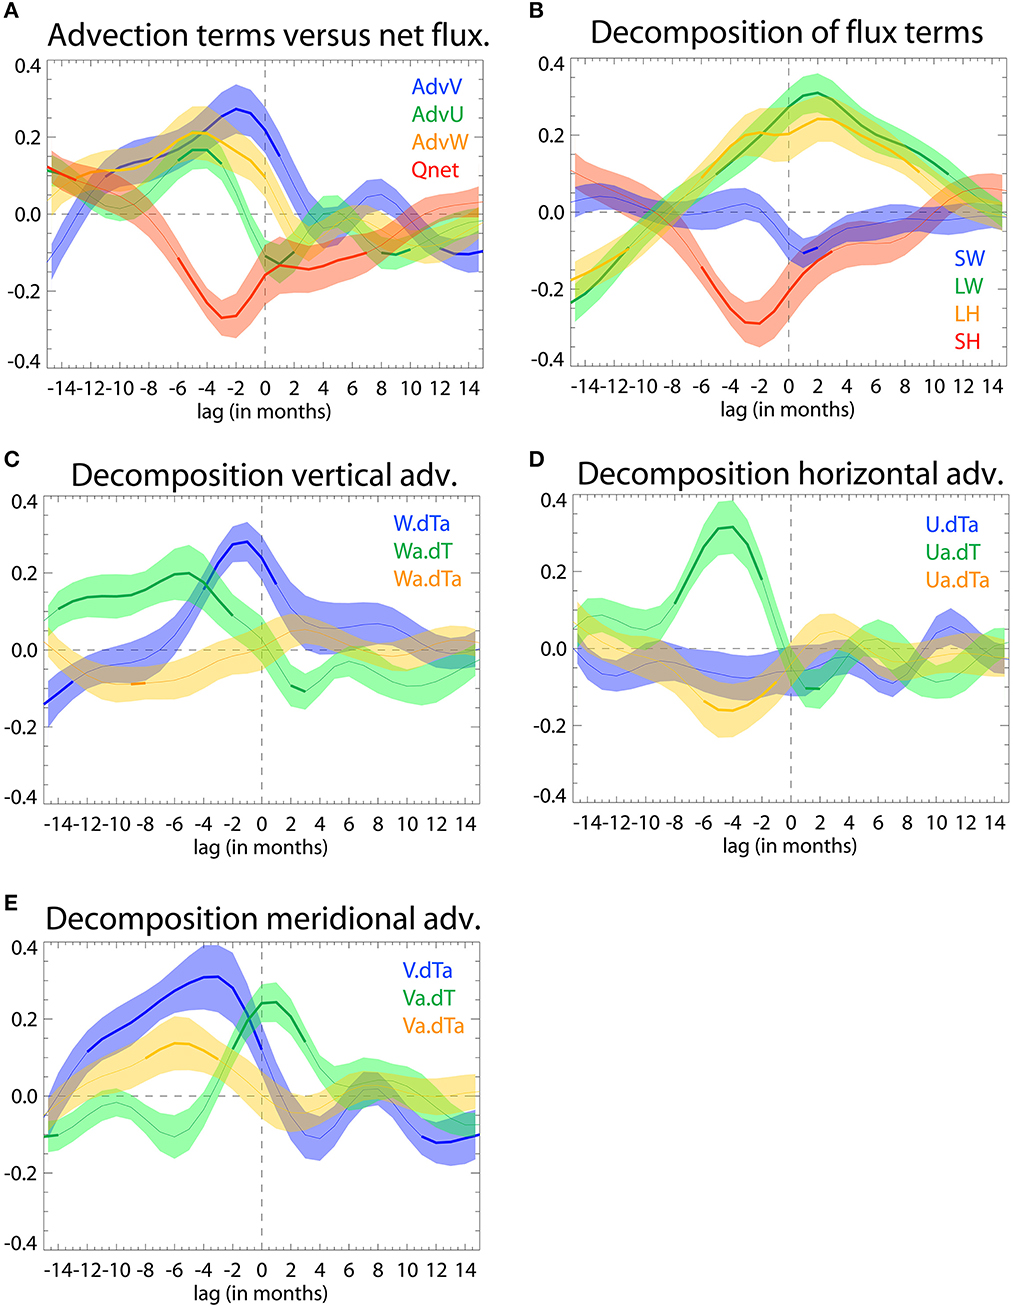
Figure 9. Mixed-layer heat budget along the coast (15–25°S): Lagged-regression coefficient (in °C/month) between the rate of change of the SPMM index (normalized by its variance) and the tendency terms. (A) Total advection and total net heat flux, (B) decomposition of the net heat flux into solar radiation (SW), longwave radiation (LW), latent heat (LH) and sensible heat (SH). Note that the shortwave radiation transmitted at 50 m is removed from SW. (C) Reynolds decomposition of vertical advection, i.e., climatological vertical advection of anomalous temperature (W.dTa), anomalous vertical advection of climatological temperature (Wa.dT) and non-linear vertical advection (Wa.dTa); (D, E) same as (C) but for horizontal and meridional advection. Negative lag indicates that the tendency term leads . The shaded colored zone around the curve indicate the dispersion amongst the members (±the standard deviation), whereas the portion of the curve in thick line indicate where the regression coefficient is significant at the 95% level based on a student t-test for 75% (31) of the members.
Considering the delicate balance between the terms of the heat-budget, the results obtained from the CESM-LE are likely model-dependent. Coastal upwelling dynamics is in particular sensitive to model resolution and mixing formulation (Small et al., 2015; Astudillo et al., 2019) while the oceanic teleconnection along the west coast of South America depends on mean stratification along the coast and ENSO diversity (Dewitte et al., 2012). Mean SST bias along the coast (Figure 8) may also affect regional air-sea interactions propitious to the development of the SPMM. Experimentation with a regional ocean model that can resolve more realistically coastal upwelling dynamics would be necessary for gaining confidence in the mixed-layer heat budget associated to precursor signal of the SPMM, which is beyond the scope of this paper.
Our results have implications for the understanding of ENSO dynamics itself since the ENSO-induced SPMM has the ability to influence the evolution of the concurrent El Niño event. Larson et al. (2018) showed from experiments with the National Center for Atmospheric Research (NCAR) Community Climate System Model version 4 (CCSM4; Gent et al., 2011) that the SPMM could act as a coincident source of latent heat flux forcing that counteracts a fraction of the thermal damping of El Niño, allowing for a more intense El Niño. Here, considering the 10 months delay between ENSO and SPMM peaks, we suggest that SPMM could in fact participate to damp the multi-year La Niña events that generally follow strong EP El Niño events (Okumura and Deser, 2010). In other words, the ENSO-induced SPMM could contribute to the temporal and amplitude asymmetry of the ENSO cycle. Besides implications for improving the seasonal forecasts of 2-year La Niña events in models (DiNezio et al., 2017) and associated impacts in South America (Cai et al., 2020), this issue if worth addressing for gaining insights in the processes yielding to ENSO complexity (Timmermann et al., 2018).
Publicly available datasets were analyzed in this study. This data can be found at: Equatorial Pacific mean-fit zonal velocity fields are available from https://floats.pmel.noaa.gov/gregory-c-johnson-home-page. TAO/TRITON mooring data was downloaded from https://www.pmel.noaa.gov/tao/drupal/disdel/. SODA files were obtained from www.soda.umd.edu. GECCO3 were files obtained from https://icdc.cen.uni-hamburg.de/en/gecco3.html. C-GLORSv7 files were obtained from https://dds.cmcc.it/#/dataset/cglorsv7/monthly. ORAS5 files were obtained from https://resources.marine.copernicus.eu/?option=com_csw&view=details&product_id=GLOBAL_REANALYSIS_PHY_001_026. GODAS files were obtained from https://www.psl.noaa.gov/data/gridded/data.godas.html. The ERA-Interim data was obtained from https://doi.org/10.5065/D6CR5RD9. The JRA-55 data was obtained from https://doi.org/10.5065/D6HH6H41. CMIP6 model output is available at https://esgf-node.llnl.gov/projects/cmip6/, and CMIP5 model output is available at https://esgf-node.llnl.gov/search/cmip5/. OFAM3 downscaling experiment is archived on NCI, and all processed data files presented in this paper are available upon request through the corresponding author.
BD, OP, and AM designed the study. BD, EC, and DS processed data. BD wrote the manuscript with contribution from all authors. All authors contributed to the article and approved the submitted version.
BD received support from ANID (Concurso de Fortalecimiento al Desarrollo Cientifico de Centros Regionales 2020-R20F0008-CEAZA, Anillo Eclipse ACT210071, Núcleo Milenio UPWELL (NCN19_153) and COPAS COASTAL FB210021) and ANR (Grant ANR-18-CE01-0012). BD, EC, OP, and MR received support from ANID (Concurso de Fortalecimiento al Desarrollo Científico de Centros Regionales 2020-R20F0008-CEAZA and Fondecyt Regular No. 1190276). BD is also supported by the EU H2020 FutureMares project (Theme LC-CLA-06-2019, Grant agreement No 869300). CM-V is supported by ANID Proyecto Fondecyt Postdoctorado 3200621. DS is supported by ANID Magister Nacional 2020 - 22201564. OP received support from IMO-Chile, (ICM grant IC-120019).
The authors declare that the research was conducted in the absence of any commercial or financial relationships that could be construed as a potential conflict of interest.
All claims expressed in this article are solely those of the authors and do not necessarily represent those of their affiliated organizations, or those of the publisher, the editors and the reviewers. Any product that may be evaluated in this article, or claim that may be made by its manufacturer, is not guaranteed or endorsed by the publisher.
Amaya, D. J. (2019). The pacific meridional mode: a review. Curr. Clim. Change Rep. 5, 296–307. doi: 10.1007/s40641-019-00142-x
An, S. I., and Wang, B. (2000). Interdecadal change of the structure of the ENSO mode and its impact on the ENSO frequency. J. Clim. 13, 2044–2055. doi: 10.1175/1520-0442(2000)013<2044:ICOTSO>2.0.CO;2
Astudillo, O., Dewitte, B., Mallet, M., Rutllant, J. A., Goubanova, K., Frappart, F., et al. (2019). Sensitivity of the near-shore oceanic circulation off Central Chile to coastal wind profiles characteristics. J. Geophy. Res. 124, 4644–4676. doi: 10.1029/2018JC014051
Barnston, A. G., Tippett, M. K., L'Heureux, M. L., Li, S., and DeWitt, D. G. (2012). Skill of real-time seasonal ENSO model predictions during 2002–2011: is our capability increasing? B. Am. Meteorol. Soc. 93, 631–651. doi: 10.1175/BAMS-D-11-00111.1
Bretherton, C. S., Smith, C., and Wallace, J. M. (1992). An intercomparison of methods for finding coupled patterns in climate data. J. Climate 5, 541–560. doi: 10.1175/1520-0442(1992)005<0541:AIOMFF>2.0.CO;2
Cai, W., McPhaden, M. J., Grimm, A. M., Rodrigues, R. R., Taschetto, A. S., Garreaud, R. D., et al. (2020). Climate impacts of the El Niño–southern oscillation on South America. Nat. Rev. Earth Environ. 1, 215–231. doi: 10.1038/s43017-020-0040-3
Cai, W., Wang, G., Dewitte, B., Wu, L., Santoso, A., Takahashi, K., et al. (2018). Increased variability of eastern Pacific El Niño under greenhouse warming. Nature 564, 201–206. doi: 10.1038/s41586-018-0776-9
Capotondi, A., Sardeshmukh, P. D. L., and Ricciardulli, L. (2018). The nature of the stochastic wind forcing of ENSO. J. Clim. 31, 8081–8099. doi: 10.1175/JCLI-D-17-0842.1
Capotondi, A., Wittenberg, A., Kug, J. S., Takahashi, K., and McPhaden, M. (2020). “ENSO diversity,” in El Niño Southern Oscillation in a Changing Climate, eds. M.J. McPhaden, A. Santoso, W. Cai (Washington DC: AGU), 65–86. doi: 10.1002/9781119548164.ch4
Carréric, A., Dewitte, B., Cai, W., Capotondi, A., Takahashi, K., Yeh, S. W., et al. (2020). Change in strong Eastern Pacific El Niño events dynamics in the warming climate. Clim. Dyn. 54, 901–918. doi: 10.1007/s00382-019-05036-0
Chang, P., Zhang, L., Saravanan, R., Vimont, D. J., Chiang, J. C. H., Ji, L., et al. (2007). Pacific meridional mode and El Niño—Southern oscillation. Geophys. Res. Lett. 34, L16608. doi: 10.1029/2007GL030302
Chiang, J. C., and Vimont, D. J. (2004). Analogous Pacific and Atlantic meridional modes of tropical atmosphere–ocean variability. J. Clim. 17, 4143–4158. doi: 10.1175/JCLI4953.1
Clarke, A. J., and Shi, C. (1991). Critical frequencies at ocean boundaries. J. Geophys. Res. 96, 10731–10738. doi: 10.1029/91JC00933
Deser, C., and Wallace, J. M. (1990). Large-scale atmospheric circulation features of warmand cold episodes in the tropical Pacific. J. Climate 3, 1254–1281. doi: 10.1175/1520-0442(1990)003<1254:LSACFO>2.0.CO;2
Dewitte, B., Ramos, M., Echevin, V., Pizarro, O., and duPenhoat, Y. (2008). Vertical structure variability in a seasonal simulation of a medium-resolution regional model simulation of the South Eastern Pacific. Prog. Oceanogr. 79, 120–137. doi: 10.1016/j.pocean.2008.10.014
Dewitte, B., Reverdin, G., and Maes, C. (1999). Vertical structure of an OGCM simulation of the equatorial Pacific Ocean in 1985-1994. J. Phys. Oceanogr. 29, 1542–1570. doi: 10.1175/1520-0485(1999)029<1542:VSOAOS>2.0.CO;2
Dewitte, B., and Takahashi, K. (2017). Diversity of moderate El Niño events evolution: role of air-sea interactions in the eastern tropical Pacific. Clim. Dyn. 52, 7455–7476. doi: 10.1007/s00382-017-4051-9
Dewitte, B., Vazquez-Cuervo, J., Goubanova, K., Illig, S., Takahashi, K., Cambon, G., et al. (2012). Change in El Niño flavours over 1958–2008: Implications for the long-term trend of the upwelling off Peru. Deep Sea Res. Part II. 77, 143–156. doi: 10.1016/j.dsr2.2012.04.011
Di Lorenzo, E. N. S. O., Liguori, G., Schneider, N., Furtado, J. C., Anderson, B. T., and Alexander, M. A. (2015). ENSO and meridional modes: A null hypothesis for Pacific climate variability. Geophys. Res. Lett. 42, 9440–9448. doi: 10.1002/2015GL066281
DiNezio, P. N., Deser, C., Okumura, Y., and Karspeck, A. (2017). Predictability of 2-year La Niña events in a coupled general circulation model. Climate Dyn. 49, 4237–4261. doi: 10.1007/s00382-017-3575-3
Dommenget, D., and Yu, Y. (2017). The effects of remote SST forcings on ENSO dynamics, variability and diversity. Clim. Dyn. 49, 2605–2624. doi: 10.1007/s00382-016-3472-1
Gent, P. R., Danabasoglu, G., Donner, L. J., Holland, M. M., Hunke, E. C., Jayne, S. R., and Zhang, M. (2011). The community climate system model version 4. J. Clim. 24, 4973–4991. doi: 10.1175/2011JCLI4083.1
Hartigan, P. M. (1985). Algorithm AS 217: Computation of the dip statistic to test for unimodality. J. Royal Stat. Soc. Series C. 34, 320–325. doi: 10.2307/2347485
Jin, F. F., Lin, L., Timmermann, A., and Zhao, J. (2007). Ensemble-mean dynamics of the ENSO recharge oscillator under state-dependent stochastic forcing. Geophys. Res. Lett. 34, L03807. doi: 10.1029/2006GL027372
Kalnay, E., Kanamitsu, M., Kistler, R., Collins, W., Deaven, D., Gandin, L., and Joseph, D. (1996). The NCEP/NCAR 40-year reanalysis project. Bull. Am. Meteorol. Soc. 77, 437–472. doi: 10.1175/1520-0477(1996)077<0437:TNYRP>2.0.CO;2
Karamperidou, C., Di Nezio, P. N., Timmermann, A., Jin, F. F., and Cobb, K. M. (2015). The response of ENSO flavors to mid-Holocene climate: implications for proxy interpretation. Paleoceanography 30, 527–547. doi: 10.1002/2014PA002742
Karamperidou, C., Jin, F. F., and Conroy, J. L. (2017). The importance of ENSO nonlinearities in tropical pacific response to external forcing. Clim. Dyn. 49, 2695–2704. doi: 10.1007/s00382-016-3475-y
Kay, J. E., Deser, C., Phillips, A., Mai, A., Hannay, C., Strand, G., et al. (2015). The Community Earth System Model (CESM) large ensemble project: a community resource for studying climate change in the presence of internal climate variability. Bull. Am. Meteorol. Soc. 96, 1333–1349. doi: 10.1175/BAMS-D-13-00255.1
Kug, J. S., Vialard, J., Ham, Y. G., Yu, J. Y., and Lengaihne, M. (2020). “ENSO Remote Forcing,” in El Niño Southern Oscillation in a Changing Climate, eds. M.J. McPhaden, A. Santoso, W. Cai (Washington DC: AGU), 65–86. doi: 10.1002/9781119548164.ch11
Larson, S. B., and Kirtman, B. (2013). The Pacific meridional mode as a trigger for ENSO in a high-resolution coupled model. Geophy. Res. Lett. 40, 3189–3194. doi: 10.1002/grl.50571
Larson, S. M., Pegion, K. V. B. P., and Kirtman, B. P. (2018). The South Pacific meridional mode as a thermally driven source of ENSO amplitude modulation and uncertainty. J. Clim. 31, 5127–5145. doi: 10.1175/JCLI-D-17-0722.1
Levine, A. F. Z., and Jin, F. F. (2010). Noise-Induced Instability in the ENSO Recharge Oscillator. J. Atmos. Sci. 67, 529–542. doi: 10.1175/2009JAS3213.1
L'Heureux, M. L., Levine, A. F., Newman, M., Ganter, C., Luo, J. J., Tippett, M. K., et al. (2020). ENSO prediction. in El Niño Southern Oscillation in a Changing Climate, eds. M.J. McPhaden, A. Santoso, W. Cai (John Wiley and Sons) 227–246. doi: 10.1002/9781119548164.ch10
Liguori, G., and Di Lorenzo, E. (2018). Meridional modes and increasing pacific decadal variability under anthropogenic forcing. Geophy. Res. Lett. 45, 983–991, doi: 10.1002/2017GL076548
Liguori, G., and Di Lorenzo, E. (2019). Separating the north and south pacific meridional modes contributions to enso and tropical decadal variability. Geophy. Res. Lett. 46, 906–915, doi: 10.1029/2018GL080320
Lopez, H., Kirtman, B. P., Tziperman, E., and Gebbie, G. (2013). Impact of interactive westerly wind bursts on CCSM3. Dyn. Atmos. Ocean. 59, 24–51. doi: 10.1016/j.dynatmoce.2012.11.001
McPhaden, M. J., Santoso, A. W., and Cai, W. (2020). El Niño Southern Oscillation in a Changing Climate (Vol. 253). John Wiley Sons. doi: 10.1002/9781119548164
Min, Q., Su, J., and Zhang, R. (2017). Impact of the South and North Pacific Meridional Modes on the El Niño–Southern Oscillation: Observational Analysis and Comparison. J. Clim., 30, 1705–1738. doi: 10.1175/JCLI-D-16-0063.1
Neelin, J. D., Battisti, D. S., Hirst, A. C., Jin, F. F., Wakata, Y., Yamagata, T., et al. (1998). ENSO theory. J. Geophys. Res.: Oceans. 103, 14261–14290. doi: 10.1029/97JC03424
Okumura, Y. M., and Deser, C. (2010). Asymmetry in the duration of El Niño and La Niña. J. Climate 23, 5826–5843. doi: 10.1175/2010JCLI3592.1
Pacanowski, R. C., and Griffies, S. M. (1999). “MOM 3.0 manual,” in NOAA/Geophysical Fluid Dynamics Laboratory Rep. 680.
Rayner, N. A., Parker, D. E., Horton, E. B., Folland, C. K., Alexander, L. V., Rowell, D. P., et al. (2003). Global analyses of sea surface temperature, sea ice, night marine air temperature since the late nineteenth century. J. Geophys. Res. 108, 2670. doi: 10.1029/2002JD002670
Roulston, M. S., and Neelin, J. D. (2000). The response of an ENSO model to climate noise, weather noise and intraseasonal forcing. Geophys. Res. Lett., 27, 3723–3726. doi: 10.1029/2000GL011941
Seiki, A., and Takayabu, Y. N. (2007). Westerly wind bursts and their relationship with intraseasonal variations and ENSO. Part I: Statistics, Mon. Wea. Rev. 135, 3325–3345. doi: 10.1175/MWR3477.1
Small, R. J., Curchitser, E., Hedstrom, K., Kauffman, B., and Large, W. G. (2015). The Benguela upwelling system: Quantifying the sensitivity to resolution and coastal wind representation in a global climate model. J. Clim. 28, 9409–9432. doi: 10.1175/JCLI-D-15-0192.1
Stuecker, M. F. (2018). Revisiting the pacific meridional mode. Scientific Rep. 8, 3216. doi: 10.1038/s41598-018-21537-0
Takahashi, K., Karamperidou, C., and Dewitte, B. (2018). A theoretical model of strong and moderate El Niño regimes. Clim. Dyn. 52, 7477–7493. doi: 10.1007/s00382-018-4100-z
Takahashi, K., Montecinos, A., Goubanova, K., and Dewitte, B. (2011). ENSO regimes: Reinterpreting the canonical and Modoki El Niño. Geophys. Res. Lett. 38, L10704. doi: 10.1029/2011GL047364
Thomas, E. E., and Vimont, D. J. (2016). Mechanisms of linear and nonlinear Meridional Mode and ENSO interactions. J. Climate 29, 8745–8761. doi: 10.1175/JCLI-D-16-0090.1
Thomas, E. E., Vimont, D. J., Newman, M., Penland, C., and Martínez-Villalobos, C. (2018). The role of stochastic forcing in generating ENSO diversity. J. Clim. 31, 9125–9150. doi: 10.1175/JCLI-D-17-0582.1
Timmermann, A., An, S. I., Kug, J. S., Jin, F. F., Cai, W., Capotondi, A., et al. (2018). El Niño–southern oscillation complexity. Nature 559, 535–545. doi: 10.1038/s41586-018-0252-6
Tziperman, E., and Yu, L. (2007). Quantifying the dependence of westerly wind bursts on the large-scale tropical Pacific SST. J. Clim. 20, 2760–2768. doi: 10.1175/JCLI4138a.1
Vimont, D. J., Alexander, M. A., and Newman, M. (2014). Optimal growth of central and east Pacific ENSO events. Geophys. Res. Lett. 41, 4027–4034. doi: 10.1002/2014GL059997
Vimont, D. J., Battisti, D. S., and Hirst, A. C. (2001). Footprinting: a seasonal link between the mid-latitudes and tropics. Geophys. Res. Lett. 28, 3923–3926. doi: 10.1029/2001GL013435
Xie, S. P. (1999). A dynamic ocean–atmosphere model of the tropical Atlantic decadal variability. J. Clim., 12, 64–70. doi: 10.1175/1520-0442-12.1.64
Xie, S. P., and Philander, S. G. H. (1994). A coupled ocean-atmosphere model of relevance to the ITCZ in the eastern Pacific. Tellus A 46, 340–350. doi: 10.3402/tellusa.v46i4.15484
Xue, J., Luo, J. J., and Yuan, C. T. (2020). Discovery of Chile Niño/Niña. Geophy. Res. Lett. 47, 86468. doi: 10.1029/2019GL086468
You, Y., and Furtado, J. C. (2017). The role of South Pacific atmospheric variability in the development of different types of ENSO. Geophys. Res. Lett. 44, 7438–7446. doi: 10.1002/2017GL073475
Yu, J. Y., and Kim, S. T. (2011). Relationships between Extratropical Sea Level Pressure Variations and the Central Pacific and Eastern Pacific Types of ENSO. J. Clim. 24, 708–720. doi: 10.1175/2010JCLI3688.1
Keywords: ENSO, South Pacific Meridional Model, oceanic teleconnection, CMIP, ENSO complexity
Citation: Dewitte B, Concha E, Saavedra D, Pizarro O, Martinez-Villalobos C, Gushchina D, Ramos M and Montecinos A (2023) The ENSO-induced South Pacific Meridional Mode. Front. Clim. 4:1080978. doi: 10.3389/fclim.2022.1080978
Received: 26 October 2022; Accepted: 14 December 2022;
Published: 25 January 2023.
Edited by:
Shayne McGregor, Monash University, AustraliaReviewed by:
Jason Furtado, University of Oklahoma, United StatesCopyright © 2023 Dewitte, Concha, Saavedra, Pizarro, Martinez-Villalobos, Gushchina, Ramos and Montecinos. This is an open-access article distributed under the terms of the Creative Commons Attribution License (CC BY). The use, distribution or reproduction in other forums is permitted, provided the original author(s) and the copyright owner(s) are credited and that the original publication in this journal is cited, in accordance with accepted academic practice. No use, distribution or reproduction is permitted which does not comply with these terms.
*Correspondence: Boris Dewitte,  Ym9yaXMuZGV3aXR0ZUBjZWF6YS5jbA==
Disclaimer: All claims expressed in this article are solely those of the authors and do not necessarily represent those of their affiliated organizations, or those of the publisher, the editors and the reviewers. Any product that may be evaluated in this article or claim that may be made by its manufacturer is not guaranteed or endorsed by the publisher.
Research integrity at Frontiers
Learn more about the work of our research integrity team to safeguard the quality of each article we publish.