 Claire M. Spillman
 Grant A. Smith
 Alistair J. Hobday
 Jason R. Hartog
95% of researchers rate our articles as excellent or good
Learn more about the work of our research integrity team to safeguard the quality of each article we publish.
Find out more
ORIGINAL RESEARCH article
Front. Clim. , 24 December 2021
Sec. Climate, Ecology and People
Volume 3 - 2021 | https://doi.org/10.3389/fclim.2021.801217
This article is part of the Research Topic Advances in Marine Heatwave Interactions View all 18 articles
Changing ocean conditions due to anthropogenic climate change, particularly the increasing severity and frequency of extreme events, are a growing concern for a range of marine sectors. Here we explore the global trends in marine heatwaves (MHWs), specifically onset and decline rates, two metrics which describe how quickly a MHW will emerge or disappear from a location. These rates determine the reaction window—the start of a MHW event to peak MHW temperatures—and the coping window—time from peak temperatures to the end of an event—two important time periods relevant to a marine decision-maker. We show that MHW onset and decline rates are fastest in dynamic ocean regions and that overall, the global trend in onset rate is greater than the global trend in decline rate. We map ocean regions where these rates are changing together with forecast skill from a seasonal dynamical model (ACCESS-S). This analysis highlights areas where the length of the preparation window for impending MHWs is increased by using forecasts, and areas where marine decision-makers should be prepared for rapid responses based on realtime observations as MHWs evolve. In regions such as south Africa and Kerguelen, northwest Atlantic, northwest Pacific, southwest South Atlantic and off Australian east coast where rapid median onset and decline rates are observed, there is also a positive trend in onset and decline rates i.e., MHWs are developing and declining more rapidly. This will be a concern for many decision-makers operating in these regions.
The world ocean is warming rapidly, resulting in rapid environmental change (World Meteorological Organization, 2021). The five warmest years have all occurred in the past decade, which is also the warmest decade in the historical record (World Meteorological Organization, 2021). Recent years have seen emergence of future climates in the form of extreme events, including three mass coral bleaching events on the Great Barrier Reef in 5 years (2016, 2017, 2020; Hughes et al., 2018; Spillman and Smith, 2021), flooding (Morris et al., 2018; Hague et al., 2020), altered cyclone spatial distributions (Murakami et al., 2020), drought (Bureau of Meteorology CSIRO, 2020), and marine heatwaves (e.g., Cavole et al., 2016; Sen Gupta et al., 2020). Climate change projections (IPCC, 2019) point to an increasing frequency and intensity of many types of extreme events this century, driven by a warming ocean and atmosphere. These extreme events can have dramatic environmental effects (e.g., Smale et al., 2019), which complicates environmental management and decision-making (e.g., Caputi et al., 2019) and disrupts economic systems and societies (e.g., Dunstan et al., 2018; Bellquist et al., 2021).
Extreme events such as marine heatwaves (MHWs) represent a stress test for environmental management (Barbeaux et al., 2020; Holbrook et al., 2020), where MHWs are currently defined as five or more consecutive days of sea surface temperatures above the 90th percentile (Hobday et al., 2016a). This stress is compounded by a growing Blue Economy (e.g., Boschetti et al., 2020), directly linked to an increasing number of activities in the ocean, each with its own spatial and temporal restrictions (e.g., quota restrictions, spatial management zones, harvest seasons). The pace of change means unprecedented events, outside historical baselines or experience with increased severity and frequency and reduced recovery time between events, means the ocean cannot be used and managed as in the past (Hobday et al., 2018b).
Globally, MHWs increased in frequency (34%) and duration (17%) from 1925 to 2016, resulting in a 54% increase in annual MHW days (Oliver et al., 2018). These trends can largely be explained by increases in mean ocean temperatures – further increases in MHW days will occur under continued global warming with many parts of the ocean reaching a near-permanent MHW state by the late 21st century (Oliver et al., 2019). There is ample evidence that MHWs have dramatic effects on marine life resulting in major ecological impacts (Smale et al., 2019). In the last decade, MHWs have led to mass mortality of seabirds (e.g., Piatt et al., 2020), loss of species and major habitat types, including algal forests, seagrasses and mangroves (e.g., Wernberg et al., 2016; Babcock et al., 2019), reduction or closure of fisheries (e.g., Caputi et al., 2019; Fisher et al., 2021), and have been associated with harmful algal blooms and disease outbreaks (Cavole et al., 2016; Oliver et al., 2017). Ecosystem response depends heavily on the duration, intensity and timing to these extreme events – some species and habitats may tolerate long lived, low intensity MHWs better than short, high intensity events (e.g., Smale et al., 2019). Event frequency is also important in determining capacity for ecosystem recovery (e.g., Hughes et al., 2021).
Most of the attention on MHWs has been based on estimates of intensity and duration, which are the primary metrics described by Hobday et al. (2016a). However, the rates of MHW onset and decline are also important, as these describe the build-up and dissipation of heat during an event (Figure 1). The onset rate of a MHW is defined as the rate of temperature change from the onset of the MHW to the maximum intensity (Hobday et al., 2016a). Fast onset rates indicate a rapid build-up of heat, whereas a slow onset rate applies to a slowly evolving MHW. The rate of MHW decline is defined as the rate of temperature change from the maximum intensity to the end of the MHW, or when temperatures drop below the 90th percentile of the climatological baseline (Hobday et al., 2016a). A rapid decline rate indicates an event ends quickly, while a slow decline rate indicates that an event lingers before disappearing. The onset and decline rates of thermal stress can impact the persistence and recovery of marine animals and plants following a MHW event (e.g., Bernal et al., 2020; Hemraj et al., 2020), influence community composition (e.g., Sorte et al., 2010; Wernberg et al., 2016), and impact management and restoration of these systems.
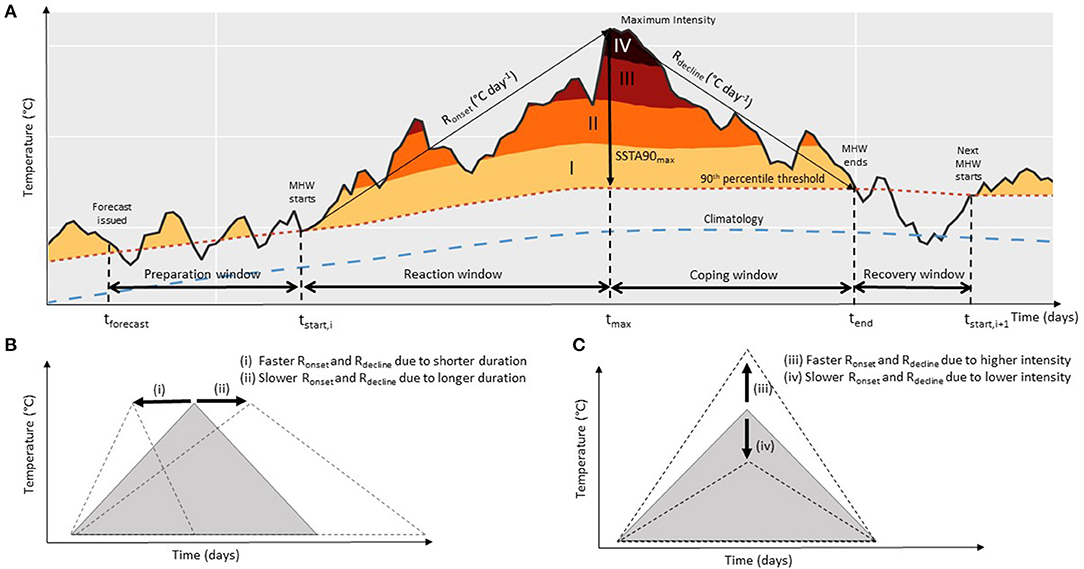
Figure 1. (A) Marine heatwave characteristics, using an observed MHW example. The rate of onset (Ronset) is calculated here by dividing the peak exceedance (SSTA90max) by the time required to reach it (tmax-tstart). Similarly, the rate of decline (Rdecline) is calculated here by dividing SSTA90max by the time from peak exceedance to the end of the event (tend-tmax). The climatology, 90th percentile threshold, and category (I Moderate, II Strong, III Severe, IV Extreme; Hobday et al., 2018a) are also shown. Periods of interest for marine decision-makers include the preparation window defined as the time between a forecast issued (tforecast) and the start of a MHW (tstart), the reaction window which is the time from the start of the event to peak exceedance (tmax-tstart), the coping window which is the time from the peak of the event (tmax) to the end (tend), and the recovery window which begins at tend and ends at the start of the next MHW event. Changes in MHW onset and decline rates can be through (B) changes in duration and/or (C) changes in peak exceedance.
The onset rate also influences the time window in which an industry or marine manager has to react, respond and implement any mitigation measures between a MHW event beginning and peak severity (Figure 1). If the onset rate is rapid, this reaction window is short and an industry must be agile with a range of quickly implemented mitigation measures, a scenario more likely in a heavily manipulated system such as aquaculture than in regional ecosystem management. Intervention measures could include early harvest to avoid peak temperatures, ordering different feed for better support of stressed animals or delaying seeding until the event has passed. Conversely, a slower onset rate provides more time for marine managers to respond and potentially mitigate impacts (i.e., longer reaction window). Measures requiring longer response times could include fishery closures, advance monitoring and rescheduling of conservation efforts. However, whilst there may be slower build up, an event may last a long time, causing more thermal stress to a system than a shorter onset event (Figure 1). It is important to also consider decline rates, as if the decline rate of a MHW is rapid (i.e., coping window is short), a system or industry may be able to survive the event as a reprieve is in the near future. If the rate of decline is slow and the coping window is long, then the accumulated heat in the system can take a long time to dissipate, pushing an already stressed system outside its tolerance limits and industries beyond their coping ability. Furthermore, whilst the MHW may have ended and temperatures are below the 90th percentile, they are unlikely to have returned to “normal” or optimal conditions. The recovery window between successive MHW events is important in determining the impact on the system from subsequent events, i.e., if this window is too short the system will not sufficiently recover to withstand the next event (Figure 1), e.g., back-to-back coral bleaching events on the Great Barrier Reef (Hughes et al., 2018).
Seasonal forecasts which provide climate information on timescales of weeks to months into the future, are important tools for industries and marine managers (Hobday et al., 2016b; Tommasi et al., 2017). Forecast information can be particularly useful in both areas where MHW onset rates are rapid and reaction windows are short (Figure 1A), and where characteristics of MHWs are changing. Regional changes in onset and decline rates (Figures 1B,C) as well as event timing due to climate change, means that past experience of marine heatwaves will be of less use to marine managers and industry resilience will be impacted. Different stages of the growing cycle, business and funding are likely to be affected more as a result and so mitigation measures will need to be different. The range of measures available to sectors will also depend on the sector's agility and level of manipulation – aquaculture for example may be able to respond more rapidly and effectively through changing harvest schedules, choice of feed or thinning pens, than a wild fishery which may have fewer, less targeted measures such as fishery closures. Increasing efforts in marine restoration ecology (e.g., Coleman et al., 2020; Eger et al., 2020) also require awareness of potential impacts of these extreme events, as it has been shown that restoration success depends on environmental conditions (Tulloch et al., 2020).
Anticipation of these extreme events, with forecasts providing both a preparation window prior to the event and an indication of the reaction window between the start of a MHW and peak of the event, will be essential for industries and managers to better cope with extreme events (Figure 1). The more skilful a forecast is in predicting the start of a MHW at longer leadtimes, the longer the preparation window. Knowledge of how long stressful conditions will persist following the MHW peak, i.e., the coping window or how long an industry must cope with conditions before the event ends, is also critical. Forecast models must be skilful at the leadtimes that are important to decision makers at each of these stages (Hobday et al., 2016b). Not all industries will be sufficiently agile or have enough time to adequately prepare for an MHW event, and not all will cope equally with MHW events, however forecast information can still assist with anticipation of impacts, informing stakeholders and customers, and post-event planning. At longer leadtimes, skilful forecasts may also be able to indicate the recovery window that a system has between successive MHW events.
In this paper we first describe and analyse global patterns of MHW onset and decline rates and calculate trends in these rates over the past 40 years. We then determine regions where MHWs generally have a rapid onset and/or decline and whether these rates have changed. We discuss how marine resource users can interpret onset and decline rates in terms of a reaction window to mitigate impacts prior to the peak of the event and a coping window in which they must cope with conditions until the event ends. We then use a seasonal dynamical model to assess the predictability of these regions, and therefore the usefulness of forecasts in these regions in providing a preparation window for marine stakeholders prior to a MHW occurring.
A MHW is widely defined as five or more consecutive days where sea surface temperatures (SST) exceed the daily 90th percentile at that location (Hobday et al., 2016a), with a range of metrics used to describe events (Figure 1). Hobday et al. (2016a) defined maximum intensity (°C) as the maximum SST anomaly referenced to the seasonal climatology, which was then used in onset and decline rate definitions.
Here, rather than using maximum intensity, we define peak exceedance SSTA90max (°C) as the maximum SST anomaly referenced to the 90th percentile threshold (SST90) for each event (Figure 1A):
This quantity accounts for variability at each location as it uses the 90th percentile, as opposed to the mean climatology. We then define the rate of onset (°C day−1) as SSTA90max divided by the time taken to reach SSTA90max, beginning when the MHW threshold is first exceeded (tstart), i.e.,
We also define the rate of decline as SSTA90max divided by the time from peak intensity (tmax) until the temperature falls below the 90th percentile threshold (tend), i.e.,
A global dataset of observed MHWs was generated according to methodology detailed in Hobday et al. (2016a) using publicly available python code at https://github.com/ecjoliver/marineHeatWaves (https://researchdata.edu.au/marine-heatwaves-detection-code/814983). The code was modified to calculate onset and decline rates as defined in Equations (1)–(3) above. Input data were daily SST data from Reynolds OISSTv2.1 for 1982–2018 (Reynolds et al., 2007; Banzon et al., 2016; Huang et al., 2021), the period also used for the MHW 90th percentile threshold climatology.
The 1982–2018 MHW dataset provided the following parameters for each observed event: key time periods (in days) including the reaction window (tmax-tstart) and coping window (tend-tmax), peak exceedance SSTA90max (°C), rate of onset (°C day−1) and rate of decline (°C day−1). Note that the combined duration of the reaction and coping windows is the total duration of an event. The number of events were assessed by calendar year. Trends for number of events, SSTA90max, reaction window, coping window and rate of onset/decline were then calculated using a least squares polynomial fit. For example, the trend in rate of onset/decline is calculated per grid cell, resulting in a rate of change per day per year (°C day−1 yr−1). We acknowledge that the magnitude of these trends are dependent on the baseline used for the analysis (e.g., Schlegel et al., 2019; Liersch et al., 2020), and have chosen the longest common baseline for observations and model forecast data (see section Model Description and Skill Analysis). In the future it will be increasingly important to review the choice of baseline as the climate warms further relative to the historical period. We compared the proportion of the ocean grid cells that were changing faster or slower than a reference level of ±0.002°C day−1 yr−1, which was selected based on inspection of the raw data.
Horizontal ocean energy, in particular mesoscale variability of flow, was investigated to examine if marine heatwaves were changing more rapidly in areas of high energy. Average Eddy Kinetic Energy (EKE) was used to assess this and was calculated for the period 1982–2018 using ACCESS-S2 (see below) monthly surface velocity reanalysis fields, and standard calculations (Hobday and Hartog, 2014; Supplementary Figure 1).
ACCESS-S2 (Australian Community Climate and Earth System Simulator – Seasonal Version 2) is a coupled global ocean-atmosphere model based on the UK Met Office global seasonal prediction system version5 (Maclachlan et al., 2015) and includes an updated ensemble generation scheme and data assimilation system developed by the Bureau of Meteorology. For details on the base model configuration see Hudson et al. (2017) and Smith and Spillman (2019). The ocean model is the Nucleus for European Modelling of the Ocean (NEMO) community model (Madec and NEMO Team, 2011), which has an approximate horizontal resolution of 25 × 25 km south of 30°N (higher resolution in far northern basins). There are 75 depth layers, with the top 1-m layer representing sea surface temperature (SST).
A set of retrospective forecasts (hindcasts) were run using ACCESS-S2 for the period 1982–2018. Three forecasts were run out to 5 months into the future (i.e., lead time 0–4 months) on the 1st of each month in the period. Three additional forecasts were also run on each of the 8 days prior to the 1st, to give a 27-member ensemble forecast for each month. These ensemble forecasts were then used to generate the model 90th percentile SST thresholds for each month lead time. For this study, model MHW metrics were calculated using monthly SST hindcast data and the model 90th percentile threshold.
Model skill was then assessed using hit rates, where a “hit” was defined as more than 50% of model ensemble forecasts correctly predicted SST > 90th percentile. Conversely if <50% of members correctly predicted SST > 90th percentile, then this was termed a “miss.” These “hit” and “miss” counts were combined to calculate the “hit rate” as follows:
where x, y is the grid point location, lt is lead time in months, and t is model start dates.
Most of the tropical and temperate ocean has experienced ~60–80 MHW events over the period 1982–2018 (Figure 2A), including at least one MHW of strong severity (not shown). Areas where 90 or more MHW events have occurred during this period include the northwest Atlantic, southwest Atlantic, eastern and south Africa, Bay of Bengal and the tropical West Pacific. These areas with more frequent events also tend to have higher median peak values of up to 1.6°C (SSTA90max; Figures 1A,B) and be shorter in duration, with shorter median reaction and coping windows (Figures 2C,D). The exceptions which have experienced fewer events during this period (<50 events), tend to have prolonged, though not necessarily more severe, events. These regions include the eastern equatorial Pacific and northwest Pacific, reflecting the influence of the climate driver El Niño Southern Oscillation (ENSO). Median reaction (time for start of MHW to peak exceedance) and coping (time from peak exceedance to end of event) windows have similar geographic patterns, however, coping windows are generally longer, with ~88% of ocean grid cells having a longer coping window than reaction window. This asymmetry reveals that the decay of MHW events takes more time than the initial accumulation of heat to peak MHW intensity.
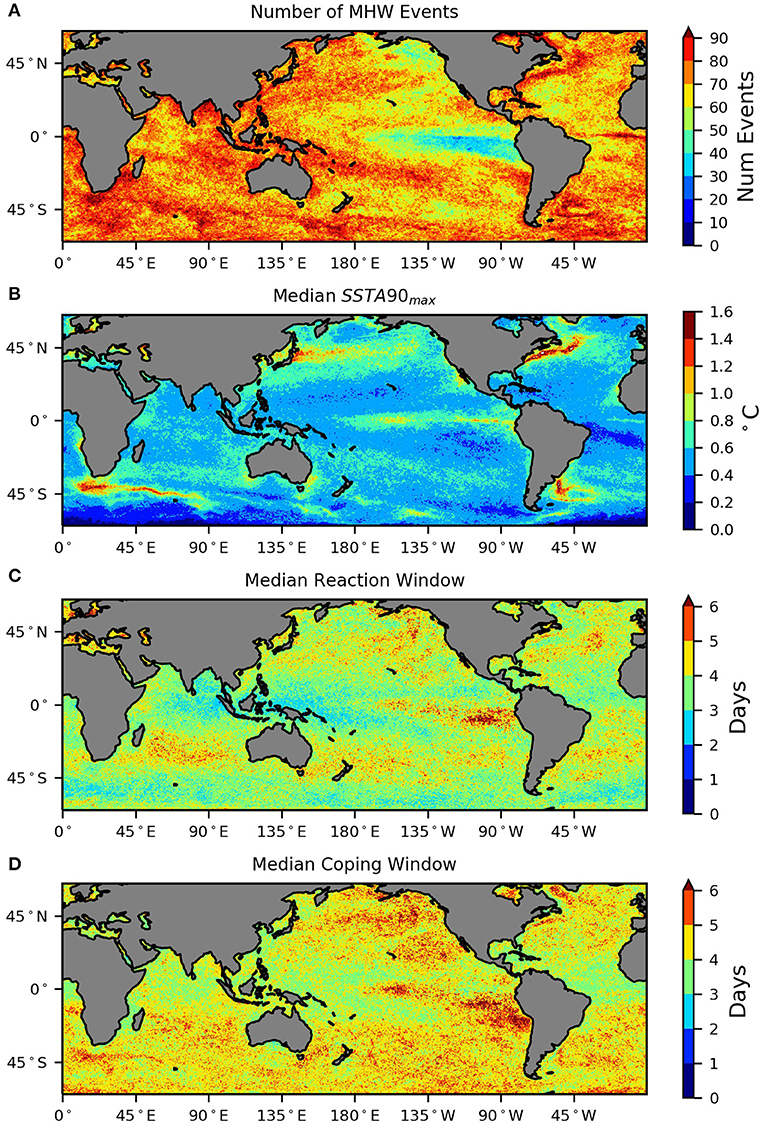
Figure 2. (A) Number of MHW events, (B) median peak exceedance (SSTA90max), (C) median reaction window (tmax-tstart) and (D) median coping window (tend-tmax) for 1982–2018. Data are Reynolds OISSTv2.1. See Figure 1 for definitions.
The rate of onset showed spatial coherence across the ocean (Figure 3A). Areas of rapid onset were located in the northwest Atlantic, south Indian Ocean below South Africa and Kerguelen plateau, southwest Atlantic Ocean (off Brazil), and off the eastern coast of Australia. These are all locations that are known global warming hotspots (Hobday and Pecl, 2014) and with high SST variability (Supplementary Figure 1). Other areas not previously identified as global warming hotspots, but with rapid onset rates include off west Africa, the Kuroshio extension region, and the Pacific equatorial cold tongue. The rates of decline are also relatively rapid in all these locations (Figure 3B), although are comparatively slower than onset rate (Figure 3C). This difference is more pronounced in the equatorial Indo-Pacific where rapid MHW onset rates are observed but decline rates are considerably slower. Globally, 73% of ocean grid cells have a higher median onset rate than median decline rate (Figure 3C), reflecting the high proportion of cells having a shorter median reaction window than median coping window (Figures 2C,D).
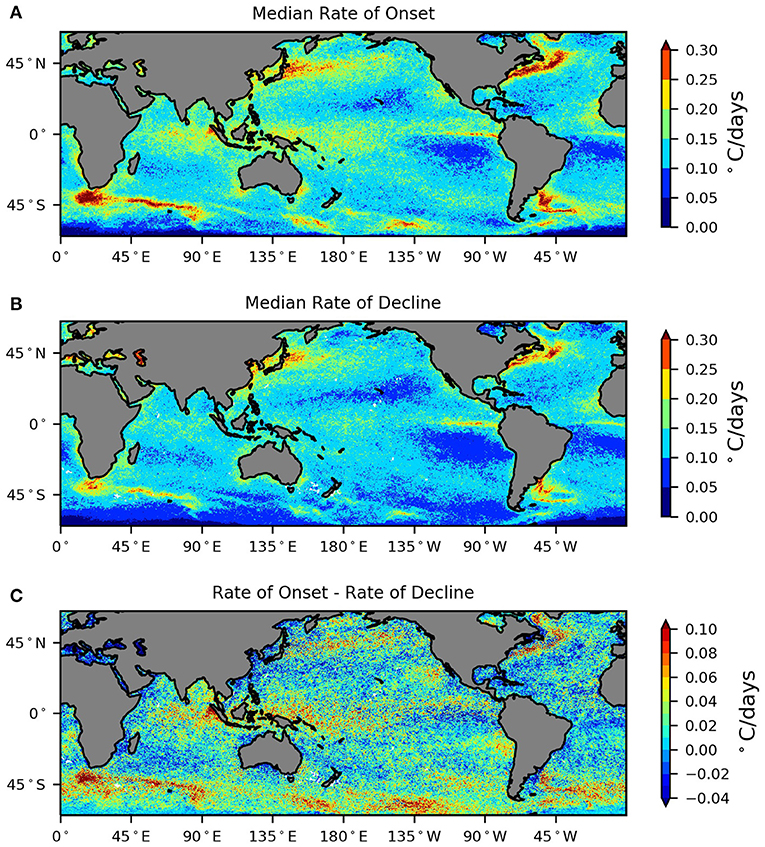
Figure 3. Global median (A) rate of onset (Ronset) (B) rate of decline (Rdecline) and (C) onset rate minus decline rate for 1982–2018. Data are Reynolds OISSTv2.1. See Figure 1 and Equations (2) and (3) for definitions.
The rate of change in number of MHW events per year is positive across most areas of the tropical and temperate ocean over 1982–2018 (82% of ocean grid cells), with greatest change (a trend of at least 0.12 events per year) in the northwest Atlantic, western Indian Ocean, southwest Atlantic, the western tropical Pacific and off the Australian southeast coast (Figure 4A). Notable exceptions include the California Current region, the eastern equatorial Pacific and the Southern Ocean which showed a negative trend in the number of MHW events over the period. The rate of change in peak exceedance (SSTA90max) was negative in over 54% of ocean grid cells though was not as coherent spatially across the domain. The equatorial Pacific and Indian Oceans showed the greatest annual decrease in SSTA90max over the period (Figure 4B). The traditionally ENSO dominated eastern Pacific also had the greatest negative rate of change in median reaction and coping windows across the domain (Figures 4C,D), suggesting a general trend toward shorter and less severe though slightly more frequent events. Conversely, the central Pacific is showing a trend toward less frequent, longer events. Some regions are showing an increase in more frequent, more severe, longer events such as off the southeast Australian coast, east of Madagascar in the Indian Ocean and northwest Atlantic Ocean (Figure 4). This increase in duration, severity and frequency of events, as well as the resulting shortening of in recovery windows between events (Figure 1A), would be a growing concern for marine stakeholders operating in these regions.
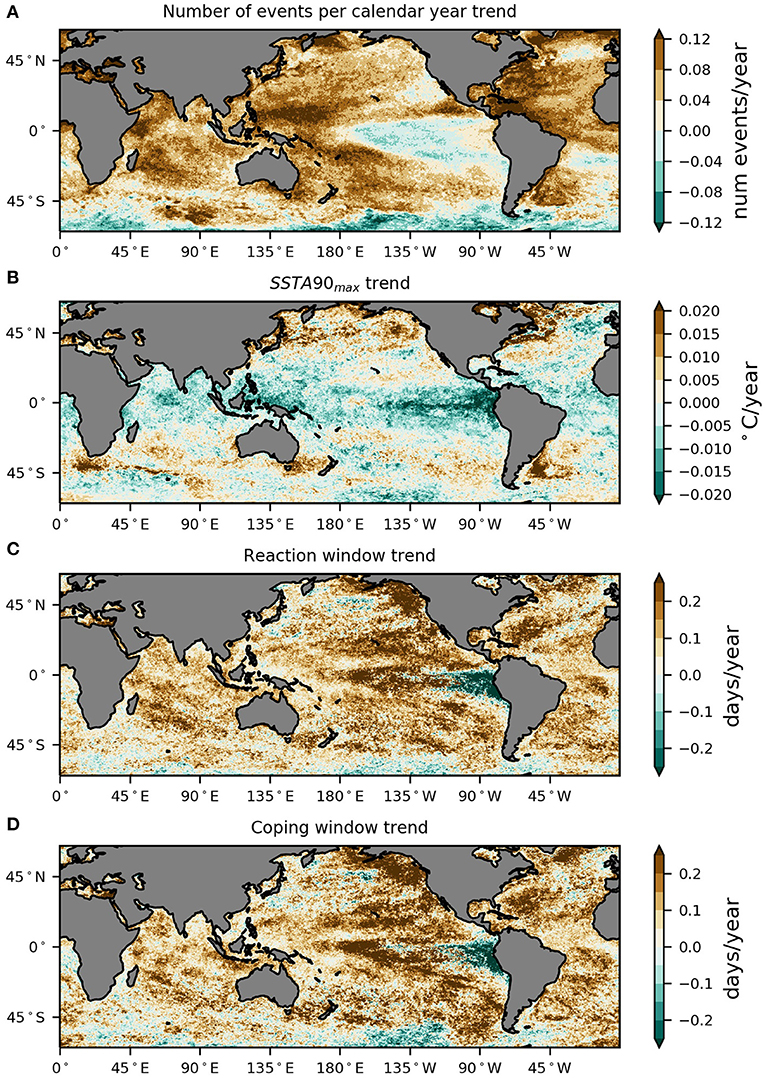
Figure 4. Global rate of change in (A) number of MHW events, (B) peak exceedance (SSTA90max), (C) reaction window (tmax-tstart) and (D) coping window (tend-tmax) over the period 1982–2018. Data are Reynolds OISSTv2.1. See Figure 1 for definitions.
The rates of onset and decline of MHWs are changing over the global ocean. The trends in onset and decline rate during 1982–2018 were both negative over most of the global ocean with similar geographic patterns (Figure 5). In terms of the proportion of ocean grid cells, 67% had negative trends in both onset and decline rates. In the equatorial regions, this can be explained by a general decrease in peak exceedance (SSTA90max) and an increase in both reaction and coping windows (Figures 4C,D), i.e., MHWs are taking longer to reach reduced peak intensities and are disappearing more slowly after the event peaks have passed. In the sub tropics, a greater positive trend in both reaction and coping windows (i.e., total duration) offsetting a weaker positive trend in intensity (Figures 4B–D) is the likely explanation for negative offset and decline rate trends (Figure 5). In the eastern equatorial Pacific (off Peru), there is only a very weak trend in both the rates of onset and decline (Figure 5), due to negative trends in both duration and intensity effectively canceling out one another out (Figures 1B,C). In many areas where rapid median onset and decline rates are observed (Figures 3A,B), there is also a positive trend in onset and decline rates i.e., MHWs are developing and declining more rapidly. These regions include south Africa and Kerguelen, northwest Atlantic, northwest Pacific, southwest South Atlantic and off the eastern coast of Australia (Figure 5).
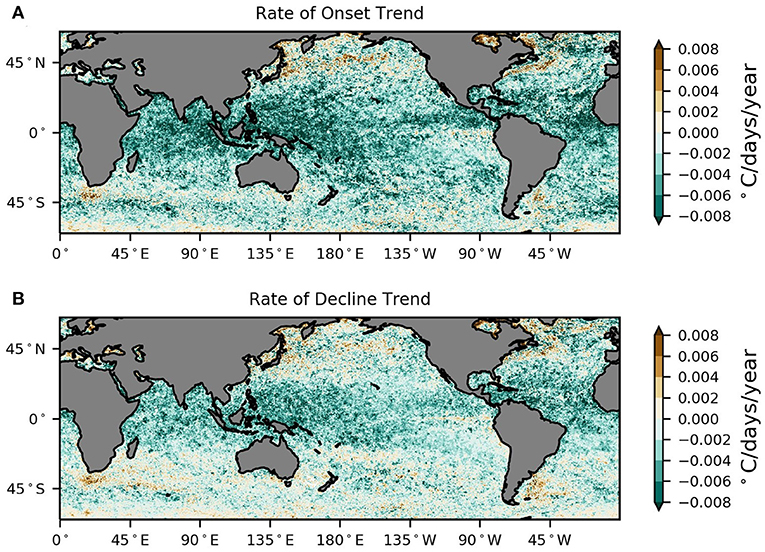
Figure 5. Global rate of change in (A) rate of onset and (B) rate of decline for the period 1982–2018. Data are Reynolds OISSTv2.1.
Model hit rates for monthly SST > 90th percentile for lead times 0, 2, and 4 months for all start months are shown in Figure 6 (left) and give an indication of how well the model captures observed average MHW conditions month by month. Hit rates for SST > 90th percentile are highest at lead time 0 for all regions and generally decrease with lead time. Highest monthly skill persists in the tropical east Pacific, with hit rates above 90% at lead 0 months and above 50% at 4 months. Hit rates decrease to 50% or less everywhere else by lead time 4 months (Figure 6, left). Hit rates are highest in the equatorial Pacific and northeast Pacific at all lead times (Figure 6, left), where there are fewer, longer lived marine heatwaves events (Figure 2), with increased predictability due to the influence of ENSO. Skill is reasonable in the western Pacific either side of the equator (Figure 6, center), an area showing a positive trend in the number of events (Figure 4A). Areas with the greatest rate of change (positive or negative) in median duration also tended to have good model skill. This may be due to this change in duration being most pronounced in areas that already experience long events such as the equatorial Pacific (Figures 3C,D). Skill is lowest at lead 0 months in dynamic regions (Figure 6, left) where onset rates are fastest (Figure 3A) i.e., southwest Atlantic, northwest Atlantic, off the eastern coast of Australia and east of Japan, and decreases further as lead time increases (Figure 6, left). A similar pattern is observed for areas with rapid MHW decline rates (Figure 6, left; Figure 3B).
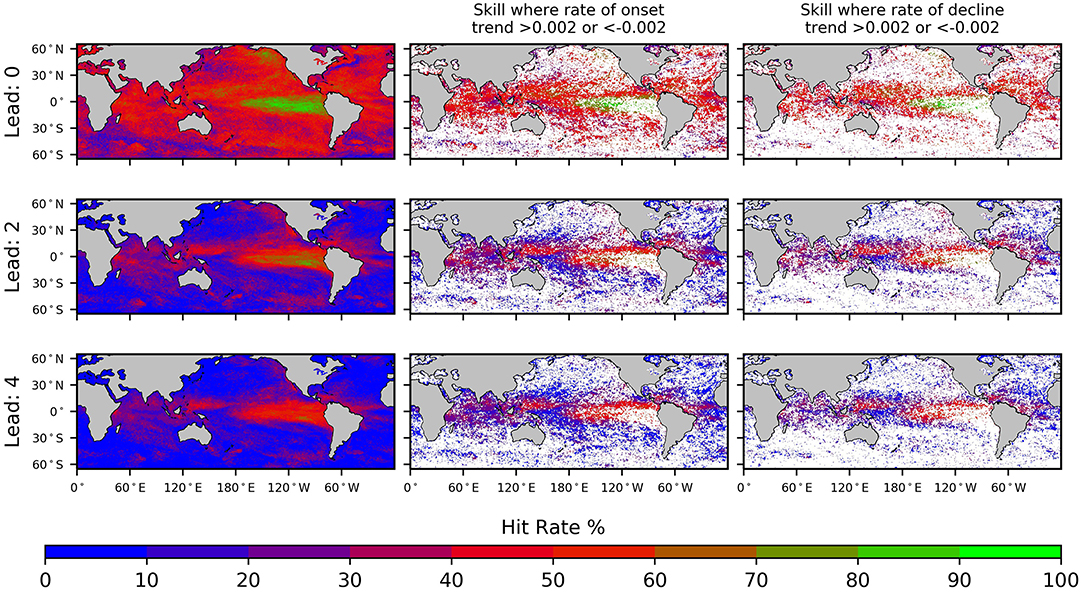
Figure 6. ACCESS-S2 hit rate for monthly SST > 90th percentile for all months 1982–2018 at lead times 0, 2, and 4 months (left column). These hit rate values are then shaded only where the onset rate trend is >0.002 or <-0.002°C day−2 year−1 (center column; 68% of grid cells) and where the decline rate trend is > 0.002 or <-0.002°C day−2 year−1 (right column; 53% of grid cells). Note that 50% of model ensemble members predicting monthly SST above the 90th percentile as observed is defined as a hit. Refer to Figure 2A for number of events.
Approximately 62% (46%) of ocean grid cells had a negative trend in onset (decline) rate of < −0.002°C day−1 yr−1 (Figure 6, center), with 33% having negative trends in both onset and decline rates < −0.002°C day−1 yr−1. Conversely, only 6% (7%) had positive trends in onset (decline) rates of > 0.002°C day−1 yr−1. Note that a trend in onset or decline rate of 0.002°C day−1 yr−1 corresponds to a change of about 0.074°C day−1 over the 37 year period. For these regions where trends in onset and decline rates exceed ±0.002°C day−1 yr−1, model hit rates were generally > 40% at lead 0 months (Figure 6, center and right). Monthly skill was retained in the tropical Pacific at longer lead times, although less so in the tropical Atlantic and the Indian Ocean. For these areas where trends in onset and decline rates are greatest, highest sustained monthly skill is found over the equatorial Pacific, which coincides regions of significant increasing duration (central) and decreasing duration (east) (Figure 4C), and a decreasing number of annual events (Figure 4A). Skillful forecasts at longer leadtimes provides longer preparation windows for MHW events.
An increase in the duration, intensity and frequency of marine heatwaves has been both documented in the historical period (Oliver et al., 2018), and projected for the future using a range of climate models (Oliver et al., 2019). Much of this change is due to the long-term increase in SST associated with anthropogenic warming (Oliver, 2019; Marin et al., 2021). We show that the rates of MHW onset and decline are also changing around the world, which will have implications in the preparation for, and response to, MHW events. To better prepare for MHWs, and cope with the changing nature of events, marine users require information about future conditions to improve decision-making (Hobday et al., 2016b). Changing ocean conditions due to anthropogenic climate change means historical experience is becoming less useful as guide for future conditions. Environmental forecasts offer great value in the management of living marine resources and for all of those who are dependent on the ocean for both nutrition and their livelihood (Payne et al., 2017; Tommasi et al., 2017).
Regions with rapid MHW onset rates generally also have fast decline rates (Figure 3). This suggests that surface ocean heat is introduced and lost quickly in these areas via air-sea exchange, or that rapid onset and decline of MHWs in these regions indicates shorter local residence time of a water mass. This latter explanation is likely in western boundary current systems where increased advection has been reported (e.g., Wu et al., 2012). When advection is enhanced, warm eddies move more quickly through an area, resulting in apparent rapid onset and then decline of MHWs (Figure 5). In fact, many of these rapid onset regions are associated with known eddy fields, such as the western equatorial Pacific and are known global warming hotspots (Supplementary Figure 1). In other regions, rapid changes in air-sea exchange result in rapid onset of MHWs (e.g., Tasman Sea – Salinger et al., 2019, Northeast Pacific – Bond et al., 2015; Jacox et al., 2019). These rapid onset rates can be due to shorter reaction windows (Figure 1B), meaning there is less time for affected marine decision-makers to implement their MHW response plan, or more intense events requiring increased mitigation efforts. In such areas, a forecast system is particularly valuable, as the preparation window provides additional time for planning.
Seasonal forecasts of monthly SST exceeding the 90th percentile tend to have highest skill in areas with fewer but longer lived MHWs such as the tropical Pacific in the ENSO region (Figures 2, 6). Skill here is driven by large scale, slower moving climate drivers that have greater predictability at longer leadtimes (Holbrook et al., 2019), resulting in longer preparation windows for users. Model skill is lower and declines more quickly with lead time in areas with high variability and large dynamic eddy fields (Supplementary Figure 1). Areas with the largest observed changes in total duration, onset and decline rates tend to also be areas with highest skill, specifically much of the tropical oceans. Our skill assessment is preliminary as it is based on monthly SST but it does provide an indication of the model's ability to predict average MHW conditions. Thus, marine decision-makers in these regions can benefit from the use of seasonal MHW forecasts, with skill further into the future resulting in longer preparation windows. However, advance warning of these events through seasonal forecasting has benefits for the vast majority of locations, even at short lead times. Most of the global ocean has positive trends both in terms of number of MHW events and total duration, indicating reduced recovery windows between subsequent events, which will have further ramifications for the resilience of marine systems and industries. Use of seasonal forecast information allows marine decision-makers to implement management strategies ahead of the event to both help mitigate impacts and increase capacity to be able to cope with subsequent events.
Both reaction and coping windows exhibit increasing trends (Figures 4C,D), with only small regions of decline in the far eastern equatorial Pacific and Southern Ocean. Conversely, peak exceedance is declining in the tropics and mostly increasing in the subtropics (Figure 4B). An increase in the rate of onset can be due to an event peaking more quickly or due to an event of the same duration reaching a greater intensity (Figures 1B,C). Only the former leads to a decrease in the reaction window, and forecasts provide an additional window for implementing a marine heatwave management plan. Where intensity is increasing, the reaction window may remain the same, but the response options to such extreme temperatures may be different, and so a preparation window is still advantageous. Efforts are currently underway by the authors to develop and assess forecasts of MHW intensity and duration (Benthuysen et al., 2021).
In areas where model skill is lower, reactive responses can be implemented when the 90th percentile MHW threshold is first exceeded. A faster onset rate will reduce the reaction window, relative to areas with slower onset rates, or where the rate of onset is declining. The rate of decline may seem less useful to marine decision-makers, as the extreme temperatures have already passed. However, over most of the global oceans, coping windows are longer than reaction windows, with similar or greater increasing trends. Refined forecasts of decline rate and coping windows will aid marine managers in determining how much longer they might need to maintain alternative arrangements or cope until normal conditions return. Until we can forecast the maximum intensity at daily timescales, this information will not be available. Nevertheless, our results can still inform marine decision-makers about the climatological rates of decline for a region. In areas with slow decline rates and long coping windows, stakeholders might prepare for the long haul as MHW conditions will persist longer. In areas that have a fast rate of MHW decline, there may be an opportunity to persevere, as the event could end quickly.
MHWs are examples of extreme events that can disrupt marine users, including those involved in fishing, aquaculture and marine tourism. Marine managers have a range of response options to MHW events, including fishery closures (Caputi et al., 2019) and early harvesting (e.g., Hobday et al., 2018b). While resource management has been a focus with respect to MHWs, a growing effort in marine restoration ecology (e.g., Coleman et al., 2020; Eger et al., 2020; coral, kelp, seagrass, oyster beds) also requires awareness of potential impacts of these extreme events. As on land, it has been shown that restoration success depends on environmental conditions, with some practitioners already timing the scope and nature of the restoration effort based on prevailing conditions (Tulloch et al., 2020). Improved management responses in all these spheres are possible, with both ongoing monitoring of events and improved forecasting, including information on onset and decline rates of MHW events. Timescales of response under different lead times will depend on the agility of the industry and the level of manipulation of the system. Some industries required advance warning months ahead in order to mitigate impacts of an impending MHW, whereas others are more responsive. Proactive industry sectors will have already started developing response plans for MHW events, just as planning has begun for climate change (Hodgkinson et al., 2014; Fogarty et al., 2020). The time derived from the combination of the preparation and reaction windows allows for a wider range of responses to impacts.
Marine decision-makers utilizing seasonal forecasts are also improving their ability to be agile (Hobday et al., 2016b). Extreme events, such as MHWs, present additional challenges, but once identified, they can be included in operational response plans. For example, waters off Tasmania which support a large salmon aquaculture industry, experienced a rapid onset local MHW in November 2017. This industry had been using seasonal forecasts for almost a decade to support operational decision making (Spillman and Hobday, 2014), and also experienced the strong 2016 Tasman MHW event the previous year (Oliver et al., 2017). However, the rapid onset rate of the 2017 event was driven by regional atmospheric changes that could not be forecast at seasonal timescales. Despite this, local salmon aquaculture operators were prepared for such events, and reactive management efforts (early harvest, feed adjustment, additional environmental forecasts) were quickly considered. Following this event, management plans have been updated and requests for improved (e.g., increased spatial resolution, maximum temperatures, MHW) and more frequent forecasts (e.g., fortnightly in warmest times of the year) have been received by the authors.
Currently the typical onset and decline rate definitions are from the start of the event to the maximum intensity of the event, and from the peak to the end (Figure 1). Other metrics that precede the start of an MHW event may also be useful for marine industries and could represent threshold triggers for management action. For example, various industry and species thermal thresholds may be exceeded during the build-up of heat prior to temperatures reaching the 90th percentile, particularly depending on what time of the year the MHW occurs. It is also possible that species or industry recovery may not occur until conditions return to “normal” – different industry plans may need to use different definitions. Lower exceedance thresholds could be used (e.g., 70th percentile) in a two stage early warning system, currently work in development by the authors. Not all MHWs will be captured by coarser resolution seasonal forecast models. However, impacts of synoptically driven events for example, would be limited to local regions as compared to regional events driven by more predictable larger scale climate drivers. The time between events (recovery window) is also an important consideration as resilience of systems becomes reduced due impacts of repeated events. Negative impacts, both ecological and economic, may be occur at increasingly lower thresholds with consecutive MHWs and reduced recovery periods.
Seasonal forecasting of ocean temperatures has been demonstrated as an important for marine stakeholders to cope with climate variability and increase their resilience in the face of climate change. Ocean temperature forecasts can be enhanced to provide MHW predictions, which are of particular interest to marine decision-makers. Our preliminary mapping of monthly SST > 90th percentile forecast skill to areas of greatest change in MHW onset and decline rates gives an indication of where forecasts will be particularly useful in providing preparation windows to marine managers. In this fast-developing research field, prototype seasonal forecasts for MHWs on timescales of weeks to months are close to fruition. As oceans warm, there will be an increasing need for all marine stakeholders to manage their climate risk, particularly around extreme events such as MHWs. Seasonal forecasts can provide additional time for marine stakeholders to prepare for an event, information about how long they need to cope with extreme conditions and as model skill increases at longer leadtimes, how long they have before the next event.
The raw data supporting the conclusions of this article will be made available by the authors, without undue reservation.
CS and GS led the paper equally. AH and JH provided text and 2 figures. All authors contributed to the article and approved the submitted version.
Project funds provided by CSIRO Oceans and Atmosphere and the Bureau of Meteorology, Australia. Publication charges paid by CSIRO Oceans and Atmosphere.
The authors declare that the research was conducted in the absence of any commercial or financial relationships that could be construed as a potential conflict of interest.
All claims expressed in this article are solely those of the authors and do not necessarily represent those of their affiliated organizations, or those of the publisher, the editors and the reviewers. Any product that may be evaluated in this article, or claim that may be made by its manufacturer, is not guaranteed or endorsed by the publisher.
We appreciate the assistance of Griffith Young, Morwenna Griffiths, and Guo Liu for the preparation of the ACCESS-S2 hindcast set, and Li Shi, Ben Hague and Diana Greenslade (Bureau of Meteorology, Australia) for review of earlier drafts.
The Supplementary Material for this article can be found online at: https://www.frontiersin.org/articles/10.3389/fclim.2021.801217/full#supplementary-material
Babcock, R. C., Bustamante, R. H., Fulton, E. A., Fulton, D. J., Haywood, M. D. E., Hobday, A. J., et al. (2019). Severe continental-scale impacts of climate change are happening now: extreme climate events impact marine habitat forming communities along 45% of the Australian coast. Front. Mar. Sci. 6:411. doi: 10.3389/fmars.2019.00411
Banzon, V., Smith, T. M., Chin, T. M., Liu, C., and Hankins, W. (2016). A long-term record of blended satellite and in situ sea-surface temperature for climate monitoring, modeling and environmental studies. Earth Syst. Sci. Data 8, 165–176. doi: 10.5194/essd-8-165-2016
Barbeaux, S. J., Holsman, K., and Zador, S. (2020). Marine heatwave stress test of ecosystem-based fisheries management in the Gulf of Alaska Pacific Cod Fishery. Front. Mar. Sci. 7:703. doi: 10.3389/fmars.2020.00703
Bellquist, L., Saccomanno, V., Semmens, B. X., Gleason, M., and Wilson, J. (2021). The rise in climate change-induced federal fishery disasters in the United States. PeerJ 9:e11186. doi: 10.7717/peerj.11186
Benthuysen, J. A., Smith, G. A., Spillman, C. M. C, and Steinberg, C. (2021). Subseasonal prediction of the 2020 Great Barrier Reef and Coral Sea marine heatwave. Environ. Res. Lett. 16:124050. doi: 10.1088/1748-9326/ac3aa1
Bernal, M. A., Schunter, C., Lehmann, R., Lightfoot, D. J., Allan, B. J. M., Veilleux, H. D., et al. (2020). Species-specific molecular responses of wild coral reef fishes during a marine heatwave. Sci. Adv. 6:eaay3423. doi: 10.1126/sciadv.aay3423
Bond, N. A., Cronin, M. F., Freeland, H., and Mantua, N. (2015). Causes and impacts of the 2014 warm anomaly in the NE Pacific. Geophys. Res. Lett. 42, 3414–3420. doi: 10.1002/2015GL063306
Boschetti, F., Bulman, C. M., Hobday, A. J., Fulton, E. A., Contardo, S., Lozano-Montes, H., et al. (2020). Sectoral futures are conditional on choices of global and national scenarios – Australian marine examples. Front. Mar. Sci. 7:563205. doi: 10.3389/fmars.2020.563205
Bureau of Meteorology CSIRO (2020). State of the Climate 2020. Commonwealth of Australia. Available online at: http://www.bom.gov.au/state-of-the-climate/ (accessed July 22, 2021).
Caputi, N., Kangas, M., Chandrapavan, A., Hart, A., Feng, M., Marin, M., et al. (2019). Factors affecting the recovery of invertebrate stocks from the 2011 Western Australian extreme marine heatwave. Front. Mar. Sci. 6:484. doi: 10.3389/fmars.2019.00484
Cavole, L. M., Demko, A. M., Diner, R. E., Giddings, A., Koester, I., Pagniello, C. M. L. S., et al. (2016). Biological impacts of the 2013–2015 warm-water anomaly in the Northeast Pacific: winners, losers, and the future. Oceanography 29, 273–285. doi: 10.5670/oceanog.2016.32
Coleman, M. A., Wood, G., Filbee-Dexter, K., Minne, A. J. P., Goold, H. D., Vergés, A., et al. (2020). Restore or redefine: future trajectories for restoration. Front. Mar. Sci. 7:237. doi: 10.3389/fmars.2020.00237
Dunstan, P., Moore, B., Bell, J., Holbrook, N., Oliver, E., Risbey, J., et al. (2018). How can climate predictions improve sustainability of coastal fisheries in Pacific Small-Island Developing States? Marine Policy 88, 295–302. doi: 10.1016/j.marpol.2017.09.033
Eger, A. M., Vergés, A., Choi, C. G., Christie, H., Coleman, M. A., Fagerli, C. W., et al. (2020). Financial and institutional support are important for large-scale kelp forest restoration. Front. Mar. Sci. 7:535277. doi: 10.3389/fmars.2020.535277
Fisher, M. C., Moore, S. K., Jardine, S. L., Watson, J. R., and Samhouri, J. F. (2021). Climate shock effects and mediation in fisheries. Proc. Natl. Acad. Sci. U. S. A. 18:e2014379117. doi: 10.1073/pnas.2014379117
Fogarty, H. E., Cvitanovic, C., Hobday, A. J., and Pecl, G. T. (2020). An assessment of how Australian fisheries management plans account for climate change impacts. Front. Mar. Sci. 7:591642. doi: 10.3389/fmars.2020.591642
Hague, B. S., McGregor, S., Murphy, B. F., Reef, R., and Jones, D. A. (2020). Sea level rise driving increasingly predictable coastal inundation in Sydney, Australia. Earths Future 8:e2020EF001607 doi: 10.1029/2020EF001607
Hemraj, D. A., Posnett, N. C., Minuti, J. J., Firth, L. B., and Russell, B. D. (2020). Survived but not safe: marine heatwave hinders metabolism in two gastropod survivors. Mar. Environ. Res. 162:105117. doi: 10.1016/j.marenvres.2020.105117
Hobday, A. J., Alexander, L. V., Perkins, S. E., Smale, D. A., Straub, S. C., Oliver, E. C. J., et al. (2016a). A hierarchical approach to defining marine heatwaves. Prog. Oceanogr. 141, 227–238. doi: 10.1016/j.pocean.2015.12.014
Hobday, A. J., and Hartog, J. R. (2014). Dynamic ocean features for use in ocean management. Oceanography 27, 134–145. doi: 10.5670/oceanog.2014.92
Hobday, A. J., Oliver, E. C. J., Gupta, A. S., Benthuysen, J. A., Burrows, M. T., Donat, M. G., et al. (2018a). Categorizing and naming marine heatwaves. Oceanography 31, 162–173. doi: 10.5670/oceanog.2018.205
Hobday, A. J., and Pecl, G. T. (2014). Identification of global marine hotspots: sentinels for change and vanguards for adaptation action. Rev. Fish Biol. Fish 24, 415–425. doi: 10.1007/s11160-013-9326-6
Hobday, A. J., Spillman, C. M., Eveson, P., and Hartog, J. R. (2016b). Seasonal forecasting for decision support in marine fisheries and aquaculture. Fisher. Oceanogr. 25, 45–56. doi: 10.1111/fog.12083
Hobday, A. J., Spillman, C. M., Eveson, P., Hartog, J. R., Zhang, X., and Brodie, S. (2018b). A framework for combining seasonal forecasts and climate projections to aid risk management for fisheries and aquaculture. Front. Mar. Sci. 5:137. doi: 10.3389/fmars.2018.00137
Hodgkinson, J. A., Hobday, A. J., and Pinkard, E. A. (2014). Climate adaptation in Australia's resource-extraction industries: ready or not? Region. Environ. Change 14, 1663–1678. doi: 10.1007/s10113-014-0618-8
Holbrook, N. J., Gupta, A. S., Oliver, E. C. J., Hobday, A. J., Benthuysen, J. A., Scannell, H. A., et al. (2020). Keeping pace with marine heatwaves as oceans warm. Nat. Rev. Earth Environ. 1, 482–493. doi: 10.1038/s43017-020-0068-4
Holbrook, N. J., Scannell, H. A., Gupta, A. S., Benthuysen, J. A., Feng, M., Oliver, E. C. J., et al. (2019). A global assessment of marine heatwaves and their drivers. Nat. Commun. 10:2624. doi: 10.1038/s41467-019-10206-z
Huang, B., Liu, C., Banzon, V., Freeman, E., Graham, G., Hankins, B., et al. (2021). Improvements of the daily optimum interpolation sea surface temperature (DOISST) version 2.1. J. Clim. 34, 2923–2939. doi: 10.1175/JCLI-D-20-0166.1
Hudson, D., Alves, O., Hendon, H. H., Lim, E., Liu, G., et al. (2017). ACCESS-S1: the new Bureau of Meteorology multi-week to seasonal prediction system. J. Southern Hemisphere Earth Syst. Sci. 67, 132–159. doi: 10.1071/ES17009
Hughes, T. P., Kerry, J. T., Baird, A. H., Connolly, S. R., Eakin, C. M., Heron, S. F., et al. (2018). Ecological memory modifies the cumulative impact of recurrent climate extremes. Nat. Clim. Chang. 9, 40–43. doi: 10.1038/s41558-018-0351-2
Hughes, T. P., Kerry, J. T., Connolly, S. R., Alvarez-Romero, J. G., Eakin, C. M., Heron, S. F., et al. (2021). Emergent properties in the responses of tropical corals to recurrent climate extremes. Curr. Biol. 31, 5393–5399.e3. doi: 10.1016/j.cub.2021.10.046
IPCC (2019). “IPCC special report on the ocean and cryosphere in a changing climate,” in eds. H. O. Pörtner, D. C. Roberts, V. Masson-Delmotte, P. Zhai, M. Tignor, E. Poloczanska (IPCC). Availabe online at: https://www.ipcc.ch/site/assets/uploads/sites/3/2019/12/SROCC_FullReport_FINAL.pdf
Jacox, M., Tommasi, D., Alexander, M. A., Hervieux, G., and Stock, C. A. (2019). Predicting the evolution of the 2014–2016 California current system marine heatwave from an ensemble of coupled global climate forecasts. Front. Mar. Sci. 6:497. doi: 10.3389/fmars.2019.00497
Liersch, S., Drews, M., Pilz, T., Salack, S., Sietz, D., Aich, V., Larsen, M. A. D., Gädeke, A., Halsn,æ, K., Thiery, W., and others (2020). One simulation, different conclusions – the baseline period makes the difference! Environ. Res. Lett. 15:104014. doi: 10.1088/1748-9326/aba3d7
Maclachlan, C., Arribas, A., Peterson, K. A., Maidens, A., Fereday, D., Scaife, A. A., et al. (2015). Global Seasonal forecast system version 5 (GloSea5): a high-resolution seasonal forecast system. Q. J. R. Meteorol. Soc. 141, 1072–1084. doi: 10.1002/qj.2396
Marin, M., Feng, M., Phillips, H. E., and Bindoff, N. L. (2021). A global, multiproduct analysis of coastal marine heatwaves: distribution, characteristics, and long-term trends. J. Geophys. Res. Oceans 126:e2020JC016708. doi: 10.1029/2020JC016708
Morris, R. L., Konlechner, T. M., Ghisalberti, M., and Swearer, S. E. (2018). From grey to green: efficacy of eco-engineering solutions for nature-based coastal defence. Glob. Chang. Biol. 24, 1827–1842. doi: 10.1111/gcb.14063
Murakami, H., Delworth, T. L., Cooke, W. F., Zhao, M., Xiang, B., and Hsu, P.-C. (2020). Detected climatic change in global distribution of tropical cyclones. PNAS 117, 10706–10714. doi: 10.1073/pnas.1922500117
Oliver, E. C. J. (2019). Mean warming not variability drives marine heatwave trends. Clim. Dynam. 53, 1653–1659. doi: 10.1007/s00382-019-04707-2
Oliver, E. C. J., Benthuysen, J. A., Bindoff, N. L., Hobday, A. J., Holbrook, N. J., Mundy, C. N., et al. (2017). The unprecedented 2015/16 Tasman Sea marine heatwave. Nat. Commun. 8:16101. doi: 10.1038/ncomms16101
Oliver, E. C. J., Burrows, M. T., Donat, M. G., Gupta, A. S., Alexander, L. V., Perkins-Kirkpatrick, S. E., et al. (2019). Projected marine heatwaves in the 21st century and the potential for ecological impact. Front. Mar. Sci. 6:734. doi: 10.3389/fmars.2019.00734
Oliver, E. C. J., Donat, M. G., Burrows, M. T., Moore, P. J., Smale, D. A., Alexander, L. V., et al. (2018). Longer and more frequent marine heatwaves over the past century. Nat. Commun. 9:1324. doi: 10.1038/s41467-018-03732-9
Payne, M. R., Hobday, A. J., MacKenzie, B. R., Tommasi, D., Dempsey, D. P., Fassler, S. M. M., Haynie, A. C., and others (2017). Lessons from the first generation of marine ecological forecast products. Front. Mar. Sci. 4:289. doi: 10.3389/fmars.2017.00289
Piatt, J. F., Parrish, J. K., Renner, H. M., Schoen, S. K., Jones, T. T., Arimitsu, M. L., et al. (2020). Extreme mortality and reproductive failure of common murres resulting from the northeast Pacific marine heatwave of 2014-2016. PLoS ONE 15:e0226087. doi: 10.1371/journal.pone.0226087
Reynolds, R. W., Smith, T. M., Liu, C., Chelton, D. B., Casey, K. S., and Schlax, M. G. (2007). Daily high-resolution-blended analyses for sea surface temperature. J. Clim. 20, 5473–5496. doi: 10.1175/2007JCLI1824.1
Salinger, M. J., Renwick, J., Behrens, E., Mullan, A. B., Diamond, H. J., Sirguey, P., et al. (2019). The unprecedented coupled ocean-atmosphere summer heatwave in the New Zealand region 2017/18: drivers, mechanisms and impacts. Environ. Res. Lett. 14:044023. doi: 10.1088/1748-9326/ab012a
Schlegel, R. W., Oliver, E. C. J., Hobday, A. J., and Smit, A. J. (2019). Detecting marine heatwaves with sub-optimal data. Front. Mar. Sci. 6:737. doi: 10.3389/fmars.2019.00737
Sen Gupta, A., Thomsen, M., Benthuysen, J. A., Hobday, A. J., Alexander, L. V., Oliver, E., et al. (2020). Extreme marine heatwaves – the most intense, largest and longest events. Sci. Rep. 10:19359. doi: 10.1038/s41598-020-75445-3
Smale, D. A., Wernberg, T., Oliver, E. C. J., Thomsen, M., Harvey, B. P., Straub, S. C., et al. (2019). Marine heatwaves threaten global biodiversity and the provision of ecosystem services. Nat. Clim. Chang. 9, 306–312. doi: 10.1038/s41558-019-0412-1
Smith, G. A., and Spillman, C. M. (2019). New high-resolution sea surface temperature forecasts for coral reef management on the Great Barrier Reef. Coral Reefs 38, 1039–1056. doi: 10.1007/s00338-019-01829-1
Sorte, C. J. B., Fuller, A., and Bracken, M. E. S. (2010). Impacts of a simulated heat wave on composition of a marine community. Oikos 119, 1909–1918. doi: 10.1111/j.1600-0706.2010.18663.x
Spillman, C. M., and Hobday, A. J. (2014). Dynamical seasonal ocean forecasts to aid salmon farm management in a climate hotspot. Clim. Risk Manage. 1, 25–38. doi: 10.1016/j.crm.2013.12.001
Spillman, C. M., and Smith, G. A. (2021). A new operational seasonal thermal stress prediction tool for coral reefs around Australia. Front. Mar. Sci. 8:687833. doi: 10.3389/fmars.2021.687833
Tommasi, D., Stock, C. A., Hobday, A. J., Methot, R., Kaplan, I. C., Eveson, J. P., et al. (2017). Managing living marine resources in a dynamic environment: the role of seasonal to decadal climate forecasts. Prog. Oceanogr. 152, 15–49. doi: 10.1016/j.pocean.2016.12.011
Tulloch, A. I. T., Hagger, V., and Greenville, A. (2020). Ecological forecasts to inform near-term management of threats to biodiversity. Glob. Chang. Biol. 26, 5816–5828. doi: 10.1111/gcb.15272
Wernberg, T., Bennett, S., Babcock, R. C., Bettignies, T. D., Cure, K., Depczynski, M., et al. (2016). Climate-driven regime shift of a temperate marine ecosystem. Science 353, 169–172. doi: 10.1126/science.aad8745
World Meteorological Organization (2021). State of the Global Environment 2020. WMO-No. 1264. Geneva, Switzerland, 52pp. Available online at: https://public.wmo.int/en/our-mandate/climate/wmo-statement-state-of-global-climate (accessed July 22, 2021).
Keywords: marine heatwave, climate change, forecast skill, seasonal prediction, ACCESS-S, preparation window, reaction window, coping window
Citation: Spillman CM, Smith GA, Hobday AJ and Hartog JR (2021) Onset and Decline Rates of Marine Heatwaves: Global Trends, Seasonal Forecasts and Marine Management. Front. Clim. 3:801217. doi: 10.3389/fclim.2021.801217
Received: 25 October 2021; Accepted: 06 December 2021;
Published: 24 December 2021.
Edited by:
Sarah Elizabeth Perkins-Kirkpatrick, University of New South Wales Canberra, AustraliaReviewed by:
Phillip Williamson, University of East Anglia, United KingdomCopyright © 2021 Spillman, Smith, Hobday and Hartog. This is an open-access article distributed under the terms of the Creative Commons Attribution License (CC BY). The use, distribution or reproduction in other forums is permitted, provided the original author(s) and the copyright owner(s) are credited and that the original publication in this journal is cited, in accordance with accepted academic practice. No use, distribution or reproduction is permitted which does not comply with these terms.
*Correspondence: Claire M. Spillman, Y2xhaXJlLnNwaWxsbWFuQGJvbS5nb3YuYXU=
Disclaimer: All claims expressed in this article are solely those of the authors and do not necessarily represent those of their affiliated organizations, or those of the publisher, the editors and the reviewers. Any product that may be evaluated in this article or claim that may be made by its manufacturer is not guaranteed or endorsed by the publisher.
Research integrity at Frontiers
Learn more about the work of our research integrity team to safeguard the quality of each article we publish.