
95% of researchers rate our articles as excellent or good
Learn more about the work of our research integrity team to safeguard the quality of each article we publish.
Find out more
ORIGINAL RESEARCH article
Front. Clim. , 13 September 2021
Sec. Carbon Dioxide Removal
Volume 3 - 2021 | https://doi.org/10.3389/fclim.2021.733499
This article is part of the Research Topic Pathways Towards Negative Emissions in Industry View all 6 articles
 Shreenath Krishnamurthy1*
 Richard Blom1Kari Anne Andreassen1
 Vesna Middelkoop2Marleen Rombouts2Adolfo Benedito Borras3
Processes that utilize solid adsorbents to capture CO2 are promising alternatives to state-of-art Amine based technologies for capturing CO2 from large point sources. Although the energy needs of solid sorbent-based processes are low, the process footprint and consequently the capital cost connected to its implementation can be large due to the relatively long cycle times needed to get the required purity and recovery of the CO2 product. To overcome this challenge, processes having structured adsorbents like laminates, monoliths etc. are needed due to their low pressure drop and better mass transfer characteristics. The aim of this multiscale study is to evaluate the process-based performance of a 3D printed sorbent containing polyethyleneimine (PEI) and multiwalled carbon nanotubes (MWCNT) for capturing CO2 from a biomass fired power plant flue gas. A 6-step vacuum swing adsorption (VSA) cycle was simulated and optimized using equilibrium and kinetics data obtained from volumetry and breakthrough experiments. The optimization study showed that it was possible to achieve purity values >95% and recovery values >90% from dry CO2 feed streams containing 10 and 15% CO2 respectively. The minimum specific energy values were 0.94 and 0.6 MJ/kg and maximum productivity values were 0.8 and 2.2 mol/m3 ads s, respectively, for the two scenarios.
It is widely acknowledged that carbon capture from large point sources like power plants is advocated as a possible solution to reduce the global CO2 emissions and achieve the goals set by the Paris agreement in 2015 (IPCC, 2018). Typically, power plants use fossil fuels like coal or natural gas as fuels to produce energy. More recently, many power stations have started using Biomass as a fuel to produce energy (Mcilveen-Wright et al., 2013; Wei et al., 2020; Mohamed et al., 2021). Biomass is an organic matter available from plant and animal sources such as wood chips (Dell'antonia et al., 2012), saw dust (Fogarasi and Cormos, 2017), garbage (Pan et al., 2020), and animal wastes (Bijarchiyan et al., 2020; Lisbona et al., 2021) and are possible sources of renewable energy. It is also beneficial for reducing emissions as it produces lower CO2 and SOX in comparison with fossil fuels (Ali et al., 2017).
Adsorption processes using porous solids in a pressure/vacuum swing adsorption (P/VSA) technology are widely studied in the context of capturing CO2 from power plants and other CO2 emissions sources (Wang et al., 2013; Krishnamurthy et al., 2014; IEAGHG, 2018). In case of a PSA process, the regeneration of the solid is carried out by reducing the pressure (Vacuum/atmospheric pressure) of the column and therefore this can potentially reduce the energy consumption as well as avoiding long heating and cooling times that are typical of a temperature-based regeneration process.
For carbon capture to be economically viable, not only must the process be energetically attractive, but also have smaller capture footprint. This size of the capture unit can be reduced by operating the P/VSA process at faster cycles and higher flowrates. Traditional PSA processes employ packed beds containing pelletized adsorbents shaped in the form of spherical beads or cylindrical extrudates. A major drawback with respect to these packed beds is the significant pressure drop encountered at higher flowrates (Ruthven and Thaeron, 1997; Rezaei et al., 2010). This would therefore increase the energy consumption of the process. As an alternative, structure sorbents in the form of monoliths, laminates, and foams etc can be used in the adsorption process (Rezaei et al., 2010). These adsorbents offer the advantages of lower pressure drop and better mass transfer. Recently, these structured sorbents are being made by a technique called 3D printing. With 3D printing it is possible to make adsorbents with controlled channel sizes, channel wall thicknesses and, channel geometry (Lawson et al., 2021; Sluijter et al., 2021). There are several published studies in literature on 3D printed Zeolites (Thakkar et al., 2016; Couck et al., 2017, 2018; Middelkoop et al., 2019), carbons (Regufe et al., 2019; Steldinger et al., 2019), silicas (Thakkar et al., 2017a; Sluijter et al., 2021), metal organic frameworks (MOFs) (Thakkar et al., 2017b; Grande et al., 2020) and zeolitic imidazolate frameworks (ZIFs) (Lefevere et al., 2019) in the context of CO2 capture applications. To the best of our knowledge most of these studies talk about the characterization of the sorbents for obtaining the adsorption equilibrium and kinetics and very few publications discuss performance of these sorbents in a P/VSA process (Mohammadi, 2017; Sharma et al., 2020).
The aim of this work is to study the performance of a 3D printed sorbent that contains multi-walled carbon nanotubes (MWCNTs) and polyethyleneimine (PEI) in a vacuum swing adsorption process. This involves characterization of the adsorbent for obtaining information on the adsorption equilibrium and kinetics. In the next step, the equilibrium and kinetics data were fed to a process simulator to simulate and optimize a 6-step vacuum swing adsorption (VSA) process. The optimization was performed to identify the minimum specific energy and maximum productivity values for this cycle for capturing the CO2 from flue gases of biomass fired power plants.
Formulation of the past included the following materials: multi-walled carbon nanotubes (MWCNT); grade NC7000; batch A2199 from NANOCYL (Sambreville, Belgium); polyethyleneimine (PEI) with 70,000 Dalton from TCI (Japan) (ca. 30% in water); anionic surfactant UBEDISP1d83-N2 from UBE Corporation Europe (Castellón, Spain); and polyvinyl alcohol (PVA) grade Nichigo G-Polymer OKS-8077P from Nippon Gohsei (Osaka, Japan), a dissolved polymer binder commonly used in waterborne formulations to make minor adjustments to the rheological properties of the paste. PVA was dissolved in water at 25 wt% for 24 h at 65°C prior to mixing in the paste.
The role of the anionic surfactant was to improve the dispersion quality and interaction between MWCNTs and polyethyleneimine. PVA was used as a binder to improve the viscosity and stability of the paste, ensuring the paste was able to flow controllably with no phase separation during the extrusion process.
The following formulation was selected: 49.1 wt% MWCNT + 42.5 wt% PEI + 6.0 wt% UBEDISP1d83-N2 + 2.4 wt% PVA. The ratios are referred to the solid content of the components, excluding water content of each one.
The components were stirred with water at 25 wt% in a planetary mixer, model Dispermat CN-40 (VMA, Barcelona, Spain). Then, two complete steps of intensive shear mixing in a three-roll calender, model 80S from EXAKT (Norderstedt, Germany) were applied. In the first step, the gap between the three rolls was fixed at 80 and 30 μm, while in the second step the gap was fixed at 30 and 5 μm, respectively. The material was mixed in the rolls three times in each step. The speed of the rolls was kept constant during the whole process (100 rpm). The final dispersed material was carefully stored in a hermetically sealed container to avoid loss of water during transportation and handling.
The paste was 3D printed into CO2 monolithic adsorbents by the previously described 3D micro-extrusion process, relying on a mechanically driven piston mounted on a CNC machine (see Figure 1). While the piston was moving at a constant speed, the paste was extruded at a constant volume flow through a nozzle with an outlet diameter of 1.2 mm. The homogeneity and rheological properties of the paste are crucial to obtaining printed structures with controlled dimensions. Cylinders with a diameter of 40 mm and height of 25 mm have been laid down as “open channel design” with a fiber spacing of 4 mm and a rotation of 90° between the fibers in successive layers. The layers were stacked in the same orientation (0 or 90°) on top of each other without lateral shifts between the fibers, as schematically shown in Figure 1.
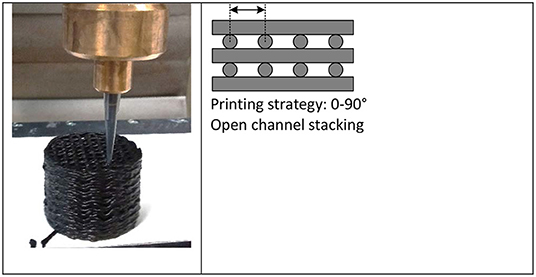
Figure 1. 3D printing of CO2 adsorbent structures.
A second processing step after printing involves the drying of the structures to remove water. Drying was performed at a temperature of 20 or 40°C and 60% relative humidity. The removal of a large amount of water in the paste resulted in a large shrinkage of about 40% upon drying, leading to a final outer diameter of 24 mm. The outer diameter of the cylinders has been machined to fit closely in the column used for the breakthrough experiments. The printed structures are shown in Figure 2.
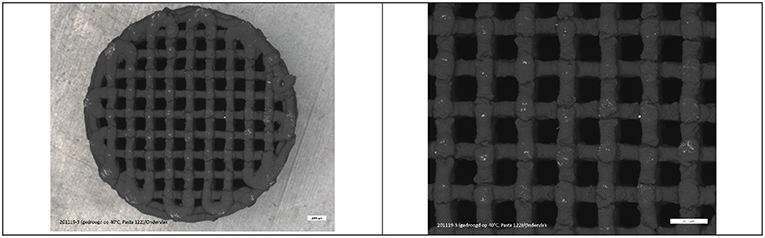
Figure 2. Top view of 3D printed CNT-PEI-UBE-PVA structure.
CO2, N2, and H2O isotherms were measured on crushed monolith structure using a volumetric/manometric apparatus purchased from BELSORP. Prior to the isotherm measurements the sample was degassed under vacuum and 100°C overnight. Once the sample was regenerated, the isotherm measurements were carried out up to pressures of 1 bar and at different temperatures. For CO2, the isotherms were measured at 70, 80, 90 and 100°C. Nitrogen adsorption was performed at 70°C. It should be noted that the sample holders of the volumetric apparatus used in this study is traditionally designed for pellets and powders and therefore the adsorbent had to be crushed for the measurements in order to be packed in the sample holders.
Specific surface areas were estimated from N2 isotherms recorded at liquid nitrogen temperatures (77K) using the BET formalism. Sample activation was typically carried out overnight at an external pre-treatment unit (BELPREP II vac) at 120°C under vacuum prior to a short (2 h) pre-treatment at the BELSORP Mini instrument. Micropore volume was estimated using the t-plot method based on said N2 isotherm measurements at 77K.
Mercury intrusion experiments were carried out using an AutoPore IV 9500 series from Micromeritics corporation. This technique relies on pressure-controlled intrusion of mercury into a porous sorbent to estimate the porosity, density, and the pore size distribution. About 0.3 g of crushed sample was used in the mercury porosimetry tests for this work.
Dynamic column breakthrough experiments were performed using a single printed structure measuring 1.5 cm in height and 2.08 cm in diameter. The schematic of the breakthrough system is shown in Figure 3. The 3D printed sorbent was packed in a stainless-steel column 2.1 cm in diameter and the sample was regenerated overnight in a nitrogen purge at 100°C. The sample was then cooled to the experimental temperature under nitrogen flow. Then a step input in the CO2 concentration was provided, while the outlet concentration was monitored by a mass spectrometer. Once the column was saturated, i.e., the CO2 signal was stable, desorption was carried out with nitrogen purge. Between experiments the column was regenerated at 100°C under a nitrogen purge. The total flowrates in the adsorption and desorption steps were 295 ml/min and 138 ml/min, respectively. The breakthrough experiments were caried out for 70, 80, 90, and 100°C with dry CO2 mixtures containing 10 and 15% CO2 and the rest N2. All the experiments were carried out at ambient pressure.
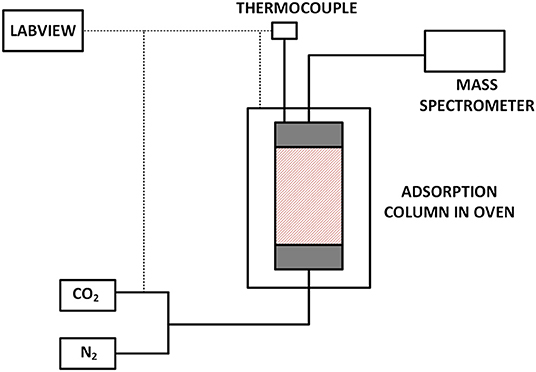
Figure 3. Schematic of the breakthrough setup used in this work.
The breakthrough experiments were analyzed using a 1D non-isothermal non-isobaric adsorption process model. The model equations are provided in the Supplementary Material. The system of partial differential equations was discretized in the spatial dimensions using the finite volume method and solved using ode15s in MATLAB. For the analysis of the breakthrough experiments, the fitting parameters were the linear driving force coefficient, the internal and external heat transfer coefficient values. The fitting exercise was carried by minimizing the residual between the experimental and simulated concentration and temperature curves.
For this study, we have chosen a 6-step vacuum swing adsorption process (Khurana and Farooq, 2016b) to concentrate CO2 from 15% to over 95% and with 90% recovery. The six-step cycle contains the following steps, and its sequence of operation is shown in Figure 4:
1. Adsorption at high pressure PH: In this step, feed is introduced into the column and preferential adsorption of CO2 takes place. Nitrogen is collected as the light-product from the product end.
2. Rinse at high pressure PH: The purpose of the rinse step is to enhance the CO2 concentration in the column and to get rid of the nitrogen in the column. The rinse step uses the entire product of the light reflux step and therefore its duration is the same as that of the light reflux step.
3. Co-current evacuation step at Pint: The feed of the column is closed, and the column is evacuated from the product end to an intermediate vacuum pressure Pint to get rid of the remaining nitrogen in the column and achieve high CO2 purity in the subsequent counter-current evacuation step.
4. Counter-current evacuation at PL: The product end is closed, and the column is evacuated to a low pressure PL to recover the CO2 product from the feed end.
5. Light reflux at PL: Here the column is purged with a part of the nitrogen from the adsorption step and the column is evacuated from the feed end. The light reflux product is recycled back in its entirety to the rinse step.
6. Light product pressurization to PH: The column is pressurized back to the high pressure with the rest of the nitrogen product of the adsorption step. Pressurizing the column in the counter-current direction sharpens the CO2 front inside the column and helps to minimize CO2 lossess in the adsorption, rinse and co-current evacuation steps.
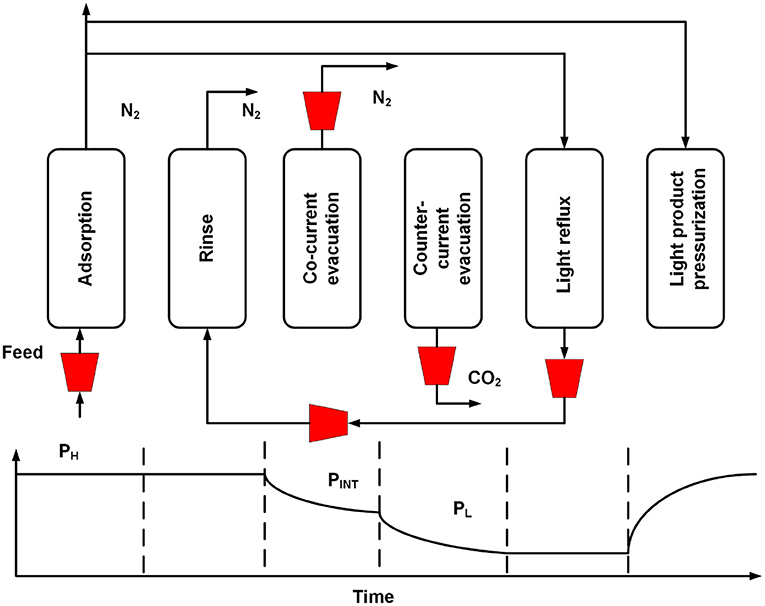
Figure 4. Schematic of the 6-step VSA process.
The model equations are the same as described in the section for the breakthrough experiments with appropriate boundary conditions for each step (Table 2 of Supplementary Material). The simulations were carried out until cyclic steady state (CSS) conditions. The CSS is set to be achieved when the mass balance error is <0.5% for 5 consecutive cycles. The performance of the process is described by four performance indicators namely CO2 purity, CO2 recovery, specific energy, and productivity. These are defined as follows:
The performance of the 6-step VSA cycle is dependent on the durations of the steps, feed flowrate and the pressure values in the evacuation steps. With multiple variables controlling the performance of the cycle, a simple parametric study will not provide the information on the minimum energy or maximum productivity conditions under USDOE requirements of 95% purity and 90% recovery (DOE-NETL, 2013). The true minimum therefore can only be obtained by rigorous optimization of the VSA process (Haghpanah et al., 2013). For the optimization, non-dominated sorting genetic algorithm (NSGA-II) function gamultiobj in MATLAB was used. Genetic algorithm-based optimization of cyclic adsorption processes is well-documented in literature (Haghpanah et al., 2013; Rajagopalan et al., 2016; Yancy-Caballero et al., 2020; Krishnamurthy et al., 2021b).
The objective functions for the genetic algorithm are provided below and the purity and recovery values of >95 and >90%, respectively, were the constraints.
The simulations were carried out in a HP Z6 G4 workstation with Intel(R) Xeon(R) Gold 6134 CPU @ 3.20GHz processor with 8 cores. The decision variables or the variables affecting the performance (Table 1) are the step durations of the adsorption, co-current evacuation, counter-counter evacuation and the light reflux step, the vacuum pressures in the co-current and the counter-current evacuation steps and the feed velocity. The maximum duration of the light reflux step is that of the adsorption step. The duration of the rinse step is the same as that of the light reflux step. The duration of the LPP step is also dependent on the adsorption step and its maximum duration is that of the adsorption step time—light reflux time. In the program the LPP step is stopped when the column pressure reaches 99% of the adsorption step. The column dimensions and the feed are fixed in the simulations. The following constraint is also placed to avoid a situation where the optimizer choses the same pressure for the co-current and counter-current evacuation steps.
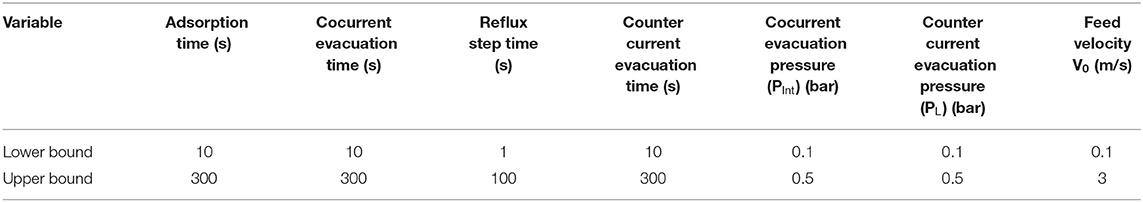
Table 1. Upper and lower bounds for decision variables for the optimization of 6-step VSA process.
The adsorption desorption curves of N2 at 77K are shown in Supplementary Figure 1 of the supporting information. The BET surface area was found to be 27 m2/g. This value is an order of magnitude lower in comparison with that of a pure MWCNT (Freitas et al., 2021).
Figure 5 shows the pore size distribution in the 3D printed sorbent and there is a bimodal pore size distribution with the presence of mesopores and micropores. The average pore diameter was found to be 0.03 μm and the density and porosity values were found to be 730 kg/m3 and 51% respectively.
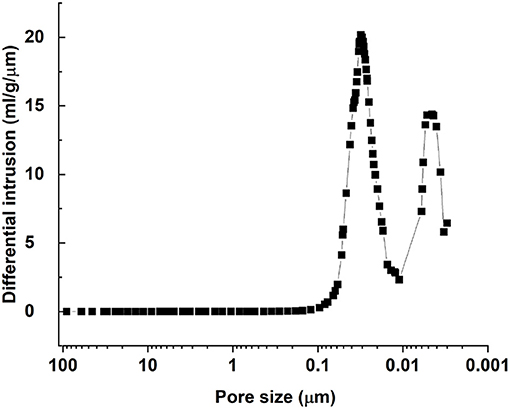
Figure 5. Pore size distribution obtained from mercury intrusion experiments.
CO2 and N2 isotherms on the crushed monolith structure are shown in Figure 6A. Nitrogen adsorption in negligible at 70°C and this is consistent with the findings in literature for amine supported sorbents (Dijkstra et al., 2018; Krishnamurthy et al., 2021b). The CO2 adsorption capacity was 0.38 mol/kg at 70°C and 3.6 mol/m3 (0.1 bar), the typical post-combustion flue gas conditions. In comparison, the fresh paste prior to printing has capacity of 1.9 mol/kg at the same conditions (Figure 6B). The loss in capacity can be due to the printing and drying processes. The loss in CO2 capacity of the 3D printed adsorbent compared to that of the precursor paste is indeed puzzling. In principle, the amount of available amine sorption sites should be similar, so the reason for the different apparent CO2 capacity must be a change in the sorption kinetics caused by the printing process itself, making part of the amine moieties less available for sorption. We have tried to elucidate the main reasons for this by analyzing physical parameters such as macro- and meso- porosity and surface area, but we have still no conclusions on this. Therefore, further work outside the scope of the present contribution is needed to get closer to the origin of the reduction in capacity upon 3D-printing.
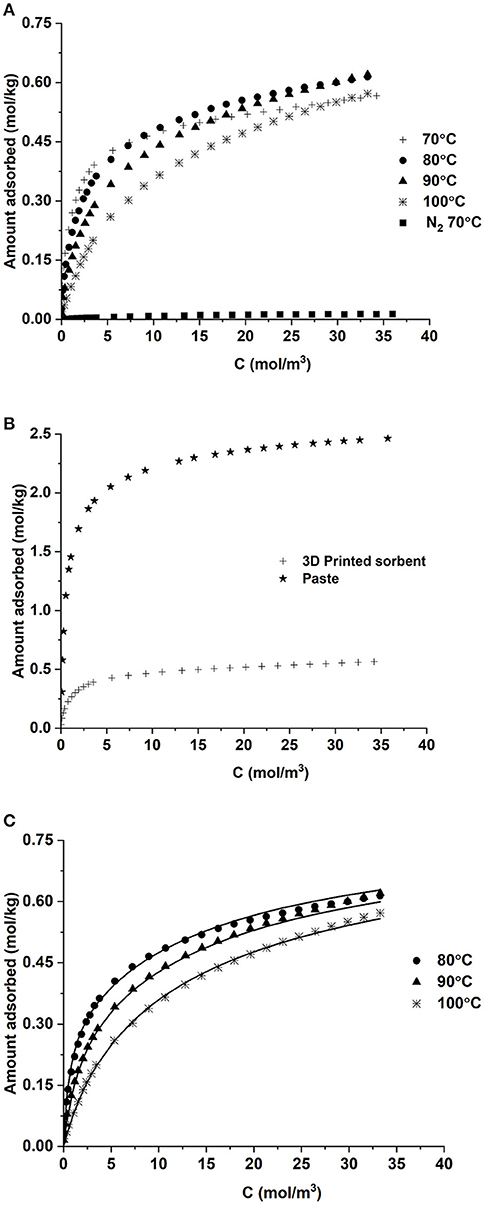
Figure 6. (A) CO2 and N2 isotherms in the 3D printed sorbent, (B) comparison of CO2 isotherms on the printed sorbent and paste and (C) dual-site langmuir isotherm predictions for CO2 adsorption.
The CO2 capacity was almost the same as that of a similar carbon-PEI structure printed for this project (0.37 mol/kg) under same conditions (Krishnamurthy et al., 2021a). The aforementioned sample had a similar composition of MWCNT used in this work but did not contain any PVA. Other 3D printed sorbents containing amines group had a higher capacity (Thakkar et al., 2017a; Sluijter et al., 2021)and this may be due to the differences in the amine groups and substrate combinations which influences the adsorption of CO2 significantly (Gelles et al., 2020).
One can also observe that the CO2 adsorption capacity at 70°C is smaller than 80 and 90°C at concentrations >10 mol/m3 (pressure is 0.2 bar or greater). At 70°C, the CO2 adsorption capacity increases with an increase in CO2 pressure/ concentration and a plateau is achieved as the pressure increases. This is possibly due to the kinetic limitations and as the temperature increases 80 or 90°C, the adsorption kinetics becomes faster, thereby improving the adsorption capacity (Ebner et al., 2011). As the temperature increases to 100°C, the physisorption mechanism possibly becomes more dominant and one may see a decrease in capacity with increase in temperature (Su et al., 2009). This behavior of a lower capacity at a lower temperature is widely observed for sorbents containing such nitrogen groups (Thakkar et al., 2017a; Dhoke et al., 2020).
The adsorption isotherms were fitted to a dual site Langmuir model of the form given by equation
TREF was the average temperature of the measurement which was 360 K. The fitting was carried out in Origin 2021 software by minimizing the sum of squares between the experimental data and model predictions. The resultant isotherm parameters are provided in Table 2. A good agreement between the model and the experimental data can be seen from Figure 6C. The heat of adsorption calculated from the isotherm parameters was around-−100 kJ/mol, which is typical for sorbents containing amine groups (Sutanto et al., 2017; Gelles et al., 2020). The values of qs reported in mol/m3 are obtained by multiplying the values of saturation capacities in mol/kg by the density. For the process simulations, the saturation capacities are used in mol/m3 units.
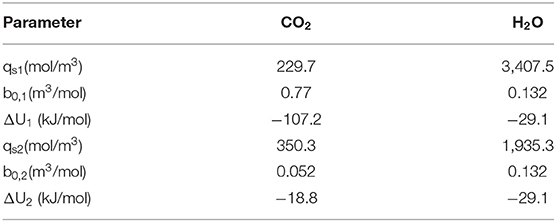
Table 2. CO2 and H2O adsorption isotherm parameters in the 3D printed sorbent.
A metric which is widely discussed in literature when talking about CO2 isotherms is the working capacity. It is defined as the difference in the amount between the adsorption and desorption pressures. For a 15% CO2 stream at 1 atmosphere, the adsorption and desorption pressures are 0.15 bar and 0.1 bar, respectively. Therefore, the working capacity in this case is the difference in capacity at these two pressures. The values at 70°C and 90°C are 0.031 and 0.064 mol/kg, respectively. The higher working capacity at 90°C is a consequence of the fact that the isotherm at this temperature is less step in comparison with 70°C.
Figure 7 shows the comparison between the experimental and simulated breakthrough curves. The experimental breakthrough curves were obtained from the normalized mass spectrometer signal i.e., the signal was normalized between 0 and 1 using the maximum values and the baseline value defined by the following equation
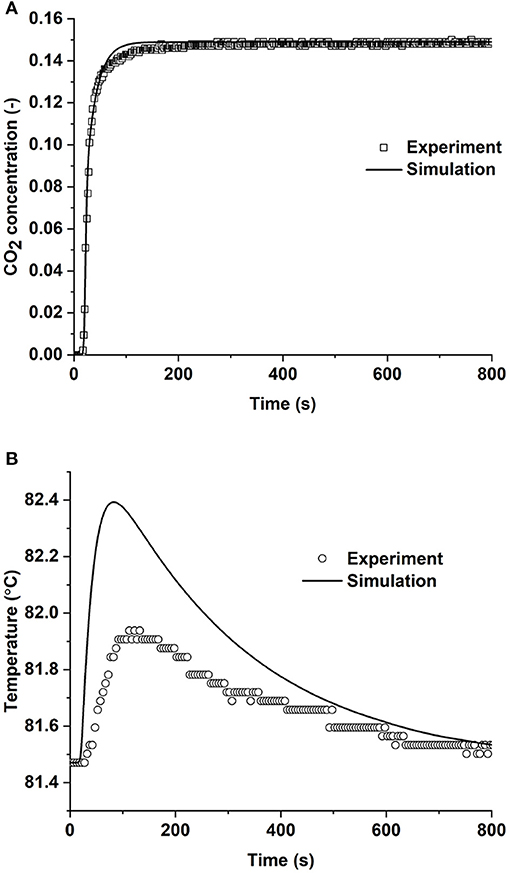
Figure 7. (A) Concentration and (B) temperature breakthrough curves for 15% CO2-85% N2 feed.
Here σ is the mass spectrometer signal and subscripts min and max correspond to the maximum and minimum values of the signal. The maximum values were 1.0 × 10⁻⁷ and 1.5 × 10⁻⁷ for 10 and 15% CO2 mixtures and the minimum value was about 4 × 10⁻¹¹. The flow controllers were calibrated prior to the experiments, and this gave us reliable values for the CO2 concentrations in the feed. It should be noted that the breakthrough experiments were carried out with a second 3D printed sorbent that was not crushed unlike the sorbent used for the volumetric experiments.
The adsorption capacity was obtained by performing a mass balance around the desorption curve (for the packed and the empty column, shown in Equation 10). Here c/C0 is the normalized concentration from 1 to 10−4. F and CT are the flow rate of the carrier in the desorption and the total feed concentration, while y0 is the mol fraction of CO2. The adsorption capacity values are summarized in Table 3 and a comparison is also made with the volumetric experiments under similar conditions. In general, one can see a good agreement between the adsorption capacity values obtained from the breakthrough and volumetric experiments. The similarity in capacity shows good uniformity in printing between different structures and eliminated any uncertainty caused in the volumetric experiments due to the crushing of the structures. The breakthrough experiments were also reproducible as shown from the overlap of the desorption curves in Supplementary Figure 2 of the supporting information.
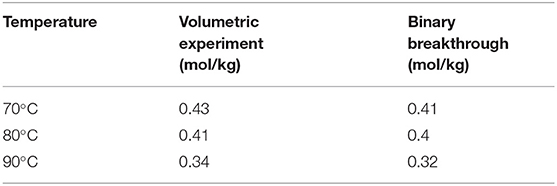
Table 3. Comparison of CO2 adsorption capacities at 0.15 bar (5 mol/m3) obtained from volumetric experiments and breakthrough experiments.
For accurate estimation of the capacity, the desorption must be complete, i.e., the mass spectrometer signal should reach the base line value of 10−4. Further, the completion of the desorption process was also verified by tracking the mass spectrometer signal during the regeneration step. No spikes in the CO2 signals were observed while heating the sample at 100°C, suggesting that complete desorption was possible with nitrogen purge for about 3 h.
The breakthrough experiments were also used to study the adsorption kinetics. For this, the experiments were modeled using a 1D non-isothermal and non-isobaric model given in the supporting information (Equations 11–17 and boundary conditions in Table 2). The residual between the experimental data and the simulation was minimized by fitting the linear driving force coefficient and the heat transfer coefficient values and the residual function obj is defined as follows:
Subscripts sim and exp correspond to the simulated and experimental data, y and T are the mol fraction and temperature values. The experimental temperature is the corrected thermocouple response based on equation 25 of the supporting information. Table 3 of the supplementary material shows the physical properties of the thermocouple. The analysis was carried out for 4 different temperatures viz., 70, 80, 90, and 100°C in order to obtain meaningful set of parameters. For the analysis, we have used MATLAB's genetic algorithm function. The comparison of the experimental and simulated breakthrough curves is shown in Figure 7. With 3 fitting parameters, the 1D model was able to predict the experimental breakthrough curves reasonably. Minor differences were observed in concentration breakthrough curve as the breakthrough approaches the feed concentration (between 100 and 200 s) and the peak of the temperature breakthrough. These could be attributed to an under estimation/over estimation of the heat transfer parameters by the fitting exercise. Nevertheless, one can say that there is a reasonable agreement between the model predictions and the experimental data, and one can use the 1D model for a 3D printed sorbent.
It has been shown earlier in literature that simple metrics such as CO2 capacity, working capacity and selectivity do not reflect the performance of an adsorbent in a cyclic adsorption process (Khurana and Farooq, 2016a; Rajagopalan et al., 2016). The suitability of an adsorbent for a particular emission source is dependent on process metrics such as CO2 purity, CO2 recovery, energy consumption, and productivity. The US department of energy (DOE) stipulates that the CO2 capture process should achieve 95% purity and 90% recovery (DOE-NETL, 2013). Further, the energy consumption must be lower than existing solvent-based technologies. This information can only be obtained through rigorous process simulation and optimization with the right equilibrium and kinetic parameters. Therefore, a 6-step VSA cycle (Figure 4) was rigorously optimized to identify maximum productivity and minimum energy conditions for the DOE stipulated purity and recovery targets. The 6-step VSA cycle uses a rinse step which could enable high CO2 purities and the high purity CO2 product can be obtained by evacuating the column to reasonable vacuum pressures of >0.1 bar. This is advantageous when compared with other 4-step cycles reported in literature where the cycle needs a minimum of 0.03 bar to recover the CO2 (Khurana and Farooq, 2016b).
For simulating the 6-step VSA cycle, the model that was validated using the breakthrough experiments was used with appropriate boundary conditions for the different steps (Supplementary Information Table 2). The input parameters included the isotherm data, kinetic parameters the adsorbent properties such as porosity, density, specific heat etc. and the column dimensions. These are summarized in Table 4. As mentioned earlier, MATLAB was used to simulate the cyclic adsorption process. Therefore, the VSA cycle simulator was coupled with MATLAB's inbuilt genetic algorithm function gamultiobj to perform process optimization. Flue gas from a biomass fed power plant typically contains about 10–15% CO2 (Dell'antonia et al., 2012; Ali et al., 2017). Therefore, the optimization was carried out for two different gas compositions 10 and 15% CO2 in N2. In total 4,200 simulations were performed by the optimizer for each case. This corresponded to 30 generations and 140 population per generation. The total optimization time was around 50 h of CPU time for 4,200 simulations.
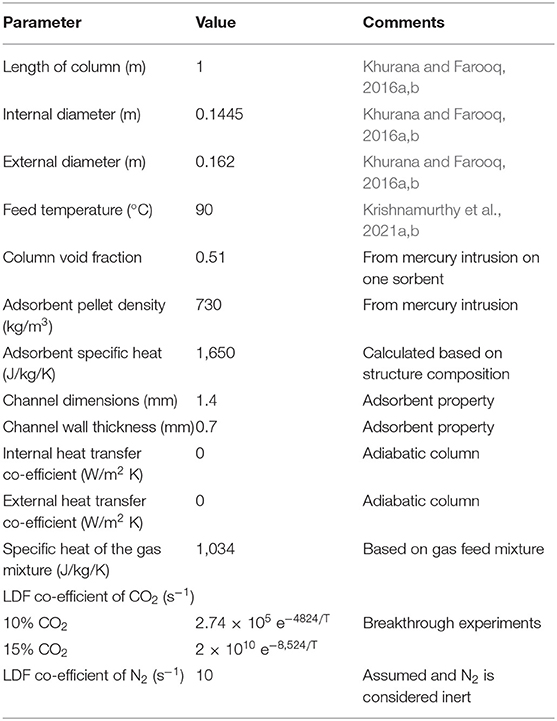
Table 4. Input parameters for the process simulation.
Figure 8 shows the specific energy vs. productivity Pareto plots for 10 and 15% CO2 in the feed. All the points satisfy 95% purity and 90% recovery targets, thereby demonstrating the suitability of this adsorbent for capturing CO2 from a biomass fired power plant. The minimum specific energy for capturing CO2 from a 10% feed is 0.94 MJ/kg of CO2 captured and the maximum productivity is 0.8 moles of CO2 captured/m3 ads s. For the 15% CO2 feed, these numbers were 0.6 MJ/kg of CO2 captured and is 2.2 moles of CO2 captured/m3 ads s. The specific energy reported in this work is on an electricity basis.
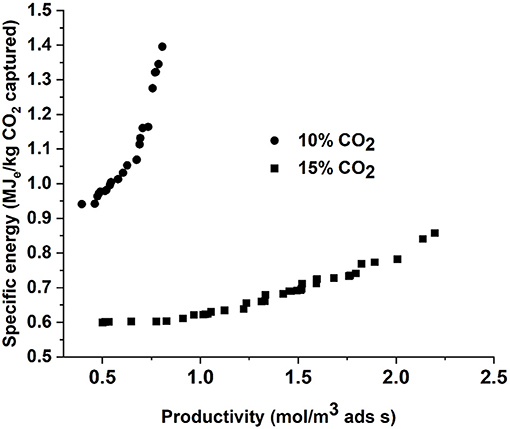
Figure 8. Specific energy vs. Productivity Pareto fronts for 10 and 15% CO2 feed.
To explain the differences in performance we plot some of the two objectives i.e., productivity and specific energy against some of the key decision variables in Figure 9. The productivity is directly proportional to the amount of CO2 fed/recovered and is inversely proportional to the cycle time and the volume of the adsorbent. With a fixed volume of sorbent, high productivities are achieved with fast cycling. In case of the 6-step cycle, the feed enters the column in the adsorption step. The adsorption step time in case of 10% CO2 was 25–49 s whereas it was around 12–43 s in case of 15% CO2. In a real scenario, the velocity of the concentration front inside column is a function of the fluid velocity and is also inversely proportional to the slope of the isotherm (Ruthven, 1984). The slope of the CO2 isotherm is higher at 10% than at 15% CO2. This means that the concentration wave travels slower through the column at the lower concentrations. This, therefore, means that the adsorption step can be operated longer before the CO2 front can breakthrough from the column in the case of a feed containing less CO2. The longer adsorption step led to increased cycle times and the values chosen by the optimizer for the 10 and 15% CO2 feed were 62–112 s and 31–117 s, respectively. Moreover, the optimizer also chose higher velocity values for the 15% feed (0.28–0.62 vs. 0.28–1.2 m/s) as seen from Figure 9B. The combination of a higher velocity and shorter cycle durations improved the productivity when the process operates with a 15% CO2 feed.
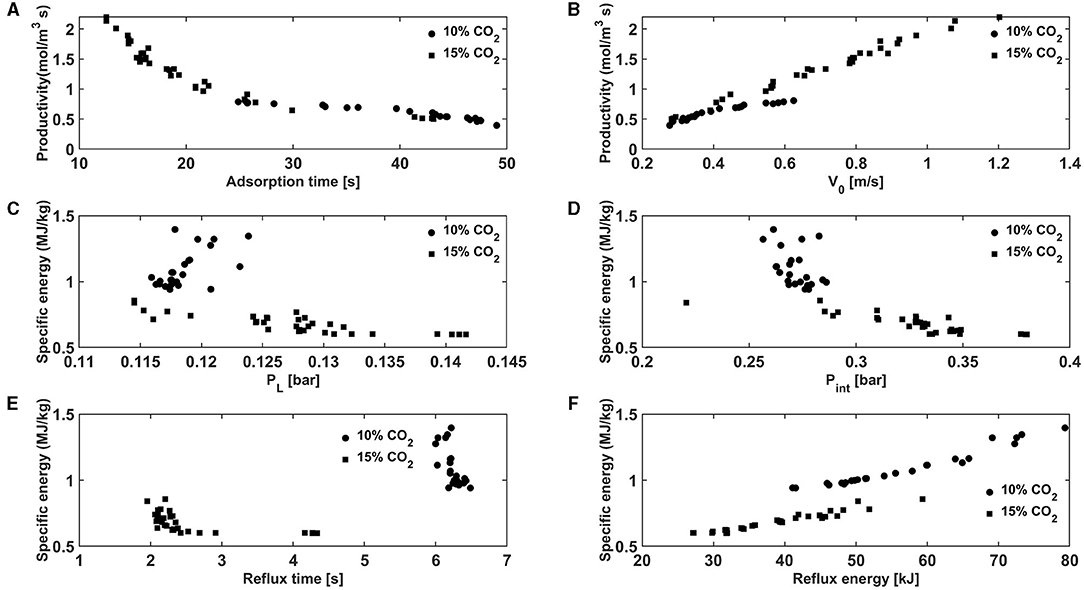
Figure 9. Productivity vs. (A) adsorption time and (B) interstitial feed velocity and specific energy vs. (C) counter-current evacuation pressure, (D) co-current evacuation pressure, (E) reflux step duration and (F) reflux step energy consumption.
The bulk of the energy consumption in the 6-step VSA process comes from the vacuum pumps used for the evacuation and the light reflux steps. In this optimization, the optimizer chose higher evacuation pressures for the 15% CO2 feed than for a 10% CO2 feed in both the co-current and counter-current evacuation steps. With respect to the co-current evacuation step, the optimizer chose evacuation pressures of 0.22–0.28 bar for 10% CO2 vs. 0.28–0.38 bar for the 15% CO2 case. The purpose of the co-current evacuation step is to enhance the purity of the CO2 by removing the nitrogen remaining in the column. Higher the nitrogen amount in the feed, deeper is the vacuum needed to remove it in the co-current evacuation step. Further, the optimizer also chose higher feed velocities which would help in removing most of the nitrogen in the adsorption and rinse steps and therefore, deeper vacuum was not needed at the higher CO2 feed concentration. As mentioned earlier, the CO2 isotherm is steeper at 0.1 bar (10% CO2) than at 0.15 bar (15% CO2). This, therefore meant that the counter-current evacuation pressure is operated at coarser vacuum in case of 15% CO2 feed than 10% CO2 feed (0.115–0.124 bar for 10% vs. 0.115–0.142 bar for 15%). The energy consumed by the vacuum pump is inversely proportional to the vacuum pressure as shown in Supplementary Equation 23 in the supporting information. This meant that the cycle operating at coarser vacuum consumed less energy in the co-current and counter-current vacuum steps. Additionally, the reflux step durations and the energy cosumption in the light reflux step are lower for the 15% CO2 feed as seen from Figures 9E,F. These factors contributed to the lower energy for the 15% CO2 feed. The performance of this 3D printed sorbent is compared with a similar 3D printed sorbent from a previous study for a 15% CO2 feed (Krishnamurthy et al., 2021a). The minimum specific energy and maximum productivity values in that work was about 0.67 MJ/kg which is very similar to that of the present study. However, the 6-step VSA cycle exhibited a lower maximum productivity of 0.9 mol/m3 ads s. This is due the fact that the optimizer chose a value for the velocities to be 0.3–0.7 m/s, as opposed to values of 0.3–1.2 m/s in the present work. Moreover, the cycle times were longer in the previous study (71–126 vs. 40–117 s). This is a result of fast kinetics, i.e., the LDF coefficient was higher (1.15 vs. 0.18 s−1) in sorbent used for the present study, even though the adsorption capacities are similar in both the sorbents. This comparison highlights the importance of the adsorption kinetics in determining the productivity of the VSA process.
In the process simulations we have not considered the presence of water vapor in the flue gas. To understand the effect of water vapor breakthrough experiments with 15% CO2, 7% H2O, and rest N2 were carried out at 70°C. The breakthrough experiments were complemented by volumetric experiments on the crushed sample. Figure 10 shows the isotherms of H2O at three different temperatures measured up to 1.4 mol/m3 (4.2 kPa, due to limitations of the set up). Water is strongly adsorbed in comparison with CO2 with about 4.5 times higher capacity around 4 kPa. This could explain the lower capacity in the breakthrough experiments shown in Figure 10B as water may compete with the CO2 adsorption. Further work is ongoing to better understand the water adsorption in these sorbents. Based on preliminary findings on the H2O co-adsorption, one may need a pre-drying step to remove the moisture before the flue gas enters the adsorption column.
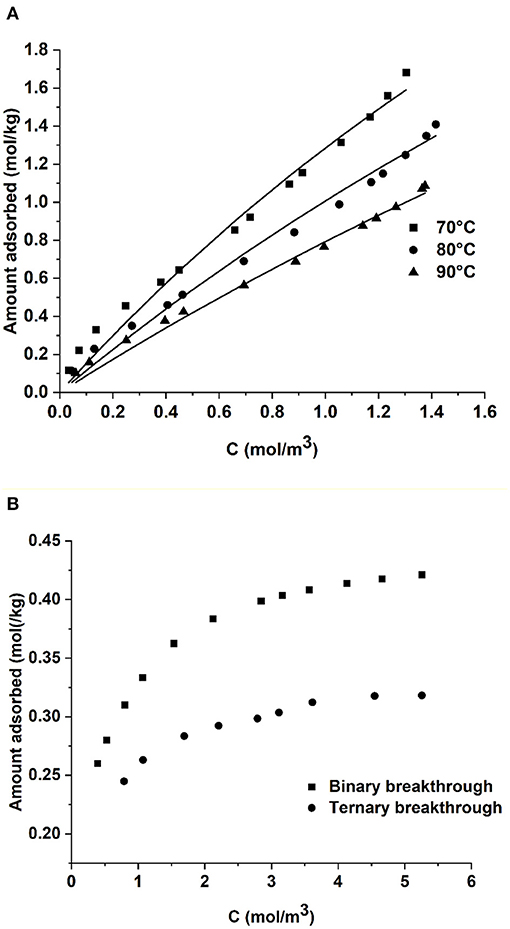
Figure 10. (A) H2O adsorption isotherms in the 3D printed sorbent and (B) adsorption isotherms of CO2 under binary and ternary conditions. The ternary breakthrough experiments were carried out with 15% CO2, 7% H2O in N2. Lines in (A) correspond to dual-site Langmuir fit.
In this work a 3D printed polyethylene imine and multiwalled carbon nanotube containing sorbent was studied in the context of post-combustion carbon capture from a biomass fired power plant flue gas containing 10 and 15% CO2. Isotherm measurements showed that 3D printing of the water-based paste resulted in a loss in capacity in comparison with the actual paste. Next, column breakthrough experiments were performed and analyzed using a 1D adsorption process model to obtain the adsorption kinetic constants. With the results from the experiments, a 6-step VSA process was optimized to obtain minimum energy and maximum productivity values for capturing 90% of the CO2 and concentrating the CO2 to 95%. The 6-step VSA process performed better with a 15% CO2 feed and the minimum energy and maximum productivity values in this case were 0.6 MJ of electricity /kg CO2 captured and 2.2 mol/m3 ads s. On a thermal basis, this value is closer to new absorbents (Campbell, 2014; Singh and Stéphenne, 2014). However, the study does not consider the presence of oxygen or water in the flue gas, which could have a detrimental effect on the performance of the VSA cycle. The aim of this work is solely to study the performance of a 3D printed adsorbent in a 6-step VSA cycle and therefore, we have not performed a cycle synthesis to map the adsorbent's best cycle configuration, which could potentially be a further study. Currently our effort is also focussed on improving the paste formulation and the printing process for obtaining a structure with a better CO2 capacity and fast kinetics.
The datasets used and analyzed during the current study will be made available by the corresponding author upon reasonable request.
Preparation of the paste was carried out by AB. 3D printing was done at VITO by VM and MR. RB performed the BET measurements and the isotherm measurements. KAA performed the breakthrough experiments. SK performed the analysis of the results and the process optimization. All authors contributed equally toward the manuscript preparation.
This work has received funding from the European Union's Horizon 2020 research and innovation programme under grant agreement No. 760884 (CARMOF). The preparation of the manuscript has been supported by SINTEFs publication project 102005015-78.
The authors declare that the research was conducted in the absence of any commercial or financial relationships that could be construed as a potential conflict of interest.
All claims expressed in this article are solely those of the authors and do not necessarily represent those of their affiliated organizations, or those of the publisher, the editors and the reviewers. Any product that may be evaluated in this article, or claim that may be made by its manufacturer, is not guaranteed or endorsed by the publisher.
The authors would like to thank the editor of the special issue Anna Skorek-Osikowska for the invitation. We would like to acknowledge our colleague Dr Carlos Adolfo Grande for the useful discussions. Jannicke Kvello of SINTEF Industry is acknowledged for the mercury intrusion experiments. We would also like to thank the reviewers for their valuable comments. The authors would like to thank VITO-SuMAT staff, in particular Jo Verwimp and Dirk Vanhoyweghen, for their technical support and assistance with laboratory work.
The Supplementary Material for this article can be found online at: https://www.frontiersin.org/articles/10.3389/fclim.2021.733499/full#supplementary-material
Ali, U., Font-Palma, C., Akram, M., Agbonghae, E. O., Ingham, D. B., and Pourkashanian, M. (2017). Comparative potential of natural gas, coal and biomass fired power plant with post - combustion CO2 capture and compression. Int. J. Greenh. Gas Con. 63, 184–193. doi: 10.1016/j.ijggc.2017.05.022
Bijarchiyan, M., Sahebi, H., and Mirzamohammadi, S. (2020). A sustainable biomass network design model for bioenergy production by anaerobic digestion technology: using agricultural residues and livestock manure. Energy Sustain. Soc. 10:19. doi: 10.1186/s13705-020-00252-7
Campbell, M. (2014). Technology innovation & advancements for shell cansolv CO2 capture solvents. Energy Proced. 63, 801–807. doi: 10.1016/j.egypro.2014.11.090
Couck, S., Cousin-Saint-Remi, J., Van Der Perre, S., Baron, G. V., Minas, C., Ruch, P., et al. (2018). 3D-printed SAPO-34 monoliths for gas separation. Micropor. Mesopor. Mater. 255, 185–191. doi: 10.1016/j.micromeso.2017.07.014
Couck, S., Lefevere, J., Mullens, S., Protasova, L., Meynen, V., Desmet, G., et al. (2017). CO2, CH4 and N2 separation with a 3DFD-printed ZSM-5 monolith. ChemEng J. 308, 719–726. doi: 10.1016/j.cej.2016.09.046
Dell'antonia, D., Gubiani, R., Maroncelli, D., and Pergher, G. (2012). Gaseous emissions from fossil fuels and biomass combustion in small heating appliances. J. Agr. Eng. 41, 37–46. doi: 10.4081/jae.2010.46
Dhoke, C., Cloete, S., Krishnamurthy, S., Seo, H., Luz, I., Soukri, M., et al. (2020). Sorbents screening for post-combustion CO2 capture via combined temperature and pressure swing adsorption. ChemEng. J. 380:122201. doi: 10.1016/j.cej.2019.122201
Dijkstra, J. W., Walspurger, S., Elzinga, G. D., Pieterse, J. A. Z., Boon, J., and Haije, W. G. (2018). Evaluation of postcombustion CO2 capture by a solid sorbent with process modeling using experimental CO2 and H2O adsorption characteristics. Ind. Eng. Chem. Res. 57, 1245–1261. doi: 10.1021/acs.iecr.7b03552
DOE-NETL (2013). Guidelines for Energy System Studies: CO2 Impurity Design Parameters: Quality Guidelines for Energy System Studies. DOE-NETL.
Ebner, A. D., Gray, M. L., Chisholm, N. G., Black, Q. T., Mumford, D. D., Nicholson, M. A., et al. (2011). Suitability of a solid amine sorbent for CO2 capture by pressure swing adsorption. Ind. Eng. Chem. Res. 50, 5634–5641. doi: 10.1021/ie2000709
Fogarasi, S., and Cormos, C.-C. (2017). Assessment of coal and sawdust co-firing power generation under oxy-combustion conditions with carbon capture and storage. J. Clean. Prod. 142, 3527–3535. doi: 10.1016/j.jclepro.2016.10.115
Freitas, B., Nunes, W. G., Soares, D. M., Rufino, F. C., Moreira, C. M., Da Silva, L. M., et al. (2021). Robust, flexible, freestanding and high surface area activated carbon and multi-walled carbon nanotubes composite material with outstanding electrode properties for aqueous-based supercapacitors. Mater. Adv. 2, 4264–4276. doi: 10.1039/D0MA00783H
Gelles, T., Lawson, S., Rownaghi, A. A., and Rezaei, F. (2020). Recent advances in development of amine functionalized adsorbents for CO2 capture. Adsorption 26, 5–50. doi: 10.1007/s10450-019-00151-0
Grande, C. A., Blom, R., Middelkoop, V., Matras, D., Vamvakeros, A., Jacques, S. D. M., et al. (2020). Multiscale investigation of adsorption properties of novel 3D printed UTSA-16 structures. Chem. Eng. J. 402:126166. doi: 10.1016/j.cej.2020.126166
Haghpanah, R., Nilam, R., Rajendran, A., Farooq, S., and Karimi, I. A. (2013). Cycle synthesis and optimization of a VSA process for postcombustion CO2 capture. AIChE J. 59, 4735–4748. doi: 10.1002/aic.14192
IEAGHG (2018). The Carbon Capture Project at Air Products' Port Arthur Hydrogen Production Facility. Cheltenham: IEAGHG.
IPCC (2018). IPCC, 2018: Global Warming of 1.5°C. An IPCC Special Report on the Impacts of Global Warming of 1.5°C Above Pre-Industrial Levels and related Global Greenhouse Gas Emission Pathways, in the Context of Strengthening the Global Response to the Threat of Climate Change, Sustainable Development, and Efforts to Eradicate Poverty. V. Masson-Delmotte, P. Zhai, H.-O. Pörtner, D. Roberts, J. Skea, P. R. Shukla, A. Pirani, W. Moufouma-Okia, C. Péan, R. Pidcock, S. Connors, J. B. R. Matthews, Y. Chen, X. Zhou, M. I. Gomis, E. Lonnoy, T. Maycock, M. Tignor, and T. Waterfield. Geneva: IPCC.
Khurana, M., and Farooq, S. (2016a). Adsorbent screening for postcombustion CO2 capture: a method relating equilibrium isotherm characteristics to an optimum vacuum swing adsorption process performance. Ind. Eng. Chem. Res. 55, 2447–2460. doi: 10.1021/acs.iecr.5b04531
Khurana, M., and Farooq, S. (2016b). Simulation and optimization of a 6-step dual-reflux VSA cycle for post-combustion CO2 capture. Chem. Eng. Sci. 152, 507–515. doi: 10.1016/j.ces.2016.06.033
Krishnamurthy, S., Blom, R., Andreassen, K. A., Grande, C., Vesna, M., Rombouts, M., et al. (2021a). “CO2 capture with structured sorbents containing Multiwalled carbon nano tubes and polyethyleneimine (PEI),” in TCCS-11–Trondheim Conference on CO2 Capture, Transport and Storage, June 21-23, 2021 (Trondheim).
Krishnamurthy, S., Lind, A., Bouzga, A., Pierchala, J., and Blom, R. (2021b). Post combustion carbon capture with supported amine sorbents: from adsorbent characterization to process simulation and optimization. Chem. Eng. J. 406, 127121. doi: 10.1016/j.cej.2020.127121
Krishnamurthy, S., Rao, V. R., Guntuka, S., Sharratt, P., Haghpanah, R., Rajendran, A., et al. (2014). CO2 capture from dry flue gas by vacuum swing adsorption: a pilot plant study. AIChE J. 60, 1830–1842. doi: 10.1002/aic.14435
Lawson, S., Li, X., Thakkar, H., Rownaghi, A. A., and Rezaei, F. (2021). Recent advances in 3D printing of structured materials for adsorption and catalysis applications. Chem. Rev. 121, 6246–6291. doi: 10.1021/acs.chemrev.1c00060
Lefevere, J., Claessens, B., Mullens, S., Baron, G., Cousin-Saint-Remi, J., and Denayer, J. F. M. (2019). 3D-Printed zeolitic imidazolate framework structures for adsorptive separations. ACS Appl. Nano Mater. 2, 4991–4999. doi: 10.1021/acsanm.9b00934
Lisbona, P., Pascual, S., and Pérez, V. (2021). Evaluation of synergies of a biomass power plant and a biogas station with a carbon capture system. Energies 14:908. doi: 10.3390/en14040908
Mcilveen-Wright, D. R., Huang, Y., Rezvani, S., Redpath, D., Anderson, M., Dave, A., et al. (2013). A technical and economic analysis of three large scale biomass combustion plants in the UK. Appl. Energy 112, 396–404. doi: 10.1016/j.apenergy.2012.12.051
Middelkoop, V., Coenen, K., Schalck, J., Van Sint Annaland, M., and Gallucci, F. (2019). 3D printed versus spherical adsorbents for gas sweetening. Chem. Eng. J. 357, 309–319. doi: 10.1016/j.cej.2018.09.130
Mohamed, U., Zhao, Y.-J., Yi, Q., Shi, L.-J., Wei, G.-Q., and Nimmo, W. (2021). Evaluation of life cycle energy, economy and CO2 emissions for biomass chemical looping gasification to power generation. Renew. Energy176, 366–387. doi: 10.1016/j.renene.2021.05.067
Mohammadi, N. (2017). CO2 Capture From Flue Gas by a PSA Process Using a Novel Structured Adsorbent. PhD Thesis, University of South Carolina, Columbia, South Carolina.
Pan, P., Zhang, M., Xu, G., Chen, H., Song, X., and Liu, T. (2020). Thermodynamic and economic analyses of a new waste-to-energy system incorporated with a biomass-fired power plant. Energies 13:4345. doi: 10.3390/en13174345
Rajagopalan, A. K., Avila, A. M., and Rajendran, A. (2016). Do adsorbent screening metrics predict process performance? A process optimisation based study for post-combustion capture of CO2. Int. J. Greenh. Gas Con. 46, 76–85. doi: 10.1016/j.ijggc.2015.12.033
Regufe, M. J., Ferreira, A. F. P., Loureiro, J. M., Rodrigues, A., and Ribeiro, A. M. (2019). Electrical conductive 3D-printed monolith adsorbent for CO2 capture. Micropor. Mesopor. Mater. 278, 403–413. doi: 10.1016/j.micromeso.2019.01.009
Rezaei, F., Mosca, A., Webley, P., Hedlund, J., and Xiao, P. (2010). Comparison of traditional and structured adsorbents for CO2 separation by vacuum-swing adsorption. Ind. Eng. Chem. Res. 49, 4832–4841. doi: 10.1021/ie9016545
Ruthven, D. M. (1984). Principles of Adsorption and Adsorption Processes. New York, NY: John Wiley & Sons.
Ruthven, D. M., and Thaeron, C. (1997). Performance of a parallel passage adsorbent contactor. Sep. Purif. Technol. 12, 43–60. doi: 10.1016/S1383-5866(97)00016-6
Sharma, I., Friedrich, D., Golden, T., and Brandani, S. (2020). Monolithic adsorbent-based rapid-cycle vacuum pressure swing adsorption process for carbon capture from small-scale steam methane reforming. Ind. Eng. Chem. Res. 59, 7109–7120. doi: 10.1021/acs.iecr.9b05337
Singh, A., and Stéphenne, K. (2014). Shell cansolv CO2 capture technology: achievement from first commercial plant. Energy Proced. 63, 1678–1685. doi: 10.1016/j.egypro.2014.11.177
Sluijter, S., Boon, J., James, J., Krishnamurthy, S., Lind, A., Andreassen, K. A., et al. (2021). “3D-Printing of adsorbents for increased productivity in carbon capture applications (3D-CAPS),” in: 15th International Conference on Greenhouse Gas Control Technologies, GHGT-15 15th-18th March 2021, Abu Dhabi: IEAGHG. doi: 10.2139/ssrn.3811591
Steldinger, H., Esposito, A., Brunnengräber, K., Gläsel, J., and Etzold, B. J. M. (2019). Activated carbon in the third dimension−3D printing of a tuned porous carbon. Adv. Sci. 6:1901340. doi: 10.1002/advs.201901340
Su, F., Lu, C., Cnen, W., Bai, H., and Hwang, J. F. (2009). Capture of CO2 from flue gas via multiwalled carbon nanotubes. Sci. Total Environ. 407, 3017–3023. doi: 10.1016/j.scitotenv.2009.01.007
Sutanto, S., Dijkstra, J. W., Pieterse, J. A. Z., Boon, J., Hauwert, P., and Brilman, D. W. F. (2017). CO2 removal from biogas with supported amine sorbents: first technical evaluation based on experimental data. Sep. Purif. Technol. 184, 12–25. doi: 10.1016/j.seppur.2017.04.030
Thakkar, H., Eastman, S., Al-Mamoori, A., Hajari, A., Rownaghi, A. A., and Rezaei, F. (2017a). Formulation of aminosilica adsorbents into 3D-printed monoliths and evaluation of their CO2 capture performance. ACS Appl. Mater. Inter. 9, 7489–7498. doi: 10.1021/acsami.6b16732
Thakkar, H., Eastman, S., Al-Naddaf, Q., Rownaghi, A. A., and Rezaei, F. (2017b). 3D-Printed metal–organic framework monoliths for gas adsorption processes. ACS Appl. Mater. Inter. 9, 35908–35916. doi: 10.1021/acsami.7b11626
Thakkar, H., Eastman, S., Hajari, A., Rownaghi, A. A., Knox, J. C., and Rezaei, F. (2016). 3D-Printed zeolite monoliths for CO2 removal from enclosed environments. ACS Appl. Mater. Inter. 8, 27753–27761. doi: 10.1021/acsami.6b09647
Wang, L., Yang, Y., Shen, W., Kong, X., Li, P., Yu, J., et al. (2013). CO2 capture from flue gas in an existing coal-fired power plant by two successive pilot-scale VPSA units. Ind. Eng. Chem. Res. 52, 7947–7955. doi: 10.1021/ie4009716
Wei, X., Manovic, V., and Hanak, D. P. (2020). Techno-economic assessment of coal- or biomass-fired oxy-combustion power plants with supercritical carbon dioxide cycle. Energy Conv. Manage. 221:113143. doi: 10.1016/j.enconman.2020.113143
Yancy-Caballero, D., Leperi, K. T., Bucior, B. J., Richardson, R. K., Islamoglu, T., Farha, O. K., et al. (2020). Process-level modelling and optimization to evaluate metal–organic frameworks for post-combustion capture of CO2. Mol. Syst. Des. Eng. 5, 1205–1218. doi: 10.1039/D0ME00060D
b0: affinity parameter of the dual-site Langmuir model (m3/mol), subscripts 1 and 2 denote sites 1 and 2.
c: concentration of the feed/gas (mol/m3).
C0: concentration of the gas in the feed (mol/m3).
CT: Total concentration of the feed (mol/m3).
PH: High pressure in the adsorption/rinse step (Pa).
Pint: Intermediate vacuum pressure for the co-current evacuation step (Pa).
PL: Vacuum pressure in the counter-current evacuation step (Pa).
q*: Equilibrium adsorption capacity (mol/kg).
qs: Saturation adsorption capacity (mol/kg), subscripts 1 and 2 denote sites 1 and 2.
T: Temperature (K).
Tref: Reference temperature used in isotherm fitting (K).
y: mol fraction of the adsorbate.
σ: CO2 signal of the mass spectrometer.
Keywords: 3D printing, carbon capture & storage, adsorption isotherms, process optimisation, vacuum swing adsorption
Citation: Krishnamurthy S, Blom R, Andreassen KA, Middelkoop V, Rombouts M and Borras AB (2021) 3D Printed PEI Containing Adsorbents Supported by Carbon Nanostructures for Post-combustion Carbon Capture From Biomass Fired Power Plants. Front. Clim. 3:733499. doi: 10.3389/fclim.2021.733499
Received: 30 June 2021; Accepted: 19 August 2021;
Published: 13 September 2021.
Edited by:
Shareq Mohd Nazir, KTH Royal Institute of Technology, SwedenReviewed by:
Covadonga Pevida, Instituto Nacional del Carbón (INCAR), SpainCopyright © 2021 Krishnamurthy, Blom, Andreassen, Middelkoop, Rombouts and Borras. This is an open-access article distributed under the terms of the Creative Commons Attribution License (CC BY). The use, distribution or reproduction in other forums is permitted, provided the original author(s) and the copyright owner(s) are credited and that the original publication in this journal is cited, in accordance with accepted academic practice. No use, distribution or reproduction is permitted which does not comply with these terms.
*Correspondence: Shreenath Krishnamurthy, U2hyZWVuYXRoLktyaXNobmFtdXJ0aHlAc2ludGVmLm5v orcid.org/0000-0002-9584-6804
Disclaimer: All claims expressed in this article are solely those of the authors and do not necessarily represent those of their affiliated organizations, or those of the publisher, the editors and the reviewers. Any product that may be evaluated in this article or claim that may be made by its manufacturer is not guaranteed or endorsed by the publisher.
Research integrity at Frontiers
Learn more about the work of our research integrity team to safeguard the quality of each article we publish.