 Alessandra Giannini
 Elisabeth Kago Ilboudo Nébié
 Diaba Ba
 Ousmane Ndiaye
- 1Laboratoire de Météorologie Dynamique/IPSL, Ecole Normale Supérieure, PSL Research University, Sorbonne Université, École Polytechnique, IP Paris, CNRS, Paris, France
- 2International Research Institute for Climate and Society, Columbia University, New York, NY, United States
- 3Climate-Resilient Food Systems Program, International Development Research Centre, Ottawa, ON, Canada
- 4School of Human Evolution and Social Change/Center for Global Discovery and Conservation Science, Arizona State University, Tempe, AZ, United States
- 5United Nations World Food Programme, Niamey, Niger
- 6Agence Nationale de l'Aviation Civile et de la Météorologie, Dakar, Senegal
We integrate long-term observations of rainfall and repeat, large-scale, nationwide household surveys of nutrition and socio-economic status to assess the vulnerability of food security to climate in Senegal. We use a mixed methods approach and a vulnerability framework to explain how it is that food security is on average lower, and more variable year-to-year, in the climatologically wetter south and east of the country than in the drier western center and north. We find that it is sensitivity to climate that explains the spatial variation in food security, while exposure explains its temporal variation, but only where sensitivity is high. While households in the western center and north, geographically closer to the political and economic center of action, are less dependent on livelihoods based on climate-sensitive activities, notably agriculture, these activities still dominate in the more remote, landlocked and at times conflict-ridden south and east, where sensitivity to the vagaries of rainfall persists. As they work to strengthen the resilience of climate-sensitive activities, food security and climate-risk management projects and policies should move beyond simplistic, deterministic assumptions about how climate affects food security outcomes, and invest in livelihood diversification to increase rural income and reduce vulnerability of food security to climate.
Introduction
Climate change is a threat multiplier, especially in marginal environments such as the Sahel. Natural scientists who use physical science methods to look at vulnerability mainly as exposure to rainfall variability might overlook non-climatic factors driven by people's agency, such as adaptive capacity shaped by socioeconomic, political and institutional factors (Tschakert, 2007). The extent to which a system is able or unable to cope with the adverse effects of climate change, including variability and extremes, has been framed in terms of “vulnerability” since the 3rd Assessment Report of the Intergovernmental Panel on Climate Change (IPCC TAR; McCarthy et al., 2001). In the synthesis of traditions about entitlement failures and theories of hazard (Adger, 2006), vulnerability is dissected into three dimensions: exposure, sensitivity, and adaptive capacity. Exposure is the extent to which a system faces environmental or social, economic and political stress (i.e., households in areas that receive less rainfall being more exposed to drought and reduced crop yields); sensitivity is the degree to which a system is affected by that same stress (i.e., impact of rainfall and temperature variability on type of livelihood activity households are involved in); and adaptive capacity is the ability of a system to adjust, to rebound from stress: not only climate change (McCarthy et al., 2001; Adger, 2006), but also other environmental and social stresses (Smit and Wandel, 2006). Exposure, sensitivity and adaptive capacity, which determine the degree of vulnerability of food security to environmental change, are shaped by biophysical, socioeconomic, political, cultural and nutritional endowments characterizing individuals, households and regions at different spatial and temporal scales (Downing, 1991; Adger, 2006; Smit and Wandel, 2006). Examples of these endowments or their lack thereof include inadequate individual food consumption, poor household access to nutritious food, regional food shortage, lack of institutional support for agricultural development, difficult access to markets and unequal income distribution. The exposure and sensitivity of certain groups to one or more of the underlying causes of vulnerability, and their adaptive responses, can increase or weaken the impacts of climate change on their food security (Downing, 1991).
Previous studies have demonstrated the need to examine both climate and non-climatic drivers of vulnerability, by integrating natural and social science research methods, to better capture food insecurity patterns (Tschakert, 2007; Piya et al., 2019). But, in West Africa in general, and Senegal in particular, most studies that assessed food insecurity and nutritional status mainly relied on social science methods such as household surveys, interviews, focus groups, food store and nutritional surveys and quantitative measurements (anthropometry) to examine household and community food availability, accessibility and utilization (Babatunde et al., 2007; Benzekri et al., 2015, 2017, 2021; Akpaki et al., 2020). Studies in East and West Africa have found a link between household income and food insecurity (Babatunde et al., 2007; Gebrehiwot and van der Veen, 2014; Masa et al., 2017). In her study conducted in the administrative departments of Thiès and Bambey in the central and center-west regions of Senegal, Tschakert (2007) found that disease which affects labor quality and quantity, lack of money due to insufficient income generating activities options in rural areas, and poor village infrastructure were perceived by vulnerable rural people as the most severe issues. In a comparative study between HIV-infected people living in Dakar, in west-central Senegal, which is the wealthiest region from economic and infrastructural standpoints, and where non-agricultural activities are the main source of income, and Ziguinchor, in the Casamance region in the south, endowed with natural resources, and where agriculture is the main source of income, Benzekri et al. (2017) confirmed economic access (rather than food availability), as measured by income and food expenditure, as the strongest predictor of severe food insecurity. While some of the physical science studies integrate rainfall data with crop production data to examine food insecurity (Armah et al., 2011), others incorporated rainfall recall questions in household surveys rather than using direct, quantitative climatological observations (Zakari et aL., 2014). We seek to fill this gap by integrating household surveys with rainfall maps at three different points in time across different livelihood and climatic zones to provide a more comprehensive understanding of food insecurity which is determined by a diversity of socioeconomic and physical factors.
Using the case of Senegal, we aim to show how the different economic activities of households contribute in shaping their sensitivity and explain the spatial pattern of food security in the country, beyond exposure to climate variability. Senegal counts more than 15 million inhabitants, with 23% living in the region of Dakar, the capital city, which covers only 0.3% of the country's territory of 193.000 km2 (Agence Nationale de la Statistique et de la Démographie, 2020). About 60% of the population is involved in agriculture, but the contribution of the services, industry and tourism sectors to GDP has been steadily increasing. In this study, we seek to answer the following question: why is food insecurity greater in the southern and eastern regions of Senegal, which are endowed with a wetter and less variable climate?
Senegal is a largely semi-arid country facing the Atlantic Ocean at the westernmost edge of the Sahel. Climate is defined by the onset and demise of a single rainy season, associated with the migration of the northern hemisphere summer monsoon, which sweeps the country from south to north in early summer and retreats in late summer, all within a span of 4 months. The rains start earlier and are relatively more abundant in the south. The length of the season and its total accumulation decrease toward the semi-arid north (Figure 1A). In addition, rainfall is more variable in the north than in the south (Figure 1B). Climate change is expected to have a negative impact on the production of staple crops such as sorghum, millet, and maize (Schlenker and Lobell, 2010; Knox et al., 2012; Sultan et al., 2013, 2014) and on livestock production (Baumgard et al., 2012; Rust and Rust, 2013; Rojas-Downing et al., 2017).
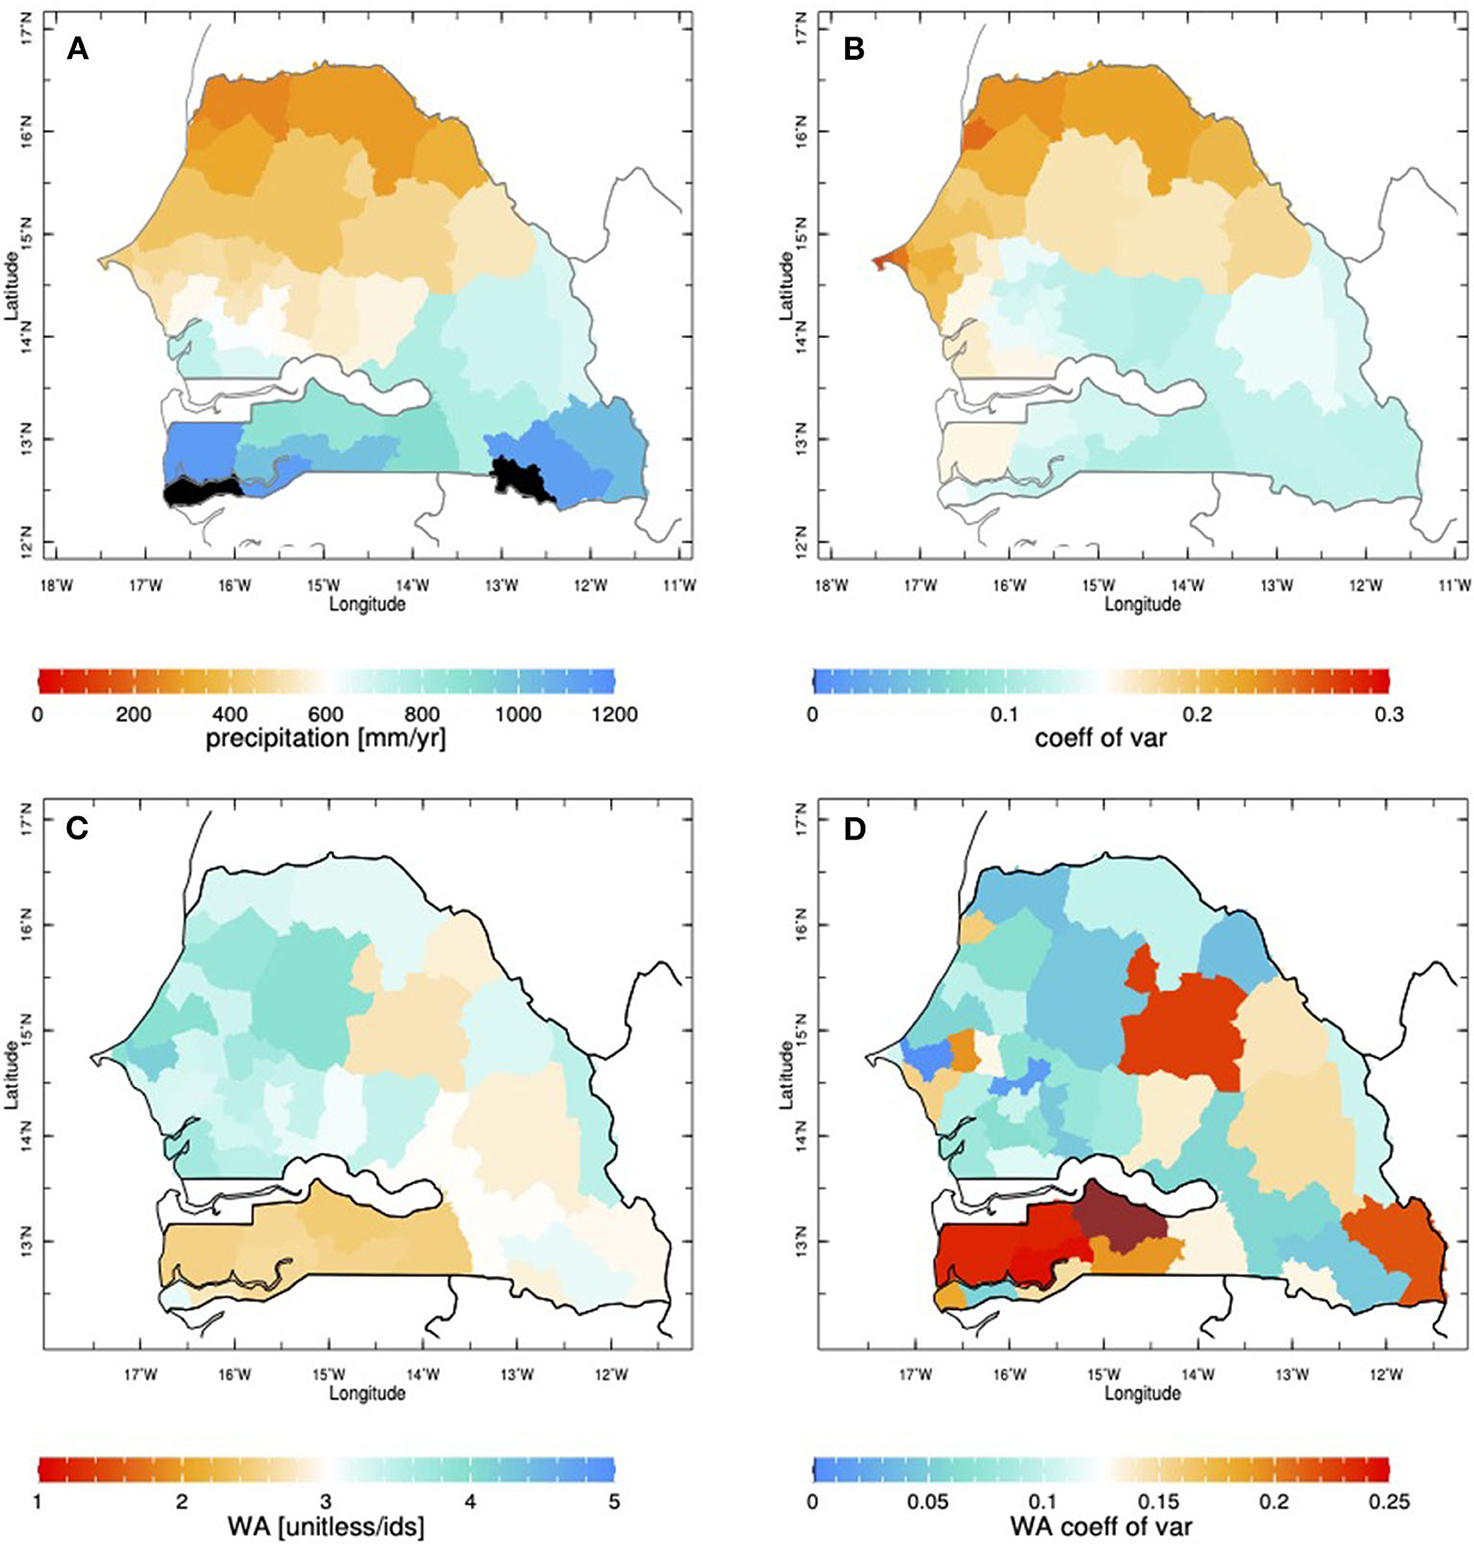
Figure 1. Climatology, or average, and variability, measured by the coefficient of variation, of precipitation and food security status. Precipitation is from CHIRPS, and is taken over the core rainy season months of July to September. Average (A) and coefficient of variation (B) are computed over 2000–2019. Food security status is measured by the weighted average of membership into the 5 clusters originally defined in IN2020, defined in Equation (1). Average (C) and coefficient of variation (D) are computed over the 3 years surveyed–2013, 2014, and 2016—by necessity.
A physical climate perspective that assumes that agricultural practices are well-adapted to local climate, and that food security is largely dependent on local agricultural production, would predict greater food security in the wetter south and east than in the more arid and variable west and north. However, the opposite, to be described in greater detail in section Food Security and Climate, is known to hold (World Food Programme/Vulnerability Analysis and Mapping, 2011; Agence Nationale de l'Aviation Civile et de la Météorologie et al., 2012). In addition, studies predict that temperature increase (warming exceeding 2°C) will have a more significant negative impact on yields in southern Senegal, which is more humid, compared to northern Senegal, which is drier and where crop yields are more sensitive to rainfall variability (Sultan et al., 2013). The apparent disconnect between climatic impact on agricultural production and food security is the motivation of this study, and the reason that we adopt a vulnerability framework (Bohle et al., 1994; Downing et al., 1996; Adger, 2006; Ribot, 2010). If exposure to climate, that is, the biophysical processes by which climate impacts agricultural production, does not explain the spatial pattern of food security in Senegal, does sensitivity of livelihoods to climate, that is, differentiation among the economic activities that sustain households, do?
There are marked dissimilarities among households in their sensitivity and adaptive capacity because of different poverty levels and access to resources (Thornton et al., 2006). Entitlement theory (Sen, 1981) highlights social differentiation due to structural institutional inequalities (class, social status, gender) as the drivers of vulnerability and unequal access to income and food. Socio-economic disparities among households lead to differentiated access to food. Income diversification is associated with higher income and higher food consumption (Reardon et al., 1992). Most rural households in Senegal rely on a minimum of two activities as a source of income while most urban households depend mostly on one (43%) or two (40%) livelihood activities (Agence Nationale de l'Aviation Civile et de la Météorologie et al., 2012). Generally, poorer households, where the head has low educational level and are located in remote areas, have fewer opportunities to engage in non-farm activities and diversify their income (Abdulai and Crole-Rees, 2001). Barrett et al. (2001) define “push” factors as strong incentives for diversification based on risk reduction (e.g., frequent droughts) and “pull” factors as market incentives. In southern Senegal, diversifying income away from agriculture has been a strategy for internally displaced people who are facing extreme poverty and the longstanding Casamance conflict that prevent them from accessing land in destination areas (Evans, 2005, 2007). In contrast, across western and central Senegal diversification occurred in response to the droughts of the 1970s and 1980s (Tacoli, 2011; Hathie and Ba, 2015).
In Ilboudo Nébié et al. (2021; hereafter IN2021), we analyzed data collected by the UN World Food Programme (WFP) and its in-country partners in three large-scale surveys conducted over the past decade. These surveys sample the nutritional and socio-economic status of thousands of households at a time, as well as their exposure to shocks. We defined food security based on cluster analysis applied to three variables:
- Food Consumption Score (FCS) is a combined measure of food frequency and diet diversity over 7 days. It is computed as the weighted sum of food (group) frequency in household consumption
- Food Expenditure Share (FES) is the relative importance of cash expenditure on food compared to total household expenditure. It is computed as the ratio of food expenses to total household expenses over the past 30 days *100
- Reduced Coping Strategies Index (RCSI) is a measure of all coping strategies enacted by the household. It is computed as the weighted sum of frequencies of individual coping strategy scores.
The cluster analysis in IN2021 identified 5 classes or categories that span variation in food consumption and access. The least food secure cluster is characterized by a barely acceptable food consumption score, high expenditure on food and frequent recourse to coping strategies. The most food secure cluster is characterized by relatively high food consumption score, low expenditure on food and minimal recourse to coping strategies. The most prevalent middle cluster, representative of the “average rural household,” is characterized by a food consumption score similar to that of the two less food secure clusters, but minimal recourse to coping strategies similar to the two more food secure clusters.
When we mapped cluster membership of rural households (bottom row of Figure 2 in IN2021), we found that the two more food secure clusters, those with relatively high food consumption score, are more prevalent in the more arid and variable climate of the western center and north, that is, not in regions with potential for agricultural production. Conversely, we found that the two less food secure clusters, those that make frequent recourse to coping strategies, are more prevalent in the more humid climate of the south and east. In this study, we endeavor to explain this puzzle with an analysis that exploits household surveys to link climate to patterns of food production and consumption, and dissects the exposure and sensitivity to climate of livelihoods.
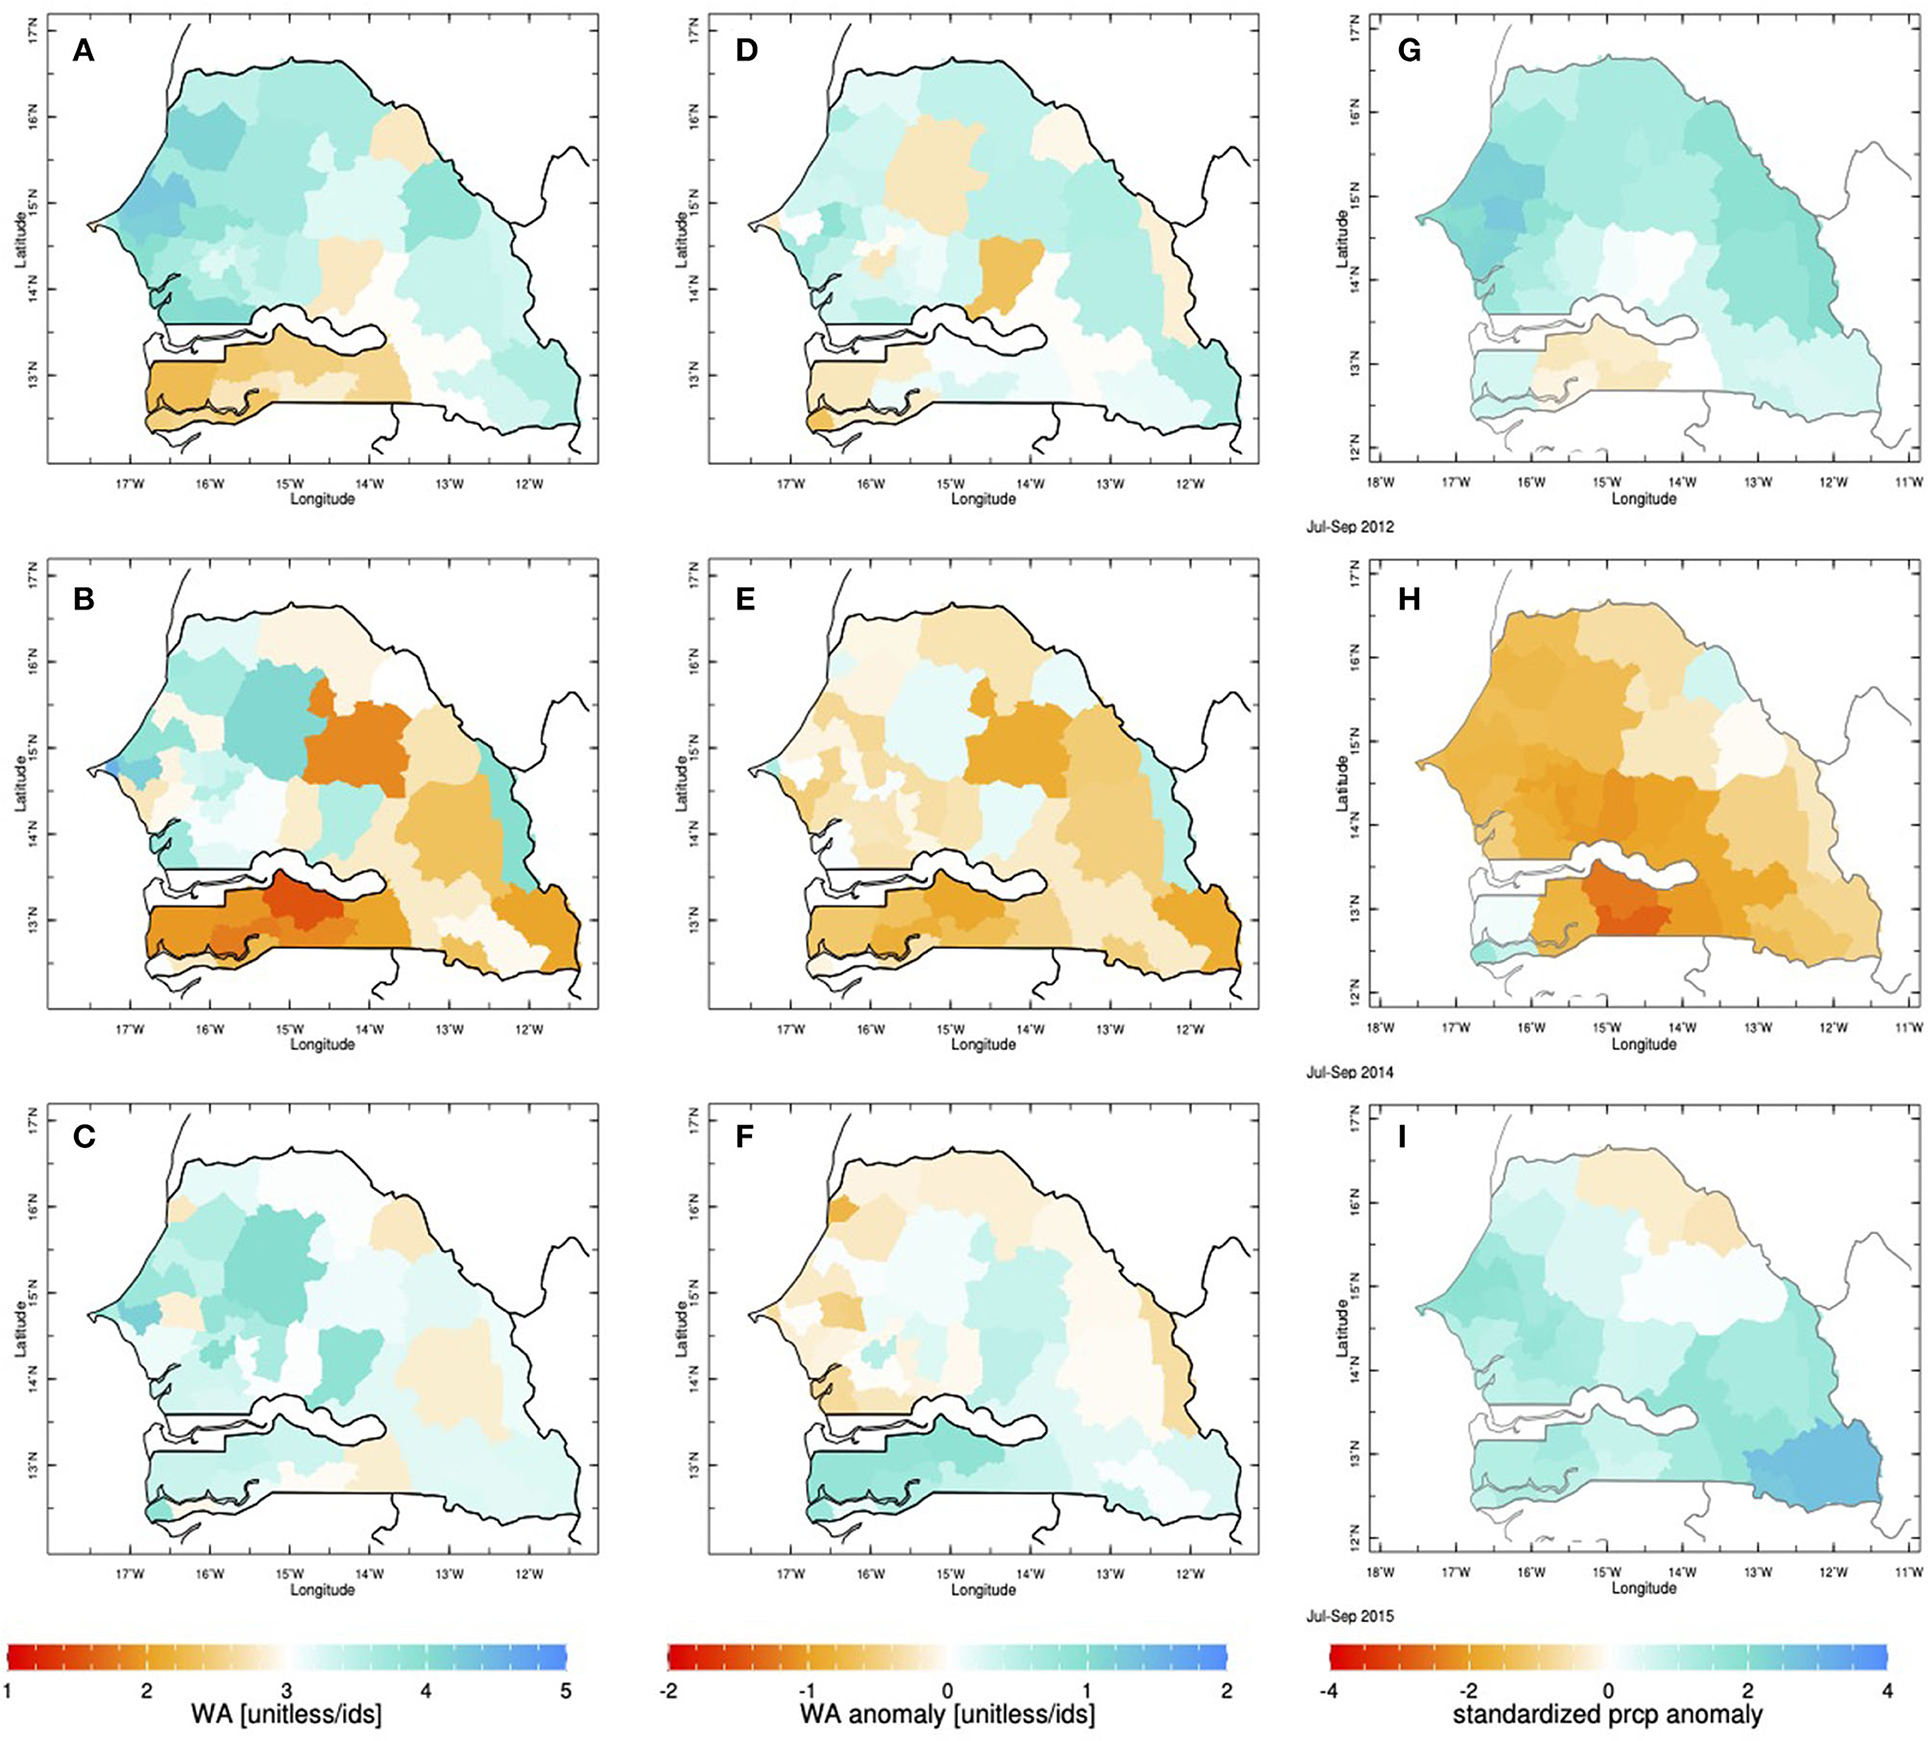
Figure 2. Food security and precipitation across the 3 years surveyed–2013 (A,D,G), 2014 (B,E,H) and 2016 (C,F,I). (A–C) depict the weighted average of cluster membership as computed in Equation (1), for each survey: low values, in orange hues, denote lower food security, or a greater prevalence of households in relatively low food security clusters; high values, in blue hues, denote higher food security. (D–F) depict anomalies in the weighted average of cluster membership. These are calculated by removing the average of the three maps in the left column (which is depicted in Figure 1C) from each map in the left column. In other words, (D) is obtained by subtracting Figure 1C from (A), (E) by subtracting Figure 1C from (B), and (F) by subtracting Figure 1C from (C). (G–I) depict anomalies in precipitation with respect to the 2000–19 average, meaning that the climatology of precipitation depicted in Figure 1A is subtracted from total accumulated precipitation in each year.
Materials and Methods
Materials
We analyze data from the same household surveys used in IN2021. The surveys are of the Comprehensive Food Security Vulnerability Analyses (CFSVA) type, and were collected by WFP's Vulnerability and Analysis Mapping (VAM) unit and its government and non-governmental partners (ENSAN, 2013; ERASAN, 2014; ENSAS, 2016). Data was collected in June 2013, October 2014 and January 2016, allowing the simultaneous sampling of food security across seasons and years. A total of 8,504 households, 5,530 rural, were surveyed in June 2013, which corresponds to the beginning of the rains and sowing, a time when granaries are empty. A total of 5,270 households, all rural, were surveyed in October 2014, which corresponds to the start of harvest in a remarkable drought year. A total of 6,582 households, 4,109 rural, were surveyed in January 2016, which corresponds to the end of the harvest, a time when food is widely available. The same households were not surveyed across all 3 years, but the sampling was designed to be able to evaluate differences at the level of departments, that is, second-level administrative units below the national level in Senegal.
In this study we focus our attention on the survey sections that detail the sources of the food consumed by households, and the sources of household revenue. Possible sources of food consumption include own production, cash purchase, purchase on credit, barter, aid from family or friends, etc. We broadly distinguish economic activities into climate-sensitive or not climate-sensitive. Examples of climate-sensitive activities include farming, livestock-raising, fishing, and hunting/gathering. Non-climate-sensitive activities include self-employed and salaried activities, whether formal or informal, and remittances.
We also analyze climate data, namely precipitation, from the Climate Hazards Center at the University of California, Santa Barbara (Funk et al., 2015). The data, known as Climate Hazards group InfraRed Precipitation with Stations (CHIRPS), is produced by merging in-situ and satellite observations, at time scales from daily to monthly, and at a 0.05° resolution in latitude and longitude. For consistency with IN2021, we compute anomalies with respect to the 2000–2019 period.
Methods
As in IN2021, we compute statistics on data from the WFP household surveys in two ways. In the first approach, to assess differences between food security clusters (groups of households sharing similar features), regardless of their geographical location, we stratify household-level values of a given variable based on cluster membership (the group each household belongs to), and then count, average or sum separately across clusters. This is done, for example, in Figures 5, 7. For example, to obtain Figure 5 we calculate the percent of households that derive their consumption of other cereals from each source. Each source of food consumed is coded by a discrete value. To get the all-household percentage, we count the occurrences of each value and divide by the total number of respondent households. We repeat the same percentage calculation for the households in each cluster. To obtain the percent variation in Figure 5, we subtract the all-household percentage from the cluster percentage. In the second approach, we stratify based on geography, counting or aggregating household values to the department level. This is done, for example, in Figures 1, 8. For example, in Figure 8, we compute the number of households whose first source of income is a given economic activity, coded by a unique value in the survey, with respect to the total number of households surveyed in each department. Precipitation data is also aggregated at the department level, in Figures 1–3. This approach facilitates not only a qualitative, but also the quantitative comparison of patterns of food security and climate, through the calculation of spatial correlations.
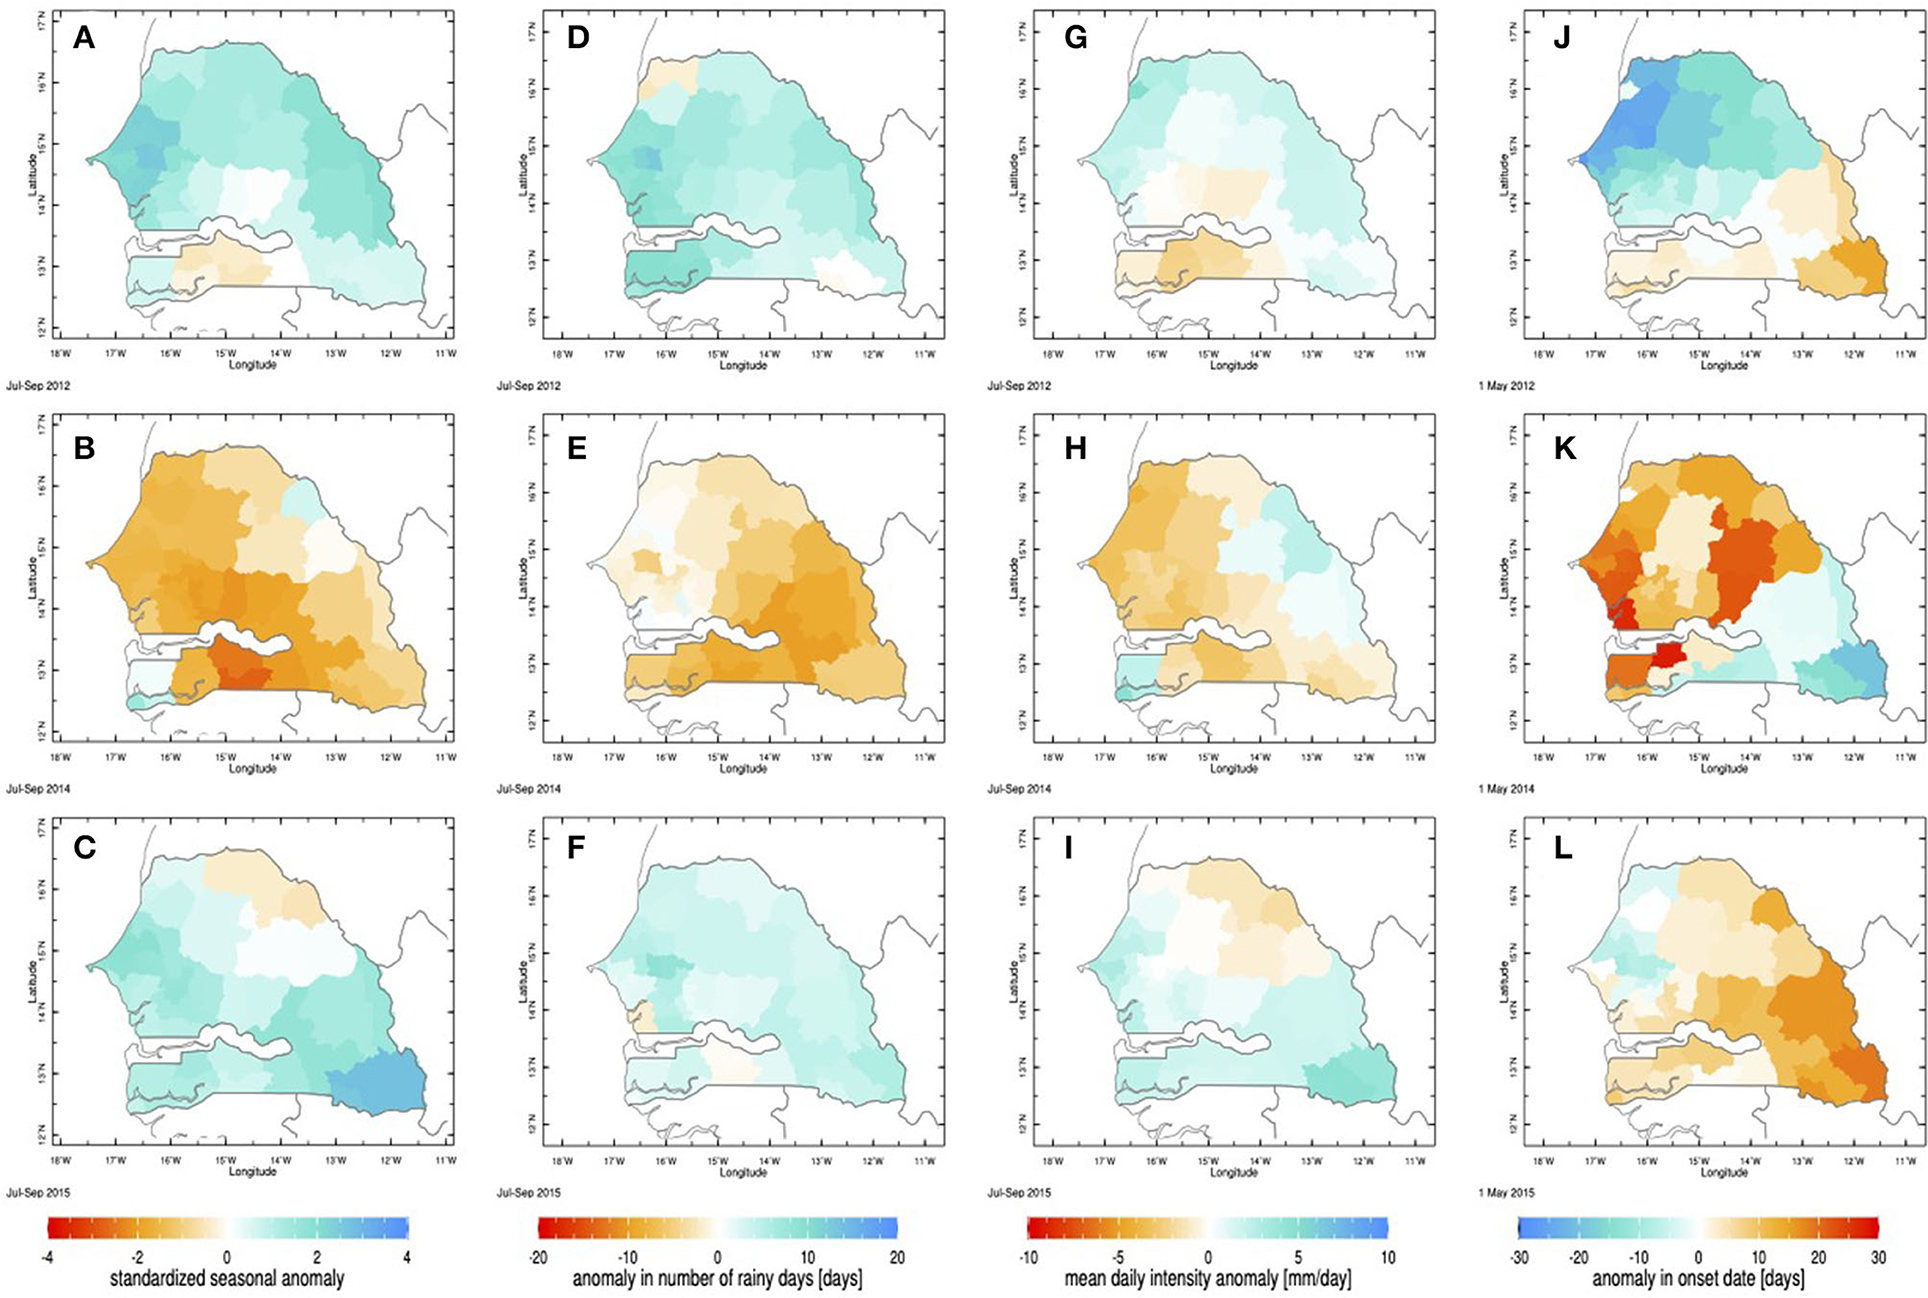
Figure 3. Precipitation anomalies for the rainy seasons immediately preceding the 3 surveys, that is, 2012, 2014, and 2016. Anomalies are computed by subtracting the 20-year average (2000–19) from values in each individual year. The anomalies depicted are in (A–C) total seasonal precipitation (in units of standard deviation), (D–F) number of rainy days (in number of days), (G–I) mean intensity of daily rainfall (in mm/day), and (J–L) onset date (in days, where negative/blue anomalies represent an early onset, and positive/orange anomalies a late onset).
Results
Food Security and Climate
In order to compare spatial patterns of food security and climate, specifically, rainfall and its derivatives (Figures 1–3), we synthesize the distribution of households across the food security clusters defined in IN2021 into a single measure, a weighted average of cluster membership. Ordering clusters from 1 to 5, from least to most food secure, the weighted average (WA) of their prevalence is computed as follows:
where hh(j) is the percent of households belonging to cluster j, with j = 1, … 5. If all households belonged to the least food secure cluster, this weighted average would equal 1. If they all belonged to the most food secure cluster, it would equal 5. If households spread evenly across clusters, it would equal 3. To map this quantity, we compute the weighted average by department. The maps corresponding to the single surveys are displayed in Figures 2A–C. Their climatology, obtained by averaging over the three single survey maps in Figure 2, is displayed in Figure 1C.
In Figure 1, we compare maps of average, or climatology, and coefficient of variation in rainfall (Figures 1A,B) and in weighted cluster membership (Figures 1C,D). Rainfall is lower (Figure 1A) and more variable (Figure 1B) in the north, in the orange hues. It is higher and relatively more stable in the south, in the blue hues. In contrast, average weighted cluster membership (Figure 1C) is higher in western central and northern regions and along the Senegal River at the border with Mali and Mauritania, where department values > 3 are shaded in light to dark blue hues. It is lower in southern and eastern regions, including in the Casamance region, and across the departments of Matam, Tambacounda and Kédougou regions, where department values < 3 are shaded in orange to red hues. The correlation between the climatology panels in Figures 1A,C, then, is negative (r = −0.58) and significant at a level > 1%, given that there are 45 departments. It reflects the question underlying and motivating this study: why the greater food insecurity in the south and east, which are endowed with a wetter and less variable climate?
In Figure 2, we compare maps of weighted cluster membership (Figures 2A–C) with maps of standardized rainfall anomaly (Figures 2G–I). As an intermediate step, we plot anomalies in weighted cluster membership (Figures 2D–F), obtained by subtracting from each map in the left column their climatology, or average (that is, the map depicted in Figure 1C).
Rainfall totals are those accumulated over July–September, the core of the rainy season. The rainfall anomalies displayed in Figures 2G–I are computed with respect to the average over 2000–2019, that is, this 20-year average is subtracted from the full fields for each separate year. The years of reference correspond to the rainy season immediately preceding survey collection: 2012 for the January 2013 survey, 2014 for the October 2014 survey, and 2015 for the June 2016 survey. Averaging anomalies in seasonal rainfall totals over a rectangular longitude-latitude domain encompassing Senegal, 2014 is the driest year in this 20-year period, while 2015 and 2012 are the second and third wettest years, respectively (see Figure 1 in IN2021). Maps of department anomalies in number of rainy days, mean daily intensity and onset date for these 3 years are depicted in Figure 3. The year 2014 was a year of heightened food insecurity illustrated by a globally deficient rainy season in Senegal. This is confirmed qualitatively in the prevalence of orange hues in Figures 2B,E,H, 3B,E,H,K, and quantitatively in the overall lower value, lower than 3, in weighted cluster membership averaged over all departments, reported in Table 1. The rainfall deficit is explained by deficits in the number of rainy days in the south and east (Figure 3E), and in mean daily intensity, as well as a late onset, in the western center and north (Figures 3H,K). The years 2013 and 2016 are overall more food secure, with comparable values of about 3.3 in the weighted cluster membership averaged over all departments (Table 1). They display complementary spatial patterns in rainfall, in the sense that blue hues prevail in the north in the former (Figure 3A), and in the south in the latter (Figure 3C). In Figure 3, the spatial patterns of seasonal accumulation (Figures 3A–C) are closer to those of mean daily intensity (Figures 3G–I) than to those of number of rainy days (Figures 3D–F). While there is a qualitative resemblance between anomalies in weighted cluster membership and in rainfall, that is, Figures 3D,G; E,H; F,I, respectively, in Figure 2, the correlation of spatial patterns is statistically significant in 2013 (r = 0.41, between Figures 2D,G) and in 2014 (r = 0.40, between Figures 2E,H), but not in 2016 (r = 0.03, between Figures 2F,I).
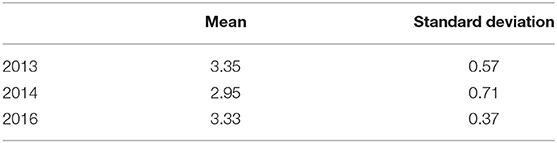
Table 1. Average and standard deviation of the weighted cluster membership defined in Equation (1), calculated over the 45 departments that compose Senegal.
Year-to-year variation in weighted cluster membership, measured by the coefficient of variation depicted in Figure 1D, is low in western central and northern departments compared to southern and eastern departments. Comparing the patterns of food security and rainfall anomaly in Figure 2, one notices complementary patterns between 2013 and 2016. In 2013, a rainfall pattern characterized by abundant rains in the north and slightly deficient rains in the south (Figure 2G) accentuates the climatological difference in food security between the two halves of the country, increasing the food insecurity in the south (Figures 2A,D). This behavior explains the larger inter-departmental variation in weighted cluster membership reported in Table 1. In 2016, the complementary rainfall pattern, with abundant rains in the south and east (Figure 2I), mitigates the climatological difference in food security (Figures 2C,F), and explains the reduced inter-departmental variation in weighted cluster membership reported in Table 1. Inter-departmental variation in weighted cluster membership is largest in 2014, the global drought year, consistent with the very low values recorded in the south and east (Figures 2B,E).
In sum, food security in the western departments of the center and north is relatively high and more stable compared to the south and east, where food security is lower and more variable. If exposure to climate were the explanation, we would expect a positive correlation between rainfall and weighted cluster membership, whether in the climatology or in a given year, expressing the association between a more arid and variable climate in the north and worse food security outcome, and conversely, between a more humid and stable climate in the south and better food security outcome. Instead, when rainfall variation projects positively onto the pattern of spatial variation in food security—meaning when rainfall is more abundant in more food secure regions, as is the case in 2013, or less abundant in less food secure regions, as is the case in 2014—it exacerbates differences in food security, and results in significant spatial correlation between the two. When it projects negatively onto it, as in 2016, it mitigates differences. Correlation in this case is insignificant. We conclude that exposure to climate may modulate variation, but does not explain the climatological spatial variation in food security. To understand spatial variation in vulnerability to climate and in food security, we therefore turn to the analysis of patterns in the sources of food consumption (section Food Security and Sources of Consumption) and of income (section Food Security and Livelihoods).
Food Security and Sources of Consumption
As an intermediate step in linking food security and livelihoods we analyze the sources of the food consumed by rural Senegalese households. The 4 most cited sources are, from most to least relied upon: cash purchase, own production, credit purchase, and aid from family or friends. Other possible sources included in the coded answers in the surveys are: fishing, hunting and gathering, barter, food for work, and food aid from government, intergovernmental or non-governmental organizations.
In Figure 4, the 4 most cited sources of consumption are compared across the 3 surveys (in the rows) and 4 food items (in the columns)—rice (Figures 4A–C), other cereals (i.e., millet, sorghum, maize; Figures 4D–F), meat and poultry (Figures 4G–I), and dairy products (i.e., milk, yogurt; Figures 4J–L). We choose these food items—from a long list that includes, among others, wheat-based cereals, fruits (orange and other), vegetables (green and other), beans and nuts, eggs, seafood, fats, sugars, and spices—because they are staples, providing basic calories and/or because they are potentially produced by the households themselves, because related to common livelihood activities: farming and livestock-raising. Nonetheless, it is clear that cash purchase, the blue bars in Figure 4, is the dominant means of access across the 4 food items considered. Significant deviations across the board–3 surveys and all rural households—are: (i) the larger reliance on credit purchase and aid from family and friends as the main source of food consumed in 2014 (Figures 4B,E,H,K), and (ii) the larger reliance on own production (green bars) in the case of other cereals (Figures 4D–F). Coping strategies such as credit purchase and food aid are put in place in times of drought and their use illustrates the severity of food insecurity.
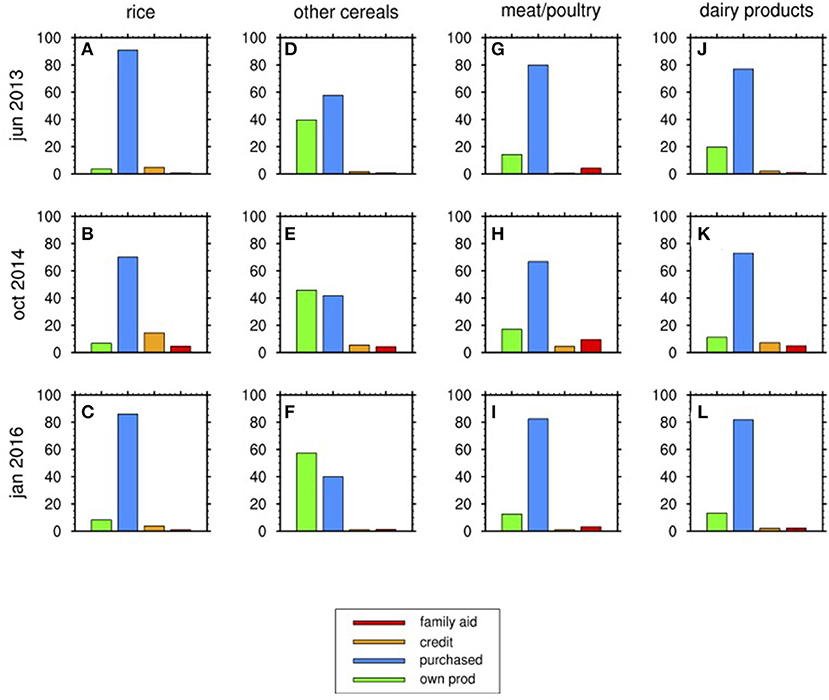
Figure 4. The primary means by which food is accessed, for 4 main food items. Each row refers to a survey, 2013–2016 from top to bottom, and each column to the 4 food items considered, which are (A–C) rice, (D–F) other cereals (maize, millet, and sorghum), (G–I) animal protein (meat and poultry) and (J–L) dairy products, respectively. The 4 sources of food considered—own production in green, cash purchase in blue, credit purchase in orange, and aid from family and friends in red—are the most common ones.
Own production in the case of crops—rice and other cereals—follows expectation from seasonality: a larger proportion of households consumes from their own production after the harvest, in the survey taken in January (2016; Figures 4C,F), than during the lean season, in the survey taken in June (2013; Figures 4A,D). Proportions are intermediate in October (2014; Figures 4B,E), at the beginning of the harvest. The consumption pattern of food items of animal origin also varies with season. Dairy products from own production are mostly consumed during the rainy season (Figure 4J). The rainy season is underway starting in June, when pasture is more abundant for livestock, compared to October (Figure 4K) and January (Figure 4L). This behavior represents the consumption pattern of pastoralist and agro-pastoralist households who were included in the surveys. Dairy products are purchased by non-pastoralists (i.e., agriculturalists, self-employed) who make up the largest percentage of households surveyed. To differentiate patterns of sources of consumption across food security clusters, we compute each cluster's deviation from the picture in Figure 4, which was obtained considering all rural households. In Figure 5, we plot differences with respect to the all-rural-household proportions depicted in Figure 4, in the case of other cereals. Positive values indicate that larger proportions of households in a given food security cluster derive food from the specified source compared to the all-household mean. Negative values indicate smaller proportions.
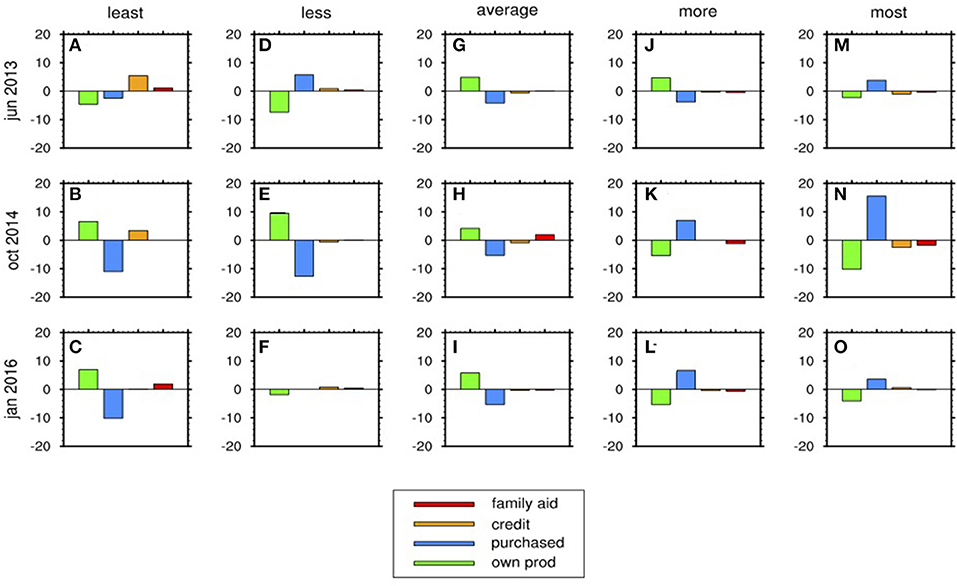
Figure 5. Anomalies, with respect to the all-rural household average in Figure 4 (“other cereals,” that is, D–F), in the primary source of other cereals consumed, by cluster. Each row is a survey, 2013–2016 from top to bottom (A,D,G,J,M; B,E,H,K,N; C,F,I,L,O). Each column is a cluster, least (A–C) to most food secure (M–O) from left to right. “Anomaly” here means the difference between values differentiated by cluster and the “all households” values depicted in Figure 4.
We pick the “other cereals” food item, because it is the only one where cash purchase is rivaled by another source category, notably, own production. In addition, production of other cereals—millet, sorghum and maize—is widespread among Senegalese farmers, albeit with regional variation. Figure 4 reveals that households rely heavily on purchasing food to fulfill their nutritional needs. It shows that right after harvest, in the January 2016 survey, about 60% of households consume other cereals from their own production, and about 40% purchase them. During the lean season, in the June 2013 survey, these percentages are reversed, with about 40% of households consuming from own production and about 60% purchasing other cereals. In Figure 5, if we start from the average food security cluster (Figures 5G–I), we note that greater reliance on own production over purchase, represented in the positive green values and negative blue values, is a constant across surveys, lending credit to the interpretation that this cluster represents the average rural household, engaged in farming. Reliance on own production is accentuated in the less food secure clusters, especially in the least food secure (Figures 5A–C), but only in the surveys taken close to harvest [October 2014 (Figure 5B) and January 2016 (Figure 5C) surveys]. Consistent with their food insecure status, the clusters in columns Figures 5A–F actually rely on their own production less than the global average of rural households in the lean season survey. In June 2013, reliance on own production is reduced in Figures 5A,D. The least food secure cluster makes up for this reduced reliance on own production by purchasing on credit (orange bar in Figure 5A), while the second least food secure cluster purchases with cash in greater proportions (blue bar in Figure 5D). The opposite behavior, that is, greater reliance on purchasing other cereals for consumption, in the blue bars, is the hallmark of the more food secure clusters, in Figures 5J–O. The “more food secure” cluster, in Figures 5J–L, is the mirror image of the “less food secure” cluster, in Figures 5D–F. Overall, fewer of the more food secure households consume from their own production than purchase, except in the lean season (Figure 5J). Then, just like fewer of the less food secure households rely on their own production, more of the more food secure households actually do.
In sum, the three less food secure clusters consume other cereals from their own production in greater proportions, while the two more food secure clusters purchase the other cereals that they consume. To verify whether indeed the less food secure clusters engage in climate-sensitive activities in greater proportions, as hinted by the patterns of access to the food consumed, we finally turn to livelihoods.
Food Security and Livelihoods
So far, we have shown that the less food secure households are in the south and east, and that their food security status is more variable in response to climatic impact (section Food Security and Climate). Since agricultural livelihoods would be more exposed to climate in the more arid and variable western central and northern Senegal, we suspect differentiation in livelihood strategies between the two halves of the country. We have also shown that the less food secure households consume more other cereals, meaning sorghum, millet and maize, from their own production, except during the lean season (section Food Security and Sources of Consumption). These other cereals are staples produced locally, and therefore are more readily available in rural households, and cheaper to access than rice, which is mainly imported and has to be purchased. Hence, the differentiated nature of their consumption across food security clusters also points to agriculture as a liability in food security. These elements raise the following questions: can economic activity, or more generally livelihoods, discriminate among the less and more food secure? Can differences in livelihoods account for the climatological and geographical pattern of food security?
To investigate the relation of livelihood strategies and food security, we use the section in the surveys that queries households about sources of income. Surveys ask to list up to three sources of income in order of importance. Among possible responses, those common to all three surveys analyzed include: agriculture, including gardening, livestock-raising and fishing, including the sale of derived products, various salaried and self-employed activities, such as formal and informal service (e.g., food and transport services, craftsmanship and specialized work), and aid and remittances. We divide the primary source of revenue into two large categories: climate-sensitive and not, displayed in Figure 6, because the specificity of possible coded answers varies among surveys, with some providing more nuanced answers than others. As is to be expected, since our analysis focuses on rural households, agriculture is the dominant first source of income. This is the case for 61, 75, and 51% of households analyzed in the three surveys, respectively, represented in the magenta bars in Figures 6A–C. In addition to agriculture, climate-sensitive primary sources of income include livestock-raising, fishing, and hunting and gathering. Non-climate sensitive activities, in Figures 6D–F, include salaried and self-employed activities. We include remittances, the green bar in the plots in Figures 6D–F, among non-climate sensitive activities. Remittances are the primary source of income for 5, 3, and 6% of households, respectively, in the three surveys.
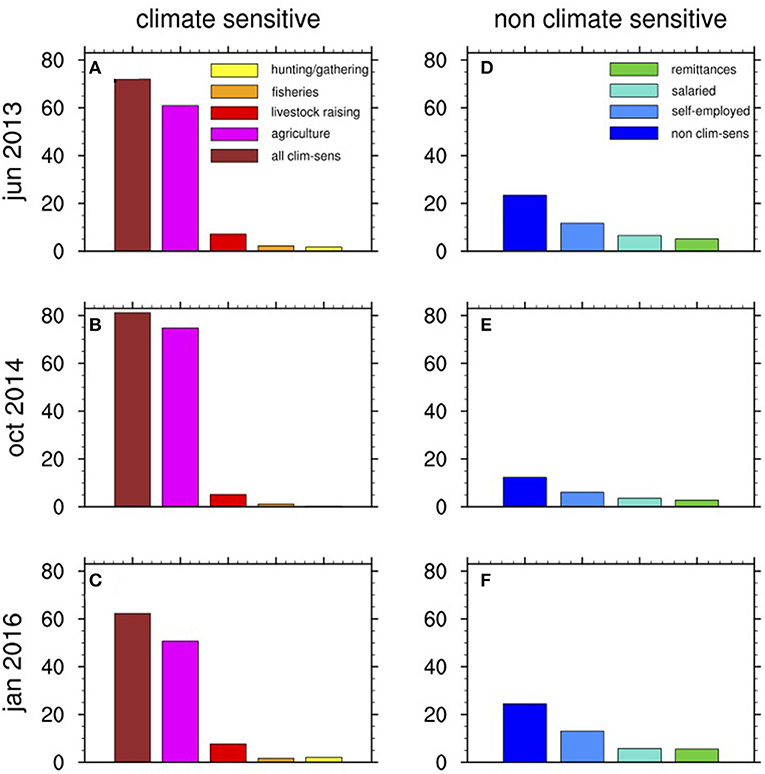
Figure 6. Dominant source of income, or economic activity that the household engages in. Panels on the left (A–C) depict the percent of households engaged in climate-sensitive activities, panels on the right (D–F), those engaged in non-climate sensitive activities Each row is a survey: (A,D) correspond to 2013, (B,E) to 2014, and (C,F) to 2016. The leftmost bar in each panel (dark red in A–C, dark blue in D–F) is the sum of all the other bars in the same panel.
Next, in Figure 7, we stratify food security status, based on cluster membership, by first source of income. Figure 7A summarizes the distribution of all rural households across the food security clusters defined in IN2021. Colors, from red to blue, are the same as those used in Figure 3 of IN2021. The less food secure clusters, in red and yellow, recur to coping strategies, such as reducing quality and quantity of meals, redistributing nutrition to the more vulnerable in the household, or consuming less favored foods. The average cluster, in orange, maintains an acceptable food consumption score with minimal recourse to coping strategies, but expending a large portion of income on food. The more food secure clusters, in green and blue, largely exceed an acceptable food consumption score, whether spending a large portion of income on food or not.
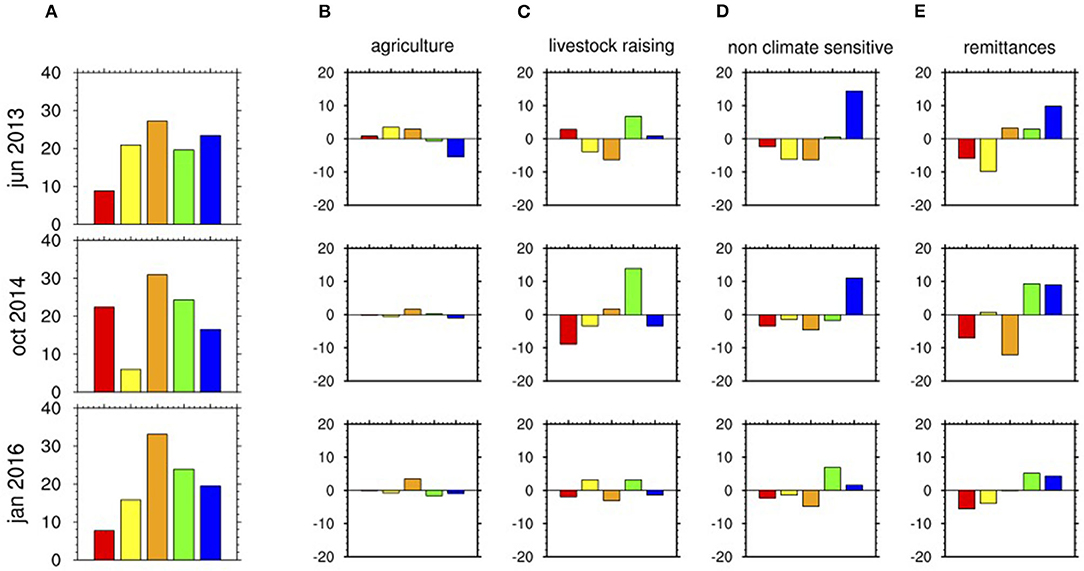
Figure 7. (A) The distribution of rural households into the 5 clusters defined in IN2020, red to blue from least to most food secure, across the three surveys, 2013–2016 from top to bottom. The middle cluster, in orange, is the most common. (B–E) depict variations in cluster membership with respect to the all-household distribution, in (A), as a function of primary source of income: (B) is for agriculture, (C) is for livestock raising, (D) is for non climate-sensitive activities and (E) is for remittances.
Since agriculture is the first source of income for a large majority of households (Figure 6), households deriving their income primarily from agriculture have a dominant influence on the all-rural household distribution into food security clusters (Figure 7A). Therefore, the deviations of agriculture households from the mean, all-rural households' distribution, in Figure 7B, are small. Nonetheless, membership of households engaged in agriculture in the average cluster, in the orange bars, is consistently larger than average across surveys, while membership in the most food secure cluster, in the blue bars, is smaller than average. Livestock-raising households, in Figure 7C, are consistently more prevalent than average in the second-most food secure cluster, in the green bars. This is the cluster that achieves relatively high food consumption scores by spending a lot on food, a hallmark of pastoralist livelihoods. Households engaged in all non-climate sensitive activities, in Figure 7D, are consistently under-represented in the less food secure red, yellow and orange clusters. They are over-represented in the blue cluster, the most food secure. Finally, households whose primary source of income is remittances, in Figure 7E, are over-represented in the two most food secure clusters, in green and blue.
The picture that emerges is one that associates agriculture-dependent livelihoods with food insecurity. Does the practice of agriculture explain the spatial distribution of food insecurity? In Figure 8, we plot maps of the average percent of households engaging in a given economic activity, whether climate-sensitive or not, by department. Farmer households (Figure 8B) clearly dominate the southern half of the country, including the peanut basin and the less food secure south and east. Conversely, households engaged in non-climate sensitive activities (Figure 8D) are more prevalent in western central departments closest to Dakar, and along the Senegal river valley. Indeed, it is this pattern in Figure 8D that best correlates with the climatological pattern of food security depicted in Figure 1C (r = 0.46). This leads us to conclude that it is not exposure to a more arid and variable climate, but sensitivity of livelihoods to climate that best explains the pattern of Senegalese food insecurity.
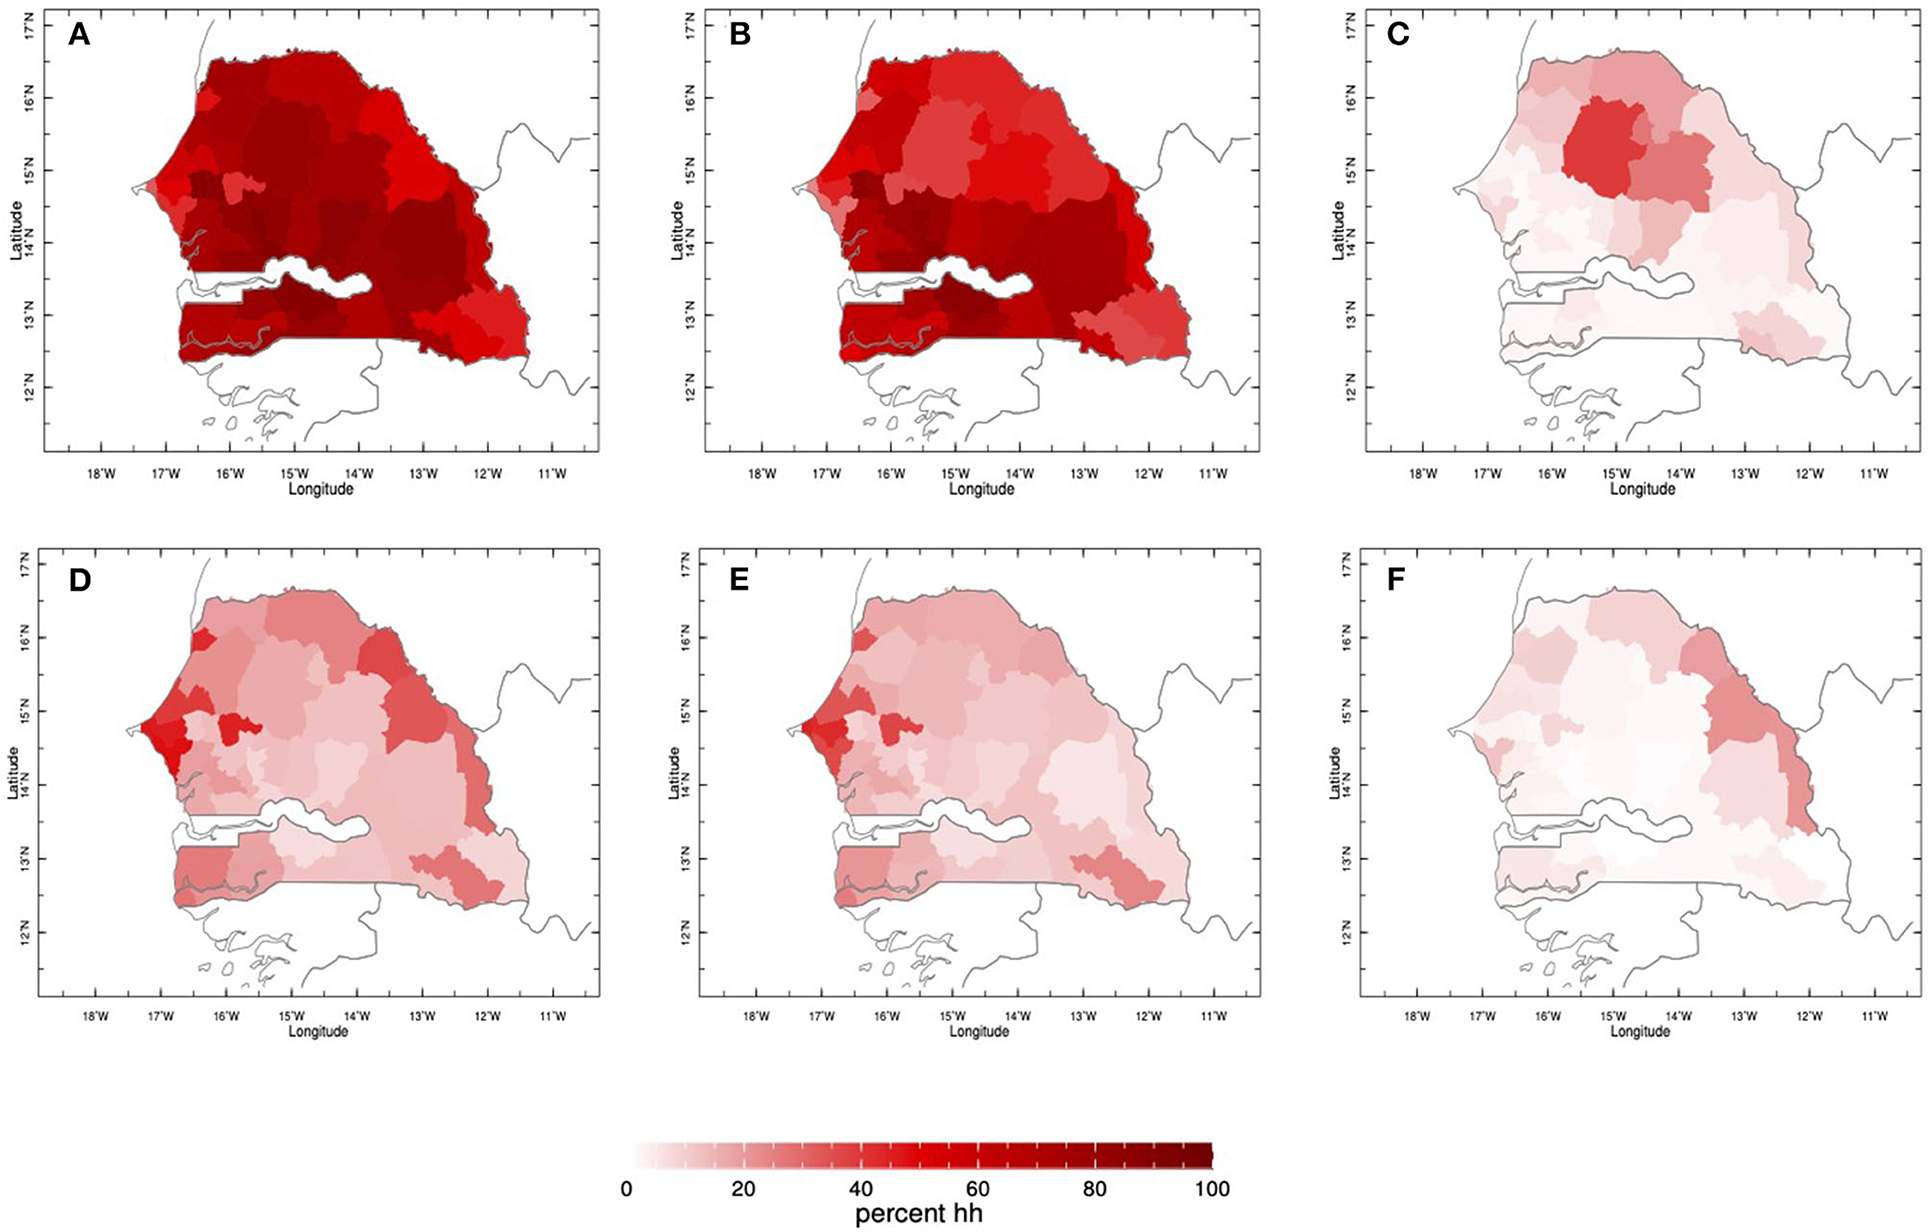
Figure 8. Spatial distribution of the dominant source of income at household level, across departments, averaged over the three surveys taken in 2013, 2014, and 2016. The top row depicts the percent of households by department whose primary source of income is climate sensitive [(A) is the sum of agriculture, livestock raising, fishing, and hunting and gathering, (B) is agriculture only, and (C) is livestock raising only]. The bottom row depicts the percent of households by department whose primary source of income is not climate-sensitive [(D) is the sum of salaried and self-employed activities and remittances, (E) is salaried and self-employed activities, and (F) is remittances only].
Conclusion
Senegal is a Sahelian country affected by climate variability and change, as illustrated by the drought occurrence in the 1970s and 1980s which caused extreme episodic food insecurity. Future projections, unlike in the rest of the Sahel, anticipate the possibility of further drying (Biasutti, 2013, 2019) in this country, where the livelihood of the majority of the population is still agriculture-based, despite globalization, rapid urbanization, and the concentration of economic and political power in and around the capital city of Dakar. Drought and the structural adjustment programs of the 1980s (Hathie and Ba, 2015), together with the currency devaluation of the 1990s, have contributed to triggering long-term change in the economy and society. Fast forward 40 years, and a consequence of these trends is that the picture of food insecurity is more nuanced than a climate-centric expectation would predict, that is, one based on the assumption that rainfed agriculture is the ubiquitous, dominant livelihood strategy outside of urban areas.
The picture that emerges from repeated household surveys conducted by the UN World Food Programme and its government and non-governmental partners over the course of the past decade reveals entrenched food insecurity in the wetter south and east of the country, and relatively high and more stable food security in the drier western center and north. Since climatic impact alone cannot explain this spatial pattern, in this study we endeavored to interpret the vulnerability of food security to climate by dissecting its exposure and sensitivity dimensions. We did so by comparing and contrasting variations in climate and in food security with sources of food consumption and revenue. We conclude that southern and eastern regions are less food secure because of their reliance on climate-sensitive economic activities, mainly agriculture, rather than their exposure to more extreme climatic variation. And that conversely, western central and northern regions, despite being exposed to a harsher, more variable climate, are more food secure, because they have diversified away from agriculture, thanks to their closer proximity to urban centers, notably the capital, Dakar, which facilitated access to other economic activities.
This state of affairs suggests that food security and climate-risk management projects and policies aiming to improve food security should move beyond simplistic assumptions that exposure to climate determines food security status (i.e., that wetter regions can produce more food and are automatically more food secure than drier regions), into examining the complexity of socioeconomic and political factors, such as income and conflict, that shape differently the sensitivity of each livelihood activity to climate variability.
Finally, by showcasing the in-depth understanding, and powerful conclusions and recommendations that can be reached when integrating existing social science research on vulnerability of food security with large-scale household surveys on food consumption, income and livelihoods, and with a process-based understanding of rainfall data, this study endeavors to provide a template for the use of mixed methods in the close collaboration between social and physical climate scientists to promote a comprehensive understanding of the complex links between vulnerability, climate and food security.
Nonetheless, it is important to note that engagement in agriculture is not the only parameter that could predict or explain the vulnerability of food security to climate. Existing programs, evolving government policies and interventions at specific times and locations determine the extent of vulnerability and adaptive capacity. A major limitation of this study is the fact that we were only able to get the snapshot of a specific period in rural communities where households rely mainly on agriculture for their livelihoods. In addition, although WFP's VAM data is evidence-based, our team was not able to conduct any fieldwork to validate our results. Future studies on vulnerability issues, including explicit consideration of adaptive capacity, could run evidence-based analyses to evaluate the impact of diverse programs, policies and development and humanitarian interventions on food insecurity at different spatial and temporal scales, in both rural and urban settings, in order to provide a more complete picture of the situation and better impact policy.
Data Availability Statement
The household survey data analyzed in this article was collected by the UN World Food Programme in collaboration with government and non-governmental partners in Senegal, including the Executive Secretariat of the National Council on Food Security (SE CNSA), the Directorate of Analysis and Prediction of Agricultural Statistics (DAPSA), the National Agency of Civil Aviation and Meteorology (ANACIM), and World Vision. All personal information which could have enabled the identification of respondent households was removed before the data was made available for analysis. If interested in accessing the data, please make your request to the Vulnerability Analysis and Mapping unit of the Senegal Country Office of the UN World Food Programme. Requests to access these datasets should be directed to WFP Senegal Country Office—V0ZQLkRha2FyQHdmcC5vcmc=.
Author Contributions
AG led the analysis of the data and the writing of the manuscript. EI led the review of existing studies that contributed to the framing of the paper, discussed the interpretation of results, and led the writing of the introduction and discussion sections. DB provided overall feedback on the data itself, the analysis and results. ON offered overall feedback on the analysis and interpretation. All authors contributed to the article and approved the submitted version.
Conflict of Interest
The authors declare that the research was conducted in the absence of any commercial or financial relationships that could be construed as a potential conflict of interest.
Publisher's Note
All claims expressed in this article are solely those of the authors and do not necessarily represent those of their affiliated organizations, or those of the publisher, the editors and the reviewers. Any product that may be evaluated in this article, or claim that may be made by its manufacturer, is not guaranteed or endorsed by the publisher.
Acknowledgments
The authors gratefully acknowledge financial support from the NASA/SERVIR/AST-2 program, through grant NNX16AN29G, the French Programme d'Investissements d'Avenir de l'Agence Nationale de la Recherche, through Contract ANR-17-MPGA-0015 (PRODUCT), the Earth Institute at Columbia University, the International Development Research Center, and the School of Human Evolution and Social Change at Arizona State University.
Supplementary Material
The Supplementary Material for this article can be found online at: https://www.frontiersin.org/articles/10.3389/fclim.2021.731036/full#supplementary-material
References
Abdulai, A., and Crole-Rees, A. (2001). Determinants of income diversification amongst rural households in Southern Mali. Food policy 26, 437–452. doi: 10.1016/S0306-9192(01)00013-6
Adger, W. N. (2006). Vulnerability. Glob. Environ. Change 16, 268–281. doi: 10.1016/j.gloenvcha.2006.02.006
Agence Nationale de la Statistique et de la Démographie (2020). Situation Economique et Sociale du Sénégal 2017-2018. Available online at: http://www.ansd.sn/ressources/ses/chapitres/1-SES-2017-2018_Etat-structure-population.pdf (accessed June 8, 2021).
Agence Nationale de l'Aviation Civile et de la Météorologie (2012). Climate Risk and Food Security in Senegal: Analysis of Climate Impacts on Food Security and Livelihoods. Available online at: https://documents.wfp.org/stellent/groups/public/documents/newsroom/wfp269381.pdf (accessed May 3, 2020).
Akpaki, K., Galibois, I., Sall, M., and Blaney, S. (2020). Assessing the food availability and food insecurity situation among communities of Matam region, Senegal. Ecol. Food Nutr. 59, 367–386. doi: 10.1080/03670244.2020.1733993
Armah, F. A., Odoi, J. O., Yengoh, G. T., Obiri, S., Yawson, D. O., and Afrifa, E. K. (2011). Food security and climate change in drought-sensitive savanna zones of Ghana. Mitig. Adap. Strat. Glob. Change 16, 291–306. doi: 10.1007/s11027-010-9263-9
Babatunde, R. O., Omotesho, O. A., and Sholotan, O. S. (2007). Socio-economic characteristics and food security status of farming households in Kwara State, North-Central Nigeria. Pakistan J. Nutr. 6, 49–58 doi: 10.3923/pjn.2007.49.58
Barrett, C. B., Reardon, T., and Webb, P. (2001). Nonfarm income diversification and household livelihood strategies in rural Africa: concepts, dynamics, and policy implications. Food Policy 26, 315–331. doi: 10.1016/S0306-9192(01)00014-8
Baumgard, L. H., Rhoads, R. P., Rhoads, M. L., Gabler, N. K., Ross, J. W., Keating, A. F., et al. (2012). “Impact of climate change on livestock production,” in Environmental Stress and Amelioration in Livestock Production, eds Sejian, V., Naqvi, S. M. K., Ezeji, T., Lakritz, J., and Lal, R., . (Berlin, Heidelberg: Springer), 413–468.
Benzekri, N. A., Sambou, J., Diaw, B., Sall, E. H. I., Sall, F., Niang, A., et al. (2015). High prevalence of severe food insecurity and malnutrition among HIV-infected adults in Senegal, West Africa. PLoS ONE 10:e0141819. doi: 10.1371/journal.pone.0141819
Benzekri, N. A., Sambou, J. F., Diaw, B., Sall, E. H. I., Sall, F., Niang, A., et al. (2017). The dimensions of food insecurity and malnutrition among people living with HIV in Senegal, West Africa. AIDS Care 29, 1510–1516. doi: 10.1080/09540121.2017.1338652
Benzekri, N. A., Sambou, J. F., Ndong, S., Diallo, M. B., Tamba, I. T., Faye, D., et al. (2021). The impact of food insecurity on HIV outcomes in Senegal, West Africa: a prospective longitudinal study. BMC Public Health 21, 1–13. doi: 10.1186/s12889-021-10444-1
Biasutti, M. (2013). Forced Sahel rainfall trends in the CMIP5 archive. J. Geophys. Res. Atmos. 118, 1613–1623. doi: 10.1002/jgrd.50206
Biasutti, M. (2019). Rainfall trends in the African Sahel: characteristics, processes, and causes. Wiley Interdiscip. Rev. Clim. Change 10:e591. doi: 10.1002/wcc.591
Bohle, H. G., Downing, T. E., and Watts, M. J. (1994). Climate change and social vulnerability: toward a sociology and geography of food insecurity. Glob. Environ. Change 4, 37–48. doi: 10.1016/0959-3780(94)90020-5
Downing, T. E. (1991). Vulnerability to hunger in Africa: a climate change perspective. Glob. Environ. Change 1, 365–380. doi: 10.1016/0959-3780(91)90003-C
Downing, T. E., Watts, M. J., and Bohle, H. G. (1996). “Climate change and food insecurity: toward a sociology and geography of vulnerability,” in Climate Change and World Food Security, ed Downing, T. E., (Berlin, Heidelberg: Springer), 183–206.
ENSAN (2013). Enquête Nationale sur la Sécurité Alimentaire et la Nutrition. Dakar, Sénégal: Secrétariat exécutif du Conseil national à la sécurité alimentaire (SECNSA).
ENSAS (2016). Enquête Nationale de Sécurité Alimentaire et Nutritionnelle. Dakar, Sénégal: SECNSA, WFP, World Vision.
ERASAN (2014). Enquête rurale sur l'Agriculture, la Sécurité alimentaire et la Nutrition. Dakar, Sénégal: SECNSA, DAPSA, and ANACIM.
Evans, M. (2005). Insecurity or isolation? Natural resources and livelihoods in Lower Casamance. Can. J. Afr. Stud. 39, 284–314. doi: 10.1080/00083968.2005.10751318
Evans, M. (2007). ‘The suffering is too great’: urban internally displaced persons in the Casamance conflict, Senegal. J. Refugee Stud. 20, 60–85. doi: 10.1093/jrs/fel026
Funk, C., Peterson, P., Landsfeld, M., Pedreros, D., Verdin, J., Shukla, S., et al. (2015). The climate hazards infrared precipitation with stations—a new environmental record for monitoring extremes. Sci. Data 2:150066. doi: 10.1038/sdata.2015.66
Gebrehiwot, T., and van der Veen, A. (2014). Coping with food insecurity on a micro-scale: evidence from Ethiopian rural households. Ecol. Food Nutr. 53, 214–240. doi: 10.1080/03670244.2013.811387
Hathie, I., and Ba, C. O. (2015). “L'agriculture familiale à l'épreuve de la sécheresse et de la libéralisation au Sénégal,” in Diversité des agricultures familiales, eds Bosc, P. M., Sourisseau, J. M., Bonnal, P., Gasselin, P., Valette, E., and Béliéres, J. F., (Versailles: Editions Quae).
Ilboudo Nébié, E. K., Ba, D., and Giannini, A. (2021). Food security and climate shocks in Senegal: who and where are the most vulnerable households? Glob. Food Secur. 29:100513. doi: 10.1016/j.gfs.2021.100513
Knox, J., Hess, T., Daccache, A., and Wheeler, T. (2012). Climate change impacts on crop productivity in Africa and South Asia. Environ. Res. Lett. 7:034032. doi: 10.1088/1748-9326/7/3/034032
Masa, R., Chowa, G., and Nyirenda, V. (2017). Prevalence and predictors of food insecurity among people living with HIV enrolled in antiretroviral therapy and livelihood programs in two rural Zambian hospitals. Ecol. Food Nutr. 56, 256–276. doi: 10.1080/03670244.2017.1311256
McCarthy, J. J., Canziani, O. F., Leary, N. A., Dokken, D. J., and White, K. S. (2001). Climate Change 2001: Impacts, Adaptation, and Vulnerability: Contribution of Working Group II to the Third Assessment Report of the Intergovernmental Panel on Climate Change. Vol. 2. Cambridge: Cambridge University Press.
Piya, L., Maharjan, K. L., and Joshi, N. P., (eds.). (2019). “Climate change and rural livelihoods in developing countries,” in Socio-Economic Issues of Climate Change (Singapore: Springer), 11–33.
Reardon, T., Delgado, C., and Matlon, P. (1992). Determinants and effects of income diversification amongst farm households in Burkina Faso. J. Dev. Stud. 28, 264–296. doi: 10.1080/00220389208422232
Ribot, J. (2010). “Vulnerability does not fall from the sky: toward multi-scale pro-poor climate policy,” in Social Dimensions of Climate Change: Equity and Vulnerability in a Warming World, eds Mearns, R., and Norton, A., (Washington, DC: The World Bank), 47–74.
Rojas-Downing, M. M., Nejadhashemi, A. P., Harrigan, T., and Woznicki, S. A. (2017). Climate change and livestock: impacts, adaptation, and mitigation. Clim. Risk Manage. 16, 145–163. doi: 10.1016/j.crm.2017.02.001
Rust, J. M., and Rust, T. (2013). Climate change and livestock production: a review with emphasis on Africa. South Afr. J. Anim. Sci. 43, 255–267. doi: 10.4314/sajas.v43i3.3
Schlenker, W., and Lobell, D. B. (2010). Robust negative impacts of climate change on African agriculture. Environ. Res. Lett. 5:014010. doi: 10.1088/1748-9326/5/1/014010
Sen, A. (1981). Poverty and Famines: An Essay on Entitlement and Deprivation. Oxford: Clarendon press.
Smit, B., and Wandel, J. (2006). Adaptation, adaptive capacity and vulnerability. Glob. Environ. Change 16, 282–292. doi: 10.1016/j.gloenvcha.2006.03.008
Sultan, B., Guan, K., Kouressy, M., Biasutti, M., Piani, C., Hammer, G. L., et al. (2014). Robust features of future climate change impacts on sorghum yields in West Africa. Environ. Res. Lett. 9:104006. doi: 10.1088/1748-9326/9/10/104006
Sultan, B., Roudier, P., Quirion, P., Alhassane, A., Muller, B., Dingkuhn, M., et al. (2013). Assessing climate change impacts on sorghum and millet yields in the Sudanian and Sahelian savannas of West Africa. Environ. Res. Lett. 8:014040. doi: 10.1088/1748-9326/8/1/014040
Tacoli, C. (2011). “Not only climate change: mobility, vulnerability and socio-economic transformations in environmentally fragile areas in Bolivia, Senegal and Tanzania”, in Human Settlements Working Paper Series: Rural-Urban Interactions and Livelihood Strategies 28. London: IIED.
Thornton, P. K., Jones, P. G., Owiyo, T., Kruska, R. L., Herrero, M., Kristjanson, P., et al. (2006). “Mapping climate vulnerability and poverty in Africa,” in Report to the Department for International Development, ILRI, Nairobi, Kenya, 171.
Tschakert, P. (2007). Views from the vulnerable: understanding climatic and other stressors in the Sahel. Glob. Environ. Change 17, 381–396. doi: 10.1016/j.gloenvcha.2006.11.008
World Food Programme/Vulnerability Analysis and Mapping (2011). “Analyse Globale de la Vulnérabilité, de la Sécurité Alimentaire et de la Nutrition (AGVSAN),” in Report Prepared by J Roux, in Collaboration With A Gamli, K Amouzou, G Ndiaye and the Survey Technical Committee, Reviewed by P Geniez and ML Perenze.
Keywords: food security, livelihood vulnerability, climate, Sahel, Senegal
Citation: Giannini A, Ilboudo Nébié EK, Ba D and Ndiaye O (2021) Livelihood Strategies Shape Vulnerability of Households' Food Security to Climate in Senegal. Front. Clim. 3:731036. doi: 10.3389/fclim.2021.731036
Received: 26 June 2021; Accepted: 25 October 2021;
Published: 24 November 2021.
Edited by:
Belen Rodriguez-Fonseca, Complutense University of Madrid, SpainReviewed by:
Roopam Shukla, Potsdam Institute for Climate Impact Research (PIK), GermanyBrilliant Mareme Petja, Water Research Commission, South Africa
Keshav Lall Maharjan, Hiroshima University, Japan
Copyright © 2021 Giannini, Ilboudo Nébié, Ba and Ndiaye. This is an open-access article distributed under the terms of the Creative Commons Attribution License (CC BY). The use, distribution or reproduction in other forums is permitted, provided the original author(s) and the copyright owner(s) are credited and that the original publication in this journal is cited, in accordance with accepted academic practice. No use, distribution or reproduction is permitted which does not comply with these terms.
*Correspondence: Alessandra Giannini, YWxlc3NhbmRyYS5naWFubmluaUBsbWQuaXBzbC5mcg==; YWxlc2FsbEBpcmkuY29sdW1iaWEuZWR1