- 1Department of Geography, Memorial University of Newfoundland, St. John's, NL, Canada
- 2SmartICE Sea Ice Monitoring & Information Inc., Mittimatalik, NU, Canada
- 3School of Earth, Environment and Society, McMaster University, Hamilton, ON, Canada
The IPCC special report on the ocean and cryosphere in a changing climate (SROCC) highlights with high confidence that declining Arctic sea ice extents and increased ship-based transportation are impacting the livelihoods of Arctic Indigenous peoples. Current IPCC assessments cannot address the local scale impacts and adaptive needs of Arctic Indigenous communities based on the global, top-down model approaches used. Inuit maintain the longest unrecorded climate history of sea ice in Canada, and to support Inuit community needs, a decolonized, Inuit knowledge-based approach was co-developed in the community of Mittimatalik, Nunavut (Canada) to create the Mittimatalik siku asijjipallianinga (sea ice climate atlas) 1997–2019. This paper presents the novel approach used to develop the atlas based on Inuit knowledge, earth observations and Canadian Ice Service (CIS) sea ice charts, and demonstrates its application. The atlas provides an adaptation tool that Mittimatalik can use to share locations of known and changing sea ice conditions to plan for safe sea ice travel. These maps can also be used to support the safety and situational awareness of territorial and national search and rescue partners, often coming from outside the region and having limited knowledge of local sea ice conditions. The atlas demonstrates the scientific merit of Inuit knowledge in environmental assessments for negotiating a proposal to extend the shipping seasons for the nearby Mary River Mine. The timing and rates of sea ice freeze-up (October–December) in Mittimatalik are highly variable. There were no significant trends to indicate that sea ice is freezing up later to support increased shipping opportunities into the fall. The atlas shows that the first 2 weeks of November are critical for landfast ice formation, and icebreaking at this time would compromise the integrity of the sea ice for safe travel, wildlife migration and reproduction into the winter months. There was evidence that sea ice break-up (May–July) and the fracturing of the nearby floe edge have been occurring earlier in the last 10 years (2010–2019). Shipping earlier into the break-up season could accelerate the break-up of an already declining sea ice travel season, that Inuit are struggling to maintain.
Introduction
The International Panel on Climate Change (IPCC) Special Report on the Ocean and Cryosphere in a Changing Climate (SROCC) outlines that between 1979 and 2018, sea ice in the Arctic decreased by ~13% per decade (IPCC, 2019, p. 6). This decline in sea ice is expected to continue into the mid-century having significant impacts on Arctic Indigenous peoples nutritional, cultural, and overall health and well-ness (IPCC, 2019, p. 15). Inuit communities are already dealing with dangerous sea ice travel conditions, limiting access to critical hunting locations and country food sources, and causing high rates of search and rescue, injury, trauma, and tragic deaths (Durkalec et al., 2014; Clark et al., 2016a,b; Driscoll et al., 2016; Kenny et al., 2018b; Ford et al., 2019). Additionally, the surge in shipping activity as a result of changing ice conditions is also impacting Arctic Indigenous peoples (IPCC, 2019). In the Canadian Arctic there has been a three-fold increase in the distance traveled by ships between 1990 and 2015 (Pizzolato et al., 2014, 2016; Dawson et al., 2018). This exposes Indigenous coastal communities to a higher risk of accidents, pollution, noise, invasive species, and disruptions to subsistence hunting areas, wildlife reproduction, populations, and migration routes (Huntington et al., 2015; ICC-Alaska, 2015; Meredith et al., 2019).
IPCC assessments are limited in addressing the climate change questions of Arctic Indigenous communities because of the global scale used in predictive models. Also, the top-down, model-focused approaches used by a majority of assessments are also a barrier to addressing the specific sea ice climate change adaptive needs of Arctic communities (Ford et al., 2012). Inadequate supports to engage meaningfully with Indigenous peoples limits an understanding of the cumulative impacts of colonialism and climate change on Arctic Indigenous communities (Ford et al., 2012; Cameron et al., 2015; IPCC, 2019, p. 15). For example, increased shipping and changes to on-ice travel are not mutually exclusive impacts. In the Inuit community of Mittimatalik (Nunavut, Canada; Figure 1), shipping and on-ice travel are in direct conflict with one another.
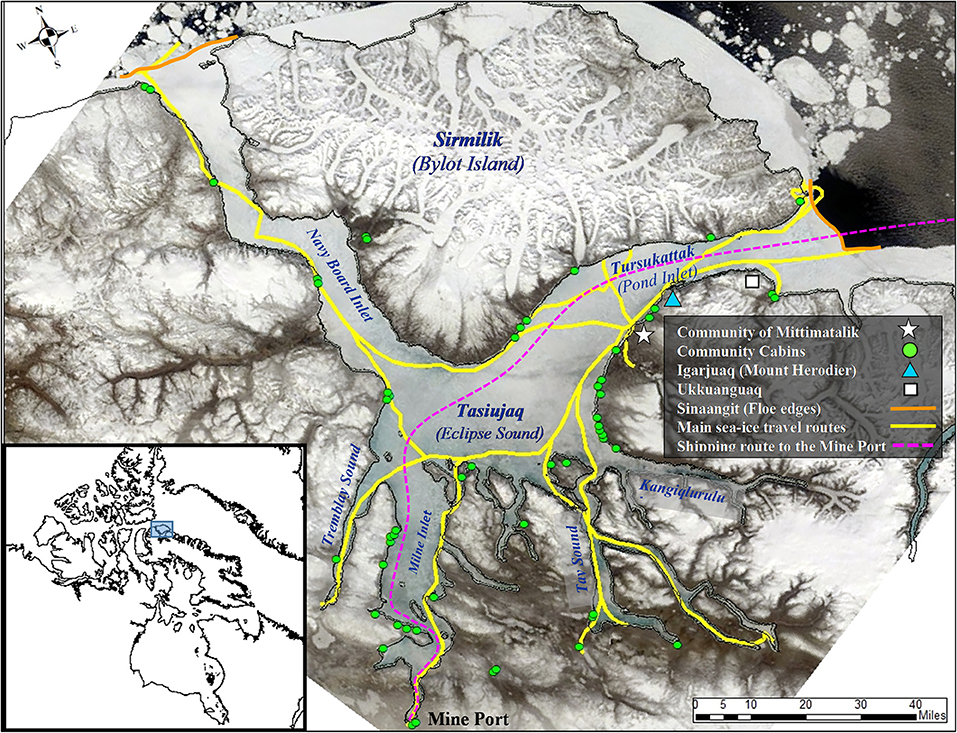
Figure 1. Geographical location of the community of Mittimatalik, Nunavut, Canada. Background image MODIS True Color Composite, June 9, 2019 (NASA, 2019).
Sikumiut are a committee of Inuit sea ice users that govern the SmartICE community-based sea ice monitoring program (http://www.smartice.org/ice-safety) in Mittimatalik. Sikumiut members wanted to be able to share with younger generations where and when the sea ice is changing to support safer on-ice travel. Sikumiut also wanted to investigate the potential impacts of a proposed extension to the shipping season by Baffinland Iron Mines (BIM), the company that operates the Mary River iron ore mine and port near the community (Figure 1). Sikumiut are concerned about BIMs proposal to ship earlier during sea ice break-up and later as the sea ice is freezing. The nearby sinaa (floe edge), a stable landfast sea ice edge critical for community hunting, is highly anticipated during the freeze-up season. Avoiding disturbances to the sinaa and tuvaq (landfast ice) as they form is critical to community members for safe sea ice travel throughout the season, as well as for wildlife habitat and migration.
This collaborative research project with Sikumiut began in 2017. In earlier phases of our work sea ice travel safety maps for the winter and spring travel seasons were developed based on Sikumiut's Inuit Qaujimajatuqangit (Wilson et al., in press). Inuit Qaujimajatuqangit (IQ) is commonly used to describe Inuit knowledge, but it also encompasses all aspects of Inuit “values, world-view, language, social organization, knowledge, life skills, perceptions, and expectations” (Government of Nunavut and Nunavut Department of Education, 2007). As a result, these IQ-based sea ice maps share more than locations of safe and hazardous ice conditions. Embedded in the Inuktitut place names and sea ice terms are important information for sea ice travel and survival (Wilson et al., in press). These Sikumiut sea ice IQ travel safety maps also provide a time-integrated baseline of the winter and spring sea ice travel conditions for Mittimatalik. Typically, meteorologists call these baselines “climatologies,” comprising databases of historical weather or sea ice observations (WMO, 2017). These climatologies are used to compare and track changes over time, and are used particularly to monitor climate change trends. Sikumiut's IQ-based sea ice climatology is maintained by passing down their IQ through generations, and orally sharing their extensive and recent travel experiences on the sea ice. Sikumiut's sea ice climatology is therefore not in a database, but exits in the collective minds of these expert sea ice travelers. Also, their climatology is not focused on ice conditions in a general scientific sense, but more specifically on ice conditions supporting safe travel and spatio-temporal patterns of ice features that support hunting. To support Sikumiut's climate change adaptation needs, a novel approach was co-developed to document for the first time their sea ice IQ to create the Mittimatalik siku asijjipallianinga (sea ice climate atlas).
The goals of this paper are three-fold. First, we outline the unique IQ-based research co-production approach that utilized earth observations and Canadian Ice Service (CIS) sea ice charts to create a sea ice climatology for the community of Mittimatalik. We present how Sikumiut's IQ was the foundation for the development, analysis and production of the final maps in the siku asijjipallianinga. Second, we present the utility of the atlas in summarizing Mittimatalik's sea ice trends (averages, variability, spatial changes) over the 23-year climatological period (1997–2019). Third, we demonstrate the value of such IQ-based, community-scale sea ice climatologies for local and regional scales.
This paper does not include an analysis of the atmospheric drivers for local sea ice change in Mittimatalik. This would normally accompany the presentation of a regional sea ice climatology, but this was not requested by Sikumiut. Also, this paper is not an example of integrating or incorporating IQ into western science. In this IQ-based sea ice climatology, we utilized other data sources to address Inuit specific research questions. This paper provides an example of an IQ-based research co-production approach in practice, including supplementary data sources, to fill the climate knowledge gaps and support adaptation needs for the community of Mittimatalik.
Background
In this background section we briefly review the impacts of climate change and colonialism on safe sea ice travel across Inuit Nunangat. Inuit Nunangat is the Inuit homeland in Canada that covers the four Inuit land claim settlement regions of: Inuvialuit Settlement Region (Northwest Territories), Nunavut, Nunavik (northern Québec), and Nunatsiavut (northern Labrador) (ITK, 2018). We also present the Inuit community of Mittimatalik, outline our 6-year research co-production journey, introduce the research partners and co-authors, and how the need for a Mittimatalik sea ice climatology evolved. Finally, we review the current information sources available to build sea ice climatologies at community scales in the Canadian Arctic. In this paper we use the Mittimatalik Inuktitut sea ice and geographic terms and Table 1 has been provided for reference to the equivalent English terms while reading.
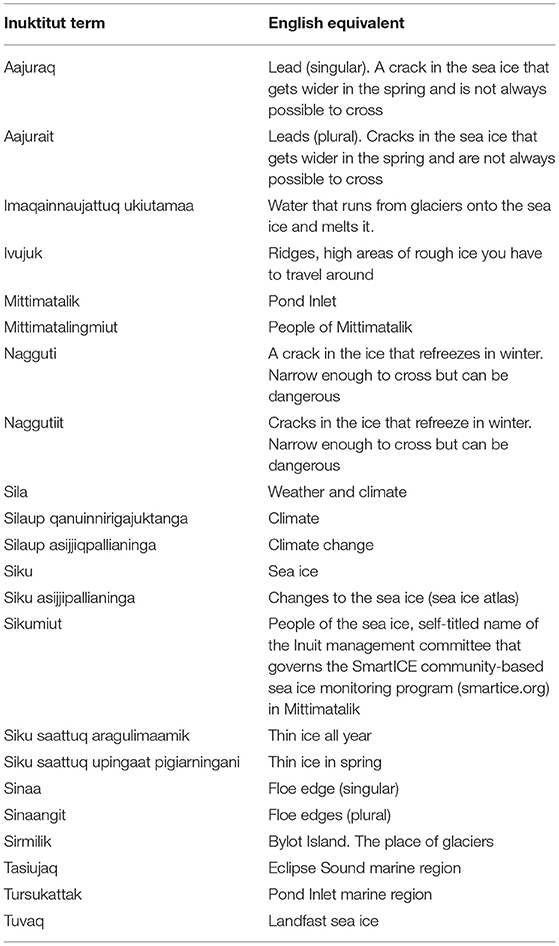
Table 1. Mittimatalik Inuktitut sea ice terms and geographic place names with English equivalent terms and definitions.
Climate and Colonial Impacts for Safe Sea Ice Travel
The IPCC SROCC defines climate as the “average weather … over a period of time ranging from months to thousands or millions of years” (Portner et al., 2019, p. 680). In Inuktitut there is no word for climate or climate change. The closest word to climate in Inuktitut is sila, which has been defined as weather and the spiritual power that controls weather (Fox, 2004; Leduc, 2007). In Inuktitut, the term silaup qanuinnirigajuktanga is now used for climate and the direct translation from Inuktitut is “[t]he usual temperature, rain or snow and wind conditions of an area over a very long number of seasons” (GN and NTI, 2005, p. 39). Climate change is defined as “A change in the state of the climate that can be identified (e.g., by using statistical tests) by changes in the mean and/or the variability of its properties and that persists for an extended period, typically decades or longer” (Portner et al., 2019, p. 680). The Inuktitut term silaup asijjiqpallianinga is the term used for climate change and has various definitions that include: “A difference in the usual and extreme global temperatures that is not just a short cycle, but lasts for decades” (GN and NTI, 2005, p. 35); and the “ongoing and continuous change in sila” (Cameron et al., 2015, p. 278). The Inuktitut term sila is much more nuanced. For the context of this paper we are using the Government of Nunavut and Nunavut Tunnagavik Inc., Definitions (2005), but for a more in-depth discussion see (Fox, 2004; Leduc, 2007; Cameron et al., 2015).
Environmental changes to sea ice travel is having profound impacts on the physical, cultural, and mental health of Inuit (Cunsolo Willox et al., 2013; Ford et al., 2013b; Durkalec et al., 2015; Pearce et al., 2015). Sea ice provides a stable platform to access country food (wild food from plants and animals, which is gathered and caught from the land and ocean). Changing weather and sea ice conditions are limiting Inuit access to critical hunting locations and country food sources (Laidler et al., 2009; Clark et al., 2016a; Kenny et al., 2018b). The high cost of store-bought foods in Inuit Nunangat means Inuit food insecurity rates are eight times higher than the rest of Canada (Kenny et al., 2018a). Inuit are now having to navigate new, longer, and more dangerous routes on the sea ice to access country food, which increases the risk of becoming lost in unfamiliar areas. Changes to traditional sea ice routes have also led to the use of more fuel, running out of gas, breaking through unexpected areas of thin ice, having to travel over rough ice and/or land resulting in snowmobiles and other equipment being lost and damaged (Ford et al., 2007; Durkalec et al., 2015; Driscoll et al., 2016; Fawcett et al., 2018). Search and rescue requests have not only increased due to changing weather and sea ice conditions, but also due to mechanical breakdown and running out of gas (Durkalec et al., 2014; Clark et al., 2016a). Rates of unintentional injury and trauma are extremely high in Inuit Nunangat, and in Nunavut specifically they “are more than twice the national average…and the leading cause of morbidity and mortality” (Durkalec et al., 2014; Clark et al., 2016a, p. 44).
As identified in the IPCC SROCC, climate change has left some experienced hunters doubting their weather and sea ice forecasting skills (IPCC, 2019); however, many hunters still have confidence in their IQ to navigate and make critical decisions on the sea ice, even under changing sea ice conditions (Gearheard et al., 2006; Pearce et al., 2010; Wilson et al., in press). The high rates of sea ice related injury and search and rescue experienced by Inuit are not simply due to climate change, but are intertwined with the ongoing effects of colonialism that have weakened the transmission of sea ice IQ through reduced language and practice (Tester and Kulchyski, 1997; Damas, 2002; MacDonald, 2018). The transition of Inuit into settlements, wage labor, and residential schools resulted in generations of Inuit being deprived of the time and access to the sea ice to develop this IQ through observations and experiences with parents and Elders (Tester and Kulchyski, 1997; Damas, 2002; QIA, 2014; TRC, 2015; MacDonald, 2018). Colonialism has left some Inuit unable to communicate in Inuktitut, impacting their ability to learn, understand, and share sea ice conditions and experiences with hunters and Elders (Heyes, 2011; Pearce et al., 2011; Ford et al., 2013a). Despite these challenges, sea ice IQ has endured and continues to be gained through experience and practice. Inuit continue to share their sea ice observations and knowledge to make safe sea ice travel decisions (Pearce et al., 2010; Ford et al., 2013a; Gearheard et al., 2013; ICC-Canada, 2014; Wilson et al., in press).
Evolution of the Research Partnership and Project
The community of Mittimatalik (Pond Inlet) is located at the northern tip of Baffin Island in Nunavut (Figure 1). It has a population of ~1,600 people, of which 92% are Inuit and speak Inuktitut as their first language (Statistics Canada, 2017). The sea ice around the community begins to freeze in late October, and is normally safe for travel by mid-November once the ice becomes tuvaq (land-fast ice or stable sea ice that is frozen to the land) (Wilson et al., in press). Mittimatalingmiut (people of Mittimatalik) travel on the sea ice to hunt and fish for country food (caribou, narwhal, beluga, seal, and charr) and to spend time away from town at family cabins. Areas commonly traveled around Mittimatalik discussed in this paper include: Navy Board Inlet, Tasiujaq (Eclipse Sound), and Tursukattak (Pond Inlet; Figure 1). There are two sinaangit (plural of sinaa = floe edges) in the region, one at the entrance to Navy Board Inlet and one at the entrance to Tursukattak (Figure 1). Sinaangit are stable edges of tuvaq, located beside areas of open water that remain clear of ice throughout most of the sea ice season. The Tursukattak sinaa is located ~65 km from the community and is one of the main hunting and fishing locations that Mittimatalingmiut use from December to early July.
Mittimatalingmiut want to maintain their sea ice travel, and are looking to additional information sources to augment their decision-making. Some members of the community heard about SmartICE and invited Trevor Bell to Mittimatalik in 2015 to discuss how SmartICE could support the community's sea ice travel safety concerns. SmartICE (smartice.org) is a work integration social enterprise that provides ice thickness measurements for Inuit communities using: in-situ instruments (SmartBUOYs) located at strategic travel locations on the sea ice; and a mobile sensor (SmartQAMUTIK) towed behind a snowmobile throughout the season on the main sea ice trails (Bell et al., 2014). Bell and Katherine Wilson spent 2 years developing relationships and trust to establish an Inuit-led SmartICE operations team in Mittimatalik. Bell is a co-author on this paper, a co-supervisor for Wilson, and the founder of SmartICE. Wilson, the lead author of this paper, is a PhD candidate with Memorial University of Newfoundland. She is also an employee of the Government of Canada for over 25 years, currently with the Canadian Ice Service (17 years in total), part of Environment and Climate Change Canada (ECCC). Wilson returned to school in 2015 under the co-supervision of Bell and Gita Ljubicic (McMaster University, also co-author), to retrain in decolonizing and Indigenous research approaches, and to put into practice a different way of doing research that empowers Inuit self-determination (Wilson et al., 2020).
Andrew Arreak, co-author, lives in Mittimatalik and was hired and trained in 2015 as the SmartICE community operator, now the Nunavut Operations Lead for the Qikiqtaaluk North (Baffin) region of Nunavut. In 2016, a 10-person management committee of Elders, experienced sea ice users and youth was established to govern SmartICE in Mittimatalik. Sikumiut, which means “people of the sea ice” in Inuktitut, is the self-titled name of the management committee (also co-authors on this paper, see Acknowledgments for list of members). Over these initial 2 years, Sikumiut began to share their concerns with Bell and Wilson about previous research relationships and younger Inuit lacking the necessary IQ needed to travel safely on the sea ice.
In 2017, our third year working together, we spent time planning the research focus and co-developing a cross-cultural research approach, called the Sikumiut Model (Wilson et al., 2020), with six goals:
1. Support Inuit self-determination in research;
2. Embrace Inuit decision-making;
3. Prioritize community-based research needs;
4. Develop Inuit specific values for research;
5. Strengthen Inuit youth capacity; and
6. Change the role of non-indigenous research partners.
In the Sikumiut Model, the research is focused on community research needs and building Inuit youth capacity in research. As a result, we worked to change the status quo, and the role of the non-Indigenous research partners was reconceptualized as facilitators and mentors to train Inuit youth in Mittimatalik to do this research themselves. Arreak was hired as the Inuit youth researcher to work on this project alongside his part-time SmartICE duties. To formalize the co-produced research approach, an agreement between Sikumiut and Memorial University was developed, which outlined the project goals, as well as roles and responsibilities of the Inuit and non-Indigenous project partners (Wilson, 2018). The research agreement also specified that the knowledge and data from this project are owned by Sikumiut, and they gave consent to Wilson to publish the results as part of her PhD requirements.
In 2018 we began the research phase of the project. Sikumiut wanted to first document and share their sea ice IQ with the next generation to improve safe sea ice travel in the community. During 2018, workshops were held to document Sikumiut's sea ice terminology and to map Sikumiut's knowledge of safe and dangerous sea ice travel areas from winter to early summer as the sea ice is breaking up (Figures 2A, 3). Between 2019 and 2021 this sea ice IQ was made accessible to the community through the development of a sea ice terminology booklet, posters and seasonal maps of safe and dangerous areas to travel (Wilson et al., in press).
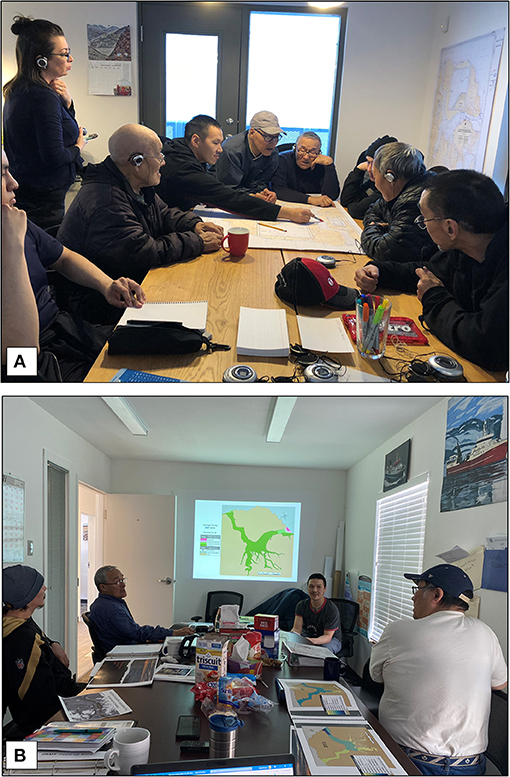
Figure 2. (A) Sikumiut members mapping their sea ice IQ, November 2018. Photo credit Katherine Wilson. (B) Sikumiut members reviewing the Mittimatalik siku asijjipallianinga maps, March 2021. Photo credit Shelly Elverum.
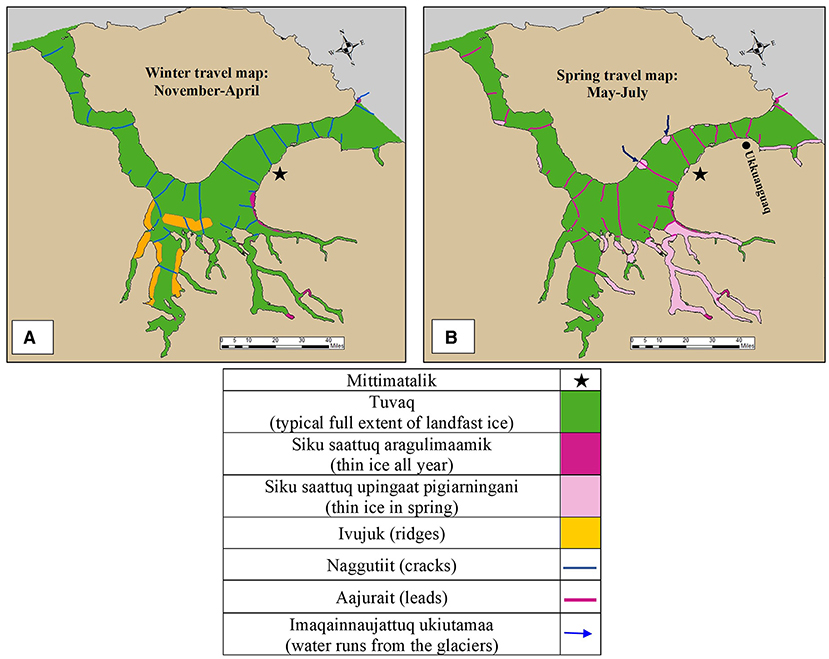
Figure 3. Sikumiut seasonal sea ice safety travel maps (A) Winter sea ice IQ travel map, November to April; (B) spring sea ice IQ travel map, May to July. See on-line versions at http://www.smartice.org/ice-safety.
Over several meetings Sikumiut members discussed that while the sea ice freezes and breaks up differently each year, changes in sea ice conditions are now beyond what they would consider normal. Sikumiut members were interested in understanding where the sea ice was becoming more dangerous, so they could adapt their travel routes to maintain their hunting and fishing activities. In addition, Sikumiut were also concerned about a request from BIM to extend the shipping to/from the mine into the sea ice season. Figure 1 shows the current shipping route from Baffin Bay, past the community, into Tasiujaq and down Milne Inlet currently used during the average open water season (August 5 to October 15). BIM wants to increase production at the mine, which would necessitate more shipping to export the ore. The company has proposed starting to ship 2–3 weeks sooner in the summer (as of July 15), and later into the fall (until November 15; Bourbonnais et al., 2016). These shipping dates were proposed based on the analysis of CIS charts and satellite imagery (1980–2016) to understand the historical sea ice conditions in the region, and determine the vessel class, safety and feasibility of shipping in the shoulder seasons (Bourbonnais et al., 2016). The assessment concluded that shipping into the shoulder seasons was possible based on the use of various ice-strengthened vessel classes (Bourbonnais et al., 2016). Sikumiut are concerned about the impacts of icebreaking in the fall as tuvaq, along with the Tursukattak sinaa, are forming at this time, and changes to fall sea ice could impact travel safety throughout the subsequent winter and spring ice seasons. For example, shipping in the fall will leave large tracks of deformed, rough ice, dangerous for navigation during the dark months and cutting off traditional travel routes (Figure 1; Sikumiut, 2021). Sikumiut are also concerned that icebreaking earlier in the summer could further accelerate sea ice break-up and black carbon emissions from ships could change the albedo of the sea ice (Sikumiut, 2021). Changes to the sinaa and tuvaq could have critical consequences for Mittimatalingmiut for sea ice travel safety, in accessing hunting areas, for spring seal reproduction on the ice, and for polar bear migration. Additional concerns are due to the noise from icebreaking and the effects on local seal and narwhal populations (Sikumiut, 2021).
Discussions across many Sikumiut meetings evolved around the need to document Mittimatalik's historical sea ice conditions and develop a baseline of sea ice knowledge for the region. This sea ice baseline would be analyzed to understand:
• where and when the sea ice is changing to adapt sea ice travel; and
• how shipping later during sea ice freeze-up and earlier during sea ice break-up could compromise the safety of Mittimatalingmiut on-ice travel.
It was also important for Sikumiut to have this baseline to compare ongoing changes to sea ice, and the potential cumulative effects of shipping through the sea ice. To address Sikumiut's climate change adaptation and shipping impact questions, we needed to co-develop a novel way to create a Mittimatalik-specific sea ice climatology.
Available Date to Support Community-Scale Sea Ice Climatologies
Wilson started by reviewing the available satellite, CIS ice charts and in-situ datasets for the Mittimatalik region at a variety of scales to determine how additional data sources could supplement Sikumiut's IQ for a Mittimatalik specific sea ice climatology.
Satellite Data
The most widely used sea ice climatology comes from the Special Sensor Microwave Imager (SSM/I) satellites (NSIDC, 2021). SSM/I satellites have been imaging the polar regions since 1978, providing a 44-year-long database to monitor changing sea ice conditions (Stroeve and Meier, 2018). However, the spatial resolution of SSM/I imagery is on the order of 25 km, and community sea ice conditions are indiscernible from the topography of the Canadian Arctic archipelago in this imagery (Cooley et al., 2020; NSIDC, 2021).
Two other types of satellite sensors are optimal for sea ice monitoring: optical; and synthetic aperture radar (SAR). Optical satellites, such as NASA's Moderate Resolution Imaging Spectroradiometer (MODIS) and the European Space Agency's Sentinel-2 (ESA, 2019; NASA, 2019), are dependent on sunlight and therefore cannot image the earth's surface when there are clouds or during winter polar darkness in northern latitudes. MODIS images the Mittimatalik region daily at a resolution of 250 m and there is an archive of imagery dating back to the year 2000 (Figure 1). MODIS has been used successfully to develop climatologies of landfast ice break-up for Inuit communities using cloud free imagery during the spring and summer seasons with long daylight hours (Cooley et al., 2020). SARs, such as RADARSAT 1 and 2 (CSA, 2019) and Sentinel-1 (ESA, 2019), have their own energy source that send and receive microwave wavelengths to measure the roughness of the earth's surface. This built-in energy source allows for monitoring during the dark Arctic winters, approximately mid-November to mid-February (3 months). The microwave wavelengths of SARs can also penetrate most cloud cover, providing year-round imaging of the Arctic surface. The RADARSAT imagery archive dates back to 1997, with a majority of the imagery in a ScanSAR Wide beam mode with a 100 m resolution (Figure 4B).
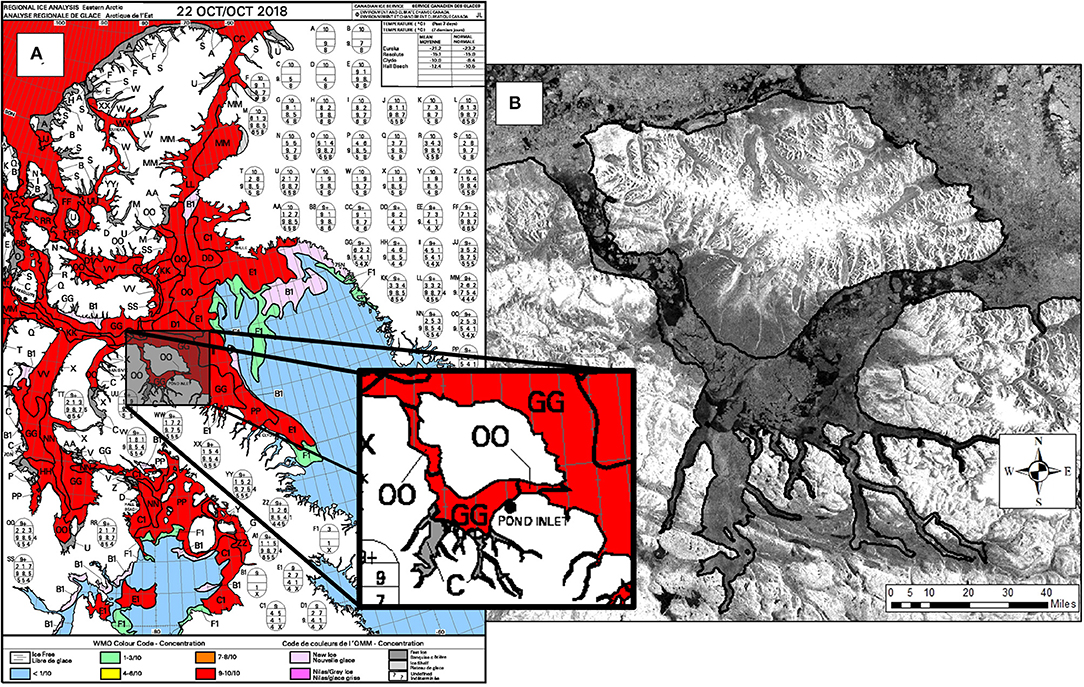
Figure 4. (A) CIS eastern Arctic regional ice chart for October 22, 2018 (ECCC, 2020); (B) RADARSAT-2 ScanSAR Wide image of the Mittimatalik region, October 22, 2018 (CSA, 2019).
Ice Charts
The longest recorded sea ice archive for Canada is based at the CIS (ECCC, 2021). Since 1968 the CIS has been monitoring sea ice to support summertime marine navigation and Arctic community re-supply (Shokr and Sinha, 2015). Between 1968 and 1995, detailed daily ice charts were produced using a combination of visual and SAR aerial reconnaissance missions, low-resolution satellite data, and meteorological information. In 1996, the CIS transitioned to using RADARSAT as their primary data source to operationally monitor sea ice in the Canadian Arctic (Ramsay et al., 1996, 1998). The CIS produces detailed daily ice charts for the major shipping routes in the Arctic during the summer season. In the fall, as the sea ice starts to freeze-up, ships leave the Arctic and the CIS transitions to weekly, less detailed regional charts to monitor the sea ice conditions over the winter months until break-up the following summer. The CIS archive now captures three 30-year climatological periods: 1971–2000; 1981–2010; and 1991–2020. CIS climatological products have been developed to generate sea ice climate normal maps and graphs to review change and variability in sea ice conditions in Canada. The CIS climatology has been created at a regional scale for the Western Arctic, Eastern Arctic and Hudson Bay and are not at a scale to capture the ice conditions for the Mittimatalik region (ECCC, 2021). However, the weekly charts in the CIS archive do provide some details of Mittimatalik ice conditions and are an additional data source for the community climatology (Figure 4A).
In-situ Observations
The Arctic Research Establishment (ARE) was a private research station run by the Steltner family based in Mittimatalik between 1975 and 1989. ARE collected oceanographic and sea ice data for ship engineering and ice-breaking research. Some Sikumiut members had worked for ARE taking measurements and requested that these data be relocated and returned to them. Between 2016 and 2018, Wilson searched Canadian archives, contacted retired scientists and eventually connected with members of the Steltner family. The data collection had been kept in the family home in southern Ontario and the data included environmental observations recorded in field books, reports, photographs, and on film. Bell sought funding to archive this dataset, and between 2019 and 2020 the collection was scanned, sorted, and boxed up. Digital copies of the collection are now in the community of Mittimatalik, but several years of work are still required to review and enter the observations into a database for research. The Steltner family donated the ARE collection to the Government of Nunavut and the physical records are now stored in their archives currently housed in Ottawa.
Community-based monitoring (CBM) has been gaining significant interest to fill gaps in sparse Arctic environmental information (Johnson et al., 2015). The benefits of CBM approaches include year round monitoring, conducted by the Indigenous peoples who live in the region, and in providing local scale information that Arctic communities can use to address their own research needs (Johnson et al., 2015). SmartICE is a CBM service that was established to monitor sea ice in the community of Mittimatalik in 2016. However, the current length of the SmartICE record (5 years) is not yet long enough for use in the Mittimatalik climatology.
Inuit Qaujimajatuqangit
Inuit hold the only long term and consistent record of sea ice in the Canadian Arctic. Riedlinger and Berkes (2001) discuss how IQ is a source of climate history and can provide a baseline to assess change and fill Arctic monitoring gaps. However, in reviewing the literature we found no practical examples where IQ was mobilized for its climate history.
The Sikumiut maps that were co-produced in 2018 share the IQ of known locations of safe and hazardous ice conditions by season (Figures 2A, 3A,B). The winter travel map highlights dangerous areas such as reoccurring naggutiit (cracks in the ice that can be easily crossed), ivujuk (ridges, high areas of rough ice you have to travel around), and siku saattuq aragulimaamik (thin ice all year; Figure 3A). The spring maps show new and expanding dangerous travel areas such as aajurait (leads, cracks in the sea ice that get wider in the spring are always possible to cross), siku saattuq upingaat pigiarningani (thin ice in spring), and imaqainnaujattuq ukiutamaa (water that runs from the glaciers; Figure 3B). These maps provide an IQ-based climatology for the region of Mittimatalik; however, the information on which they are based is not in a database, they exist in the collective memory of Sikumiut members.
Based on the assessment of available sea ice information sources for Mittimatalik we had the following four: (1) Sikumiut's IQ; (2) the CIS charts (1968 to present); (3) RADARSAT 1 and 2 (1997 to present) imagery; and (4) MODIS imagery (2000 to present). The overlapping time period of the available information was from 1997 to 2019, a 23-year time period, slightly less than a standard 30-year climatology. We then began to explore how IQ could interpret and review the satellite and ice chart data to develop a Mittimatalik specific sea ice climatology based on IQ.
Methods
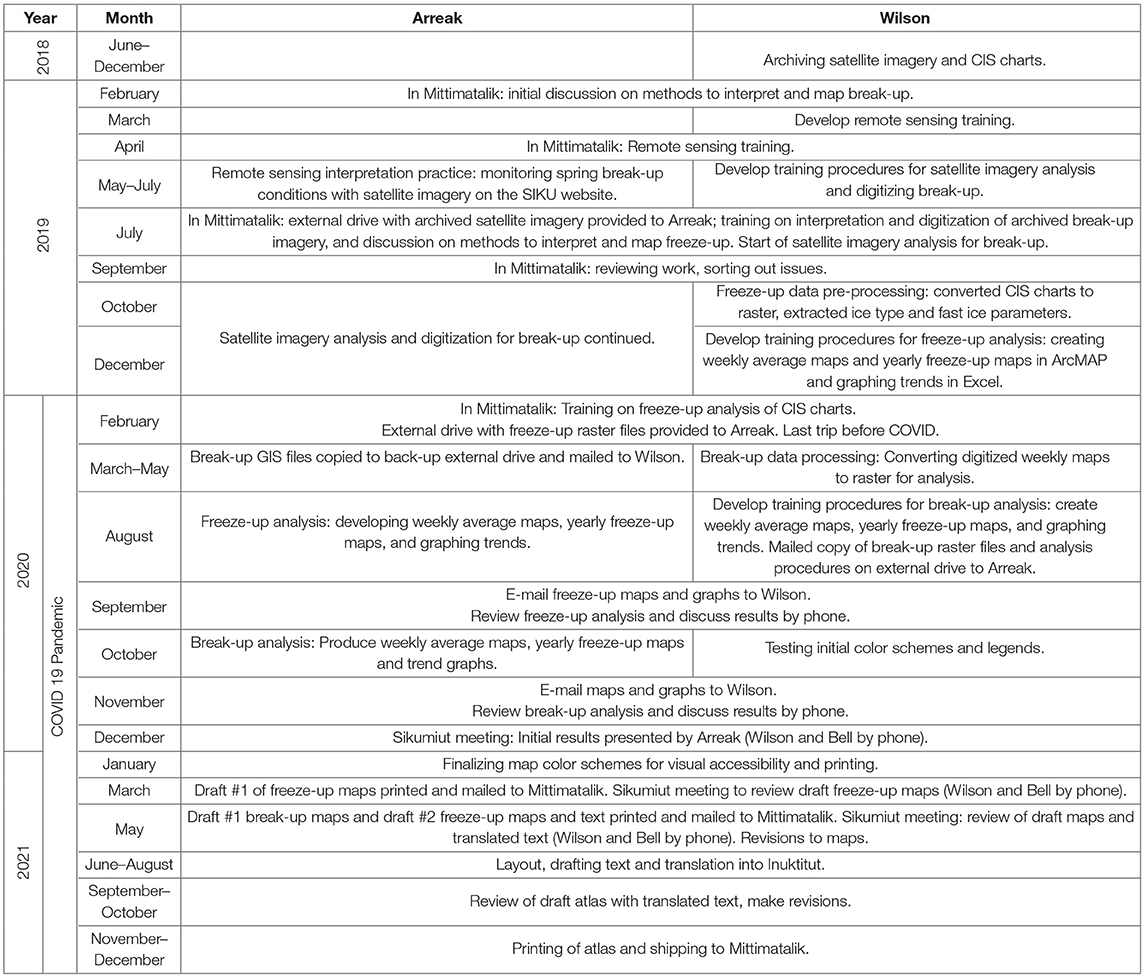
The co-production of the Mittimatalik sea ice atlas occurred over 3 years between 2019 and 2021, as outlined in Table 2. During 2019 a majority of the co-development and training was done in person in Mittimatalik. As the COVID-19 pandemic hit and travel restrictions were implemented, we continued our collaborative work by mailing data to each other on external drives and moving our training, discussions and meetings on-line (Table 2). Bandwidth limitations in the community reduced the use of videoconferencing as a collaboration platform, and a majority of our interactions were by text, telephone and e-mail in 2020 and 2021. This section illustrates our preliminary steps, the development and analysis of the break-up and freeze-up maps, and the process to create maps that were accessible and intuitive for Mittimatalingmiut.
Preliminary Work
In 2018 Wilson began visually reviewing and archiving RADARSAT-1 (1997–2013) and RADARSAT-2 (2009–2019) imagery between October and July. Cloud free MODIS (2000–2019) imagery were visually reviewed between mid-February to the end of October when the region has adequate daylight hours for optical imagery (NASA, 2019). Weekly satellite coverage of the Mittimatalik area averaged 3 per week with RADARSAT data and an additional 2 per week with MODIS data during the freeze-up and break-up periods, totalling ~4,000 images archived. Additionally 500 CIS weekly charts were also archived from the CIS (ECCC, 2021).
Once the data was archived, we began planning training for Arreak to learn how to interpret the satellite imagery. Optical imagery is fairly easy to interpret because it is very similar to a color photograph. However, SAR imagery can be difficult to interpret for untrained users and requires a shift in thinking to understand that these images represent the surface roughness of the earth. For example, dark smooth areas in SAR imagery can commonly be areas of open water and/or smooth sea ice. The goals of this pilot satellite imagery training were two-fold: (1) so Arreak could interpret the satellite imagery using his IQ to map the safe and unsafe sea ice travel conditions around Mittimatalik from 1997 to 2019; and (2) so SmartICE operators could start using publicly available satellite data from SIKU and Polar View on-line platforms in their day-to-day SmartICE operations (Polar View, 2019; Arctic Eider Society, 2020).
In April 2019, a 4-day satellite interpretation training session was held in Mittimatalik to pilot this training with Arreak and two other Inuit SmartICE operators from Qikiqtarjuaq (Jenny Mosesie) and Arviat (Robert Karetak) (Wilson et al., 2020). This training was then put into practice between May and July with the three SmartICE operators monitoring their regions in near real-time during the 2019 sea ice break-up season by accessing the satellite imagery on the SIKU website (Table 2).
Break-Up Maps
Arreak and Wilson began co-developing the IQ-based sea ice climatology methods in February 2019 (Table 2). We began by looking at the spring and early summer satellite imagery together to understand what sea ice features could be identified in the imagery, and what was important from an Inuit perspective to capture in the imagery.
The interpretation of sea ice in satellite imagery for charting is based on an international standard established by the World Meteorological Organization (WMO). The Manual of Standard Procedures for Observing and Reporting Ice Conditions (MANICE) defines and describes the navigational terms for sea ice (ECCC, 2005). The MANICE terms evolved primarily by identifying sea ice from a bird's eye view using aircraft and helicopters from the 1960's to 1990's, and since the late 1990's using predominantly satellites. We reviewed Sikumiut's sea ice terms to determine if we could use Inuit specific ice types instead of the MANICE ice types to classify the satellite imagery. It was difficult to identify these specific ice types during break-up at the resolution of the MODIS (250 m) and RADARSAT ScanSAR Wide (100 m) imagery. While the MANICE terms evolved from above looking down at the sea ice surface, the Inuktitut sea ice terms evolved from traveling on the sea ice, at a scale of <1 m (Wilson et al., in press). The spatial scales of the Sikumiut sea ice terms did not align with the scale of the available satellite imagery. We then discussed classifying the imagery using the MANICE sea ice types since they were at the scale of the satellite imagery, however for break-up the MANICE types do not indicate the stage of melt or break-up. For example, ice that is classified as thick first year ice in May, will remain this ice type until the area completely melts and becomes open water.
Ice charts describe sea ice conditions using a numeric code called “the egg code” (ECCC, 2005). Numbers are used in the egg code to eliminate language barriers in the polar navigational community. Polygons are drawn on the satellite imagery around homogenous areas of sea ice and the numeric egg code describes up to three sea ice types, their concentrations (expressed in tenths) and floe sizes within the polygon (Figure 4A). Using these eggs codes, captains navigate through ice-free, or lower concentrations of ice, avoiding higher concentrations of moving ice dangerous for navigation. Estimating sea ice concentrations for the Mittimatalik climatology was also discussed. For example, break-up is often based on when ice concentrations, are <5/10ths (Archer et al., 2017; Segal et al., 2020b). Arreak did not feel that 5/10th concentration was a useful threshold to determine break-up in Mittimatalik. Break-up in the area does not occur all at once, it occurs in different areas and at different times, and is often linked to the stability of the sinaangit.
What Arreak felt was climatologically important to map were locations of rough sea ice, aajurait, sinaagnit, and areas of sea ice breakup that were no longer safe for travel (open water and/or areas with numerous breaks in the ice). We first looked at roughness, as SAR imagery has been used to develop sea ice surface roughness maps for Inuit travel (Segal et al., 2020a). However, when traveling on the ice, areas in the SAR image that are rough can actually be smooth for sea ice travel with sufficient snow cover. In the spring, as puddles and melt ponds form on the sea ice, the presence of water dominates the SAR backscatter resulting in smooth areas on the SAR image, masking the ice surface underneath. For the purpose of this historical analysis, we were concerned that ice roughness would be overestimated in winter and underestimated during spring melt. Therefore, we removed sea ice roughness as a parameter and focused on mapping aajurait, sinaagnit, and areas of break-up. The latter were defined as areas that were no longer safe for travel. The break-up areas could include open water, melting sea ice and/or areas with multiple aajurait, which would no longer be safe to travel on.
Wilson used the CIS climatology methods as initial inspiration for the Mittimatalik climatology. Using the same climatological weeks as the CIS, Arreak reviewed and interpreted the satellite data for each week. Arreak was trained using ArcMap 10.5 Geographic Information Systems (GIS) software to digitize the weekly locations of aajurait, sinaagnit and areas of break-up. Arreak spent half of his time over 6 months (Table 2) interpreting the imagery and digitizing maps. Arreak interpreted each week of the archived satellite data from late May until early August to create 10 weekly maps per year. This weekly analysis for break-up was repeated for each year from 1997 to 2019 (23 years), to create 230 weekly maps, analyzing ~2,000 satellite images in total.
As Arreak and Wilson reviewed the satellite data, they made notes detailing:
• the dates when the snow melted, and when the sea ice became visible in the MODIS imagery;
• when areas of open water on the sea ice first became visible in the MODIS and RADARSAT imagery; and
• the final break-up dates for the Tursukattak and Navy Board sinaangit as detected in the MODIS and/or RADARSAT imagery (±2 days).
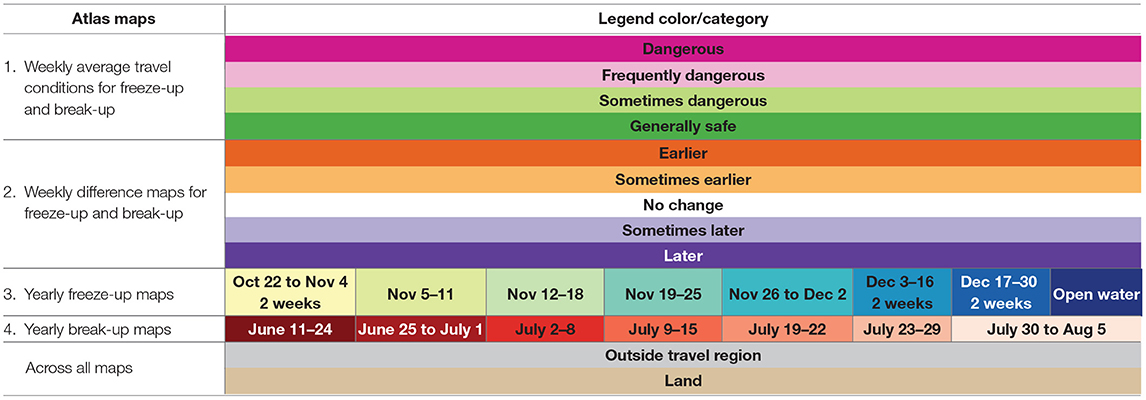
The RADARSAT SCW data was block averaged to reduce speckle for interpretation, reducing the resolution to 200 m. The MODIS imagery was interpreted with a resolution of 250 m. Wilson converted the weekly break-up polygons to raster in ArcMAP with a cell size of 500 m2. Each cell in the maps were assigned a value of 1 for break-up and 0 for tuvaq. Training focused on ArcMap spatial analysis tools to create weekly and yearly maps of average ice conditions, and to compare differences between years. Arreak developed weekly average break-up maps by adding together all the maps for the same climatological week over the 23-year record (1997–2019). The summed values provided an indication of how often break-up occurred in this cell over the 23-year record. For example, if the summed value was equal to 18, this meant that break-up occurred in this particular cell 18 times out of 23 years, or 78% of the time. The categories in the weekly maps were developed to indicate the following safe travel conditions: (1) dangerous; (2) frequently dangerous; (3) sometimes dangerous; and (4) generally safe (Table 3). The total area of break-up was calculated to determine and compare how much of the Mittimatalik region was breaking up each week. These percentages were exported to Microsoft Excel and Arreak generated graphs to analyse trends and variability in Mittimatalik's sea ice conditions over 23 years. Wilson performed linear regressions and tested the regressions for statistical significance.
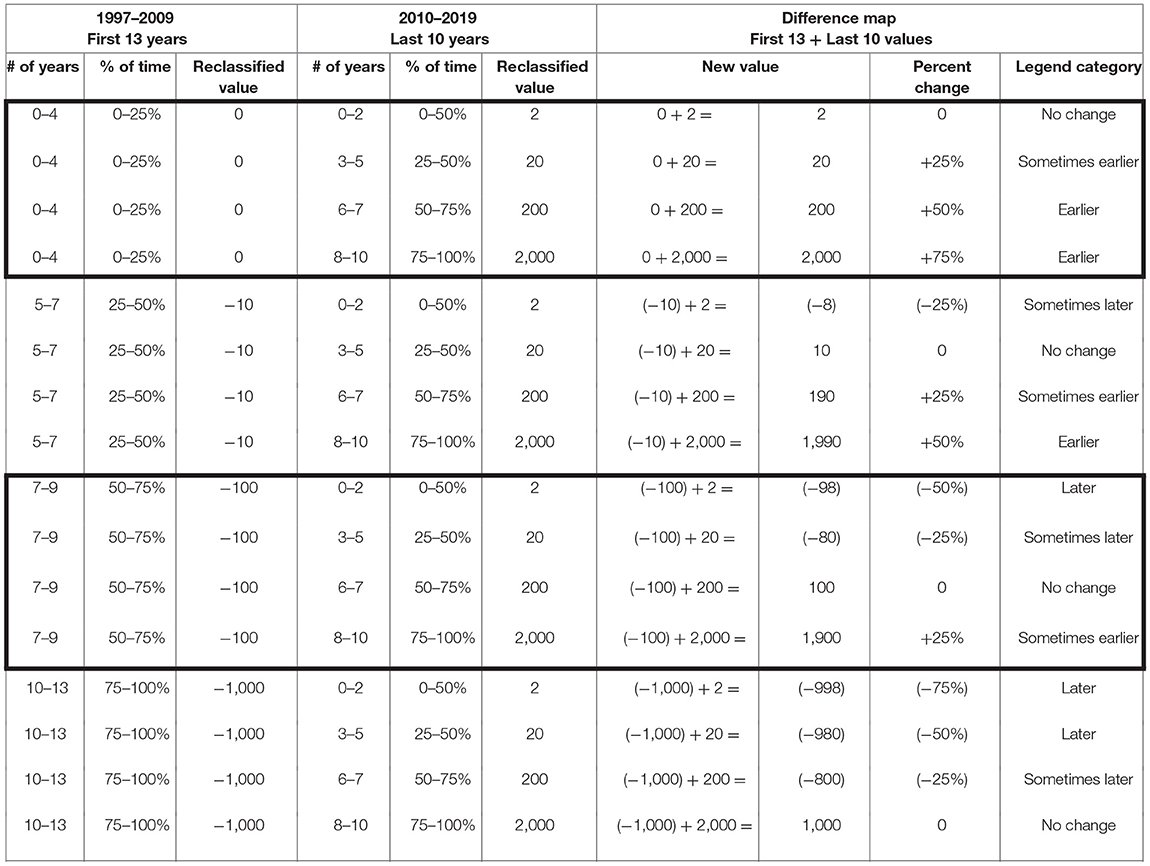
Sikumiut had mentioned on several occasions that the greatest change in sea ice has occurred in the last decade. While graphs can indicate trends and variability in break-up over the years, we wanted to develop maps to understand where break-up was occurring earlier. Using the same procedures for the weekly frequency of break-up maps, Wilson summed the maps for the same climatological weeks for the first 13 years (1997–2009) and the last 10 years (2010–2019). These maps were reclassified into four categories based on how often break-up was occurring in the area in the two separate time periods: 0–25% of the time; 25–50% of the time; 50–75% of the time; and 75–100% of the time (Table 4). The two reclassified time period maps were then added together to produce unique cell values that were grouped into 5 categories to indicate where break-up has changed the most during the last 10 years: earlier; sometimes earlier; no change; sometimes later; and later (Table 4).
Freeze-Up Maps
Post-analysis of sea ice freeze-up in the MODIS and RADARSAT satellite imagery proved challenging. It was difficult to historically map the fluid and dynamic sea ice conditions that moved with the winds and ocean currents until they consolidate in early winter (Figure 4B). We again looked to the weekly CIS charts, as they were created using satellite data and meteorological observations in near-real time (Figure 4A). We discussed using the ice charts concentrations as a way to classify freeze-up, based on a threshold of concentrations >5/10ths (Archer et al., 2017; Segal et al., 2020b). Again, what Arreak felt was most important to know during freeze-up was when the sea ice was safe to travel on, and when the sinaagnit were forming, the 5/10ths threshold did not convey this information. We also looked at the MANICE ice types to infer the thickness of the sea ice. For example, estimating ice types >1 foot (30 cm) as safe for travel. While some hunters are experienced and knowledgeable to travel on newer ice types, for most community members safe travel is considered possible once the ice becomes tuvaq (Wilson et al., in press).
The CIS charts do code tuvaq once first-year ice concentrations reach 9+ and 10/10ths (Figure 4A). As a result, we used the CIS weekly ice charts over a 13-week period between October and December to capture Mittimatalik freeze-up. Historically, ice chart production ceased for the Mittimatalik region near the end of November as the sea ice froze and ships left the region, therefore there are no weekly ice charts available for the month of December between 1997 and 2005. With improved satellite coverage starting in 2006, the CIS began producing weekly charts into the winter months. Benoit Montpetit (ECCC Wildlife S&T Branch) developed scripts for us to extract the landfast ice polygons from the charts and convert to raster. Each cell in the maps were assigned a value of 1 for tuvaq and 0 if it wasn't tuvaq. The production of freeze-up average weekly maps, difference maps, yearly maps and trends and variability analysis followed the same steps as for break-up.
Accessible Atlas Colors and Legends
As the siku asijjipallianinga was going to be something completely new for Mittimatalingmiut, it was important to develop maps that were intuitive, culturally accessible, and distinct by season and map type. We spent several months testing different color schemes for the maps in the atlas. Certain colors tend to be intuitive, for example green for safe, red for dangerous and blue for water. Red and green diverging colors were not used in the same map out of considerations for people with color blindness. Red and blue, pink and green, and purple and orange are recommended contrasting colors for color accessibility (Brewer et al., 2002). We tested using red for dangerous conditions and blue for safer conditions in the weekly average travel freeze-up maps. However, for Inuit, dangerous sea ice travel conditions are often because of open water, so using blue to indicate safer travel conditions was counter intuitive. We reached consensus on using the contrasting colors of green to indicate safer travel conditions and pink for more dangerous travel conditions for the weekly average travel maps.
With 6 different maps in the atlas we were concerned that having 6 different legends would be confusing for users. For the weekly average travel maps, we tested and refined using green for safer travel conditions and pink for more dangerous travel conditions in order to have the same color scheme for freeze-up and break-up (Table 5). The categories in the weekly maps were also developed so they could be used in both the freeze-up and break up maps (Tables 3, 5). For the difference maps, we also tested a color scheme that could be used for both the freeze-up and break-up. Orange to indicate earlier freeze-up or break-up, and purple to indicate later freeze-up or break-up (Table 5). Once again, the categories in the difference maps could be used for both freeze-up and break-up: (1) earlier; (2) sometimes earlier; (3) no change; (4) sometimes later; and (5) later (Table 5).
For the yearly maps, a sequential color scheme was more intuitive and preferred by all. For enough contrast in viewing and printing sequentially colored maps, no more than 6 shades of the same color are recommended (Brewer et al., 2002). We selected a red sequential color scheme for break-up so red could indicate dangerous travel areas (Table 5). Arreak initially digitized 10 weeks for break-up, but in the end, we found that negligible break-up occurred in the first 3 weeks (May 28 to June 27) of the record, so these 3 weeks were removed. In the end, yearly break-up maps in the atlas represent 7 weeks, between June 18 and August 5; from 1997 to 2019 (Table 5). We could not reduce the number of weeks to six to meet printing recommendations, but in reviewing the printed maps, we felt there was sufficient contrast for the 7 weeks.
The yearly freeze-up maps initially showed freeze-up over 13 weeks, too many classes for a single color scheme. Negligible freeze-up occurred between October 1 and 21 over the record, so these 3 weeks were removed. Very little change in freeze-up also occurred during the following 2-week periods of (1) October 22 to November 4 when freeze-up is just starting; (2) December 4–16; and (3) December 17–20 when the sea ice growth slows as it consolidates. These three, 2-week periods were merged reducing the number of classes for the yearly freeze-up maps to eight (Table 5). A sequential three-color scheme used yellow for late October; green for November; blue for December; and dark blue for remaining areas of open water at the end of December (Table 5; Brychtová et al., 2015). For the freeze-up and break-up yearly maps, the lightest colors indicate the areas in which sea ice is present for the longest period of time and the darkest colors where sea ice was present for the shortest amount of time.
Finally, we also wanted to ensure that each color was used only once for consistency across all the maps, for example not using blue for ice in one map and blue for water in another map. Although not perfect, considerable effort was put into selecting the colors and developing the legends to reduce the number of legends from 6 to 4 and to ensure they were accessible and culturally intuitive for Mittimatalingmiut (Table 5). Sikumiut reviewed the maps and legends at meetings in December 2020, March and May 2021 (Figure 3B). During these meetings we also discussed what we would call this sea ice climatology in Inuktitut. Sikumiut decided on the “Mittimatalik siku asijjipallianinga” (changes of the sea ice).
Results
The Mittimatalik siku asijjipallianinga project includes the following 14 products to capture the sea ice climatology for the community between 1997 and 2019. Samples of these products are illustrated below (Figures 4–15) as we review the averages, trends, and variability in the sea ice freeze-up and break-up seasons over the 23-year climatology.
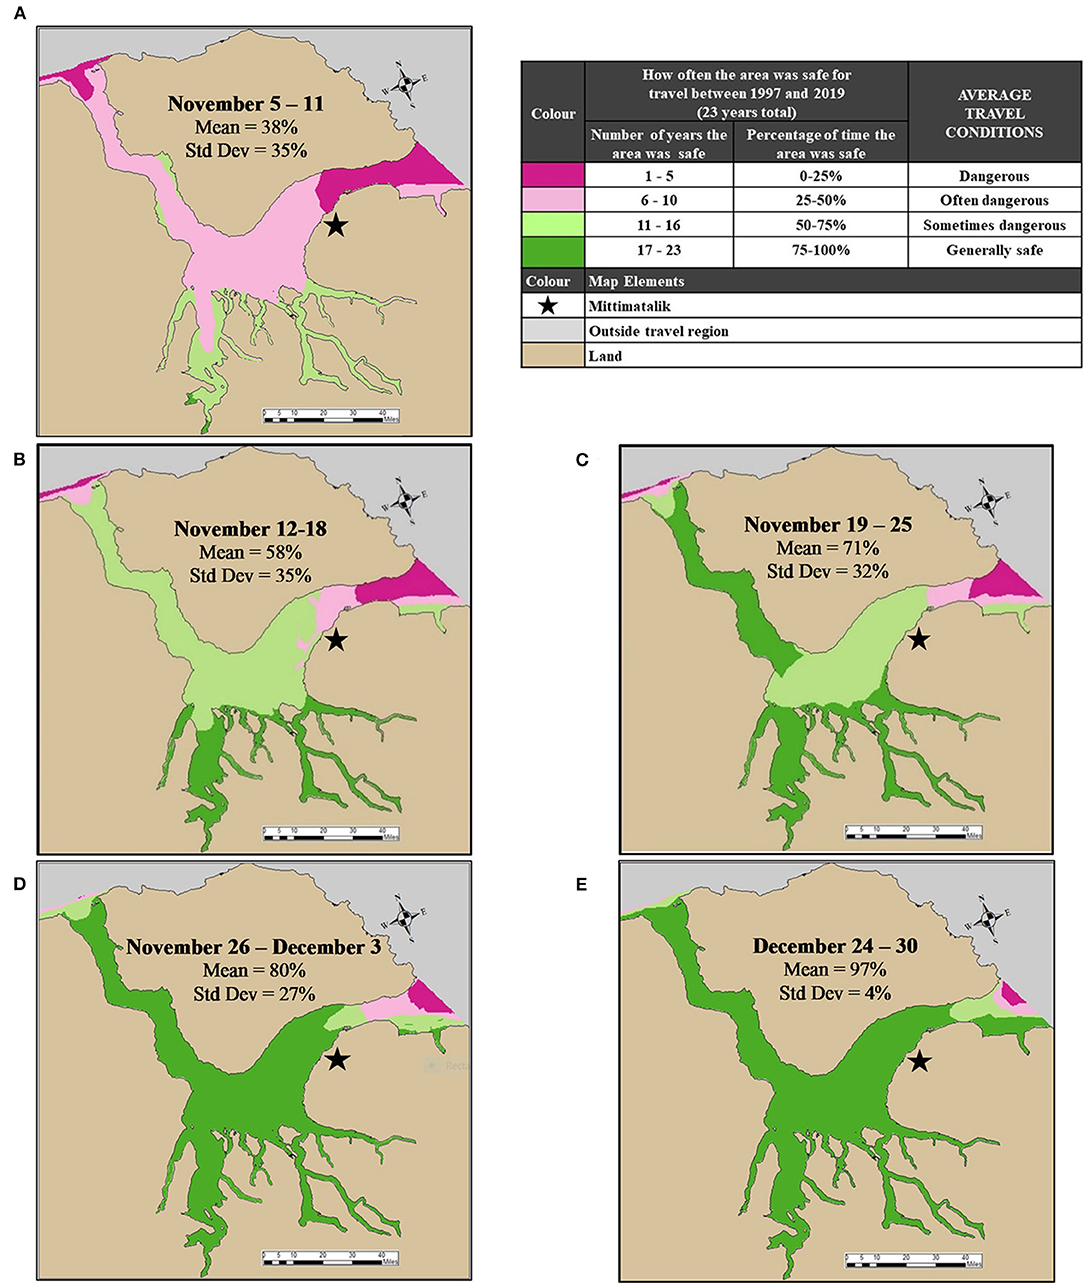
Figure 5. Weekly average tuvaq maps showing freeze-up for the Mittimatalik region, 1997–2019. (A) Average tuvaq, November 5–11. (B) Average tuvaq, November 12–18. (C) Average tuvaq, November 19–25. (D) Average tuvaq, November 26–December 3. (E) Average tuvaq, December 24–30.
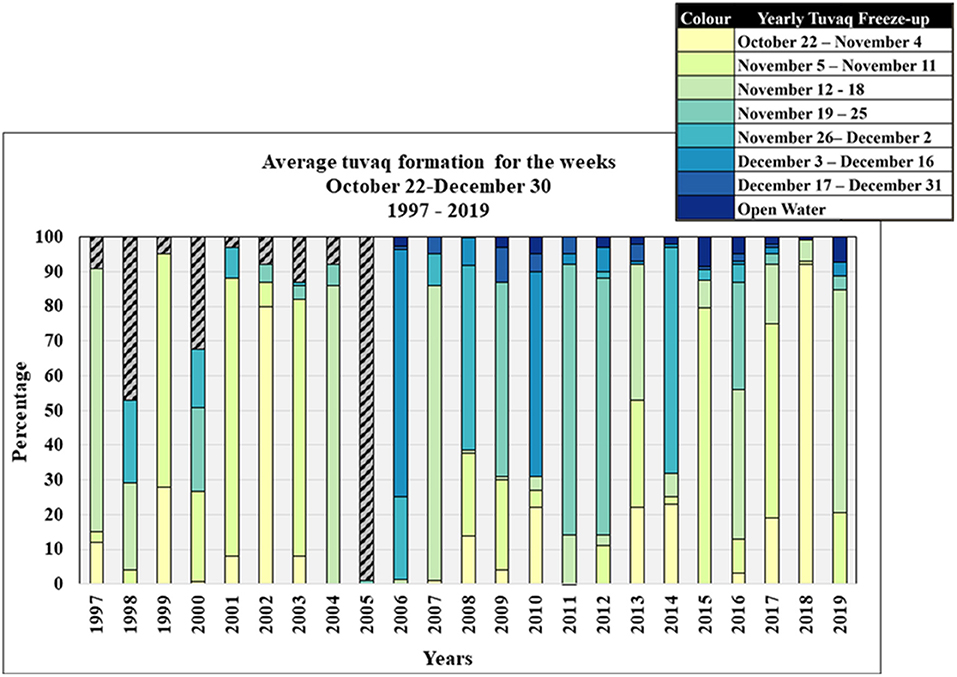
Figure 6. Summary graph of average tuvaq formation for freeze-up, 1997–2019. Each bar is a year showing the weekly percentage of tuvaq freeze-up by color: yellow for late October; green for November; blue for December; and dark blue for remaining areas of open water at the end of December. Years with more blue represent the late formation of tuvaq. Years with more yellow represent the early formation of tuvaq.
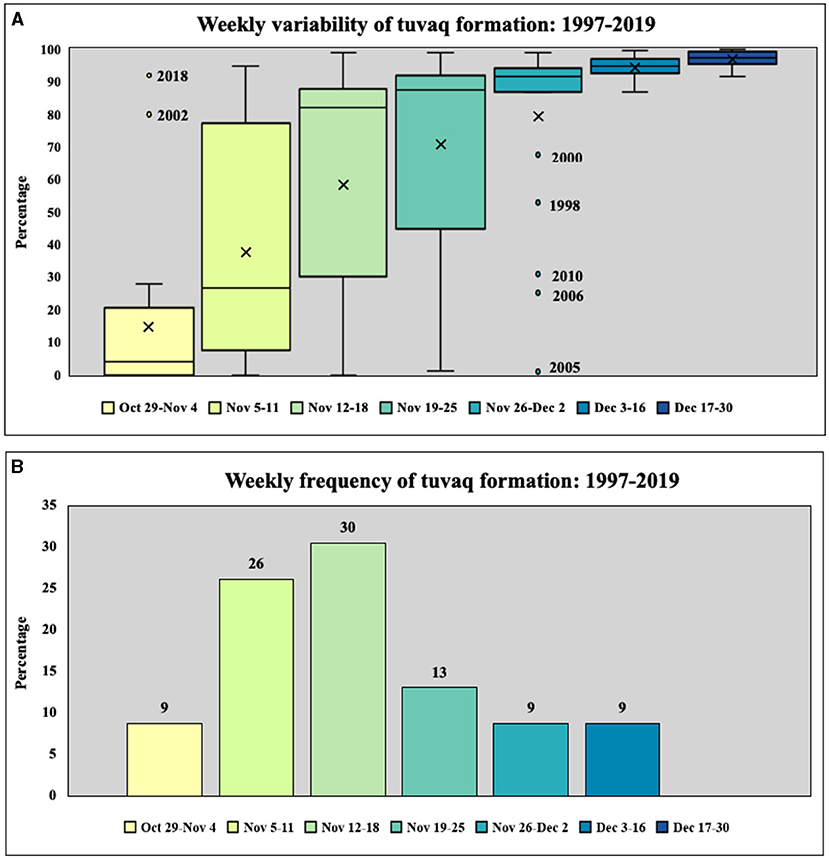
Figure 7. (A) Summary graph of the weekly variability in tuvaq formation for freeze-up, 1997–2019. The box outlines the interquartile range, the average range in the variability of tuvaq formation for a particular week over the 23-year period (1997–2019). The line through the box is the median and the X denotes the mean. The vertical “whisker” lines show the minimum and maximum values. The dots correspond to outliers, or years with unusual tuvaq percentages. (B) Weekly frequency of tuvaq formation, 1997–2019.
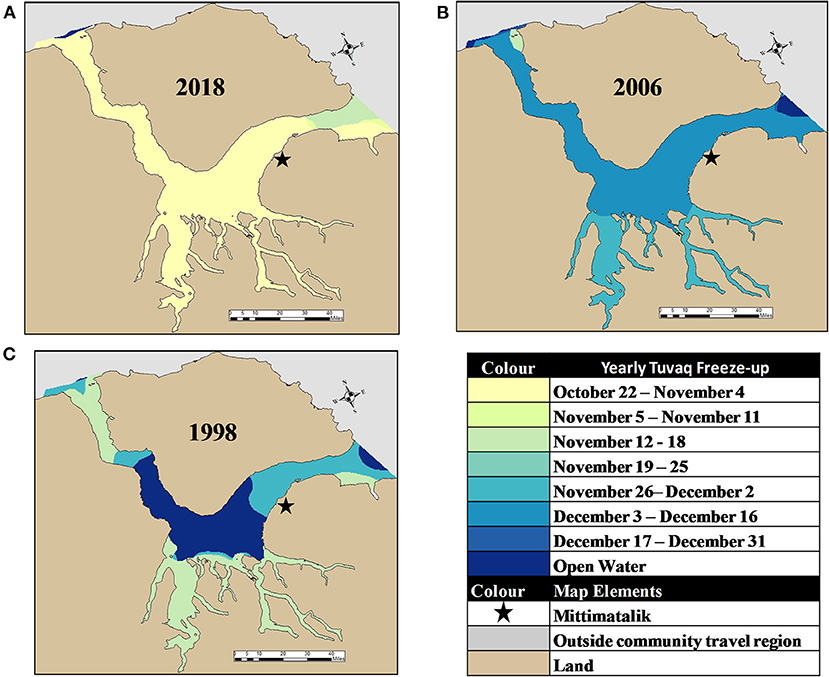
Figure 8. Yearly maps showing the spatial formation of tuvaq for the Mittimatalik region. (A) Example from 2018 showing the weekly freeze-up spatial pattern during years when the tuvaq formation was unusually early. (B) An example from 2006 showing of the weekly freeze-up spatial pattern during years when the tuvaq formation was unusually late. (C) The one exception to the normal freeze-up pattern in 1998 when tuvaq formed last in Eclipse Sound.
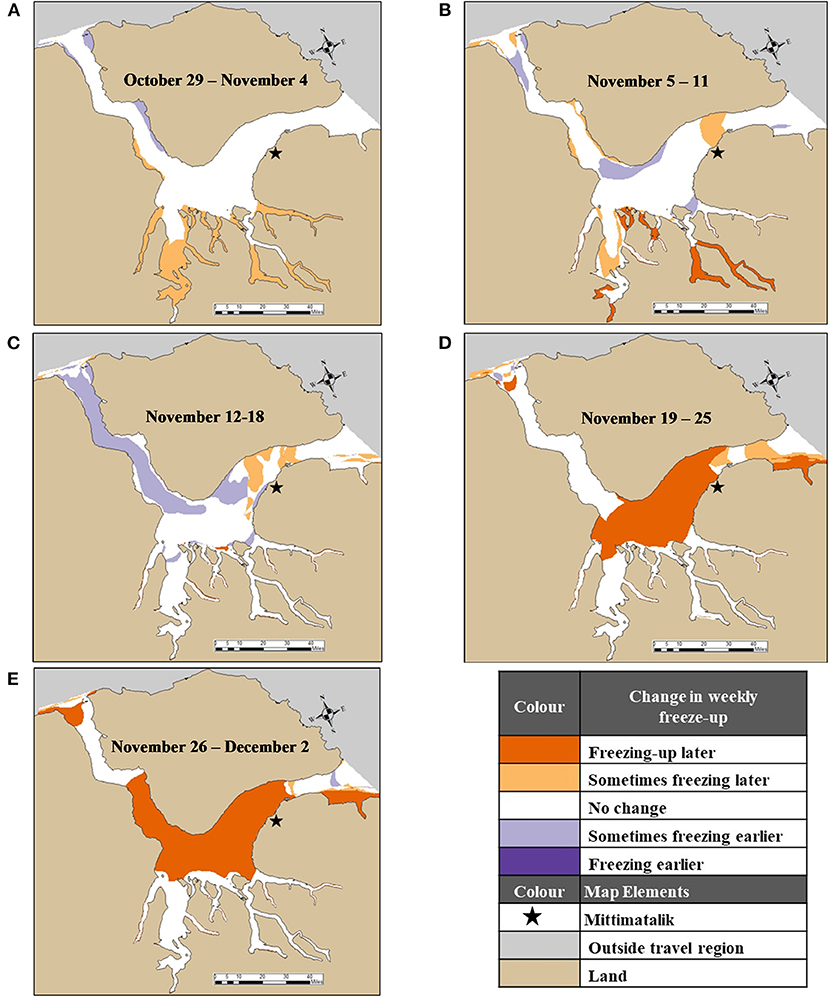
Figure 9. Weekly difference maps showing areas where tuvaq is forming earlier or later in the last 10 years (2010–2019). (A) Difference map, October 29–November 4. (B) Difference map, November 5–11. (C) Difference map, November 12–18. (D) Difference map, November 19–25. (E) Difference map, November 26–December 3.
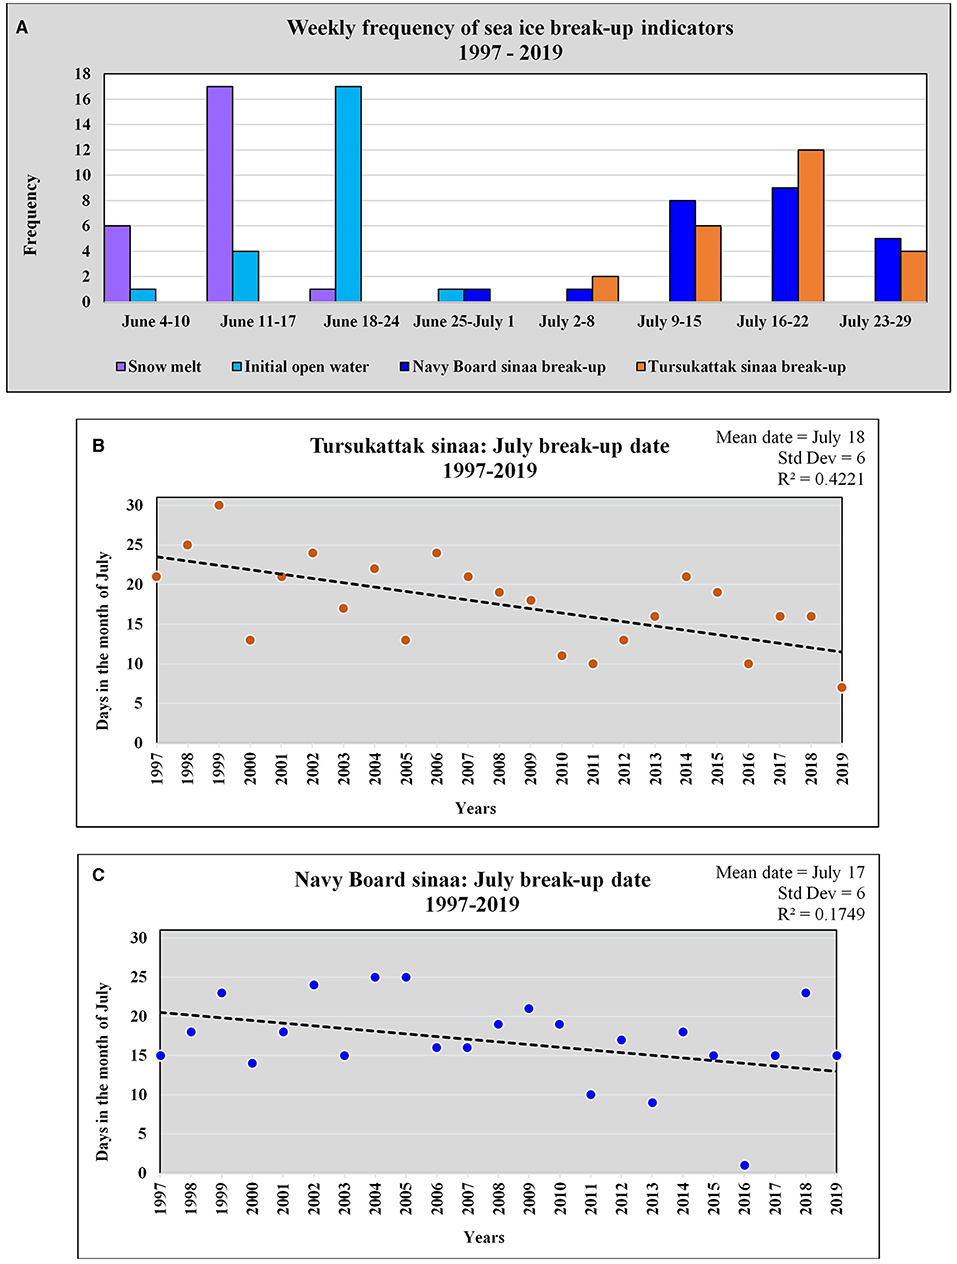
Figure 10. (A) Frequency graph for indicators of break-up, 1997–2019. (B) Graph showing the Tursukattak sinaa July break-up dates, 1997–2019. (C) Graph showing the Navy Board sinaa July break-up dates, 1997–2019.
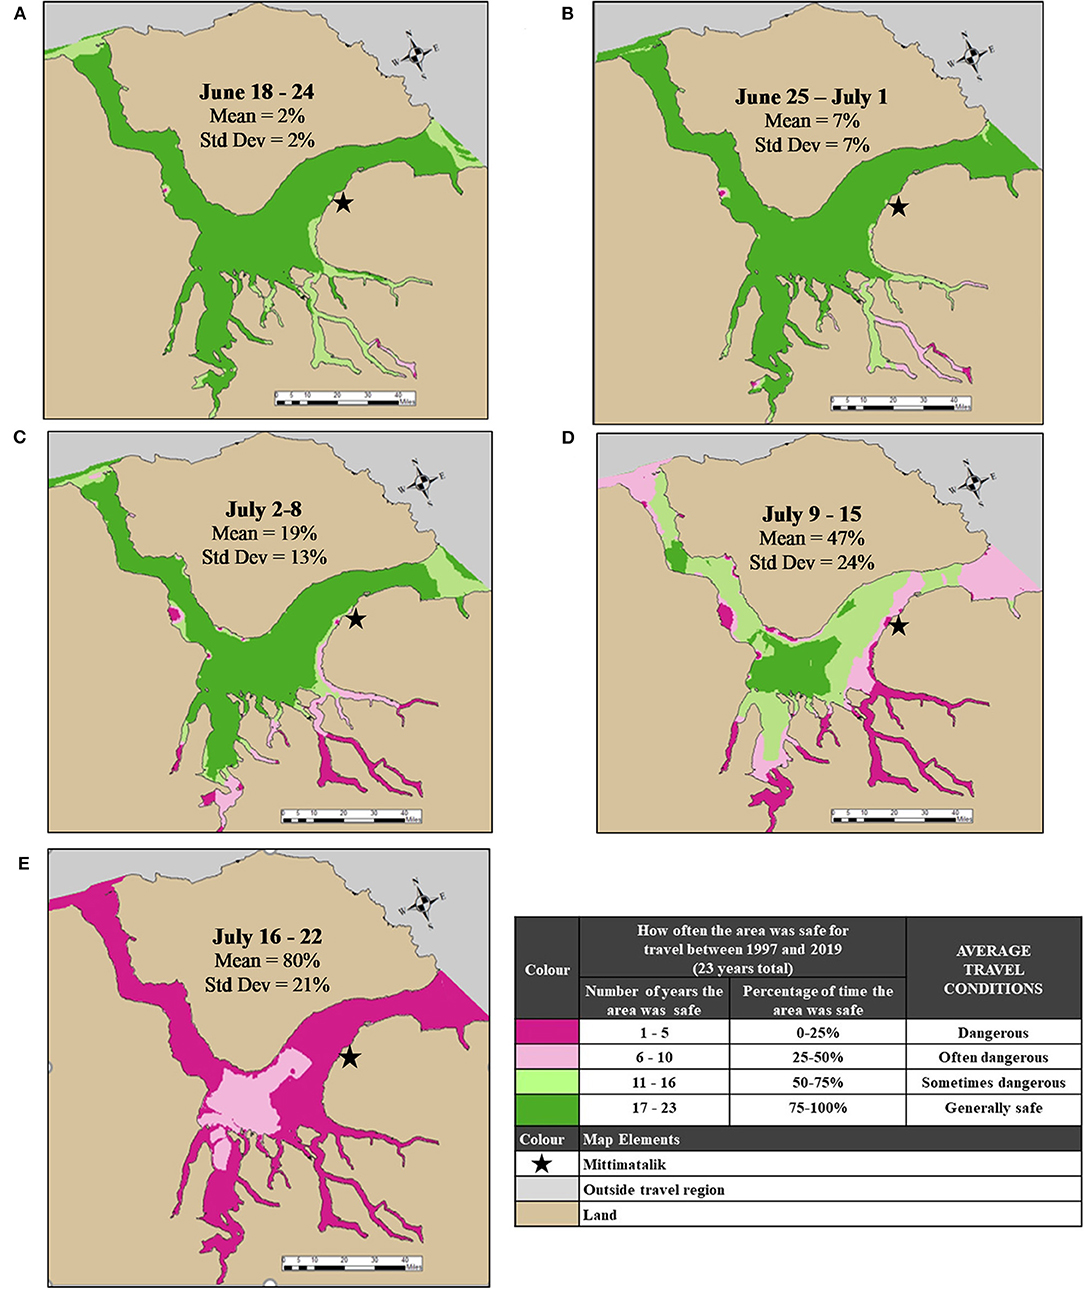
Figure 11. Maps showing weekly average break-up conditions June 18 to July 22, 1997–2019. (A) Average break-up, June 18–24. (B) Average break-up, June 25–July 1. (C) Average break-up, July 2–8. (D) Average break-up, July 9–15. (E) Average break-up, July 16–22.
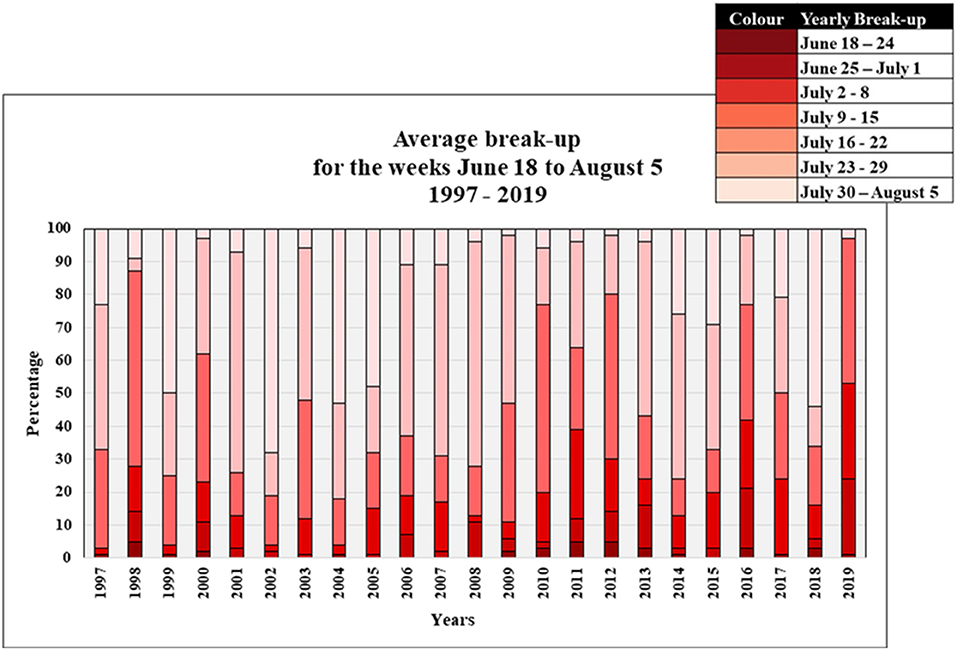
Figure 12. Summary of average break-up between June 18 to Aug 5, 1997–2019. Each bar is a year showing the weekly percentage of break-up by color: dark red for late June; medium red for early July; and light red for the end of July. Years with darker red represent years that broke-up early. Years with more light red represent years that broke-up late.
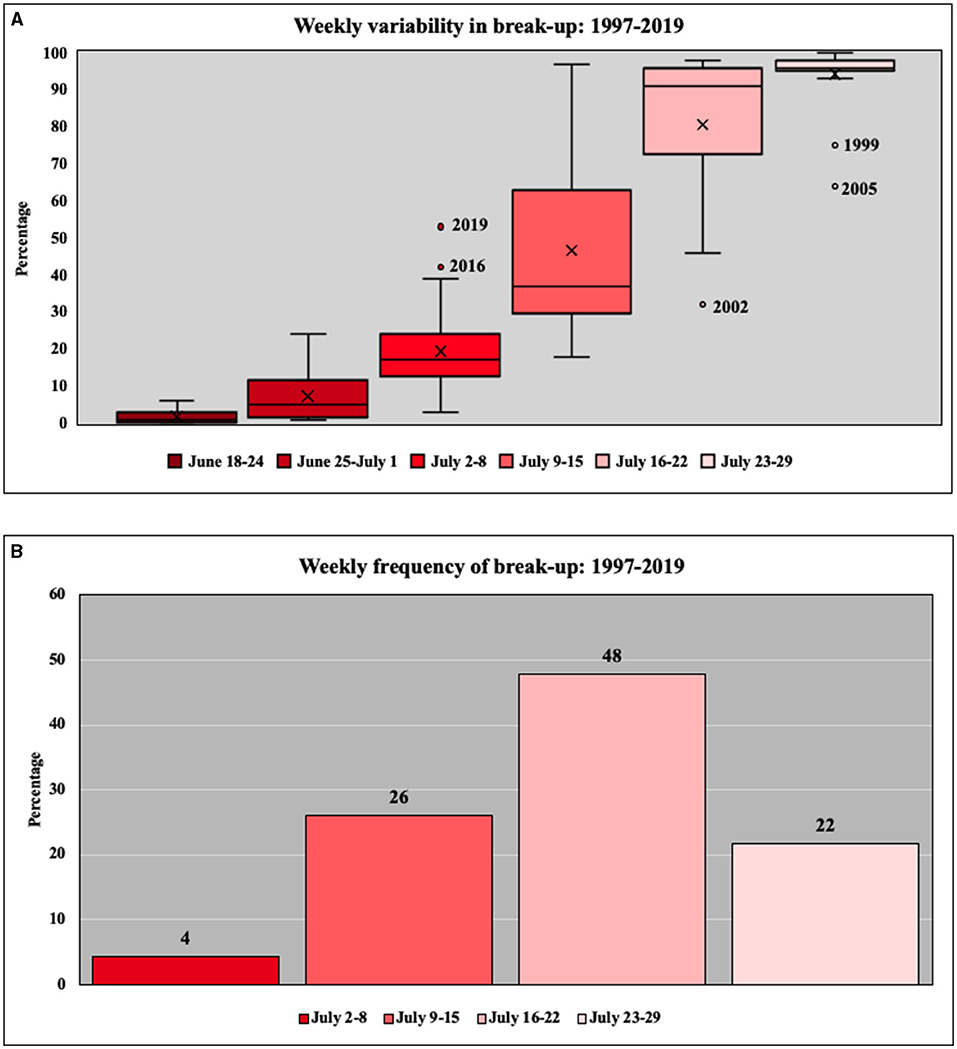
Figure 13. (A) A summary of the weekly variability in break-up from 1997 to 2019. The box outlines the interquartile range, the average range in the variability of break-up for each week over the 23-year period (1997–2019). The line through the box is the median and the X denotes the mean. The vertical “whisker” lines show the minimum and maximum values. The dots correspond to outliers, or years with unusual break-up percentages. (B) Weekly frequency of break-up, 1997–2019.
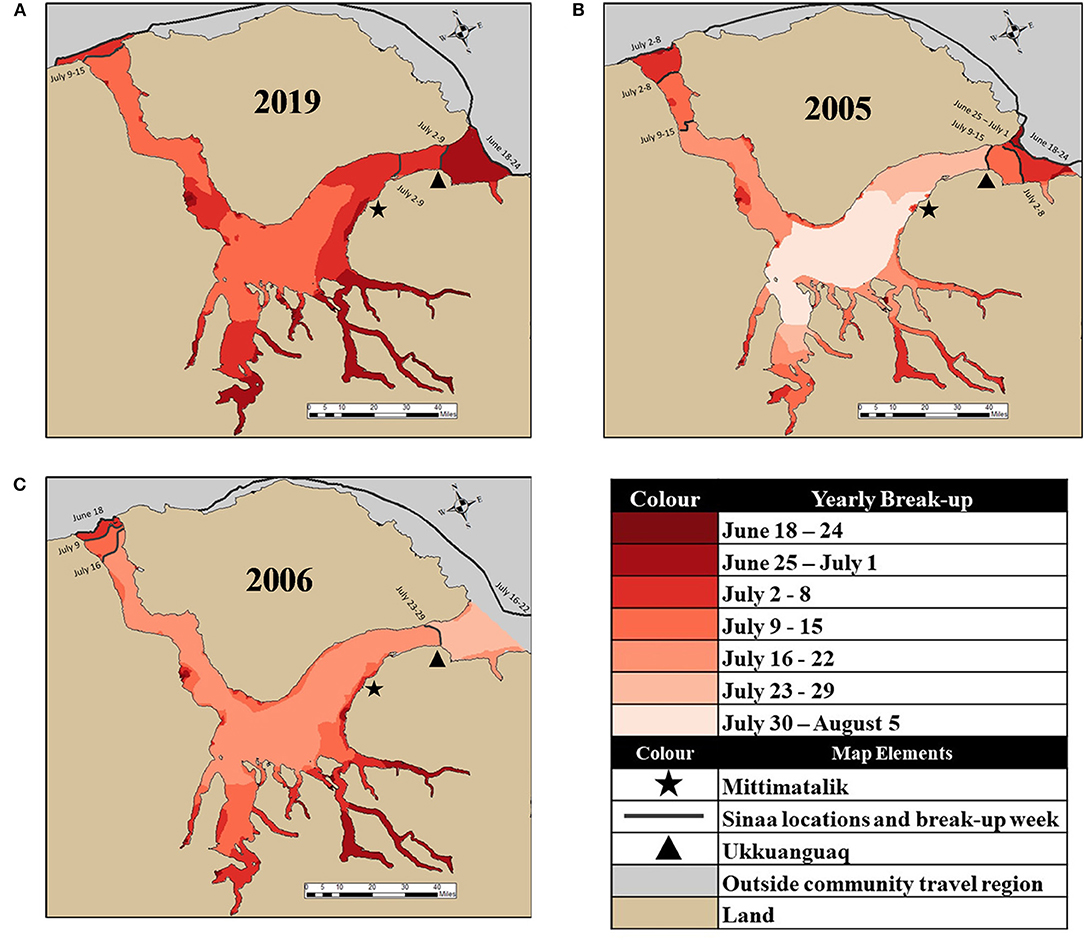
Figure 14. Yearly maps showing the spatial break-up of sea ice for the Mittimatalik region. (A) Example from 2019 showing the weekly spatial pattern for an unusually early break-up. (B) Example from 2005 showing the weekly spatial pattern for an unusually late break-up. (C) Example from 2006 showing the weekly spatial pattern when the sea ice at the Tursukattak sinaa breaks last.
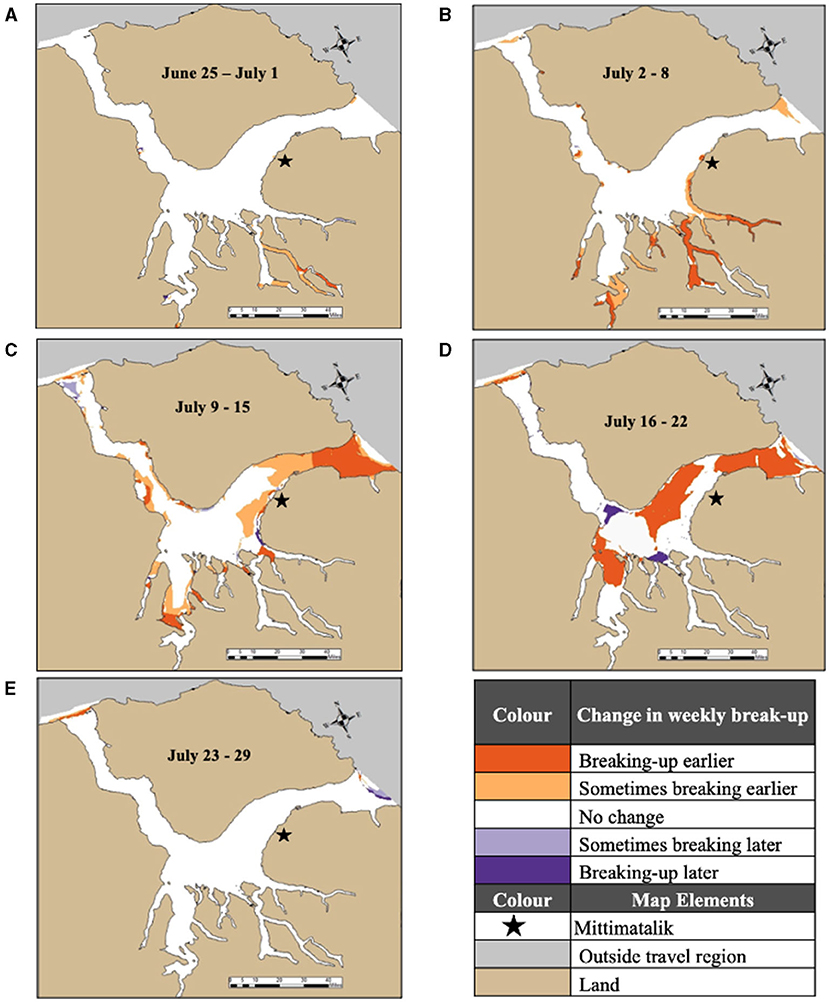
Figure 15. Weekly difference maps showing areas where break-up is occurring earlier or later in the last 10 years (2010–2019). (A) Difference map, June 25–July 1. (B) Difference map, July 2–8. (C) Difference map, July 9–15. (D) Difference map, July 16–22. (E) Difference map, July 23–29.
Freeze-up, October 22 to Dec 20, (1997–2019):
1) Ten weekly average tuvaq maps (e.g., Figure 5)
2) Summary graph of average tuvaq formation by week (Figure 6)
3) Summary graph showing the weekly variability in tuvaq formation (Figure 7A)
4) Summary graph illustrating the weekly frequency of tuvaq formation (Figure 7B)
5) Twenty-three maps showing the spatial formation of tuvaq for each year (e.g., Figure 8)
6) Six weekly difference maps showing areas where tuvaq is forming earlier or later in the last 10 years (e.g., Figure 9)
Break-up, June 18 to July 29, (1997–2019):
7) Frequency graph illustrating the key indicators for break-up (Figure 10A)
8) Graphs of the Navy Board and Tursukattak sinaangit average break-up dates (Figures 10B,C)
9) Six weekly average break-up maps (e.g., Figure 11)
10) Summary graph of average break-up by week (Figure 12)
11) Summary graph highlighting the weekly variability in break-up (Figure 13A)
12) Summary graph illustrating the critical weeks for break-up (Figure 13B)
13) Twenty-three maps showing spatial break-up of sea ice for each year (e.g., Figure 14)
14) Six weekly difference maps showing areas where the sea ice is breaking up earlier or later in the last 10 years (e.g., Figure 15).
Freeze-Up Results
For the week of November 5–11, there is an average of 38% (std dev 35%) tuvaq in the region with initial areas of tuvaq forming in the southern inlets and sounds; however, the sea ice is not normally safe for community travel (Figure 5A). By the weeks of November 12–18 and 19–25, tuvaq formation averages 58–71% (std dev 35–32%), both sinaangit are establishing in Navy Board and Tursukattak, and normally the sea ice is safe for Mittimatalingmiut to travel in the southern inlets and sounds (Figures 5B,C). While the sea ice in Navy Board Inlet is generally safe for travel on by November 19–25, it is normally inaccessible until the formation of tuvaq in Tasiujaq. On average, tuvaq increases to 80% (std dev 27%) during the week of November 26-December 3 and Mittimatalingmiut are normally able to travel from the community west into Tasiujaq (Figure 5D). By the week of December 24–30, the region averages 97% (std dev 4%) tuvaq and Mittimatalingmiut are normally traveling to the Tursukattak sinaa (Figure 5E).
While freeze-up may be occurring later in other areas of the Arctic, we found no significant trends in the weekly formation of tuvaq between 1997 and 2019. These negligible trends are a result of the high variability in the formation of tuvaq during freeze-up between 1997 and 2019 (Figure 6). However, this variability is high only for particular weeks during freeze-up. The initial freeze-up week of October 29 to November 4 shows moderate variability, with an inter-quartile range (IQR) of 21% (Figure 7A). The outliers correspond to the years of 2002 and 2018 that had unusually high percentages of tuvaq early in the ice season (80 and 92%, respectively; see Figure 8A for the 2018 map). The subsequent 3 weeks show the largest variability in tuvaq formation: November 5–11 with an IQR of 70%; November 12–18 with an IQR of 58%; and November 19–25 with an IQR of 47%. Later into the freeze-up season, this variability decreases significantly with an IQR of 4–7% for the weeks of November 26 to December 2, December 3–16, and December 17–20. The week of November 26 to December 2 had five outlier years corresponding to 1998, 2000, 2005, 2006, and 2010, in which tuvaq formation was unusually late. The 2005 freeze-up season had only 1% tuvaq by this week and the 2006 season had the second lowest percentage of tuvaq at 25% (see Figure 8B for the 2006 map).
A visual analysis of the yearly tuvaq freeze-up maps showed no spatial differences in where the tuvaq and sinaangit formed initially, or their subsequent expansion in early, average or late freeze-up years. While there is large variability for when the sea ice freezes, the spatial patterns for progressive expansion of tuvaq and sinaangit were highly consistent throughout the climatology. The weekly average maps (Figure 5) capture this consistent spatial pattern of freeze-up for all years except 1998 when tuvaq formed last in Tasiujaq (Figure 5; see Figure 8C for 1998 map).
To understand which weeks were critical for tuvaq formation during freeze-up, those with the highest percentages of tuvaq formation were tabulated for each year from 1997 to 2019 (Figure 7B). The weeks with the highest frequency of tuvaq formation were November 5–11 (26%) and November 12–18 (30%). Together, these 2 weeks comprise on average 56% of the annual formation of tuvaq and highlight the importance of this freeze-up period in early November.
The weekly difference maps show the spatial change in tuvaq within the last 10 years (Figure 9). The week of November 5–11 shows that tuvaq is forming earlier in some of the southern inlets and sounds (Figure 9A). The weeks of November 19 to December 2 show that tuvaq has been freezing up earlier in Tasiujaq and into Navy Board Inlet (Figures 9D,E). These results are counter intuitive to our expectations. Because we are mapping immobile tuvaq, this earlier freeze-up cannot be due to an increase of imported ice. Sikumiut were also perplexed to see freeze-up happening earlier in certain areas and during certain weeks, as this does not align with their IQ. It would be interesting to have Inuit map the freeze-up of sea ice in real-time to compare with the CIS charts to understand if there are differences in how Inuit and the CIS would interpret tuvaq freeze-up.
Break-Up Results
The start of the break-up season begins with snowmelt on land. Snowmelt increases local river runoff, flooding and melting the sea ice at the mouths of rivers. The onset of snowmelt was detectable in the MODIS imagery in 17 of 23 years (74%) for the week of June 11–17 (Figure 10A). By the following week of June 18–24, areas of open water became visible in the satellite imagery in the southeast inlets and mouths of local rivers, as was captured in the average break-up maps (Figure 11A). Typically, the sea ice is still safe for travel during the week of June 25 to July 1 with an average of only 7% (std dev 7%) of the area breaking-up (Figure 11B). By July 2–8, the area is averaging 19% (std dev 13%) break-up. Areas that are no longer safe for sea ice travel are expanding in the south and southeast sounds and inlets, and along the coastlines. Travel to both sinaangit are less safe (Figure 11C). The week of July 9–15 shows how quickly the break-up season advances (Figure 11D). While the region on average is 47% (std dev 24%) broken-up, break-up around the community is advanced, and Mittimatalingmiut are no longer able to access safe areas for sea ice travel from the community. By July 16–22 the area averages 80% (std dev 21%) break-up (Figure 11F) and the Tursukattak and Navy Board sinaangit normally break-up this week (Figures 10B,C). On average, by the week of July 23–29 the area is 94% (std dev 8%) broken-up (not shown), and Mittimatalingmiut are waiting for the remaining ice to melt, or be exported by winds and ocean currents, to begin hunting and fishing by boat.
Only the week of July 2–8 showed a trend toward earlier break-up in Mittimatalik region with an R2 = 0.34 (p <0.5). There is also a high amount of variability in sea ice break-up, and earlier break-up has become more frequent in the last 10 years (Figure 12). The variability in weekly break-up was not as large compared to freeze-up (Figure 13A). For the first 3 weeks of break-up, variability is minimal: June 18–24 has an IQR of 3%; June 25 to July 2 an IQR of 10%; and July 2–8 an IQR of 12%. The outliers for the week of July 2–8 correspond to the 2016 and 2019 seasons that broke up unusually early. The 2019 season had the earliest break-up on record with 97% of the region broken-up by July 9–15 (see Figure 14A for 2019 map). At the mid-point of break-up, variability increases with the weeks of July 9–15 and July 16–22 having IQRs of 34 and 24%, respectively (Figure 13A). The outlier for the week of July 16–22 corresponds to the 2002 season, with only 32% of the sea ice broken-up this week. The final week of break-up, July 23–29, had minimal variability with an IQR of 3%. The outliers for the week of July 23–29 correspond to the years of 1999 and 2005. The year of 2005 had the latest break-up in our record with only 64% of the sea ice broken-up this week (see Figure 14B for 2005 map).
The Navy Board sinaa has been breaking up earlier in the last 10 years. For example, 2011, 2013, and 2016 represent the earliest break up years in our 23-year record (Figure 10C). The trend for the Navy Board sinaa had an R2 = 0.18 (p < 0.05; Figure 10C). When compared to the two earliest tuvaq break-up years of 2016 and 2019, the Navy Board sinaa responded in 2016 with the earliest break-up date in our record (July 01). However, for 2019, the Navy Board sinaa break-up date was near normal around July 15th. Sikumiut have also discussed that the Tursukattak sinaa is not as stable as it has been in the past. The Tursukattak sinaa shows a moderate trend for earlier break-up in July with an R2 = 0.42 (p < 0.05; Figure 10B). The Tursukattak sinaa broke-up early in the anomalous years of 2016 and 2019. In 2016, it broke around July 10 and in 2019 around July 7, the earliest break-up date for this sinaa in the record.
The sinaangit can fracture and sections of tuvaq can break off to form a new sinaa during the break-up season (Figure 14). The yearly maps were analyzed to understand if the Tursukattak sinaa fractures and retreats to any consistent locations during break-up. The Tursukattak sinaa fractured to a variety of locations; however, in 17 out of 23 years (74% of the time), it did fracture to a location called Ukkuanguaq (Figure 14). Additionally, in 16 out of these 17 years, Ukkuanguaq is the last location of the Tursukattak sinaa before the tuvaq completely breaks-up.
The outlier break-up years from Figure 13A were visually analyzed for any differences in spatial patterns for where and when the sea ice broke-up. The patterns were consistent with the seasonal spatial evolution of the average break-up maps in Figure 11. However, Arreak explained that in some years, the sea ice in front of the community can break-up earlier than at the Tursukattak sinaa. To continue to hunt and fish as long as possible, Mittimatalingmiut will travel overland to access the sea ice just past Igarjuaq (Mount Herodier; Figure 1). The average break-up maps did not capture this pattern, so we again visually reviewed the individual yearly maps. This type of break-up pattern occurred 11 out of 23 years, just less than half of the time (48%) in the years of 1998, 1999, 2000, 2003, 2006, 2007, 2009, 2011, 2015, 2018, and 2019 (see Figure 14C for 2006 map). This pattern of break-up was fairly random and there was no increase in the frequency of this pattern of break-up in the last 10 years. Finally, we examined whether the spatial and temporal patterns of sea ice freeze-up in the fall influences sea ice break-up patterns in late spring, but no obvious patterns were detected.
To understand the critical periods for sea ice break-up, the weeks with the highest percentages of break-up were extracted for each year from 1997 to 2019. Figure 13B shows that a majority of break-up is distributed over a 3-week period from July 9 to 29. The week with the highest average percentages of break-up was July 16–22, in which almost half of the annual break-up occurs (48%).
The weekly difference maps show spatially where sea ice break-up is changing the most in the last 10 years of the climatology (2010–2019; Figure 15). The June 25-July 1 and July 2–8 difference maps show that the sea ice is breaking up earlier in: the sounds and inlets; at river mouths; in front of Mittimatalik; and at the northern tip of the Tursukattak sinaa (Figures 15A,B). The July 9–15 and July 16–22 difference maps show greater break-up in Milne Inlet and Tursukattak (Figures 15C,D). The July 16–22 difference map also shows a greater amount of break-up occurring this week in Milne Inlet and Tasiujaq. The July 23–29 difference map shows no spatial changes in sea ice break-up during the last 10 years (Figure 15E).
Discussion
The Mittimatalik siku asijjipallianinga not only documents trends, spatial patterns and locations of sea ice change in the Mittimatalik region, but it also addresses community-identified questions from an Inuit point of view, and at spatial and temporal scales that assessments such as the IPCC SROCC currently cannot address. Our discussion first looks at the benefits of this IQ-based based climatology and its application for community and regional sea ice travel safety. We then discuss the value of this IQ-based sea ice climatologies to meet their Mittimatalingmiut environmental assessment needs.
IQ-Based Research for Community Adaptation Needs
It is important to note that this research is not an example of integrating or incorporating IQ into western science. These approaches tend to select IQ that fits or validates western research questions (Bravo, 2009; Bohensky and Maru, 2011; ITK, 2016; McGrath, 2018). In this IQ-based sea ice climatology, we turned typical research approaches inside out by utilizing western science data sources to apply IQ to Inuit research questions (Bell, 2016). In this project, the satellite imagery and CIS charts were used to apply Sikumiut's IQ to the reconstruction of a 23-year ice climatology at seasonal to weekly scales. Additionally, IQ determined the approach to the analysis, filled gaps in the analysis and in the interpretation of the results to answer Mittimatalingmiut sea ice adaptation needs.
Arreak's teachings and travel experience allowed him to interpret the sea ice break-up in the satellite imagery based on his IQ and from an Inuit travel safety perspective. He was able to identify in the satellite imagery early signs of melt and aajurait in the satellite imagery that would have remained undetected without this context specific IQ and on-ice experience. Arreak digitized the locations of hundreds of aajurait over the 23 break-up seasons. In our GIS analysis, we were unable to find any spatial or temporal patterns for where and when, or if specific aajurait were key locations for break-up. However, in the IQ workshops Sikumiut mapped the main locations of the re-occurring aajurait without hesitation (Figures 2A, 3A,B). Additionally, Sikumiut already knew of the significance of the Ukkuanguaq aajuraq, but being able to quantify that the Tursukattak sinaa fractures and retreats to this location 74% of the time supports community sea ice adaptation needs. For example, talks are already underway to position time-lapse cameras and other monitoring equipment at this location to provide Mittimatalingmiut advance notice of break-up (Bell et al., 2020).
Arreak also pointed out that the average and difference break-up maps did not capture the years when the sea ice in front of the community breaks-up earlier than at the Tursukattak sinaa. This is an important break-up pattern that occurred 11 out of 23 years, 48% of the time (Figure 14C). Without Arreak's IQ, this break-up pattern would have been missed if we relied solely on statistical and GIS analyses. When you factor in that the sea ice is breaking up earlier (Figure 15) with the fact the sea ice in front of the community breaks-up first 48% of the time, access to the Tursukattak sinaa is becoming extremely difficult in late June and early July. Within the community, there have been suggestions to build a road to Igarjuaq as an adaptation strategy to maintain consistent access to the Tursukattak sinaa (Figure 1).
Sikumiut validated the average weekly break-up maps to ensure that the maps aligned with their IQ (Figure 2B). The benefit of the weekly average and difference maps are that they document and mobilize Sikumiut's knowledge from a seasonal to a weekly scale and highlight areas that have become more dangerous for sea ice travel. During break-up, these weekly maps can support travel planning. For example, by the week of June 25 to July 1, Mittimatalingmiut need to be cautious when traveling in Tay Sound because on average, the sea ice is sometimes dangerous (Figure 11B). By the week of July 2–8 travel in Tay Sound is frequently dangerous (Figure 11C), but based on the increase in break-up in the last 10 years, this area should sometimes breaks-up early and should be avoided (Figure 15).
When you view the Sikumiut seasonal sea ice IQ spring travel map (Figure 3B) compared with the weekly average break-up maps (Figure 11), you will notice striking similarities in the dangerous travel areas. However, the Sikumiut map shows additional hazardous sea ice areas along the southeast shore of Sirmilik (Bylot Island; Figure 1), around the Tursukattak sinaa, and the main aajurait locations not captured in the weekly average maps. To fill these gaps, the final version of the weekly average maps will overlay Sikumiut's additional IQ of aajurait and hazardous travel area locations.
The Sikumiut seasonal sea ice IQ winter travel map shows travel conditions once the sea ice has become tuvaq, in other words when it is generally safe for travel (Figure 3A). Early winter sea ice travel requires extreme caution and Sikumiut recommends that only the most knowledgeable and experienced hunters break initial snowmobile trails. Sikumiut would not historically have the bird's eye perspective of the region provided by the satellite data to monitor tuvaq formation. Sikumiut's freeze-up IQ is based on experiences passed down through generations on where it is normally safe to access the sea ice from the land in early winter. For example, Sikumiut members know that on average the first areas of tuvaq formation are in the southern inlets and sounds (Figure 5B). However, the weekly average tuvaq maps for freeze-up, based on the CIS ice charts, show the formation of tuvaq in Navy Board inlet, normally inaccessible for Mittimatalingmiut until the ice is safe for travel in Tasiujaq. Sikumiut reviewed and validated these maps to support travel planning in late freeze-up. For example, the November 12–18 map shows that the sea ice is normally not safe for travel anywhere near the community this week (Figure 5C). By the week of November 26 to December 2 it is normally safe to travel on the sea ice from the community into Tasiujaq, but it is normally still not safe for sea ice travel in Tursukattak until the end of December (Figure 5E). Once more the Sikumiut winter seasonal map provides additional detail, such as naggutiit, ivujuk, and siku saattuq aragulimaamik not in the weekly freeze-up maps. To fill these gaps, the final versions of the weekly maps will overlay the locations of these Sikumiut features to enhance the sea ice travel safety information for freeze-up.
In Canada's north, search and rescue operations are a complement of multi-jurisdictional partners. In Nunavut communities, local volunteers in Mittimatalik are often the first responders. Nunavut Emergency Management (NEM) coordinates at the Territorial scale. Based on the severity and type of the incident, NEM can request support from the following Federal agencies: Department of National Defense (air); Royal Canadian Mounted Police (land); and Canadian Coast Guard (sea). The Mittimatalik siku asijjipallianinga can also support the safety and situational awareness of regional and national search and rescue partners that would have a limited knowledge of the area and local sea ice conditions. For example, hazardous sea ice areas and areas of shelter to focus search and rescue efforts. The weekly average maps would support the effective, efficient and proactive deployment of resources and assets (human or infrastructure based) based on known areas of high risk at a weekly scale. Additionally, community scale IQ-based sea ice climate maps would be beneficial for national ice services. The presence of melt ponds in the spring saturates the SAR imagery making it impossible to identify sea ice features. As well, spring storms with significant cloud cover can result in weeks without optical imagery. Ice services would benefit from such community scale climate atlas' to help fill in satellite imagery gaps during the sea ice break-up season.
IQ-Based Research for Environmental Assessments
The normal open water season for shipping to the Mary River mine is from August 5 to October 15 (Bourbonnais et al., 2016). In 2020, BIM requested an extension to the shipping season from approximately July 15 to November 15, based on declining sea ice extent in the Arctic. An ice conditions shipping assessment report was submitted to the Nunavut Impact Review Board (NIRB) describing current shipping conditions to and from the mine (Bourbonnais et al., 2016). The ice conditions report highlights that climate change is resulting in sea ice freezing up later and breaking up earlier in the Canadian Arctic (Bourbonnais et al., 2016). The ice conditions report also outlined that the sea ice conditions in the region are highly variable, that climate change increases the risk of dangerous mobile old ice floes, and that ice-breaking support would be needed to ship during these shoulder seasons (Bourbonnais et al., 2016).
Responses to the proposed BIM lengthening of the shipping season have been sent from Sikumiut, the Mittimatalik Hunters and Trappers Organization (MTHO) and the Canadian Department of Fisheries and Oceans (DFO) to NIRB. All outline the importance of sea ice in the fall and late spring for wildlife reproduction and migration, and concerns regarding the impacts of noise from icebreaking on marine mammals (DFO, 2019; MTHO, 2021; Sikumiut, 2021). Sikumiut and the MTHO both outline the importance of sea ice for their culture and food security. They also emphasize that their concerns are based on IQ and that the environmental assessment process has not given IQ an equivalent voice when understanding the impacts of an extended shipping season on Mittimatalingmiut (MTHO, 2021; Sikumiut, 2021). Although NIRB outlines that their process is guided by IQ principles and that IQ has an important contribution to make to the review process (NIRB, 2021), it has been very difficult for oral knowledge to compete with technical reports and in evidence based decision-making processes (White, 2006; Healey and Tagak, 2014; McGrath, 2018).
The Mittimatalik siku asijjipallianinga provides IQ-based evidence concerning the proposed extended shipping seasons, and raises some interesting questions. For example by the week of November 12–18, Milne inlet averages 75–100% tuvaq and by November 19–25, there is 50–75% tuvaq in northern Tasiujaq, which would require a considerable amount of icebreaking to ship through (Figures 5B,C). Figure 7A also shows that a majority of tuvaq formation (56%) occurs in the first 2 weeks of November. Shipping during this critical period could compromise the formation of tuvaq and the Tursukattak sinaa, consequently affecting winter sea ice travel and wildlife. It is interesting to note that both the ice conditions report (Bourbonnais et al., 2016) and the siku asijjipallianinga used the CIS charts to review freeze-up conditions. However, the shipping report interpreted the data from a safe shipping perspective and the siku asijjipallianinga from a safe sea ice travel and wildlife perspective. While the shipping report notes that there is an expectation that the sea ice extent in Mittimatalik is declining due to climate change, we found no trend toward later freeze-up, and that in the last 10 years tuvaq freeze-up could be occurring earlier in some areas. The Milne Inlet port shows signs of earlier tuvaq freeze-up during the week of November 5–11 (Figure 5B), which could have implications for the feasibility of extended shipping at the port. Due to the high variability of freeze-up conditions (Figure 7A), it is impossible to pre-determine a specific week to cease shipping for the season. Sikumiut have recommended that the end of the shipping season be assessed on a year-by-year basis, according to the sea ice conditions at the time (Sikumiut, 2021).
The Mittimatalik siku asijjipallianinga also evaluated the potential impacts to sea ice travel based on the proposal to start shipping earlier around July 15. On average, by the week of July 16–22, the Mittimatalik region is 80% broken up (Figure 11E) and normally the Navy Board and Tursukattak sinaangit break-up this week (Figures 10B,C). Also for this week there is a trend toward an earlier break-up of the Tursukattak sinaa (R2 = 0.42), and along the shipping route to Milne Inlet in the last 10 years (Figure 15D). However, the break-up conditions are variable (Figure 13A). For example, even in the two most recent years in the record, Mittimatalingmiut experienced both an early (2019, 97% break-up by July 9–15) and late (2018, 95% break-up by July 23–29) break-up (Figure 11). Shipping earlier into the first 2 weeks of July would compromise community sea ice access to the Tursukattak sinaa in years when they are experiencing a late break-up. A follow-up letter from Sikumiut to NIRB is being sent to highlight this IQ-based evidence from the Mittimatalik siku asijjipallianinga in preparation for the next round of hearings.
Conclusion
Mittimatalik is just one out of 48 coastal communities in Inuit Nunangat that need answers to their climate change questions. International assessments such as the IPCC SROCC cannot address community-scale issues based on the current global scale of the models and methodologies used. The community of Mittimatalik is already dealing with the impacts of climate change influencing sea ice conditions, compounded by the pressure to increase shipping into the margins of the sea ice travel season. A deep climatological history of sea ice continues to thrive in IQ, but for many Inuit communities, it has yet to be documented. In the Mittimatalik siku asijjipallianinga, IQ was the foundation upon which their sea ice climatology was built. While satellite imagery, CIS ice charts and other western methods were used to document and mobilize this knowledge from a seasonal to weekly time scale, IQ was the ultimate scientific authority in this project. This ensured that the data were analyzed from an Inuit travel safety perspective, and according to an intimate knowledge of the local environmental conditions. As a result, this IQ-based research was able identify greater detail in the supporting data, fill gaps in the data, and provide direction on how interpret the data to reveal patterns that western-based research methods could not capture.
This atlas provides an adaptation tool that Mittimatalingmiut can use for safe sea ice travel planning, for monitoring specific sea ice indicators during break-up, and in planning alternative land routes in late spring to maintain access to the Tursukattak sinaa. These maps can also support the safety and situational awareness at regional scales for search and rescue partners that would have limited knowledge of local sea ice conditions. This project provides a practical example for how to develop an IQ-based sea ice climatology, and how this research approach can serve local Inuit community needs and beyond at regional scales. There would be a great benefit in expanding this work to other Inuit communities to support local safe sea ice travel and emergency management programs and practices across the Canada North. This atlas also has great value to the larger scientific community as climate change does not affect all areas of the Arctic equally.
The Mittimatalik siku asijjipallianinga demonstrates the scientific merit of IQ and its value in environmental assessments. The IQ-based evidence from the atlas shows that extending the shipping season into the first 2 weeks of November and the first 2 weeks of July will compromise the integrity of the sea ice for safe travel, and wildlife migration and reproduction. If shipping is extended into the freeze-up and break-up seasons to support mining activities, Mittimatalingmiut now have a baseline of their local sea ice conditions with which to compare and provide evidence for any future cumulative effects.
This co-produced research is also an example of the time required to meaningfully engage and work with Indigenous knowledge holders, whether its for environmental or scientific assessments like the IPCC SROCC. It required an investment of over 4 years in which Inuit were involved in the discussions from the very beginning and throughout the research, not just during a couple of workshops. By co-producing the research together and agreeing from the beginning on how to collect, analyse, and interpret the information, different knowledge systems can work together to address community-scale issues missing in IPCC SROCC reports.
Data Availability Statement
The datasets presented in this article are based on Indigenous knowledge and will require permission from the Sikumiut Committee. Requests to access the datasets should be directed to Katherine Wilson, a2F0aGVyaW5lLndpbHNvbkBtdW4uY2E=.
Ethics Statement
Written informed consent was obtained from the Sikumiut Committee for the publication of potentially identifiable images and data included in this article in the Memorial University-Sikumiut research agreement (Wilson, 2018).
Author Contributions
The Sikumiut Committee, AA, and KW contributed to conception and design of the study. KW archived the data, organized the database, performed the statistical analysis and map layout, and wrote all drafts of the manuscript. AA performed the satellite interpretation, digitization, and GIS spatial analysis. All authors contributed to the methodological design, as well as manuscript review and revisions.
Funding
This research was funded in part by the Public Safety Canada's Search and Rescue New Initiatives Fund, the Social Sciences and Humanities Research Council of Canada, the Northern Scientific Training Program, ArcticNet, and Polar Knowledge Canada. This research has received the following approvals: Nunavut Research License #02 013 20R-M; Memorial University of Newfoundland Interdisciplinary Committee on Ethics in Human Research, ethics approval #20190684-AR; and through a joint project agreement, Wilson received approvals from the CSA and CIS for the use of the archived RADARSAT data in this research (December 21, 2018).
Conflict of Interest
AA is employed by SmartICE Inc. TB is the founder of SmartICE. Sikumiut Committee members receive meeting honorarium from SmartICE Inc.
The remaining authors declare that the research was conducted in the absence of any commercial or financial relationships that could be construed as a potential conflict of interest.
Publisher's Note
All claims expressed in this article are solely those of the authors and do not necessarily represent those of their affiliated organizations, or those of the publisher, the editors and the reviewers. Any product that may be evaluated in this article, or claim that may be made by its manufacturer, is not guaranteed or endorsed by the publisher.
Acknowledgments
Our enormous gratitude goes to all members of the Sikumiut Management Committee for their leadership and generosity: Brian Koonoo, Caleb Sangoya, Elijah Panipakoocho, David Angnatsiak, Gamalie Kilukishak, Ivan Koonoo, Jonathan Pitseolak, Moses Arnagoalik, and Sheati Tagak. A very special thanks to AA for facilitating all the Sikumiut meetings and his significant work in interpreting, digitizing and analyzing all the data. Thank you to Benoit Montpetit, Stephen Howell, Angela Cheng, and Tom Zagon with ECCC for sharing their programming, GIS, ice chart and remote sensing knowledge in order to support, and develop the training for this research. Thank you to Carolann Harding at SmartICE for all her administrative support. We are also grateful to management at ECCC for their ongoing encouragement and support for this research and Evan Richardson with ECCC's Mittimatalik Research Station for accommodation and meeting space.
References
Archer, L., Ford, J. D., Pearce, T., Kowal, S., Gough, W. A., and Allurut, M. (2017). Longitudinal assessment of climate vulnerability: a case study from the Canadian Arctic. Sustain. Sci. 12, 15–29. doi: 10.1007/s11625-016-0401-5
Arctic Eider Society (2020). SIKU: The Indigenous Knowledge Social Network. Available online at: www.siku.org (accessed September 13, 2020).
Bell, T. (2016). Turning research inside out: Labrador Inuit focus on research priorities that strengthen community sustainability and well-being. Newfoundland Q. 109, 37–41. Available online at: www.mun.ca/harriscentre/reports/nlquarterly/
Bell, T., Briggs, R., Bachmayer, R., and Li, S. (2014). Augmenting Inuit knowledge for safe sea ice travel: the SmartICE information system. Oceans 2014, 1–9. doi: 10.1109/OCEANS.2014.7003290
Bell, T., Wilson, K. J., and Elverum, S. (2020). Sikumiut Perspectives on Monitoring Ice Breakup Near Mittimatalik: Summary Workshops Report. St. John's, NL: SmartICE Inc.
Bohensky, E. L., and Maru, Y. (2011). Indigenous knowledge, science, and resilience: what have we learned from a decade of international literature on “integration”? Ecol. Soc. 16, 1–19. doi: 10.5751/ES-04342-160406
Bourbonnais, P., Dorais, A., Giguère, M. A., and Keene, T. (2016). Mary River Phase 2 Proposal Technical Supporting Document: Ice conditions Report. Montreal, QC.
Bravo, M. T. (2009). “Sea ice mapping: ontology, mechanics, and human rights at the ice floe edge,” in High Places: Cultural Geographies of Mountains and Ice, eds D. E. Cosgrove and V. D. Dora (I B Tauris & Co Ltd), 161–176.
Brewer, C., Harrower, M., Sheesley, B., Woodruff, A., and Heyman, D. (2002). Colour Brewer 2.0: Color Advice for Cartography. Axismaps. Available online at: https://colorbrewer2.org/# (accessed November 11, 2020).
Brychtová, A., DoleŽalová, J., and Štrubl, O. (2015). Sequential Colour Scheme Generator. Palacký University Olomouc, Faculty of Science, Department of Geoinformatics. Available online at: http://eyetracking.upol.cz/color/ (accessed March, 2021).
Cameron, E., Mearns, R., and McGrath, J. T. (2015). Translating climate change: adaptation, resilience, and climate politics in Nunavut, Canada. Ann. Assoc. Am. Geograph. 105, 274–283. doi: 10.1080/00045608.2014.973006
Clark, D. G., Ford, J. D., Berrang-Ford, L., Pearce, T., Kowal, S., and Gough, W. A. (2016a). The role of environmental factors in search and rescue incidents in Nunavut, Canada. Public Health 137, 44–49. doi: 10.1016/j.puhe.2016.06.003
Clark, D. G., Ford, J. D., Pearce, T., and Berrang-Ford, L. (2016b). Vulnerability to unintentional injuries associated with land-use activities and search and rescue in Nunavut, Canada. Soc. Sci. Med. 169, 18–26. doi: 10.1016/j.socscimed.2016.09.026
Cooley, S. W., Ryan, J. C., Smith, L. C., Horvat, C., Pearson, B., Dale, B., et al. (2020). Coldest Canadian Arctic communities face greatest reductions in shorefast sea ice. Nat. Clim. Change 10, 533–538. doi: 10.1038/s41558-020-0757-5
CSA (2019). Canadian Space Agency. Available online at: http://www.asc-csa.gc.ca/eng/Default.asp (accessed August 9, 2019).
Cunsolo Willox, A., Harper, S. L., Edge, V. L., Landman, K., Houle, K., and Ford, J. D. (2013). The land enriches the soul: on climatic and environmental change, affect, and emotional health and well-being in Rigolet, Nunatsiavut, Canada. Emot. Space Soc. 6, 14–24. doi: 10.1016/j.emospa.2011.08.005
Damas, D. (2002). Arctic Migrants/Arctic Villagers: The Transformation of Inuit Settlement in the Central Arctic. Montreal, QC; Kingston, ON: McGill-Queen's Native and Northern Series. doi: 10.2307/j.ctt809qt
Dawson, J., Pizzolato, L., Howell, S. E. L, Copland, L., and Johnston, M. E. (2018). Temporal and spatial patterns of ship traffic in the Canadian arctic from 1990 to 2015. Arctic 71, 15–26. doi: 10.14430/arctic4698
DFO (2019). Science Review of the Phase 2 Addendum to the Final Environmental Impact Statement for the Baffinland Mary River Project. Canadian Science Advisory Secretariat (CSAS) Science Response, 69.
Driscoll, D. L., Mitchell, E., Barker, R., Johnston, J. M., and Renes, S. (2016). Assessing the health effects of climate change in Alaska with community-based surveillance. Clim. Change 137, 455–466. doi: 10.1007/s10584-016-1687-0
Durkalec, A., Furgal, C., Skinner, M. W., and Sheldon, T. (2014). Investigating environmental determinants of injury and trauma in the Canadian north. Int. J. Environ. Res. Public Health 11, 1536–1548. doi: 10.3390/ijerph110201536
Durkalec, A., Furgal, C., Skinner, M. W., and Sheldon, T. (2015). Climate change influences on environment as a determinant of Indigenous health: relationships to place, sea ice, and health in an Inuit community. Soc. Sci. Med. 136–137, 17–26. doi: 10.1016/j.socscimed.2015.04.026
ECCC (2005). Manual of ice (MANICE): Environment and Climate Change Canada. Available online at: https://weather.gc.ca/marine/forecast_e.html?mapID=06andsiteID=10100 (accessed September 12, 2020).
ECCC (2021). Canadian Ice Service, 30-Year Climatic Ice Atlas Charts. Available online at: https://iceweb-stage.cmc.ec.gc.ca/30Atlas/page1.xhtml (accessed February 13, 2021).
ESA (2019). European Space Agency. Available online at: https://www.esa.int/ESA (accessed August 7, 2019).
Fawcett, D., Pearce, T., Notaina, R., Ford, J. D., and Collings, P. (2018). Inuit adaptability to changing environmental conditions over an 11-year period in Ulukhaktok, Northwest Territories. Polar Rec. 54, 119–132. doi: 10.1017/S003224741800027X
Ford, J. D., Clark, D. G., Pearce, T., Berrang-Ford, L., Copland, L., Dawson, J., et al. (2019). Changing access to ice, land and water in Arctic communities. Nat. Clim. Change 9, 335–339. doi: 10.1038/s41558-019-0435-7
Ford, J. D., Knight, M., and Pearce, T. (2013a). Assessing the “usability” of climate change research for decision-making: a case study of the Canadian International Polar Year. Glob. Environ. Change 23, 847–855. doi: 10.1016/j.gloenvcha.2013.06.001
Ford, J. D., Mcdowell, G., Shirley, J., Pitre, M., Siewierski, R., Gough, W., et al. (2013b). The dynamic multiscale nature of climate change vulnerability: an Inuit harvesting example. Ann. Assoc. Am. Geograph. 103, 1193–1211. doi: 10.1080/00045608.2013.776880
Ford, J. D., Pearce, T., Smit, B., Wandel, J., Allurut, M., Shappa, K., et al. (2007). Reducing vulnerability to climate change in the Arctic: the case of Nunavut, Canada. Arctic 60, 150–166. doi: 10.14430/arctic240
Ford, J. D., Vanderbilt, W., and Berrang-Ford, L. (2012). Authorship in IPCC AR5 and its implications for content: climate change and Indigenous populations in WGII. Clim. Change 113, 201–213. doi: 10.1007/s10584-011-0350-z
Fox, S. (2004). When the Weather Is Uggianaqtuq: Linking Inuit and Scientific Observations of Recent Environmental Change in Nunavut, Canada. University of Colorado at Boulder.
Gearheard, S., Kielsen Holm, L., Huntington, H. P., Leavitt, J., Mahoney, A. R., Opie, M., et al. (2013). The Meaning of Ice: People and Sea Ice in Three Arctic Communities. Hanover: International Polar Institute Press.
Gearheard, S., Matumeak, W., Angutikjuaq, I., Maslanik, J., Leavitt, J., Kagak, D. M., et al. (2006). “It's not that simple”: a collaborative comparison of sea ice environments, their uses, observed changes, and adaptations in Barrow, Alaska, USA, and Clyde River, Nunavut, Canada. Ambio 35, 203–211. doi: 10.1579/0044-7447(2006)35[203:INTSAC]2.0.CO;2
Government of Nunavut and Nunavut Department of Education (2007). Inuit Qaujimajatuqangit Education Framework for Nunavut Curriculum. Iqaluit, NU: Nunavut Department of Education, Curriculum and School Services Division.
Healey, G., and Tagak, A. Sr. (2014). Piliriqatigiinniq' Working in a collaborative way for the common good': a perspective on the space where health research methodology and Inuit epistemology come together. Int. J. Crit. Indigenous Stud. 7, 1–15. doi: 10.5204/ijcis.v7i1.117
Heyes, S. A. (2011). Cracks in the knowledge: sea ice terms in Kangiqsualujjuaq, Nunavik. Can. Geograph. 55, 69–90. doi: 10.1111/j.1541-0064.2010.00346.x
Huntington, H. P., Daniel, R., Hartsig, A., Harun, K., Heiman, M., Meehan, R., et al. (2015). Vessels, risks, and rules: planning for safe shipping in Bering Strait. Mar. Policy 51, 119–127. doi: 10.1016/j.marpol.2014.07.027
ICC-Alaska (2015). Alaskan Inuit Food Security Conceptual Framework: How to Assess the Arctic from an Inuit Perspective - Summary and Recommendations Report. Anchorage.
ICC-Canada (2014). The Sea Ice Never Stops: Circumpolar Inuit Reflections on Sea Ice Use and Shipping in Inuit Nunaat. Ottawa, ON.
IPCC (2019). Summary for Policy Makers. IPCCspecial report on the ocean and cryosphere in a changing climate.
ITK (2016). Inuit Tapiriit Kanatami Submission to the Naylor Panel for Canada's Fundamental Science Review. Ottawa, ON.
Johnson, N., Alessa, L., Behe, C., Danielsen, F., Gearheard, S., Gofman-Wallingford, V., et al. (2015). The Contributions of community-based monitoring and traditional knowledge to Arctic observing networks: reflections on the state of the field. Arctic 68, 1–13. doi: 10.14430/arctic4447
Kenny, T. A., Fillion, M., MacLean, J., Wesche, S. D., and Chan, H. M. (2018a). Calories are cheap, nutrients are expensive – the challenge of healthy living in Arctic communities. Food Policy 80, 39–54. doi: 10.1016/j.foodpol.2018.08.006
Kenny, T. A., Hu, X. F., Kuhnlein, H. V., Wesche, S. D., and Chan, H. M. (2018b). Dietary sources of energy and nutrients in the contemporary diet of Inuit adults: results from the 2007-08 Inuit Health Survey. Public Health Nutr. 21, 1319–1331. doi: 10.1017/S1368980017003810
Laidler, G. J., Ford, J. D., Gough, W. A., Ikummaq, T., Gagnon, A. S., Kowal, S., et al. (2009). Travelling and hunting in a changing Arctic: assessing Inuit vulnerability to sea ice change in Igloolik, Nunavut. Clim. Change 94, 363–397. doi: 10.1007/s10584-008-9512-z
Leduc, T. B. (2007). Sila dialogues on climate change: Inuit wisdom for a cross-cultural interdisciplinarity. Clim. Change 85, 237–250. doi: 10.1007/s10584-006-9187-2
MacDonald, J. (2018). “Stories and representation: two centuries of narrating Amitturmiut history,” in The Hands' Measure: Essays Honouring Leah Aksaajuq Otak's Contribution to Arctic Science, eds. J. MacDonald and N. Wachowich (Iqaluit, NU: Nunavut Arctic College Media), 43–80.
Meredith, M., Sommerkorn, M., Cassotta, S., Derksen, C., Ekaykin, A., Hollowed, A., et al. (2019). “Polar regions,” in IPCC Special Report on the Ocean and Cryosphere in a Changing Climate, eds H.-O. Pörtner, D. C. Roberts, V. Masson-Delmotte, P. Zhai, M. Tignor, E. Poloczanska, K. Mintenbeck, A. Alegría, M. Nicolai, A. Okem, J. Petzold, B. Rama, N. M. Weyer (Geneva). Available online at: https://www.ipcc.ch/site/assets/uploads/sites/3/2019/11/07_SROCC_Ch03_FINAL.pdf
NASA (2019). EOSDIS Worldview. Available online at: https://worldview.earthdata.nasa.gov/ (accessed November, 2019).
NIRB (2021). Nunavut Impact Review Board: Inuit Qaujimajatuqangit. Available online at: https://www.nirb.ca/inuit-qaujimajatuqangit (accessed April 2, 2021).
NSIDC (2021). Sea ice Index Animation Tool. NOAA, National Snow and Ice Data Center. Available online at: https://nsidc.org/data/seaice_index/archives/image_select (accessed February 17, 2021).
Pearce, T., Ford, J., Willox, A. C., and Smit, B. (2015). Inuit traditional ecological knowledge (TEK), subsistence hunting and adaptation to climate change in the Canadian Arctic. Arctic 68, 233–245. doi: 10.14430/arctic4475
Pearce, T., Smit, B., Duerden, F., Ford, J. D., Goose, A., and Kataoyak, F. (2010). Inuit vulnerability and adaptive capacity to climate change in Ulukhaktok, Northwest Territories, Canada. Polar Rec. 46, 157–177. doi: 10.1017/S0032247409008602
Pearce, T., Wright, H., Notaina, R., Kudlak, A., Smit, B., Ford, J. D., et al. (2011). Transmission of environmental knowledge and land skills among Inuit men in Ulukhaktok, Northwest Territories, Canada. Hum. Ecol. 39, 271–288. doi: 10.1007/s10745-011-9403-1
Pizzolato, L., Howell, S. E. L., Dawson, J., Laliberté, F., and Copland, L. (2016). The influence of declining sea ice on shipping activity in the Canadian Arctic. Geophys. Res. Lett. 43, 12, 146–12, 154. doi: 10.1002/2016GL071489
Pizzolato, L., Howell, S. E. L., Derksen, C., Dawson, J., and Copland, L. (2014). Changing sea ice conditions and marine transportation activity in Canadian Arctic waters between 1990 and 2012. Clim. Change 123, 161–173. doi: 10.1007/s10584-013-1038-3
Polar View (2019). Polar View: Earth Observations for Polar Monitoring. Available online at: https://polarview.looknorthservices.com (accessed August 7, 2019).
Portner, H.-O., Roberts, D. C., Masson-Delmotte, V., Zhai, P., Tignor, M., Poloczanska, E., Mintenbeck, K., et al. (2019). “Annex I: glossary,” in IPCC Special Report on the Ocean and Cryosphere in a Changin Climate, ed N. M.Weyer, 677–702.
QIA (2014). Qikiqtani Truth Commission: The Official Mind of Canadian Colonialism. Iqaluit, NU: Inhabit Media Inc.
Ramsay, B., Manore, M., Weir, L., Wilson, K. J., and Bradley, D. (1998). Use of radarsat data in the Canadian Ice Service. Can. J. Remote Sens. 24, 36–42. doi: 10.1080/07038992.1998.10874689
Ramsay, B. R., Weir, L., Wilson, K. J., and Arkett, M. (1996). Early Results of the Use of RADARSAT ScanSAR Data in the Canadian Ice Service. European Space Agency, (Special Publication) ESA SP.
Riedlinger, D., and Berkes, F. (2001). Contributions of traditional knowledge to understanding climate change in the Canadian Arctic. Polar Rec. 37, 315–328. doi: 10.1017/S0032247400017058
Segal, R. A., Scharien, R. K., Cafarella, S., and Tedstone, A. (2020a). Characterizing winter landfast sea ice surface roughness in the Canadian Arctic Archipelago using Sentinel-1 synthetic aperture radar and the Multi-angle Imaging SpectroRadiometer. Ann. Glaciol. 61, 284–298. doi: 10.1017/aog.2020.48
Segal, R. A., Scharien, R. K., Duerden, F., and Tam, C. L. (2020b). The best of both worlds: connecting remote sensing and Arctic communities for safe sea ice travel. Arctic 73, 461–484. doi: 10.14430/arctic71896
Shokr, M., and Sinha, N. (2015). “Sea ice service in Canada: History and current operational programs,” in Sea Ice: Physics and Remote Sensing, ed American Geophysical Union (Hoboken, NJ: John Wiley and Sons, Inc.), 1–579.
Sikumiut (2021). Written Submission About Sea Ice/Baffinland Phase 2 From Sikumiut Community Management Committee.
Statistics Canada (2017). Pond Inlet, Nunavut. Census Profile. 2016 Census. Statistics CanadaCatalouge no. 98-316-X2016001., 2016 Census. Ottawa, ON.
Stroeve, J., and Meier, W. N. (2018). Sea Ice Trends and Climatologies from SSMR and SSM/I-SSMIA, Version 3. NASA National Snow and Ice Data Center Distributed Active Archive Center.
Tester, F., and Kulchyski, P. (1997). Tammarniit (Mistakes): Inuit Relocation in the Eastern Arctic, 1939-63. Vancouver, BC: UBC Press.
TRC (2015). The Final Report of the Truth and Reconciliation Commission of Canada. Canada's Residential Schools: The Inuit and Northern Experience. Montreal, QC; Kingston, ON: McGill-Queen's University Press.
White, G. (2006). Cultures in collision: traditional knowledge and Euro-Canadian Governance Processes in Northern Land-Claim Boards. Arctic 59, 401–414. doi: 10.14430/arctic289
Wilson K. J. Arreak A. Sikumiut Bell T. Ljubicic G. J. (in press). “When We're On The Ice, All We Have Is Our Inuit Qaujimajatuqangit”: Mobilizing Inuit Knowledge as a Sea Ice Safety Adaptation Strategy in Mittimatalik, Nunavut. Arctic. Avalable online at: https://arctic.ucalgary.ca/arctic-journal
Wilson, K. J., Bell, T., Arreak, A., Koonoo, B., Angnatsiak, D., and Ljubicic, G. J. (2020). Changing the role of non-Indigenous research partners in practice to support Inuit self-determination in research. Arctic Sci. 6, 127–153. doi: 10.1139/as-2019-0021
Keywords: Indigenous knowledge, Inuit Qaujimajatuqangit, decolonizing research, research co-production, sea ice, climate change adaptation, Arctic
Citation: Wilson K, Arreak A, Sikumiut Committee, Bell T and Ljubicic G (2021) The Mittimatalik Siku Asijjipallianinga (Sea Ice Climate Atlas): How Inuit Knowledge, Earth Observations, and Sea Ice Charts Can Fill IPCC Climate Knowledge Gaps. Front. Clim. 3:715105. doi: 10.3389/fclim.2021.715105
Received: 26 May 2021; Accepted: 30 August 2021;
Published: 26 October 2021.
Edited by:
Carolina Adler, Mountain Research Initiative, SwitzerlandReviewed by:
Siri Veland, Norwegian Research Institute (NORCE), NorwayHaibo Bi, Institute of Oceanology, Chinese Academy of Sciences (CAS), China
Copyright © 2021 Wilson, Arreak, Sikumiut Committee, Bell and Ljubicic. This is an open-access article distributed under the terms of the Creative Commons Attribution License (CC BY). The use, distribution or reproduction in other forums is permitted, provided the original author(s) and the copyright owner(s) are credited and that the original publication in this journal is cited, in accordance with accepted academic practice. No use, distribution or reproduction is permitted which does not comply with these terms.
*Correspondence: Katherine Wilson, a2F0aGVyaW5lLndpbHNvbkBtdW4uY2E=
 Katherine Wilson
 Andrew Arreak2
 Trevor Bell
 Gita Ljubicic