- 1International Hurricane Research Center, Florida International University, Miami, FL, United States
- 2Department of Earth & Environment, Florida International University, Miami, FL, United States
- 3Centre for Environment, Fisheries and Aquaculture (CEFAS), Lowestoft, United Kingdom
In this study, a parallel extension of the Coastal and Estuarine Storm Tide (CEST) model is developed and applied to simulate the storm surge tide at South Florida induced by hurricane Irma occurred in 2017. An improvement is also made to the existing advection algorithm in CEST. This is achieved through the introduction of high-order, monotone Semi-Lagrangian advection. Distributed memory parallelization is developed via the Message Passing Interface (MPI) library. The parallel CEST model can therefore be run efficiently on machines ranging from multicore laptops to massively High Performance Computing (HPC) system. The principle advantage of being able to run the CEST model on multiple cores is that relatively low run-time is possible for real world storm surge simulations on grids with high resolution, especially in the locality where the hurricane makes landfall. The computational time is critical for storm surge model forecast to finish simulations in 30 min, and results are available to users before the arrival of the next advisory. In this study, simulation of hurricane Irma induced storm surge was approximately 22 min for 4 day simulation, with the results validated by field measurements. Further efficiency analysis reveals that the parallel CEST model can achieve linear speedup when the number of processors is not very large.
1. Introduction
The Coastal and Estuarine Storm Tide (CEST) numerical model was developed at the International Hurricane Research Center (IHRC), based at Florida International University (FIU) in Miami, around a decade ago. The purpose of the model is to simulate the storm surge due to the combined action of (anti)cylonic winds and astronomical tides. Although the CEST model has both 2D and 3D variants, in this paper we are concerned with the 2D version that is based on the depth–averaged, primitive variable, non–linear shallow water (NLSW) equations expressed on orthogonal curvilinear coordinates. These governing equations are solved via an algorithm that is based on the semi–implicit finite–difference (FD) approach (Casulli, 1990). CEST differs from the approach presented in Casulli (1990) as it employs a straightforward explicit Eulerian advection scheme (Zhang et al., 2008). The CEST model allows for forcing by winds, atmospheric pressure and astronomical tides, and is thus capable of simulating storm tides as well as the wind–driven circulation at estuaries and coasts. As described in Zhang et al. (2008) the CEST model incorporates a novel wetting–drying algorithm that is based on an accumulated water volume approach for dry cells.
Compared to the US operational SLOSH (Sea, Lake, and Overland Surge from Hurricane) model employed by the National Hurricane Center (NHC), CEST has demonstrated favorable results over the hindcast of storm surge induced by Camille (1969), Hugo (1989), Andrew (1992), Wilma (2005), Zhang et al. (2008), and Zhang et al. (2012). The performance and stability of CEST were also examined by conducting simulations for more than 100,000 synthetic hurricanes for nine SLOSH basins covering the Florida coast and Lake Okeechobee (Zhang et al., 2013). It is demonstrated that CEST has the potential to be used for operational forecasts of storm surge.
Recently, NHC has developed several high resolution basins along East Coast and Gulf of Mexico with 100 m grid resolution along the coastal region. South Florida Basin is the one of the basins with about 640,000 computational cells. It takes 1–2 h to finish 4-days simulation by SLOSH or CEST with one CPU. For the storm surge forecast, the P-Surge model is used to compute the ranges of inundation magnitudes and extents (Taylor and Glahn, 2008). Real-time storm surge simulations are required to produce P-Surge products in 20–30 min because the NHC updates the hurricane forecast/advisory every 6 h (Zhang et al., 2013). Therefore, improved algorithm and simple parallelization via the message passing interface (MPI) approach have to be employed to CEST model in order to satisfy the forecast requirement.
In this paper we present a modified version of the CEST model that includes an improved advection algorithm and a simple parallelization via the message passing interface (MPI) library. MPI allows for distributed memory parallelization ensuring that CEST is not limited to the amount of memory on a single machine or the number of processes available on that machine. The new parallel version of CEST can therefore be run on machines ranging from multi-core desktops to massively parallel supercomputers.
The paper is structured as follows in section 2 we detail the governing equations including the transformation to orthogonal curvilinear coordinates. ection 3 gives an overview of the numerical algorithm used to solve the equations with emphasis on improvements and changes made to the original CEST model. This section also includes details on the treatment of wetting–drying fronts and parallelization. A test case result is presented in section 4 which includes a comparison of the CPU time with the original series CEST code. Finally, in section 5, conclusions are drawn.
2. Governing equations
The CEST model employs a non–conservation, primitive variable, form of the 2D NLSW equations in orthogonal curvilinear co–ordinates (Zhang et al., 2008). Flow variables are considered to be depth uniform; i.e. the velocities are averaged over the water depth and there is no vertical velocity variation. The curvilinear co–ordinate system used follows that introduced by Blumberg and Herring (1987) and comprises horizontal co–ordinates (ξ, η) and a vertical co–ordinate (z), see Figure 1. Metric coefficients, h1 and h2, are introduced such that a distance increment satisfies the relation
with
The differential arc lengths at point P in Figure 1 are given by
Thus, the u and v components of the depth–averaged velocity are given by
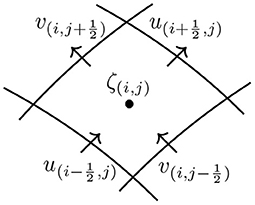
With ζ = ζ(ξ, η, t) denoting the free surface disturbance measured from the undisturbed water level h = h(ξ, η). The depth–averaged velocity components are denoted by u = u(ξ, η, t) and v = v(ξ, η, t) for the ξ and η directions, see Figure 2, respectively.
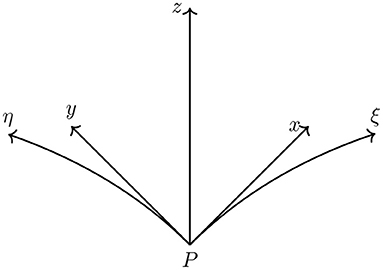
Figure 1. Schematic showing the ξ − η orthogonal curvilinear co–ordinate system employed in the IHRC CEST model.
In the orthogonal curvilinear co–ordinate system the continuity equation is then given by
The momentum equations are
and
Here H(ξ, η, t) = h(ξ, η, t) + ζ(ξ, η, t) is the total water depth. The gravitational acceleration is denoted by g, ρ is the water density, ΔPa is the air pressure drop and f is the Coriolis parameter. The bottom shear stress is denoted by τB and the wind shear stress by τW. Closure for the bottom shear stress is obtained using a quadratic law:
with n being Manning's coefficient. The wind shear is parametrized using the wind velocities from a wind forcing model coupled to the flow via a drag coefficient based on the Large and Pond (1981) or Garratt (1977) formulation; full details can be found in (Zhang et al., 2012). Importantly, it is noted that, without explicit shock fitting of the type discussed in Pandolfi and Zannetti (1977), these equations are unsuitable for modeling flows that contain or develop discontinuities (shock waves). CEST is capable of using internal parametric wind models such as the Holland model (Holland, 1980) or the Myers and Malkin (1961) that is employed by SLOSH. CEST is also capable of using external wind field time–series generated by the Hurricane Research Division of the US National Oceanic and Atmospheric Administration (NOAA) based on field measurements (H*Wind) (Powell et al., 1998). For Hurricane Irma simulation presented in this paper we use the Myers and Malkin (1961) parametric wind model which parameterizes the wind and atmospheric pressure fields using both the atmospheric pressure drop and radius of maximum wind speed (RMW). Pressure, wind speed, and wind direction are computed assuming a stationary, circularly symmetric, storm. The set up used here for Hurricane Irma is essentially the same as that described in Zhang et al. (2008).
3. Methods
The numerical solution is effected on a staggered, Arakawa C–type, grid using finite differences. Elevation points are defined at the centers of grid cells, while the u and v velocity components are defined on their respective cell boundaries.
When values of dependent variables are required at non–computation points they are obtained using piecewise linear reconstruction, i.e. . The model employs the method of fractional steps (Yanenko, 1971) in order to march forward in time. This means that the overall temporal accuracy in CEST is .
3.1. Modified Advection Algorithm
In its original incarnation CEST (Zhang et al., 2008, 2012) handled advection via a straightforward, fully explicit, Eulerian finite difference scheme. This approach often leads to a prohibitive restriction on the size of the time–step that the original CEST model can employ. This is because, for numerical stability, the time–step used for the entire model must be chosen such that advection satisfies the well-known CFL condition (Courant et al., 1967). Here, in the spirit of Casulli's original approach (Casulli, 1990), we employ a semi–Lagrangian (SL) methodology for the velocity advection. Importantly, however, we extend the approach to high–order accuracy in both space and time by employing second–order Runge Kutta time integration and monotonic cubic spline interpolation in space. In theory, this type of advection is unconditionally stable. When computing the velocity advection, we work purely on the computational (image) grid; working on the curvilinear (physical) grid adds complexity as scales vary arbitrarily between cells and grid curvature is not necessarily constant. In order to effect the interpolation, and limiting, the two–dimensional processes are broken down into a sequence of one–dimensional processes along each co–ordinate axis. This is possible because the computational (image) grid is a regular Cartesian grid. Thus, without loss of generality, when discussing the base point interpolation we need only consider the 1D case. For the spatial interpolation we use Hermite cubic interpolation made monotone by use of the limiter proposed by Nair et al. (1999); from hereonin we shall refer to this as the NCS99 limiter. The NCS99 limiter is applied in each spatial dimensional in turn and works as follows: first find the local maximum and minimum surrounding the particle path base point xb
Next, reset the interpolated value (obtained using Hermite cubic interpolation) at the base point f|x =xb = fb such that
Note that this amounts to a simple clamping operation and can lead to the suppression of certain genuine physical waves. For this reason the NCS99 limiter includes additional checks for monotonicity that must be satisfied before the limiter is applied. First NCS99 introduce the global minimum and global maximum of f denoted by fmin and fmax, respectively. Thus, if all of the following four inequalities hold the limiter should not be applied
This stipulates that the signal contains only one extremum in a five–mesh–length interval (therefore suppressing the Gibbs phenomenon). We have found this limiter to be particularly robust when compared with alternative formulations such as that proposed in Fedkiw et al. (2001). Figure 3 shows a comparison of SL advection, using a variety of base point interpolation schemes, for the advection of a 1D function with compound waves in a uniform velocity field. The 1D function comprises a combined Gaussian, triangle and square wave. Results are plotted after 100 time–steps for a grid comprising 500 points; clearly Hermite cubic interpolation with the NCS99 limiter gives the best performance in this complex case. Whilst this high–order accurate advection scheme is monotone, it is unsuitable for flows that contain or develop discontinuities as it is not conservative. Moreover, CEST is only suitable for smooth flows as the governing equations are themselves not in a (divergence) form that permits discontinuities. Thus, unless explicit shock fitting is utilized (Moretti, 2002), flow discontinuities cannot be expected to propagate at the correct strength or speed. We mention that, when using SL advection, in wet areas close to dry land, care should be taken to ensure that the particle path is not allowed to project too far back into an area that is completely dry. If this is allowed to happen then the velocity advection can cause a false zeroing of the velocity field in such cells. This issue can be avoided through the use of locally controlled time–stepping.
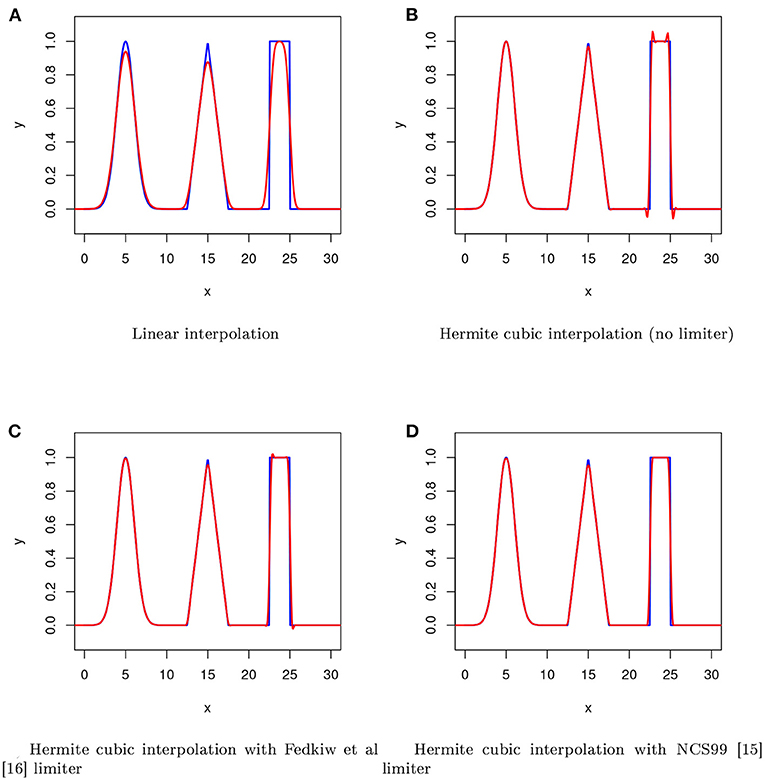
Figure 3. Advection of a complex function in uniform velocity field. The results for (A) Linear interpolation, (B) Hermite cubic interpolation (no limiter), (C) Hermite cubic interpolation with Fedkiew et al. limiter, (D) Hermite cubic interpolation with NCS99 limiter, are shown for 500 grid points after 100 time steps. The analytical solution is the blue line and the numerical approximation is the red line.
3.2. Additional Terms and Free Surface Evolution
The physical diffusion terms are treated using a simple forward–in–time centered–in–space (FTCS) scheme (Press et al., 1992). We note that the use of a simple explicit scheme for diffusion introduces its own stability requirements; however, these are far less stringent than those associated with the advective terms. The Coriolis and wind stress terms are updated using first–order explicit Euler time integration and the bottom friction term is treated implicitly in the manner detailed in Kelly et al. (2015). After the velocities have been updated using the method of fractional steps the free surface can be updated. The operator that updates both u and v by SL advection and explicit diffusion, evaluation of curvature terms, pressure drop, wind forcing and finally an implicit bed friction update is denoted by . Thus, we have
Evolution of the free surface requires solution of Equation (5). This is achieved using an implicit scheme which results in the following 5–diagonal linear system of equations:
where
and
The right hand side of Equation (13) is given by
Finally, after the free surface has been updated, the final velocity update is performed using the pressure gradient. Use is made of the staggered grid to obtain second–order accuracy for the spatial gradient of the free surface in this step.
3.3. Wetting/Drying Fronts
CEST employs a straightforward wetting–drying algorithm that is based on an accumulated water volume (Zhang et al., 2008). Free surface elevation and water depth at both the cell center and its four boundaries are all used to calculate the accumulated water volume. At the beginning of a model timestep, cells are assigned as being either wet or dry based on whether the water depth at the cell center is above or below a threshold depth HTOL. During wetting, if the free surface elevation at the center of a wet cell is higher than that at an adjacent dry cell, and the water depth at the shared boundary between these two cells Hk (obtained by linear interpolation) is greater than a predefined threshold, the water is allowed to flow from the wet cell into the dry cell and accumulate there. The flux of water crosses a maximum of four shared boundaries between a dry cell, and any wet neighbors. The water interchange velocities (uk, where k = 1...4 represents the four cell boundaries) are approximated by solving a simplified 1D momentum equation which ignores the contribution of advection, Coriolis force, air pressure drop and wind shear giving
with xk being the direction of uk and ζk is a linear reconstruction of the free surface elevation at the kth cell interface. The accumulated water volume ΔQ in dry cells is computed as
where is the accumulated volume from the previous time step and Δk denotes the cell length (which is Δξ or Δη depending on the value of k). If the water depth, obtained from the accumulated volume, in a dry cell exceeds HTOL the cell is reflagged as being wet. During drying a cell is set to be dry if the water depth at the cell center falls below HTOL. Note that, if the water depth at a cell boundary is less than HTOL, water will stop flowing across this boundary even before the cell itself is completely dry. Also, if it is the case that the linearly reconstructed water depths at all four boundaries of a cell are less than HTOL then the cell is set to be dry. This simple algorithm conserves water mass, but not momentum. The approach has proven extremely robust in a huge number of storm surge simulations carried out at the IHRC over the last decade.
3.4. MPI Parallelization and Domain Decomposition
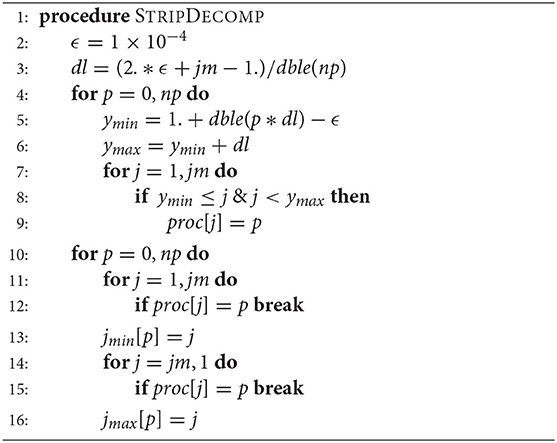
Parallelization of the CEST model is achieved using the Message Passing Interface (MPI) library, see: https://www.open-mpi.org/. To achieve parallelization a horizontal strip–type domain decomposition on the computational (image) grid is employed. The computational domain is split into a number of horizontal strips and strips are allocated to each process on a single strip per process basis. Two layers of halo regions (ghost cells) is employed to transfer information between processes. It should be noted that no load balancing, or process optimization, is currently implemented.
Figure 4 shows a schematic representation of the domain decomposition employed by CEST. Assuming a domain that runs from ymin to ymax and comprises im × jm cells, only J index is split to save on computational time and simplify the domain decomposition. In other words, the computational domain is split vertically among all available processes np, including the root process p=0, according to Algorithm 1. The horizontal direction, I index for each process keeps same.
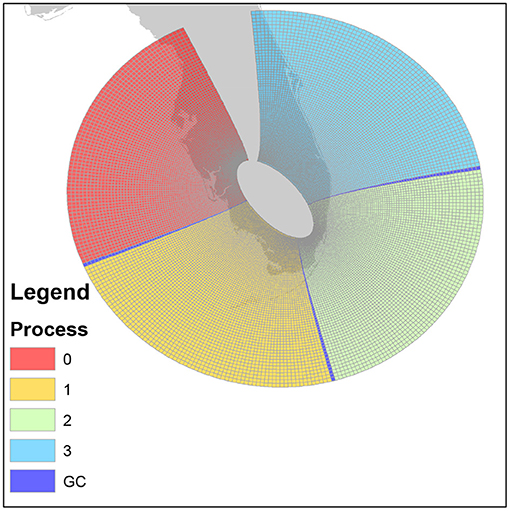
Figure 4. Example of a CEST curvilinear computational grid (shown in physical space) and the strip–type domain decomposition. The shaded strips show the ghost cells (GC) used for inter–process communication. The plot shows the NOAA (NHC) basin used for simulations of hurricane such as Andrew (1992).
Whilst the parallelization of the operator is straightforwards, solution of the implicit equation for the free surface (Equation 13) is not. To facilitate the paralellization of the code, and avoid the need for multicoloring, the pre–conditioned conjugate gradient (PCCG) method employed to solve the continuity equation for the free surface (Equation 13) in CEST is replaced with simple Jacobi iteration. This allows for a straightforward parallelization of the implicit part of Casulli's algorithm. Whilst this approach leads to slower convergence this is more than offset by the ability to employ multiple processes (and the associated decrease in the linear system size that each process is required to solve).
4. Results
For the verification purpose, a test case with 4-day simulation of Hurricane Irma (2017) is conducted. Following (Zhang et al., 2008) we consider both the storm surge and the tidal component. The simulation starts at 00:00 UTC on 8 September 2017 and ends at 00:00 UTC on 12 September, with a time step of 10 s. In what follows, the detailed setup of the simulation and the results are discussed.
4.1. Model Domain
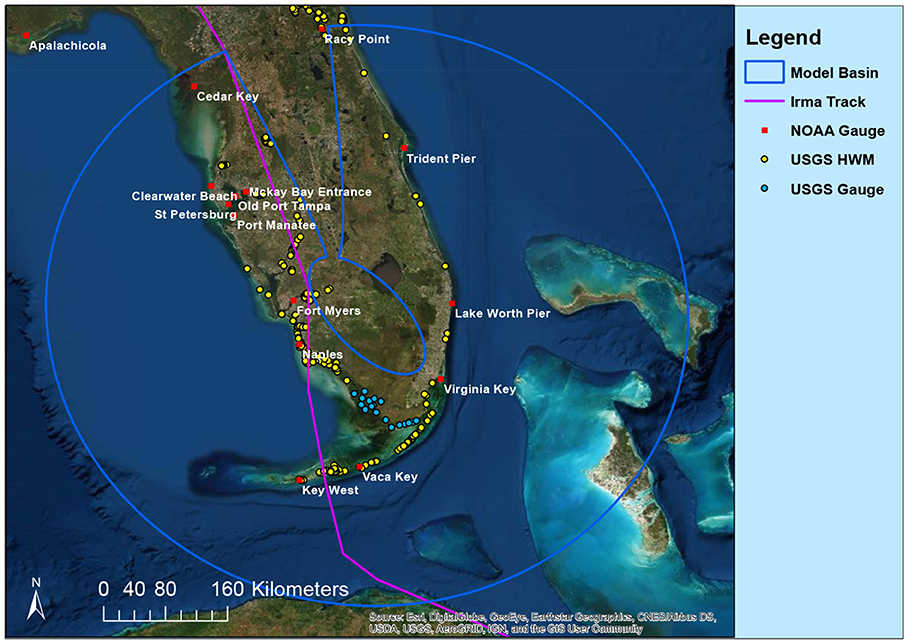
Figure 5 shows the model domain and the measurement locations for Hurricane Irma (2017), including tide gauges from NOAA, High Water Marks (HWMs) from US Geological Survey (USGS), and river gauges from USGS. We employ a very high–resolution curvilinear grid that comprises approximately 640,000 computational cells. The cell size at the open ocean area is approximately 1,470 × 1,470 m, which gradually reduces to 200 × 200 m at the shoreline areas and further smaller inland. It should be noted that, for display purposes, the grid lines are not shown in Figure 5. All model boundaries that lie in water are specified as open; details of the boundary conditions can be found in the section below.
4.2. Topographic and Bathymetric Data and Calculation of Grid Cell Elevation
The bathymetric and topographic data are required for calculating the water depths and elevations of the grid cells in a model basin. The topographic data used in this study mainly come from USGS, and the bathymetric data come from NOAA. Water depths for grid cells at the open ocean were calculated based on the ETOPO1 global relief dataset from NOAA, which has a resolution of 1 arc minute ( 1.8 km). Water depths for grid cells in coastal areas were interpolated from the U.S. coastal relief dataset from NOAA with a resolution of 3 arc second ( 90 m) (https://www.ngdc.noaa.gov/mgg/bathymetry/relief.html). The USGS 90, 30, 10, and 3 m digital elevation models (DEM) were used to calculate the elevation of grid cells on the land (http://viewer.nationalmap.gov/viewer/).
4.3. Boundary Conditions
At the open boundaries the model is forced using a nine–component tide comprising the M2, S2, K1, O1, Q1, K2, N2, M4, and M6 components. These constituents were obtained from the ADvanced CIRCulation model (ADCIRC) Tidal Databases East Coast 2015 database of tidal constituents (Szpilka et al., 2016). An inverse pressure adjustment is made to the water surface specification at the tidal boundaries. The inverse pressure approach partially accounts for the meteorological forcing at the boundary by imposing the inverted barometer effect (Blain et al., 1994). Thus, the free surface at the open boundaries is modified by the amount where is an atmospheric pressure change and ρw is the sea water density.
4.4. Bottom Friction Coefficient
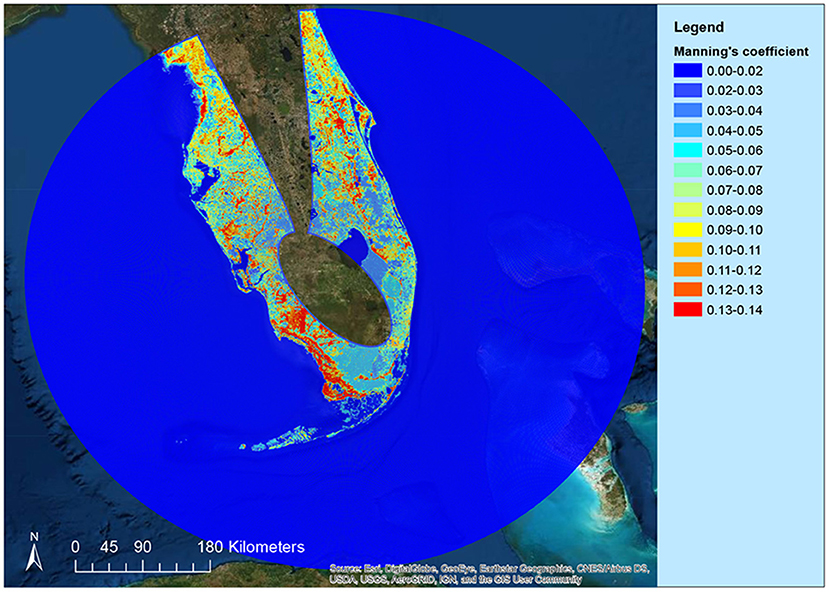
A spatially varying value of Manning's n is employed. Figure 6 shows the spatial distribution of the Manning's coefficient used in this paper. This coefficient map was generated based on the national land cover dataset (NLCD) created by USGS in 2001, using the approach proposed in Zhang et al. (2012), where details can be found. Note that for the open ocean area, a constant coefficient n = 0.02 was employed.
4.5. Comparison of Model Predictions and Observations
Figure 7 shows a comparison for the data at the NOAA tide gauges (Figure 5). The parallel CEST model in general captures the major trend of the tide and the storm surge induced by Irma (2017). At Naples, Fort Myers, and Mckay Bay Entrance, the surface elevations were relatively well predicted by CEST, while at Virginia Key, St Petersburg, and Old Port Tampa, CEST tends to underestimate the surface elevation variation.
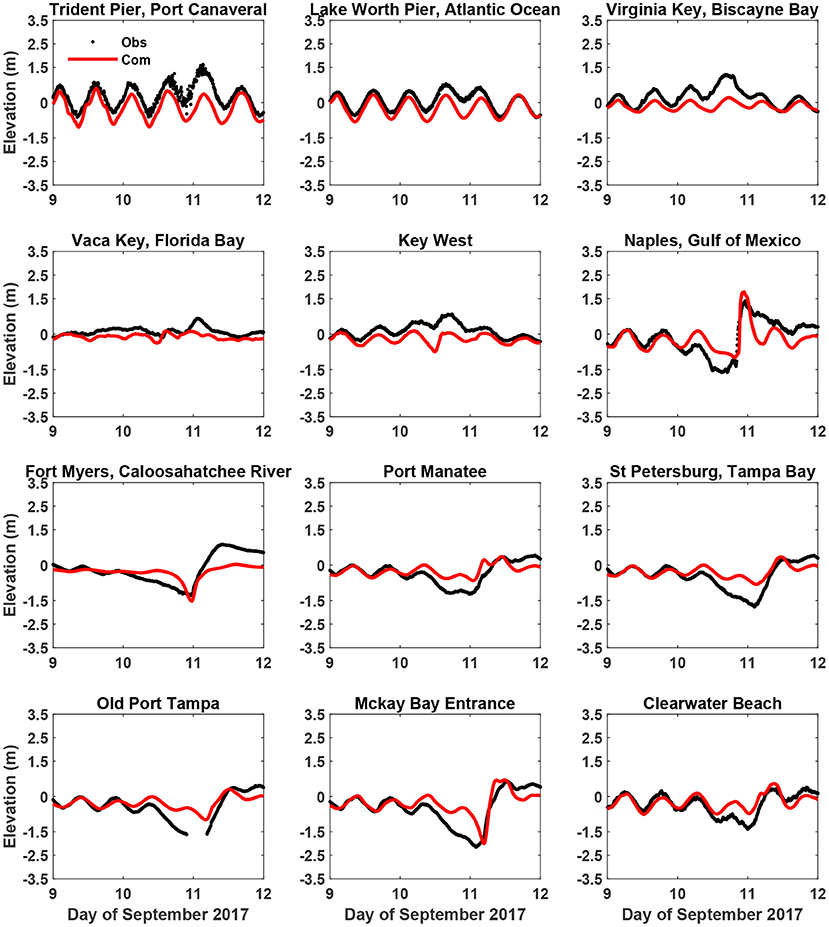
Figure 7. Comparison between the computed and the measured surface elevations at the various NOAA tide gauges.
Figure 8 presents the comparison for the HWM data. The CEST predictions have a root mean square error (RMSE) of approximately 0.69 m against the observations. This error is contributed significantly by the underprediction of the HWMs at Florida Keys and the South Florida mangrove zones (where the USGS gauges were marked, see Figure 5). A reason for this underprediction may be that these areas are close to the domain boundary, hence there is a limited fetch for wind to push water in.
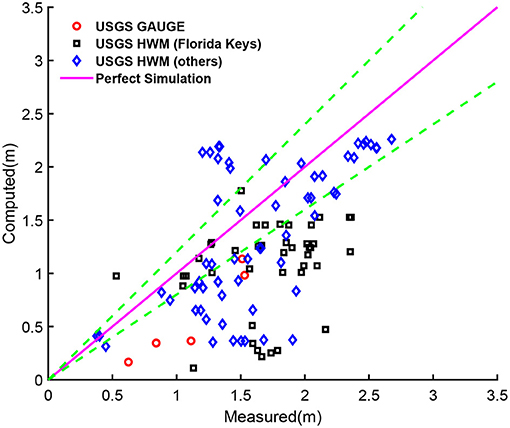
Figure 8. Comparison between the computed and the measured HWMs at the various USGS stations. The green dashed lines represent the perfect simulation×(100 ± 20%). Note that only those measurement stations inundated by the simulated storm surge were used.
Figure 9 presents the computed maximum storm surge height across the entire computational domain. It can be seen that the most severe storm surge inundation occurs at the right hand side of the track near the landfall location, where the area is known as the South Florida mangrove zone. The computed maximum storm surge height is over 3 m, but the overall inundation is kept within the mangrove zone due to the resistance of mangrove trees (Zhang et al., 2012). Figure 10 further shows the computed maximum storm surge profile along the four profiles depicted in Figure 9b. The maximum storm surge height gradually reduces as it moves inland. The inundation extents are roughly around 10 km at Profiles 1 and 2, and approximately half of that at Profiles 3 and 4. It should be mentioned however that storm surge could move further upland in the rivers as seen in Figure 9b. The overall maximum surge pattern is comparable with ADCIRC model results (Kowaleski et al., 2020).
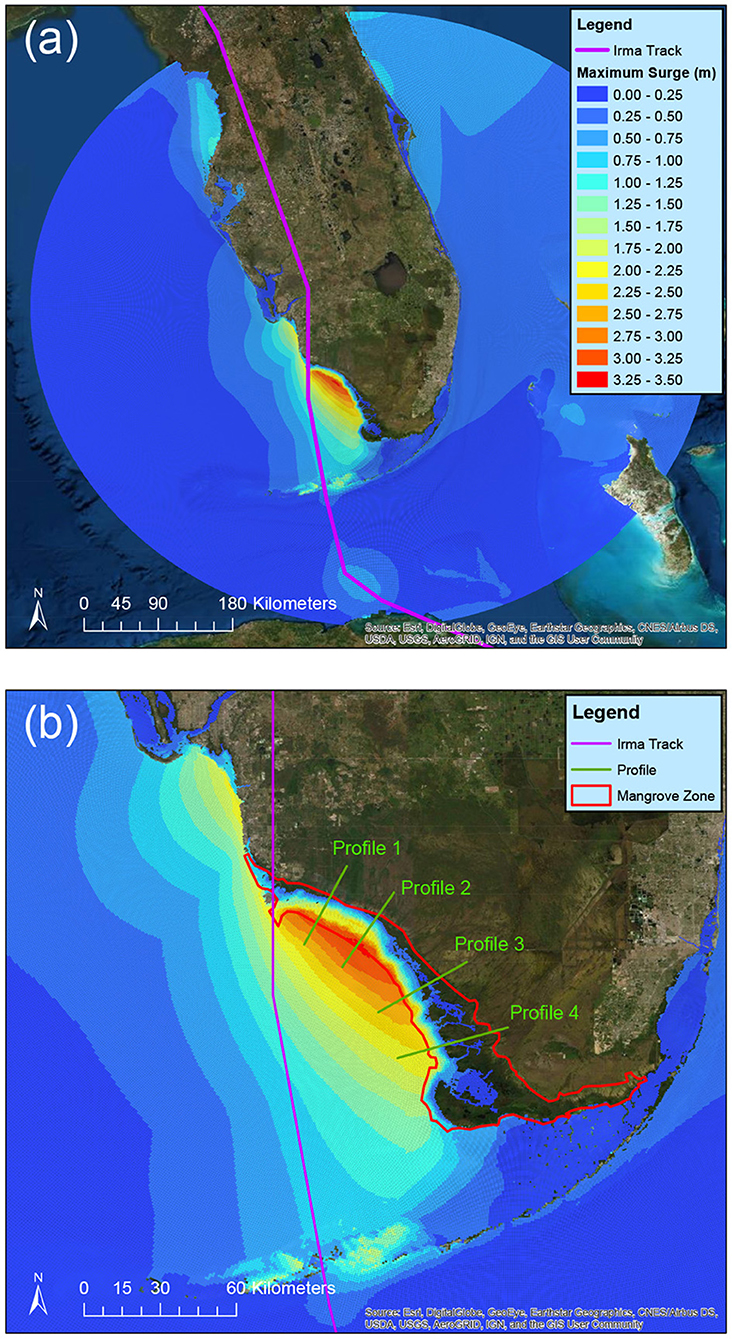
Figure 9. The computed maximum storm surge height in spatial distribution: (a) the entire domain, and (b) a zoomed-in domain centered at the South Florida mangrove zone. The data are referenced to the NAVD88 vertical datum. The locations of the four profiles for Figure 10 are also displayed.
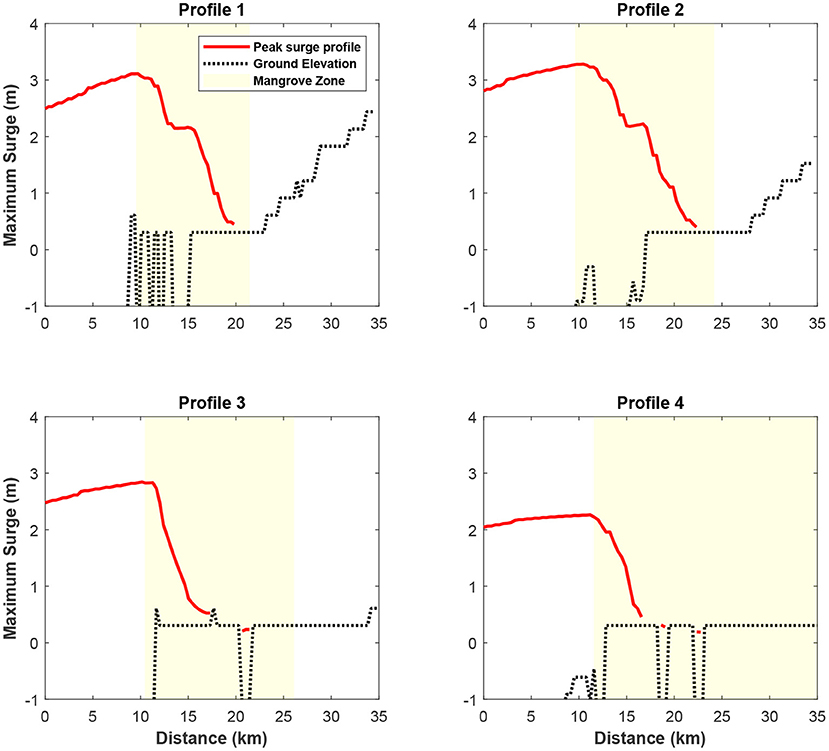
Figure 10. The computed maximum storm surge profiles along the four profile lines depicted in Figure 9. The data are referenced to the NAVD88 vertical datum.
4.6. Computational Cost and Parallel Efficiency
The parallel performance of CEST on the 4-day simulation of Hurricane Irma (2017) was examined using the parallel efficiency (Ep) and speedup (Sp) coefficients. The coefficients are defined following Chen et al. (2018):
where T1 and Tp are the total CPU time when using 1 and p processors. The simulation presented in this paper were run on a 32-core i7 CPU (3.7GHz) workstation. T1 is approximately 150 min. The parallel efficiency and the speedup coefficients are plotted in Figure 11. As can be seen, the parallel CEST model achieves linear and even super-linear speedup when the number of processors used are small (≤ 4). When the number of processors increases the speedup increases but also becomes flattened and the parallel efficiency drops linearly. Despite that 4 processors appear to be the optimal number for the current simulation in terms of parallel efficiency, as many as 10 processors can be used to reduce the total CPU time of simulation as a priority. In the current case, T10 is approximately 22 min.

Figure 11. The parallel efficiency and speedup of CEST at different number of processors for the simulation of Hurricane Irma (2017). The dashed line represents the linear speedup and is plotted for comparison purpose.
5. Discussion
This paper describes the parallelization of the IHRC–CEST model using the Message Passing Interface (MPI) library. The MPI parallelization approach allows the CEST model to be run optimally on a wide variety of computer architectures ranging from multi–core desktops to massively parallel supercomputers. Moreover, in the parallel CEST model simple Eulerian advection is replaced with high–order, monotonic semi–Lagrangian (SL) advection scheme. The high–order SL advection enables to use a larger model time–step,while maintaining numerical stability. The purpose of parallelizing the CEST model, and improving the advection efficiency, is to enable finer resolution ensemble forecasts to be undertaken at the IHRC on multi–core desktop machines. This allows for the most detailed bathymetric data available to be employed in forecast–mode surge simulations and thus facilitates the best possible representation of coastal topography. The use of finer computational grids for storm surge is known to improve predictions of the magnitudes and extent of storm surge flooding (Zhang et al., 2008). Results presented in this paper show that the wall clock time can be dramatically reduced through the use of a multicore desktop.
Data Availability Statement
The raw data supporting the conclusions of this article will be made available by the authors, without undue reservation.
Author Contributions
YL: conceptualization, methodology, validation, investigation, writing the original draft, visualization, and data curation. QC: software, validation, writing the review, editing, and data curation. DK: conceptualization, methodology, software, validation, investigation, and writing the original draft. KZ: supervision, conceptualization, and writing the review and editing. All authors contributed to the article and approved the submitted version.
Funding
This work was supported, in main, by Florida Public Hurricane Loss Model (FPHLM) project at International Hurricane Research Center of Florida International University.
Conflict of Interest
The authors declare that the research was conducted in the absence of any commercial or financial relationships that could be construed as a potential conflict of interest.
Publisher's Note
All claims expressed in this article are solely those of the authors and do not necessarily represent those of their affiliated organizations, or those of the publisher, the editors and the reviewers. Any product that may be evaluated in this article, or claim that may be made by its manufacturer, is not guaranteed or endorsed by the publisher.
References
Blain, C. A., Westerink, J. J., and Luettich, R. A. (1994). The influence of domain size on the response characteristics of a hurricane storm surge model. J. Geophys. Res. Oceans 99, 18467–18479. doi: 10.1029/94JC01348
Blumberg, A. F., and Herring, H. J. (1987). “Circulation modeling using orthogonal curvilinear coordinates,” in Three Dimensional Models of Marine and Estuarine Dynamics. Elsevier Oceanography Series, eds J. Nihoul and B. Jamart, vol. 45 (Elsevier Science, Amsterdam), 55–88.
Casulli, V. (1990). Semi-implicit finite difference methods for the two-dimensional shallow water equations. J. Comput. Phys. 86, 56–74. doi: 10.1016/0021-9991(90)90091-E
Chen, Q., Zang, J., Kelly, D. M., and Dimakopoulos, A. S. (2018). A 3D parallel Particle-In-Cell solver for wave interaction with vertical cylinders. Ocean Eng. 147, 165–180. doi: 10.1016/j.oceaneng.2017.10.023
Courant, R., Friedrichs, K., and Lewy, H. (1967). On the partial difference equations of mathematical physics. IBM J. Res. Dev. 11, 215–234. doi: 10.1147/rd.112.0215
Fedkiw, R., Stam, J., and Jensen, H. (2001). Visual simulation of smoke. SIGGRAPH 28, 15–22. doi: 10.1145/383259.383260
Garratt, J. R. (1977). Review of drag coefficients over oceans and continents. Month. Weather Rev. 105, 915–929. doi: 10.1175/1520-0493(1977)105andlt;0915:RODCOOandgt;2.0.CO;2
Holland, G. J. (1980). An analytic model of the wind and pressure profiles in hurricanes. Month. Weather Rev. 108, 1212–1218. doi: 10.1175/1520-0493(1980)108andlt;1212:AAMOTWandgt;2.0.CO;2
Kelly, D. M., Teng, Y.-C., Li, Y., and Zhang, K. (2015). A numerical model for storm surges that involve the inundation of complex landscapes. Coast. Eng. J. 57, 1–30. doi: 10.1142/S0578563415500175
Kowaleski, A. M., Morss, R. E., Ahijevych, D., and Fossell, K. R. (2020). Using a WRF-ADCIRC ensemble and track clustering to investigate storm surge hazards and inundation scenarios associated with Hurricane Irma. Weather Forecast. 35, 1289–1315. doi: 10.1175/WAF-D-19-0169.1
Large, W. G., and Pond, S. (1981). Open ocean momentum flux measurements in moderate to strong winds. J. Phys. Oceanogr. 11, 324–336. doi: 10.1175/1520-0485(1981)011andlt;0324:OOMFMIandgt;2.0.CO;2
Moretti, G. (2002). Thirty-six years of shock fitting. Comput. Fluids 31:719–723. doi: 10.1016/S0045-7930(01)00072-X
Myers, V., and Malkin, W. (1961). Some Properties of Hurricane Wind Fields as Deduced From Trajectories. Technical Report National Hurricane Research Project No. 49, Weather Bureau, US Department of Commerce, Washington, DC.
Nair, R., Côté, J., and Staniforth, A. (1999). Monotonic cascade interpolation for semi-Lagrangian advection. Q. J. R. Meteorol. Soc. 125, 197–212. doi: 10.1002/qj.49712555311
Pandolfi, M., and Zannetti, L. (1977). “Numerical investigations about the predictions of free surface shallow water motions,” in Proceedings 6th Australasian Hydraulics and Fluid Mechanics Conference (Adelaide, SA), 364–368.
Powell, M. D., Houston, S. H., Amat, L. R., and Morisseau-Leroy, N. (1998). The HRD real-time hurricane wind analysis system. J. Wind Eng. Indust. Aerodyn. 77–78:53–64. doi: 10.1016/S0167-6105(98)00131-7
Press W. Flannery B. Teukolsky S. Vetterling W. (1992). Numerical Recipes: The Art of Scientific Computing, 2nd Edn. New York, NY: Cambridge University Press.
Szpilka, C., Dresback, K., Kolar, R., Feyen, J., and Wang, J. (2016). Improvements for the Western North Atlantic, Caribbean and Gulf of Mexico ADCIRC Tidal Database (EC2015). J. Mar. Sci. Eng. 4, 72. doi: 10.3390/jmse4040072
Taylor, A., and Glahn, B. (2008). “Probabilistic Guidance for Hurricane Storm Surge,” in Preprints, 19th Conference on Probability and Statistics, 88th Amer. Meteor. Soc. Annual Meeting (New Orleans, LA), 8.
Yanenko, N. N. (1971). The Method of Fractional Steps: The Solution of Problems of Mathematical Physics in Several Variables. New York, NY: Springer-Verlag.
Zhang, K., Li, Y., Liu, H., Rhome, J., and Forbes, C. (2013). Transition of the coastal and estuarine storm tide model to an operational storm surge forecast model: a case study of the Florida coast. Weather Forecast. 28, 1019–1037. doi: 10.1175/WAF-D-12-00076.1
Zhang, K., Liu, H., Li, Y., Xu, H., Shen, J., Rhome, J., et al. (2012). The role of mangroves in attenuating storm surges. Estuarine Coast. Shelf Sci. 102–103, 11–23. doi: 10.1016/j.ecss.2012.02.021
Keywords: CEST, hurricane, parallelization, SLOSH, storm surge, advection, open MPI
Citation: Li Y, Chen Q, Kelly DM and Zhang K (2021) Hurricane Irma Simulation at South Florida Using the Parallel CEST Model. Front. Clim. 3:609688. doi: 10.3389/fclim.2021.609688
Received: 24 September 2021; Accepted: 02 July 2021;
Published: 05 August 2021.
Edited by:
Hatim O. Sharif, University of Texas at San Antonio, United StatesReviewed by:
Muhammad Akbar, Tennessee State University, United StatesSteven Cocke, Florida State University, United States
Copyright © 2021 Li, Chen, Kelly and Zhang. This is an open-access article distributed under the terms of the Creative Commons Attribution License (CC BY). The use, distribution or reproduction in other forums is permitted, provided the original author(s) and the copyright owner(s) are credited and that the original publication in this journal is cited, in accordance with accepted academic practice. No use, distribution or reproduction is permitted which does not comply with these terms.
*Correspondence: Yuepeng Li, eXVlcGxpQGZpdS5lZHU=
 Yuepeng Li
 Qiang Chen
 Dave M. Kelly3
 Keqi Zhang