 Marian Rosental
 Thomas Fröhlich
 Axel Liebich
- Institute for Energy- and Environmental Research, Heidelberg, Germany
The combination of carbon capture and utilization (CCU) and water electrolysis technologies can be used for the production of basic chemicals from carbon dioxide (CO2) and hydrogen. Here, we present a life cycle assessment (LCA) on a cradle-to-gate basis for the production of the following large volume organic chemicals: methanol, ethylene, propylene, benzene, toluene, and mixed xylenes. Investigated process chains comprise the following technologies: CO2 capture from an industrial point-source or from the atmosphere through direct air capture (DAC); alkaline water electrolysis for hydrogen production; methanol synthesis; methanol-to-olefins and methanol-to-aromatics synthesis including aromatics separation. Electricity is supplied by offshore wind turbines. The system boundary includes all relevant processes from cradle to gate. A scenario was set up by exchanging the background processes for the production of important infrastructure materials like aluminum, copper, steel, and concrete with future processes that are less resource intensive, less carbon intensive and include higher recycling rates (e.g., electric arc furnaces for steel production). LCA results show that the synthesis of the investigated chemicals from CCU processes will reduce greenhouse gas (GHG) emissions by 88–97%, compared to fossil-based production routes, when electricity from offshore wind turbines is used. At the same time, other environmental impacts like eutrophication and ozone depletion will increase. The main contributors to the environmental impacts are the energy supply for water electrolysis and direct air capture. Replacement of all plants for the production of the investigated products in Germany with CCU processes would lead to a 2–7% higher total primary energy demand for the whole country. At the same time, an overall reduction of the German GHG emissions by 6% is achieved, when using offshore wind power for these processes only. The future scenario using improved background technologies leads to a further small reduction of GHG emissions and largely reduces other environmental impacts. We therefore identify the reduction of emissions through improved base material production processes and recycling of aluminum, copper, steel and concrete as main objectives to reduce negative impacts for the production of basic chemicals from CCU technologies.
Introduction
The intense use of fossil resources leads to growing carbon dioxide (CO2) concentrations in the atmosphere and significant global warming, caused by the anthropogenic greenhouse effect (IPCC, 2018). In order to reduce greenhouse gas (GHG) emissions and to access alternative carbon sources in the chemical industry, new approaches through carbon capture and utilization (CCU) are discussed in science and industry (Mikkelsen et al., 2010; Kuckshinrichs and Hake, 2015; Otto et al., 2015; Sanz-Pérez et al., 2016; DECHEMA, 2017; Artz et al., 2018; Kätelhön et al., 2019). While most of the latest publications focus on the production of power-to-gas or power-to-liquid fuels (Merano and Ciferno, 2001; Jaramillo et al., 2008; Zhang et al., 2015; Sternberg and Bardow, 2016; UBA, 2016; Schmidt et al., 2018; Alhyari et al., 2019; Koj et al., 2019), only few consider the application of CCU for the production of chemicals (Kaiser et al., 2013; Kim et al., 2014; Otto et al., 2015). A discussion about the effect of substituting bulk chemicals such as methanol or ethylene through CCU products was started by Kätelhön et al. (2019). By substituting the feedstock of these bulk chemicals—replacing fossil resources by renewables—the production processes and amounts of downstream products like plastics or pharmaceuticals could remain unchanged. This would allow the chemical industry to use established process chains without major transformation challenges in the near future.
The development of alternative processes for the production of chemicals was often caused by scarcities of particular resources, e.g., the oil embargo in Germany during the Second World War, leading to the development of the Fischer-Tropsch-synthesis of hydrocarbons (Henrici-Olivé and Olivé, 1976), or the abundance of resources like coal leading to a majority of coal-based chemicals in China (Xu et al., 2017). The growing amount of CO2 in the atmosphere—around 3,200 Gt CO2 up to now (Le Quéré et al., 2018)—has a large global warming potential but may function as a possible resource. New strategies are developed to reduce this amount through sequestration or to use CO2 as a feedstock chemical (Hasan et al., 2015). While carbon capture and sequestration (CCS) would lead to permanent removal of CO2 from the atmosphere, the climate change mitigation potential of CCU is controversially discussed, because CO2 in products is only stored temporarily. When CO2 from fossil sources is used, CCU products only post-pone CO2 emissions. Mac Dowell et al. (2017) state, that CCU may only account for 4–8% of the total mitigation challenge and hence, may prove to be a “costly distraction […] from the real task” of mitigating climate change.
There are several LCA studies that were published in the last years, highlighting the GHG effects of CCU on chemical production, such as polyols and polyurethane (Von Der Assen and Bardow, 2014), C1 chemicals in general, formic acid, methane, methanol, dimethyl ether and derived polymers (Matzen and Demirel, 2016; Sternberg et al., 2017; Hoppe et al., 2018; Aldaco et al., 2019) and various other chemicals (Thonemann and Pizzol, 2019). As upcoming CCU technologies may help to reduce CO2 emissions, impacts in other categories are often neglected. Focusing on climate change mitigation only, might neglect undesired environmental effects (Hoppe et al., 2018; Rosental, 2020), hence, a holistic approach is necessary to assess a broad selection of potential environmental risks: Life cycle assessment (LCA) is a suitable method to evaluate such environmental impacts. Including the whole life cycle of the products prevents the shift of environmental risks beyond the observed system. The following LCA study will provide a detailed examination of all relevant processes necessary to obtain CO2 and produce hydrogen on a renewable basis, used for the production of basic chemicals and furthermore an assessment in multiple environmental impact categories, which is lacking up to date.
Goal and Scope of the LCA
The objective of this LCA study is to quantify the global warming impact (GWI) and other environmental impacts of CCU technologies and to identify key elements to reduce environmental impacts. Therefore, we investigate the environmental impacts of large volume basic chemicals produced from CCU with offshore wind energy compared to the present fossil-based production. Results of the “RESCUE” study (Resource-Efficient Pathways to Greenhouse-Gas-Neutrality) of the German Environment Agency (UBA, 2019b) will be used to model pathways of a base materials supply in 2050. This will be compared to the present base materials production. Based on this model, we identify significant key parameters to reduce overall emissions that result from renewable CCU chemical production. Including other impact categories besides global warming will assure a holistic approach of the LCA, quantifying environmental impacts for the production of basic chemicals from renewable sources.
Product System and System Boundaries
The product system is shown schematically in Figure 1. The foreground system (FGS) consists of a CO2 capturing module (DAC or amine scrubbing), an electrolysis module and a synthesis process. CO2 and hydrogen are reacted in a chemical plant to synthesize the desired product, which is processed for further purification of single compounds. The product system also includes electricity and heat generation, infrastructure and auxiliary material provisions as background system (BGS). Following a 100:0 allocation approach, the CO2 point-source is excluded from the system, leaving all expenses and burdens for producing CO2 and main products (e.g., clinker or energy) on the emitting system. Reference systems comprise state of the art production of methanol from syngas, olefins from steam cracking and aromatics from catalytic reforming of naphtha. We decide not to use the system expansion approach as this would change the scope and functional unit of this study, focussing on chemical products only. Applying system expansion would lead to several by-products needed to be taken into account, followed by comparability issues due to different possible functional units for several CO2 point-sources (Von Der Assen et al., 2013). System boundaries for chemical products are cradle-to-gate, so further phases of processing, distribution, use, and recycling or disposal until end-of-life (EoL) are not considered.
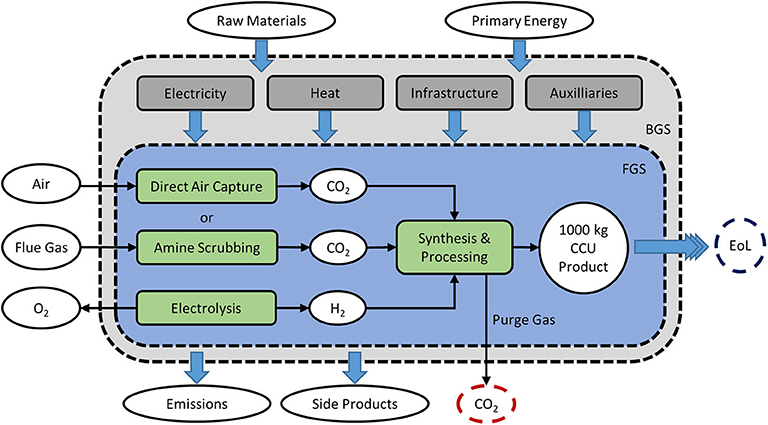
Figure 1. Product system containing fore- and background systems (FGS = blue, BGS = gray). CO2 can be extracted from air by DAC, or from a point-source using amine scrubbing. Hydrogen is provided by alkaline electrolysis. CCU products are synthesized and processed for purification. The functional unit (FU) is defined as 1,000 kg of a CCU product. EoL = end-of-life, side products = butene, alkylated aromatics, etc. (compare Table 2).
Functional Unit and Allocation Method
The functional unit (FU) is defined as one metric ton (1,000 kg) of one of the desired products, respectively: methanol, ethylene, propylene, benzene, toluene, mixed xylenes. Physical allocation by mass is applied by default. In chemical synthesis and processing, feedstock is allocated to all products; energy input and other expenses and emissions (including direct CO2 emissions from purge gas combustion) are allocated by mass to the intended products only (see Table 2). All other by-products carry the burdens of the respective feedstock and are not investigated further, following existing methodological recommendations of the European Commission and PlasticsEurope (European Commission, 2003, 2019; PlasticsEurope, 2017). As a result, target products from the same process have identical environmental impacts per kg of product. In the Results section (chapter 4) products will be presented in three groups: methanol, olefins (ethylene and propylene) and BTX (benzene, toluene, xylenes). Oxygen from water electrolysis is considered an unintended by-product which receives no burdens, leaving all burdens on the main product hydrogen, following a conservative approach. Lost CO2 from purge gas combustion is taken into account for captured CO2, which will not be incorporated in the CCU product. The additional expenses, energy and resource requirements are assigned to the main products, the corresponding direct CO2 emissions are reported separately. Excess thermal energy receives no burdens.
Accounting Method for CO2
As a consequence of the 100:0 allocation approach, the uptake of CO2 is treated as negative emissions (−1 kg/kg) and the release at all life cycle stages, including CO2 at end-of-life (EoL), as positive emissions (+1 kg/kg), balancing each other in absolute terms. Emissions during further processing, distribution, use and recycling or disposal are not taken into account. Only the stoichiometrically calculated emission of CO2 at EoL from complete combustion of the product is considered and reported separately, because long-time storage of CO2 cannot be guaranteed. Therefore, system boundaries are expanded to cradle-to-gate + end-of-life (C2G + EoL) for global warming impacts. Accounting for the release of temporarily stored carbon1 avoids reporting net-negative CO2 emission results, which otherwise would be calculated using the cradle-to-gate approach in the 100:0 allocation method. Additionally, exemplary results for the 0:100 allocation approach are calculated for CO2 point-sources to demonstrate the pitfalls that can lead to omitted accounting of fossil CO2 emissions.
Impact Categories
For the life cycle impact assessment (LCIA) six relevant impact categories are considered (Table 1). These categories (GWI, CED, AP, EP, ODP, PM2.5) represent commonly affected environmental impacts, where conflicts of interest could occur in terms of environmental protection goals (UBA, 2017). Other relevant impact categories such as freshwater consumption or land use were excluded due to the lack of primary data for CCU plants in the foreground system or missing reference values in the ecoinvent and PlasticsEurope datasets for feasible comparability.
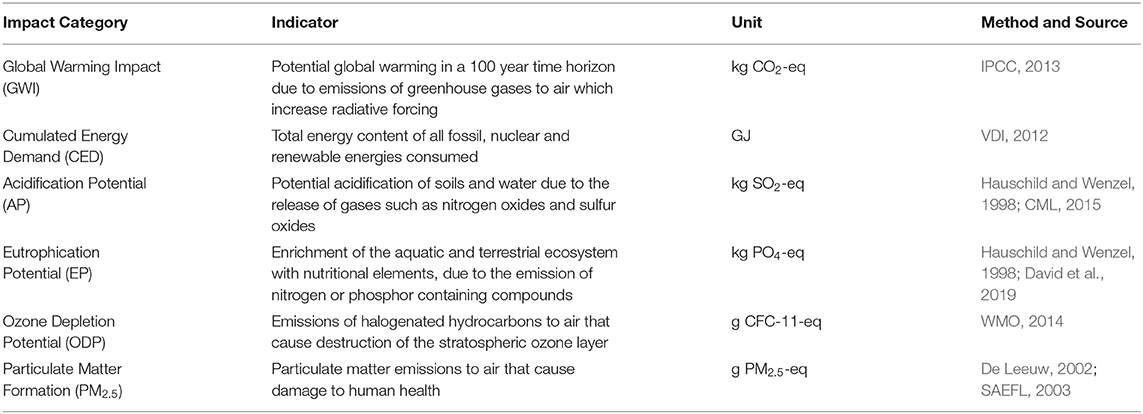
Table 1. Impact categories used for the LCIA, relevant indicators, and underlying method.
General Assumptions and Limitations
Model parameters can be modified in many possible ways, therefore, a general set of comprehensive (background system) assumptions is applied:
1. Electricity is provided by offshore wind turbines in general; energy storage is not considered. The emission factor of offshore wind energy is 5.4 g kWh−1 in 2010 and 2.4 g kWh−1 in 2050 (UBA, 2020).
2. Heat energy is provided by electric heating with energy from offshore wind turbines.
3. Excess heat energy from chemical reactions is used for CO2 capture thermal energy demand with 100% efficiency.
4. Manufacturing of aluminum, copper, steel, and concrete is adjusted to an optimized resource extraction and recycling, projected for the year 2050 according to the “RESCUE” study (Resource-Efficient Pathways to Greenhouse-Gas-Neutrality) of the German Environment Agency (UBA, 2019b); comparison with the current situation (year 2010) is shown.
5. CO2 capture, water electrolysis and chemical synthesis are conducted “on-site,” therefore infrastructure for compression, transportation and distribution is neglected.
6. Production infrastructure is included, as the relative impacts of fossil-based infrastructure becomes relevant when energy from non-fossil energy sources is used for the foreground processes.
7. Production plants are operated at full capacity (8,700 h a−1); the production capacity of ecoinvent modules (chemical factory, organics) with 50 kt a−1 and 50 years lifetime is scaled according to the product output and infrastructure specifications shown in Table 3.
8. It is assumed that chemical synthesis is carried out with a 2% purge gas combustion to prevent reactors from accumulating inert gases. Complete conversion of the purge gas to CO2 and water is assumed.
Limitations for these assumptions include (a) heat integration with 100% energy efficiency assumed and without separating temperature levels; (b) purge gas combustion neglecting the formation of other organic and inorganic compounds, therefore only accounting for GWI as impact category; (c) EoL impacts of the products covering stoichiometrically calculated CO2 emissions only. These assumptions frame a “best case” scenario with utilization of renewable low-carbon energy, minimal transport distances, maximum energy efficiency, and optimized resource pathways in which CCU production of chemicals could take place.
The fossil reference system is not affected by those assumptions, especially energy and construction material supply and therefore, was not prospectively assessed. Feedstock and main operation processes will remain unchanged, e.g., steam cracking, as these processes are defined as reference. While energy supply does not play a significant role for these fossil processes, construction materials are neglectable for a large scale chemical production (PlasticsEurope, 2012, 2013).
Investigated Processes and Inventory
Here, the chemical processes necessary for operating CCU technologies to produce chemicals are described shortly. Input and output metrics of the synthesis and processing life cycle inventory (LCI) are given in Table 2, detailed technological parameters are shown in Table 3. Direct air capture, amine scrubbing, electrolysis, background system and energy models were adapted according to the SYSEET study, detailed building parameters are given in the annex2 of this study (UBA, 2020).
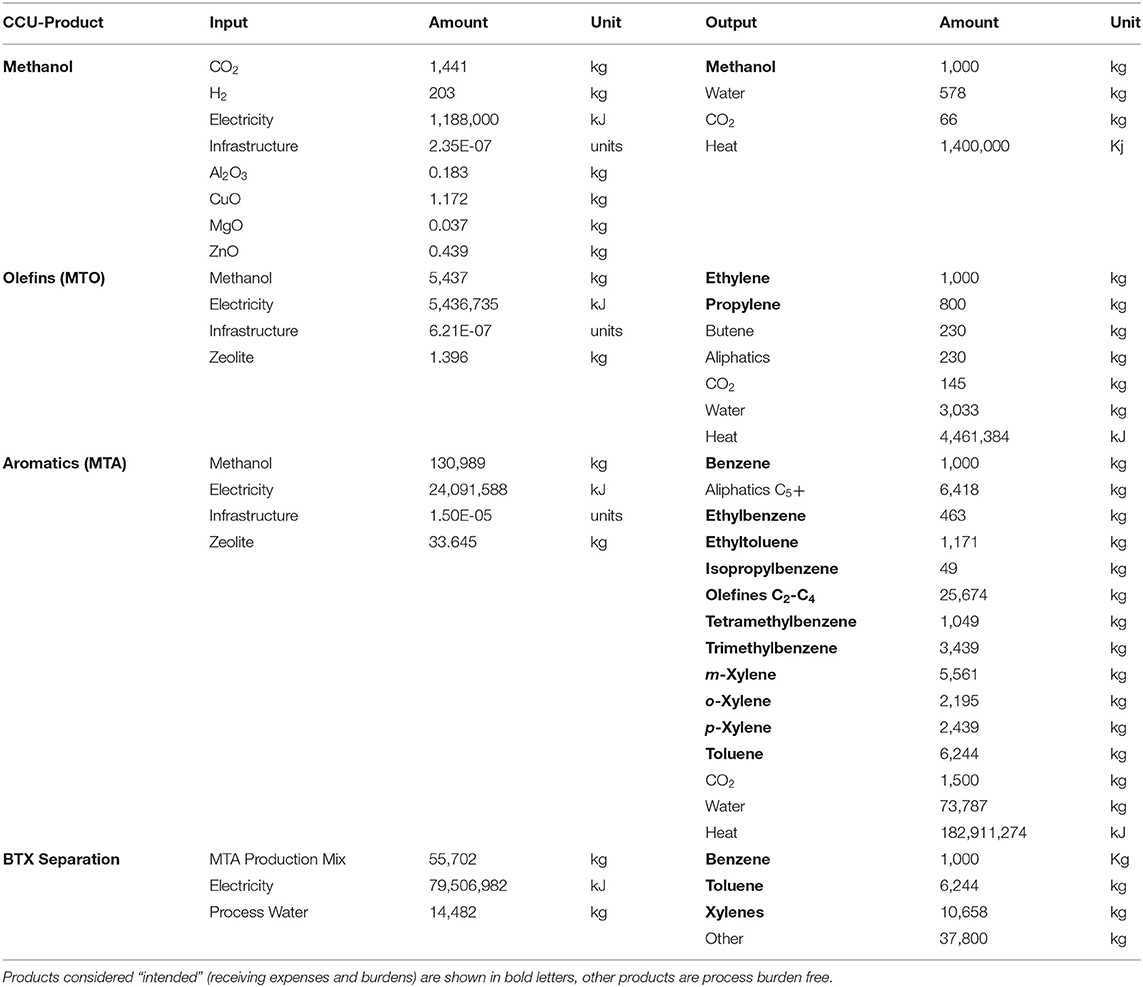
Table 2. Input and output metrics of chemical synthesis modules producing 1,000 kg of the respective product.
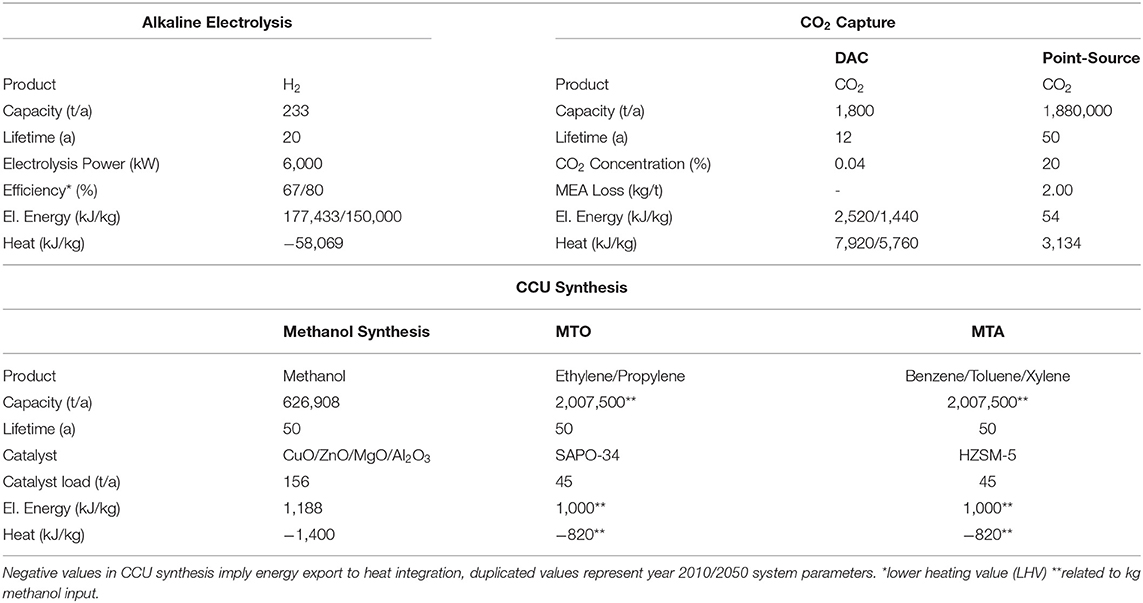
Table 3. Technological parameters of alkaline electrolysis, CO2 capture, and CCU synthesis modules.
Direct Air Capture
In the DAC unit, air is filtered through an amine functionalized adsorbent capturing CO2. After reaching full capacity, the unit is evacuated and heated to release purified CO2. Pilot plants are operated by Climeworks, providing technological data for the overall process (Climeworks, 2018a). The unit is operated between 80°C and 120°C with a thermal energy demand of 5.76–7.92 GJ t−1 CO2 and an electricity demand of 1.44–2.52 GJ t−1 CO2. The yearly production rate is 1,800 t CO2 a−1 with a unit lifetime of 12 years (Climeworks, 2018b). Detailed reviews of current DAC technologies, as well as economic considerations are given by Sanz-Pérez et al. (2016) and Fasihi et al. (2019).
Amine Scrubbing
Capturing CO2 from point-source flue gases can be achieved through amine scrubbing with aqueous amine solutions, e.g., with monoethanolamine (MEA) (Knudsen et al., 2009; Rochelle, 2009; Luis, 2016). MEA is synthesized by oxidation of ethylene to ethylene oxide and further conversion by reacting it with ammonia. MEA absorbs CO2 by reacting to the carbamate in alkaline solution and heating the CO2 rich solution will regenerate MEA and release pure CO2. Typical amine solutions consist of 20–30 wt% MEA and reach an absorbance of 90% CO2. The production capacity of the capture unit is 1.88 Mt a−1 with a lifetime of 50 years. Thermal energy demand for a flue gas containing 20% CO2 is around 3.13 GJ t−1 CO2 and the electricity demand is 54 MJ t−1 CO2 (Husebye et al., 2012). The degradation of MEA amounts to 2 kg t−1 captured CO2. Mechanisms for the degradation of amine solutions have been studied intensively (Goff and Rochelle, 2004; Bello and Idem, 2005), while the monitoring of pilot plants operated in Mongstad, Norway gives detailed emission results from CO2 capture with MEA (Morken et al., 2014, 2017).
Alkaline Water Electrolysis
Alkaline electrolysis (AE) is achieved in solutions of 20–30 wt% NaOH or KOH with nickel electrodes, separated by a diaphragm. Hydrogen is produced at the cathode, while oxygen is produced at the anode (Equation 1). Typical specifications are operating temperatures of 60–80°C, cell pressures <30 bar, current densities <0.45 A cm−2, cell voltages of 1.8–2.4 V and electrical efficiencies ranging from 62 to 82% (lower heating value, LHV) (David et al., 2019). In this study an efficiency of 67% is used.
Methanol Synthesis
Methanol can be synthesized from CO2 by reduction with hydrogen over copper/zinc oxide catalysts on alumina at 250°C and 80 bar pressure (Equation 2) (Amenomiya, 1987; Chinchen et al., 1987). A commercial plant is operated by Carbon Recycling International in Iceland since 2011, with a total production volume of 4,000 t a−1 methanol (Olah, 2013).
Methanol synthesis requires 1.2 MJ electric energy per kg methanol produced and releases 1.4 MJ thermal energy, which is utilized for CO2 capture energy demand. The production capacity is given with 627 Mt a−1, considering a lifetime of 50 years and 156 t of catalyst load per unit and year. Data from process simulations, performed by Meunier et al. (2020), are considered for the life cycle inventory (LCI). To produce 1,000 kg methanol, 1,441 kg CO2, and 203 kg H2 are needed, including an increased input feed through purge gas combustion, hence a total methanol yield of 93.4%.
Methanol-To-Olefins (MTO)
Ethylene and propylene can be synthesized from methanol in the MTO reaction over zeolite catalysts at 495°C (Equations 3–5) (Chang and Silvestri, 1977). A commercial MTO plant is operated in China, which produces 0.6 Mt of polyethylene and polypropylene from methanol, consuming 2.96 t methanol per ton of ethylene/propylene (Tian et al., 2015). The production capacity is around 2 Mt a−1 with a lifetime of 50 years and a catalyst load of 45 t per year. Estimated electric energy demand is 1 MJ t−1 methanol input, while 820 kJ t−1 methanol excess thermal energy is provided for CO2 capture.
Methanol-To-Aromatics (MTA)
Aromatics like benzene, toluene, xylene (BTX) and many more can be synthesized from methanol at 400°C, analogous to the MTO reaction. Using modified, more acidic zeolite catalysts ensures a conversion to mainly aromatic compounds (Adebajo and Long, 2003). Technological parameters are identical to those used in the MTO process. The aromatic compounds are refined and purified to isolate benzene, toluene, xylenes, and higher aromatic compounds from the BTX mixture, requiring ~1.4 MJ kg−1 electric energy. In current fossil-based processes, xylenes are extracted from raffinate or pygas as a mixture of o-xylene (25%), m-xylene (40%), p-xylene (18%), and ethylbenzene (17%) (PlasticsEurope, 2013). The composition of xylenes in the MTA process differs from the fossil product mixture. However, due to the mass allocation in the MTA process module (compare chapter 2) there is no difference in the environmental impacts of various xylene mixtures3 and these can be compared equally.
Background System Optimization
As part of the transformation to a largely greenhouse gas neutral economic system, which is aimed for by the German government by 2050, the environmental impacts of the processes under consideration are changing. Studies funded by the German Environment Agency (UBA) investigated the impacts on resource use and environmental impacts of this transition (UBA, 2014, 2019a,b). In these studies, it was assumed that until 2050 electricity generation will be successively switched to renewable sources, recycling rates in the production of iron, steel and other metals will increase, fossil raw materials and fuels in industry and transport will be replaced by those with a smaller carbon footprint. In order to estimate how the changes in this background system will affect the environmental impacts of the manufacture of the products under consideration, numerous processes in the models of life cycle assessment (LCA) and life cycle impact assessment (LCIA) have been taken into account for the calculations for the support year 2050. Data for the changes on the transformation path were taken from the study “Resource-Efficient Pathways to Greenhouse-Gas-Neutrality” (RESCUE). This process is described in detail in the SYSEET study (UBA, 2020). In particular, the following processes were adapted:
• Electricity generation with 100% renewable energies (incl. PtG (power-to-gas) with conversion into electricity),
• Steel production (increasing recycling rates, conversion to hydrogen as a reducing agent in the DRI (direct reduced iron) process),
• Cement production (firing with methane from PtG production, reduction of the clinker factor, novel binders)
• Aluminum and copper production (increasing recycling rates, conversion to inert anodes).
The adapted processes were placed inside the model, where aggregated datasets (e.g., organic factory construction or the construction parameters for an electrolysis cell-stack) were subdivided in their respective construction material components and replaced with the optimized construction materials. The LCI datasets for the respective construction materials can be found in the Supplementary Material.
LCIA Results and Discussion
For every process, electricity from offshore wind turbines and hydrogen from alkaline electrolysis is used, while CO2 is provided either by DAC or by amine scrubbing from a concentrated point-source (PS). Hydrogen and CO2 are then converted to the respective chemicals: methanol, ethylene and propylene (olefins), benzene, toluene and mixed xylenes (BTX). Two scenarios are provided for the production of aluminum, copper, steel and concrete as building materials today (2010) and projected for the year 2050. The products from both, CCU synthesis in 2010 and 2050, are compared to the respective fossil-based reference products with today's technology level; detailed results for environmental impacts of the reference systems are given in Table 4 (ecoinvent, 2007; PlasticsEurope, 2012, 2013).
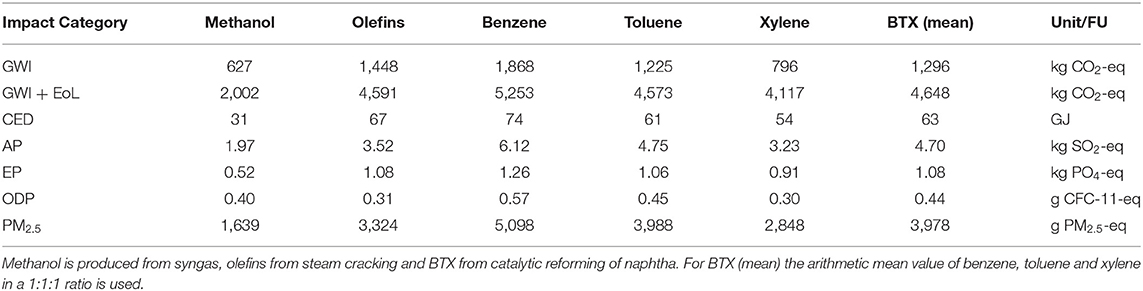
Table 4. Environmental impacts of 1,000 kg fossil reference products.
Reading Example
An example on how to understand GWI results is provided in Figure 2. Comprising a larger amount of single values, the following contributions can be found: Uptake (Up) of CO2 entering the system, which is accounted as “negative” emissions due to the 100:0 allocation approach; process emissions (Em) within the system, subdivided in single process steps; stoichiometrically calculated end-of-life (EoL) emissions after combustion of the product and release of stored CO2; summarized value (Sum) of all contributions representing a C2G + EoL system. Because the values for the “Uptake,” “CO2 Loss,” and “EoL” emission always add up to zero, these values are excluded from following result figures. For simplification and better readability, only process emissions (Em) and summarized values (Sum) will be shown and discussed in the following chapter. For other impact categories, only process emission contributions are shown, as uptake and EoL are not considered.
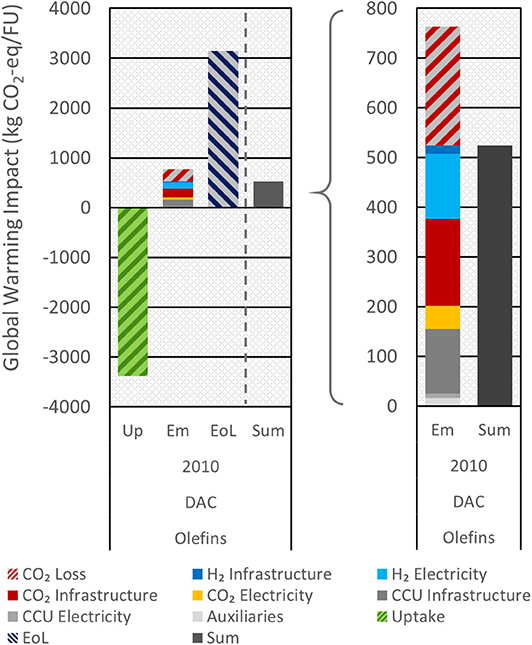
Figure 2. Reading example of GWI results. GWI values comprise the following contributions: Uptake (Up) of CO2 entering the system (“negative” emission) due to the 100:0 allocation; process emissions (Em) within the system; stoichiometrically calculated end-of-life (EoL) CO2 emissions after combustion of the product; summarized value (Sum) of all contributions, representing C2G + EoL. For simplification, only process emissions (Em) and summarized values (Sum) will be shown, as “Uptake,” “CO2 Loss,” and “EoL” always add up to zero.
Furthermore, figure keys showing process emissions (Em) comprise the following processes:
• Auxiliaries: Auxiliary material production (e.g., carbon black, ethylene glycol), including required energy consumption and energy infrastructure with upstream processes.
• CCU Electricity: Production of electric energy for organic chemical synthesis and electric heat generation, including energy infrastructure and upstream processes.
• CCU Infrastructure: Organic chemical plant infrastructure and upstream processes for all building materials.
• CO2 Electricity: Production of electric energy for CO2 separation processes and electric heat generation, including energy infrastructure and upstream processes.
• CO2 Infrastructure: DAC plant infrastructure or amine scrubbing facilities and auxiliary materials, including upstream processes for all building materials.
• H2 Electricity: Production of electric energy for H2 production processes, including energy infrastructure and upstream processes.
• H2 Infrastructure: Alkaline electrolysis infrastructure and upstream processes for all building materials.
• CO2 Loss: Direct CO2 emissions from purge-gas combustion in organic chemical synthesis.
• Reference: Reference value of the respective fossil process, according to Table 4.
Global Warming Impact (GWI)
Producing large volume organic chemicals from CCU processes will result in lower CO2 emissions compared to fossil reference processes (Figure 3). The GWI value is 50–540 kg CO2-eq/FU, compared to the respective fossil reference with 2002–4648 kg CO2-eq/FU. Therefore, GWI for chemical production can be decreased by 88–97% for products from CCU synthesis. Emissions in DAC scenarios mainly result from DAC plant construction, infrastructure for offshore wind electricity production for water electrolysis and the construction of chemical plants, while emissions in PS scenarios are lower, because of lower energy demand from amine scrubbing facilities. In the future scenario (2050), the overall GWI is more than 50% lower compared to the current production (2010). These optimized processes account for a great GHG reduction potential in applying CCU technologies. Nevertheless, direct CO2 emissions from purge gas combustion would account for a considerable part of the process emissions, which should be considered in a holistic approach. The share of direct CO2 emissions is in the range of 26–68% of the total emissions, however, does not account for the summarized GWI value due to the allocation method and previous uptake of CO2 (see chapter 2).
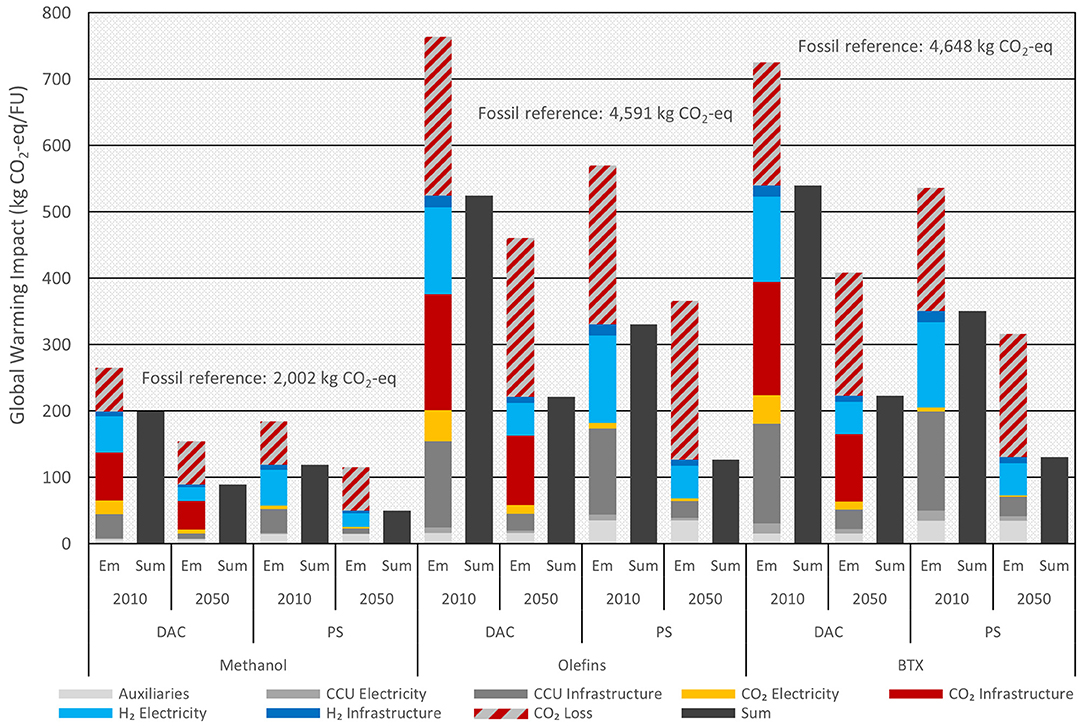
Figure 3. 100:0 allocation approach. GWI for the production of methanol, olefins, and BTX from CCU technologies. Results are subdivided into direct air capture (DAC) and point-source (PS) scenarios with the current resource fabrication (2010) and an optimized, projected resource fabrication for the year 2050. Fossil reference values are out of scale and added separately, showing the large GHG reduction potential.
Considering the 0:100 allocation approach for CO2 point-sources, the system receives no credit for the uptake of CO2. Therefore, emissions at EoL and emissions from purge gas combustion are not amortized and need to be allocated to the product. This results in lower GWI reduction as shown in Figure 4. The GHG reduction potential of chemicals produced with CO2 from PS in the optimized system (2050) is only 21–26% compared to 88–97% in the 100:0 allocation system. The largest contribution is caused by EoL emissions, accounting for more than 90% of the total process emissions, while CO2 from purge gas combustion will account for 4–7% of the emissions.
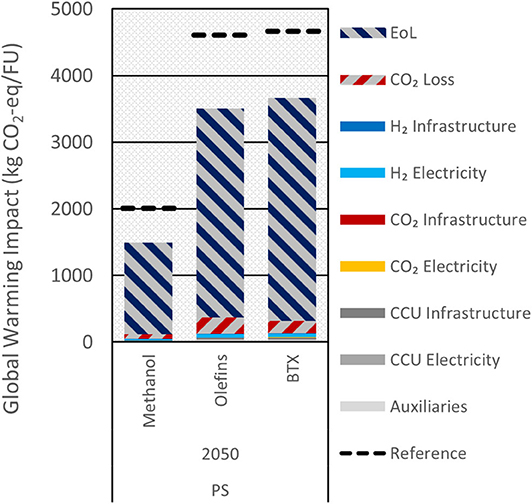
Figure 4. 0:100 allocation approach for CO2 point-sources. Contributions of process emissions and end-of-life (EoL) to the GWI for chemical production with CO2 from point-sources (PS) in the optimized system (2050). GWI reduction is much smaller, when CO2 from PS is allocated to the products.
Cumulated Energy Demand (CED)
The production of basic chemicals from CCU processes will lead to an increased CED, compared to fossil-based products (Figure 5A). CED values are ranging from 39 to 140 GJ/FU, this is an increase by 22–110%. The main energy demand results from electricity production for water electrolysis and heat supply for DAC. Integration of reaction heat can provide 12–25% (DAC) and 31–62% (PS) of the required heat demand for separating CO2 for CCU chemical production.
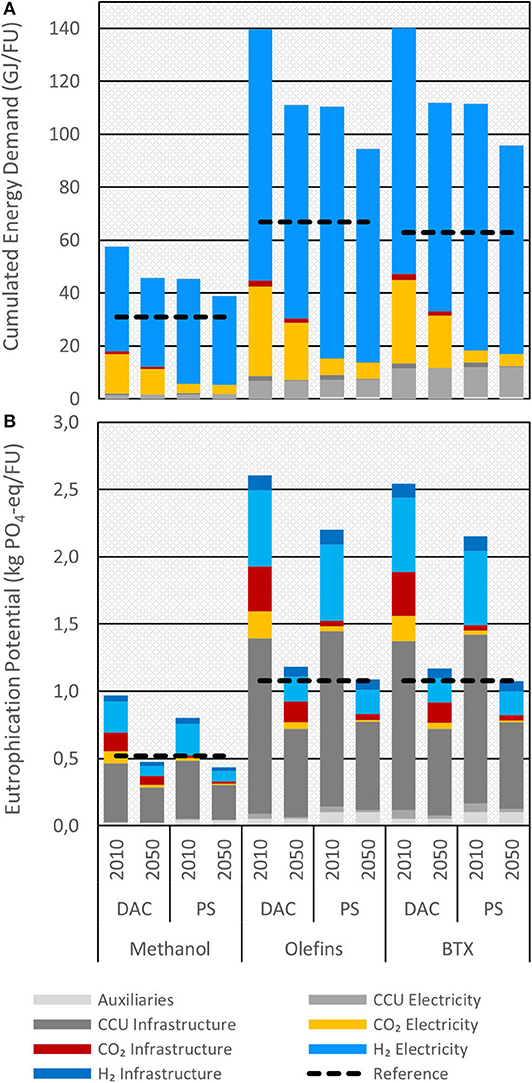
Figure 5. Cumulated energy demand (A) and eutrophication potential (B) for methanol, olefins and BTX from CCU production compared to the respective fossil references. Results for AP, ODP, and PM2.5 can be found in the SI.
Acidification Potential (AP)
Impacts in the AP are caused by chemical plant and DAC infrastructure production, water electrolysis, and electricity production. While CCU products in DAC scenarios with today's base material production show higher AP values than reference products, DAC and PS scenarios for the year 2050 lie below the reference values. Emissions from methanol production can be decreased by 27–36%, olefins by 12% and BTX by 2 or 36% for CO2 from PS and DAC, respectively (see Supplementary Material).
Eutrophication Potential (EP)
Eutrophication would increase through higher resource demand and emissions of nitrogen-based flue gases, mainly caused by chemical plant production and catalyst production. These emissions can be cut in half using optimized production routes of aluminum, copper, steel, and concrete. But even then, EP values of methanol, olefins and BTX from CCU production will remain on the same level as fossil reference emissions in the year 2050 scenario (Figure 5B).
Ozone Depletion Potential (ODP)
ODP would mainly be caused by the construction of DAC plants. A contribution analysis showed that the impact results from the production of anionic resin for ion exchange, used as a proxy for CO2 adsorbent materials, which causes high amounts of atmospheric tetrachloromethane (R-10) emissions. The emission of R-10, however, results from the production of trichloromethane (chloroform), which is used as a solvent to produce anionic resins. For the production of chloroform, a 0.1% emission of R-10 is assumed in the ecoinvent dataset, leading to high emissions and high ODP impacts (ecoinvent, 2007). Therefore, the ODP value increases by 158–732% compared to the fossil references (see Supplementary Material). However, the uncertainty of these values seems high, as we cannot verify the R-10 content in chloroform or the airborne emissions resulting from their application in solvent use and disposal. An uncertainty analysis using other module proxies was not performed.
Particulate Matter Formation (PM2.5)
The distribution of particulate matter emission sources is similar to these of acidic compounds. While CCU products produced with CO2 from PS amine scrubbing generally show lower values than reference products, DAC gains an advantage in the year 2050 system. Emissions reduction is 39–51% for methanol, 25–40% for olefins, and 38–51% for BTX products in 2050 (see Supplementary Material).
Sensitivity Analysis
A sensitivity analysis was performed by changing several foreground system parameters and investigating their impacts on LCIA results. Therefore, two scenarios were created varying parameters of the previously identified processes which contribute to the environmental impacts in the DAC production pathways. These parameters are the energy and heat demand for water electrolysis and direct air capture as well as the lifetime of the production units (Table 5). While the lifetime of the production units was increased or decreased by 5 years for the highly developed and low developed system, respectively, heat and energy demand for the year 2010 and 2050 systems were interchanged to model intermediate system development. Sensitivities for energy supply and allocation including oxygen from AEL have been demonstrated in Rosental (2020).
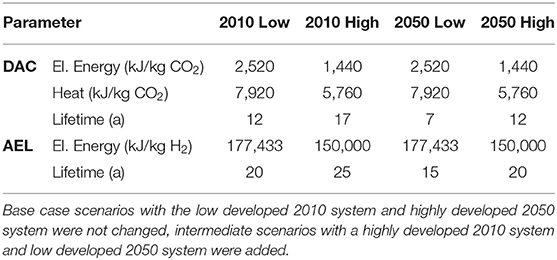
Table 5. System parameters for the sensitivity analysis.
Results for the sensitivity analysis for GWI are shown in Figure 6, detailed results for other impact categories can be found in the Supplementary Material. The variation of the GWI values is 13–25% for methanol, 8–20% for olefins, and 11–25% for BTX for the 2010 and 2050 system, respectively. The increased and decreased lifetime for CO2 infrastructure is contributing to the biggest changes, while variation of heat and energy demand is only causing minor changes. The adaption of background changes in the 2010 and 2050 systems remains for the most important emission reduction potential. Similar results are obtained for every impact category besides the cumulated energy demand. For CED, the variation of foreground parameters results in almost identical CED values as the background system construction material adaption. This is indicating, that the decreasing energy demand for CO2 and H2 production is main driver of a lower CED. While the influence on GWI in the sensitivity analysis is low because of the application of low carbon energy from offshore wind turbines to the system, the impact on the CED is not affected by this choice.
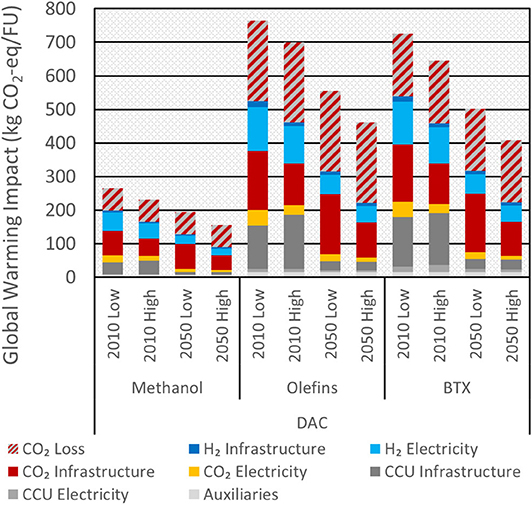
Figure 6. Sensitivity analysis for GWI. Variation of the GWI values is 13–25% for methanol, 8–20% for olefins, and 11–25% for BTX for the 2010 low vs. high and 2050 low vs. high system, respectively. Changes in the background system remain for major GWI reduction potential.
Normalization
Different supply paths lead to increasing or decreasing impacts in respective impact categories compared to the fossil reference. In order to contextualize the potential environmental impacts of CCU based basic chemical production, results of the LCIA are normalized. The additional burdens and reliefs in the respective impact categories (the difference between CCU and fossil production) is set in relation to the current environmental impacts in Germany (Table 6). For this purpose, we assume the entire production of these chemicals in Germany would be changed from fossil to CCU processes; in this way the hypothetical burdens and reliefs compared to the current reference year 2016 can be calculated (Figure 7).
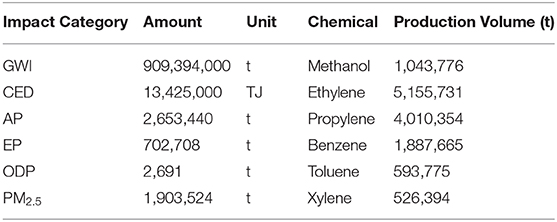
Table 6. Total environmental impacts in Germany in 2016 (left) and production volumes of basic chemicals in 2016 (right) (UBA, 2018; VCI, 2018).
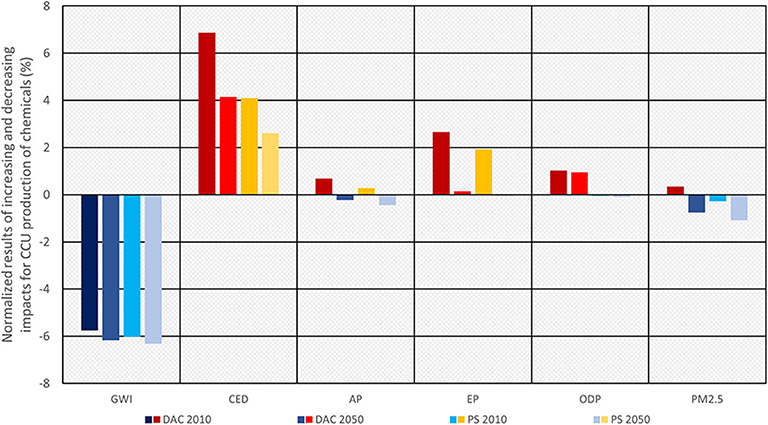
Figure 7. Normalized results for emission reductions (negative, blue) and increases (positive, red) in different impact categories from substitution of fossil products through CCU chemicals in the Federal Republic of Germany in 2016.
Changing chemical production to CCU based feedstock, would contribute to an overall GWI reduction for Germany of 5.8–6.2% for CO2 from DAC and 6.0–6.3% for CO2 from point-sources. These reductions of GHG emissions are linked to an increase in the cumulated energy demand (CED) of 4.2–6.9% for DAC. The CED increase by using CO2 from existing point-sources would account for 2.6–4.1% of the current energy demand and is mainly caused by the additional energy requirement for water electrolysis. Reductions in the acidification potential (AP) of 0.2–0.4% could be achieved in the year 2050 scenario, while emissions would increase by 0.3–0.7% with today's production system. An increase in the eutrophication potential (EP) from 1.9 to 2.7% in the current system (2010) could also be compensated through an optimized base materials production. As the production of adsorbent resin for DAC causes high emissions of tetrachloromethane (R-10), the production of CCU chemicals from DAC CO2 would lead to a 1% increase of the ODP4, while CO2 from PS would achieve a minimal benefit. Emissions of particulate matters (PM2.5) could be decreased by 0.8% (DAC) and 1.1% (PS) in 2050.
Conclusion
Implementing the investigated CCU technologies in Germany, would reduce GHG emissions by 5.8–6.3%, replacing chemical products from fossil sources like oil, gas, and coal. While further benefits could be achieved in impact categories like acidification potential (AP) and particulate matter (PM2.5) emissions, negative effects are possible by eutrophicating substances (EP) and ozone depleting compounds (ODP) in direct air capture (DAC) scenarios. An increase in the cumulated energy demand (CED) by 2–7% is the consequence of higher energy requirements for water electrolysis and supply of heat for the desorption of captured CO2. We identify the optimization of resource extraction, production and recycling of aluminum, copper, steel and concrete according to the UBA “RESCUE” study as main objective to reduce emissions in all impact categories besides CED. Reduction of CED can be achieved by minimizing overall energy and heat demand for CO2 and H2 production. CCU technologies require low carbon energy, e.g., offshore wind energy, to avoid indirect CO2 emissions. CCU will only provide a short-term storage of carbon in chemical products, CO2 from DAC and non-fossil PS is required for chemical synthesis. Using CO2 from fossil industrial point-sources, as shown in the 0:100 allocation approach, will only account for a 21–26% reduction of GWI, compared to the respective fossil process. Furthermore, direct emissions from purge gas combustion of CCU synthesis will remain and account for 26–68% of the total GHG emissions of CCU processes. Additional energy efforts and material requirements have to be considered to capture CO2 which will not remain in the final product. The production of methanol, ethylene, propylene, benzene, toluene, and xylene from renewable resources is possible with present technologies, but should be applied only when the necessary conditions are fulfilled. This means broad access to low-carbon energy, electric heating and heat integration, highly optimized resource extraction and recycling, as well as using existing infrastructure and on-site capacities to minimize transport distances for CO2 and hydrogen. In a long-term scenario, CCU technologies may be considered for a fossil free chemical industry, based on renewable resources and energies.
Data Availability Statement
The datasets presented in this article are not readily available because parts of these data are subject to NDAs. All other data will be provided by the authors. Requests to access the datasets should be directed to bWFyaWFuLnJvc2VudGFsQGlmZXUuZGU=.
Author Contributions
MR carried out modeling of chemical processes and performed the life cycle assessment, and impact analysis. TF and AL were responsible for modeling electrolysis, carbon capture, electricity, and background units. MR wrote and all authors revised and improved the manuscript.
Funding
Parts of this work have been accomplished during the projects Kopernikus P2X (FKZ 03SFK2WO) and SYSEET (FKZ 37EV161080), funded by the German Ministry for Education and Research (BMBF) and the German Environment Agency (UBA), respectively.
Conflict of Interest
The authors declare that the research was conducted in the absence of any commercial or financial relationships that could be construed as a potential conflict of interest.
Acknowledgments
The authors like to thank Sabrina Ludmann for improving the manuscript and proof-reading and Daniel Münter for clarifying and reviewing methodological choices. This work could not have been done without the funding of the preceding model development by BMBF and UBA. Parts of this work were developed and published in the course of MR's master thesis at ifeu.
Supplementary Material
The Supplementary Material for this article can be found online at: https://www.frontiersin.org/articles/10.3389/fclim.2020.586199/full#supplementary-material
Abbreviations
AE, alkaline electrolysis; AP, acidification potential; BTX, benzene, toluene, xylene; CCU, carbon capture and utilization; CED, cumulated energy demand; C2G, cradle-to-gate; DAC, direct air capture; EoL, end-of-life; EP, eutrophication potential; GHG, greenhouse gas; GWI, global warming impact; LCA, life cycle assessment; LCI, life cycle inventory; LCIA, life cycle impact assessment; LHV, lower heating value; MEA, monoethanolamine; MTA, methanol-to-aromatics; MTO, methanol-to-olefins; ODP, ozone depletion potential; PM2.5, particulate matter with a diameter <2.5 μm; PS, point-source; Δ, standard reaction enthalpy.
Footnotes
1. ^Carbon incorporated in the products, expressed in CO2-eq. (conversion factor 3.66 kg CO2/kg C): 1,375 kg CO2t methanol; 3,143 kg CO2t ethylene/propylene; 3,385 kg CO2t benzene; 3,348 kg CO2t toluene; 3,321 kg CO2t xylene.
2. ^Available at: https://www.umweltbundesamt.de/sites/default/files/medien/479/publikationen/syseet_eingangsdaten_oekobilanzrechnungen.xlsx (German only).
3. ^Mass allocation means, that a functional unit (1 kg) of respective products receive the same environmental burdens. Therefore, there is no difference in the environmental impact of a product mixture of e.g., meta- and para-xylene consisting of either 1:3 or 3:1 parts of the respective single products.
4. ^Note that this value is uncertain due to the module proxy for the adsorbent (compare chapter 4, ODP).
References
Adebajo, M. O., and Long, M. A. (2003). The contribution of the methanol-to-aromatics reaction to benzene methylation over ZSM-5 catalysts. Catal. Commun. 4, 71–76. doi: 10.1016/S1566-7367(02)00259-5
Aldaco, R., Butnar, I., Margallo, M., Laso, J., Rumayor, M., Dominguez-Ramos, A., et al. (2019). Bringing value to the chemical industry from capture, storage and use of CO2: a dynamic LCA of formic acid production. Sci. Total Environ. 663, 738–753. doi: 10.1016/j.scitotenv.2019.01.395
Alhyari, M. M., Al-Salaymeh, A., Irshidat, M., Kaltschmitt, M., and Neuling, U. (2019). The impact of energy source on the life-cycle assessment of power-to-liquid fuels. J. Ecol. Eng. 20, 239–244. doi: 10.12911/22998993/104659
Amenomiya, Y. (1987). Methanol synthesis from CO2 + H2 II. Copper-based binary and ternary catalysts. Appl. Catal. 30, 57–68. doi: 10.1016/S0166-9834(00)81011-8
Artz, J., Muller, T. E., Thenert, K., Kleinekorte, J., Meys, R., Sternberg, A., et al. (2018). Sustainable conversion of carbon dioxide: an integrated review of catalysis and life cycle assessment. Chem. Rev. 118, 434–504. doi: 10.1021/acs.chemrev.7b00435
Bello, A., and Idem, R. O. (2005). Pathways for the formation of products of the oxidative degradation of CO2-loaded concentrated aqueous monoethanolamine solutions during CO2 absorption from flue gases. Ind. Eng. Chem. Res. 44, 945–969. doi: 10.1021/ie049329+
Chang, C. D., and Silvestri, A. J. (1977). The conversion of methanol and other O-compounds to hydrocarbons over zeolite catalysts. J. Catal. 47, 249–259. doi: 10.1016/0021-9517(77)90172-5
Chinchen, G. C., Denny, P. J., Parker, D. G., Spencer, M. S., and Whan, D. A. (1987). Mechanism of methanol synthesis from CO2/CO/H2 mixtures over copper/zinc oxide/alumina catalysts: use of14C-labelled reactants. Appl. Catal. 30, 333–338. doi: 10.1016/S0166-9834(00)84123-8
Climeworks (2018b). Direct Air Capture and Storage (DACS) Factsheet for Researchers Zurich: Climeworks.
CML (2015). Impact Assessment Characterisation Factors, Version 4.4. Leiden: Institute of Environmental Science.
David, M., Ocampo-Martínez, C., and Sánchez-Peña, R. (2019). Advances in alkaline water electrolyzers: a review. J. Energy Storage 23, 392–403. doi: 10.1016/j.est.2019.03.001
De Leeuw, F.A.A.M. (2002). A set of emission indicators for long-range transboundary air pollution. Environ. Sci. Policy 5, 135–145. doi: 10.1016/S1462-9011(01)00042-9
DECHEMA (2017). Low Carbon Energy and Feedstock for the European Chemical Industry. Frankfurt: DECHEMA.
ecoinvent (2007). Life Cycle Inventories of Chemicals. ecoinvent report No. 8, v2.0, EMPA Dübendorf, Swiss Centre for Life Cycle Inventories, Dübendorf, CH.
European Commission (2003). Integrated Pollution Prevention and Control (IPPC). Reference Document on Best Available Techniques in the Large Volume Organic Chemical Industry. Brussels: Technical Report.
European Commission (2019). Guidance Document n°9 on the Harmonised Free Allocation Methodology for the EU-ETS Post 2020. Sector-Specific Guidance. Brussels: Technical Report.
Fasihi, M., Efimova, O., and Breyer, C. (2019). Techno-economic assessment of CO2 direct air capture plants. J. Clean. Prod. 224, 957–980. doi: 10.1016/j.jclepro.2019.03.086
Goff, G. S., and Rochelle, G. T. (2004). Monoethanolamine degradation: O2 mass transfer effects under CO2 capture conditions. Ind. Eng. Chem. Res. 43, 6400–6408. doi: 10.1021/ie0400245
Hasan, M. M. F., First, E. L., Boukouvala, F., and Floudas, C. A. (2015). A multi-scale framework for CO2 capture, utilization, and sequestration: CCUS and CCU. Comput. Chem. Eng. 81, 2–21. doi: 10.1016/j.compchemeng.2015.04.034
Hauschild, M., and Wenzel, H. (1998). “Scientific background,” in Environmental Assessment of Products, Vol. 2, eds M. Hauschild and H. Wenzel (London: Chapman and Hall), 566.
Heijungs, R., Guinée, J. B., Huppes, G., Lankreijer, R. M., Udo De Haes, H., Wegener Sleeswijk, A., et al. (1992). Environmental Life Cycle Assessment of Products: Guide and Backgrounds (Part 1) Leiden: Centre of Environmental Science. doi: 10.1016/0959-6526(93)90046-E
Henrici-Olivé, G., and Olivé, S. (1976). Die Fischer-Tropsch-Synthese: Molekulargewichtsverteilung der Primärprodukte und Reaktionsmechanismus. Angewandte Chemie 88, 144–150. doi: 10.1002/ange.19760880503
Hoppe, W., Thonemann, N., and Bringezu, S. (2018). Life cycle assessment of carbon dioxide-based production of methane and methanol and derived polymers. J. Ind. Ecol. 22, 327–340. doi: 10.1111/jiec.12583
Husebye, J., Brunsvold, A. L., Roussanaly, S., and Zhang, X. (2012). Techno economic evaluation of amine based CO2 capture: impact of CO2 concentration and steam supply. Energy Procedia 23, 381–390. doi: 10.1016/j.egypro.2012.06.053
IPCC (2013). Climate Change 2013: The Physical Science Basis. Contribution of Working Group I to the Fifth Assessment Report of the Intergovernmental Panel on Climate Change. Technical Report. Geneva: Intergovernmental Panel on Climate Change.
IPCC (2018). Global Warming of 1.5°C – an IPCC Special Report on the Impacts of Global Warming of 1.5 °C Above Pre-Industrial Levels and Related Global Greenhouse Gas Emission Pathways, in the Context of Strengthening the Global Response to the Threat of Climate Change, Sustainable Development, and Efforts to Eradicate Poverty. Technical Report. Geneva: Intergovernmental Panel on Climate Change.
Jaramillo, P., Griffin, W. M., and Matthews, H. S. (2008). Comparative analysis of the production costs and life-cycle ghg emissions of ft liquid fuels from coal and natural gas. Environ. Sci. Technol. 42, 7559–7565. doi: 10.1021/es8002074
Kaiser, P., Unde, R. B., Kern, C., and Jess, A. (2013). Production of liquid hydrocarbons with CO2 as carbon source based on reverse water-gas shift and fischer-tropsch synthesis. Chemie Ingenieur Technik 85, 489–499. doi: 10.1002/cite.201200179
Kätelhön, A., Meys, R., Deutz, S., Suh, S., and Bardow, A. (2019). Climate change mitigation potential of carbon capture and utilization in the chemical industry. Proc. Natl. Acad. Sci. U.S.A. 116, 11187–11194. doi: 10.1073/pnas.1821029116
Kim, S. H., Kim, K. H., and Hong, S. H. (2014). Carbon dioxide capture and use: organic synthesis using carbon dioxide from exhaust gas. Angew. Chem. Int. Ed. Engl. 53, 771–774. doi: 10.1002/anie.201308341
Knudsen, J. N., Jensen, J. N., Vilhelmsen, P.-J., and Biede, O. (2009). Experience with CO2 capture from coal flue gas in pilot-scale: testing of different amine solvents. Energy Procedia 1, 783–790. doi: 10.1016/j.egypro.2009.01.104
Koj, J. C., Wulf, C., and Zapp, P. (2019). Environmental impacts of power-to-X systems - a review of technological and methodological choices in Life Cycle Assessments. Renew. Sust. Energ. Rev. 112, 865–879. doi: 10.1016/j.rser.2019.06.029
Kuckshinrichs, W., and Hake, J.-F. (2015). Carbon Capture, Storage and Use. Cham: Springer. doi: 10.1007/978-3-319-11943-4
Le Quéré, C., Andrew, R. M., Friedlingstein, P., Sitch, S., Hauck, J., Pongratz, J., et al. (2018). Global carbon budget 2018. Earth Syst. Sci. Data 10, 2141–2194. doi: 10.5194/essd-10-2141-2018
Luis, P. (2016). Use of monoethanolamine (MEA) for CO2 capture in a global scenario: consequences and alternatives. Desalination 380, 93–99. doi: 10.1016/j.desal.2015.08.004
Mac Dowell, N., Fennell, P. S., Shah, N., and Maitland, G. C. (2017). The role of CO2 capture and utilization in mitigating climate change. Nat. Clim. Chang. 7:243. doi: 10.1038/nclimate3231
Matzen, M., and Demirel, Y. (2016). Methanol and dimethyl ether from renewable hydrogen and carbon dioxide: alternative fuels production and life-cycle assessment. J. Clean. Prod. 139, 1068–1077. doi: 10.1016/j.jclepro.2016.08.163
Merano, J., and Ciferno, J. (2001). Life-Cycle Greenhouse-Gas Emissions Inventory For Fischer-Tropsch Fuels. Technical Report. Washington, DC: U.S. Department of Energy.
Meunier, N., Chauvy, R., Mouhoubi, S., Thomas, D., and De Weireld, G. (2020). Alternative production of methanol from industrial CO2. Renew. Energy 146, 1192–1203. doi: 10.1016/j.renene.2019.07.010
Mikkelsen, M., Jørgensen, M., and Krebs, F. C. (2010). The teraton challenge. A review of fixation and transformation of carbon dioxide. Energy Environ. Sci. 3, 43–81. doi: 10.1039/B912904A
Morken, A. K., Nenseter, B., Pedersen, S., Chhaganlal, M., Feste, J. K., Tyborgnes, R. B., et al. (2014). Emission results of amine plant operations from MEA testing at the CO2 technology centre Mongstad. Energy Procedia 63, 6023–6038. doi: 10.1016/j.egypro.2014.11.636
Morken, A. K., Pedersen, S., Kleppe, E. R., Wisthaler, A., Vernstad, K., Ullestad, Ø., et al. (2017). Degradation and emission results of amine plant operations from MEA testing at the CO2 technology centre Mongstad. Energy Procedia 114, 1245–1262. doi: 10.1016/j.egypro.2017.03.1379
Olah, G. A. (2013). Towards oil independence through renewable methanol chemistry. Angew. Chem. Int. Ed. 52, 104–107. doi: 10.1002/anie.201204995
Otto, A., Grube, T., Schiebahn, S., and Stolten, D. (2015). Closing the loop: captured CO2 as a feedstock in the chemical industry. Energy Environ. Sci. 8, 3283–3297. doi: 10.1039/C5EE02591E
PlasticsEurope (2012). Eco profiles and Environmental Product Declarations of the European Plastics Manufacturers. Ethylene, Propylene, Butadiene, Pyrolysis Gasoline, Ethylene Oxide (EO), Ethylene Glycols (MEG, DEG, TEG). Brussels: Technical Report.
PlasticsEurope (2013). Eco-profiles and Environmental Product Declarations of the European Plastics Manufacturers. Benzene, Toluene, and Xylenes (Aromatics, BTX). Brussels: Technical Report.
PlasticsEurope (2017). PlasticsEurope recommendation on Steam Cracker allocation. Brussels: Technical Report.
Rochelle, G. (2009). Amine scrubbing for CO2 capture. Science 325, 1652–1654. doi: 10.1126/science.1176731
Rosental, M. (2020). Ökobilanzielle Betrachtung von, Carbon Capture and Utilization-Verfahren für die Produktion von Basischemikalien in der chemischen Industrie (Master Thesis). Institut für Energie- und Umweltforschung (ifeu), Universität Heidelberg, Heidelberg, Germany.
SAEFL (2003). Swiss Agency for the Environment Forests and Landscape Modelling of PM10 and PM2.5 Ambient Concentrations in Switzerland 2000 and 2010. Bern Technical Report.
Sanz-Pérez, E. S., Murdock, C. R., Didas, S. A., and Jones, C. W. (2016). Direct capture of CO2 from ambient air. Chem. Rev. 116, 11840–11876. doi: 10.1021/acs.chemrev.6b00173
Schmidt, P., Batteiger, V., Roth, A., Weindorf, W., and Raksha, T. (2018). Power-to-liquids as renewable fuel option for aviation: a review. Chem. Ing. Tech. 90, 127–140. doi: 10.1002/cite.201700129
Sternberg, A., and Bardow, A. (2016). Life cycle assessment of power-to-gas: syngas vs methane. ACS Sustain. Chem. Eng. 4, 4156–4165. doi: 10.1021/acssuschemeng.6b00644
Sternberg, A., Jens, C. M., and Bardow, A. (2017). Life cycle assessment of CO2-based C1-chemicals. Green Chem. 19, 2244–2259. doi: 10.1039/C6GC02852G
Thonemann, N., and Pizzol, M. (2019). Consequential life cycle assessment of carbon capture and utilization technologies within the chemical industry. Energy Environ. Sci. 12, 2253–2263. doi: 10.1039/C9EE00914K
Tian, P., Wei, Y., Ye, M., and Liu, Z. (2015). Methanol to Olefins (MTO): from fundamentals to commercialization. ACS Catal. 5, 1922–1938. doi: 10.1021/acscatal.5b00007
UBA (2014). Treibhausgasneutrales Deutschland. Technical Report. Dessau-Roßlau: German Environment Agency.
UBA (2016). Power-to-Liquids Potentials and Perspectives for the Future Supply of Renewable Aviation Fuel. Dessau-Rolau: German Environment Agency.
UBA (2017). BIOMASSEKASKADEN Mehr Ressourceneffizienz durch Kaskadennutzung von Biomasse – von der Theorie zur Praxis. Technical Report. Dessau-Roßlau: German Environment Agency.
UBA (2018). Berichterstattung unter der Klimarahmenkonvention der Vereinten Nationen und dem Kyoto-Protokoll 2018. Nationaler Inventarbericht zum Deutschen Treibhausgasinventar 1990–2016. Technical Report. Dessau-Roßlau: German Environment Agency.
UBA (2019a). Den Weg zu einem treibhausgasneutralen Deutschland ressourcenschonend gestalten. Technical Report. Dessau-Roßlau: German Environment Agency.
UBA (2019b). Wege in eine ressourcenschonende Treibhausgasneutralität - RESCUE. Technical Report. Dessau-Roßlau: German Environment Agency.
UBA (2020). Systemvergleich speicherbarer Energieträger aus erneuerbaren Energien (SYSEET). Technical Report. Dessau-Roßlau: German Environment Agency.
VCI (2018). Chemiewirtschaft in Zahlen 2018. Technical Report. Frankfurt: Verband der Chemischen Industrie e.V.
VDI (2012). VDI 4600 – Kumulierter Energieaufwand (KEA). Technical Report. Düsseldorf: Verein Deutscher Ingenieure e.V.
Von Der Assen, N., and Bardow, A. (2014). Life cycle assessment of polyols for polyurethane production using CO2 as feedstock: insights from an industrial case study. Green Chem. 16, 3272–3280. doi: 10.1039/C4GC00513A
Von Der Assen, N., Jung, J., and Bardow, A. (2013). Life-cycle assessment of carbon dioxide capture and utilization: avoiding the pitfalls. Energy Environ. Sci. 6, 2721–2734. doi: 10.1039/c3ee41151f
WMO (2014). Scientific Assessment of Ozone Depletion: Global Ozone Research and Monitoring Project - Report No. 56. Technical Report. Geneva: World Meteorological Organization.
Xu, X., Liu, Y., Zhang, F., Di, W., and Zhang, Y. (2017). Clean coal technologies in China based on methanol platform. Catalysis Today 298, 61–68. doi: 10.1016/j.cattod.2017.05.070
Keywords: life cycle assesment, carbon capture and utilization (CCU), carbon dioxide, organic chemicals, cradle-to-gate
Citation: Rosental M, Fröhlich T and Liebich A (2020) Life Cycle Assessment of Carbon Capture and Utilization for the Production of Large Volume Organic Chemicals. Front. Clim. 2:586199. doi: 10.3389/fclim.2020.586199
Received: 22 July 2020; Accepted: 14 September 2020;
Published: 16 October 2020.
Edited by:
Mijndert Van Der Spek, Heriot-Watt University, United KingdomReviewed by:
Nils Thonemann, Fraunhofer-Institut für Umwelt-, Sicherheits- und Energietechnik UMSICHT, GermanyElliott Thomas Campbell, Maryland Department of Natural Resources, United States
Copyright © 2020 Rosental, Fröhlich and Liebich. This is an open-access article distributed under the terms of the Creative Commons Attribution License (CC BY). The use, distribution or reproduction in other forums is permitted, provided the original author(s) and the copyright owner(s) are credited and that the original publication in this journal is cited, in accordance with accepted academic practice. No use, distribution or reproduction is permitted which does not comply with these terms.
*Correspondence: Marian Rosental, bWFyaWFuLnJvc2VudGFsQGlmZXUuZGU=