 Ningai Yang
 Mingyang Li
 Hong Yang5
 Guangqi Li
94% of researchers rate our articles as excellent or good
Learn more about the work of our research integrity team to safeguard the quality of each article we publish.
Find out more
ORIGINAL RESEARCH article
Front. Cell. Infect. Microbiol. , 28 January 2025
Sec. Parasite and Host
Volume 14 - 2024 | https://doi.org/10.3389/fcimb.2024.1436712
Introduction: Toxoplasma gondii, an intracellular parasitic protozoan, is globally recognized for its ability to cause parasitic diseases and has developed diverse strategies to evade immune-mediated elimination. The protein ROP16 of T.gondii plays a crucial role in this evasion process by specifically targeting macrophages and mononuclear phagocytes in vivo. However, the precise mechanisms underlying the involvement of type II ROP16 proteins in infection, inflammation, and other processes remain unknown.
Methods: To investigate the mechanism of action of gonococcal ROP16 proteins in human macrophages, we constructed a lentivirus overexpressing ROP16 and established stably transfected cell lines. We then analyzed the gene transcriptional profiles of ROP16 II in THP-1 macrophages using transcriptome sequencing. Interaction networks were constructed by screening differentially expressed genes and performing gene function enrichment analysis.
Results: As a result, five differentially expressed genes were identified: AAMDC, GPR158, RAD9A, STOML1, and STRA13. Immuno-featured differential analysis showed that type 17 T helper cells were more strongly correlated with GPR158 and STRA13, while CD8 T-cell was most strongly correlated with STOML1.
Discussion: Therefore, we conclude that the ROP16 protein plays a pivotal role in THP-1 macrophage infection and these five differentially expressed genes may serve as promising molecular targets for the prevention or control of toxoplasmosis. These findings have significant implications for the diagnosis and treatment of toxoplasmosis.
Toxoplasma gondii, a member of the phylum Parietoidea, class Sporozoa, order Eukarya, family Isosporoidea and genus Toxoplasma, is an opportunistic pathogenic protozoan (David Sibley et al., 2009). It is a parasitic organism capable of causing zoonotic diseases and can intracellularly infect the cells of all eukaryotic organisms except erythrocytes. T.gondii can invade the nucleated cells of various warm-blooded animals, including humans, and is responsible for global parasitic diseases. While most T.gondii infections are asymptomatic or mild, clinical manifestations primarily occur in immunodeficient or immunocompromised individuals such as pregnant women or those with HIV infection (Sun et al., 2021).
ROP16, a rhoptry protein of T.gondii, exhibits serine-threonine kinase activity and serves as an essential virulence factor during host cell invasion (Young et al., 2020). The pivotal role of ROP16 in evading the immune response of the host has been extensively demonstrated (Chang et al., 2015). Notably, studies have revealed that ROP 16 I/III (from type I and type III strains) phosphorylates Stat6/Stat3, inducing early polarization towards alternatively activated macrophages (M2) upon infection (Wang et al., 2018). Furthermore, compared to type I parasites, infection with type II parasites leads to up-regulation of IL-12 p40 production in macrophages (Yamamoto et al., 2009).
Relevant studies have demonstrated that transfection of Toxoplasma rhoptry protein 16 in SH-SY5Y human neuroblastoma cells induces alterations in the host cell’s transcriptional profile, affecting the expression of multiple genes. Notably, these genes play crucial roles in nervous system development, apoptosis and transcriptional regulation. Their dysregulation may contribute to both the host cells response against T.gondii infection and the pathogenesis of Toxoplasma (Fan et al., 2016). Additionally, Hengming Ye et al. revealed that Toxoplasma gondii suppresses the proliferation and migration of breast cancer cells by modulating their transcriptome (Ye et al., 2024).Although T.gondii can infect various types of nucleated cells, macrophages and associated mononuclear phagocytes are its preferred targets in vivo. The parasite has multiple ways to evade immune-mediated killing (Li et al., 2017). Immune cells, including natural killer cells, mast cells and helper T cells, also contribute to the immune response during toxoplasma infection. Conventional natural killer cells are critical for early immunity to against T. gondii infection (Ivanova et al., 2016). Studies have shown that Toxoplasma WH3Δ rop16 strain impairs the function of T regulatory cells (Tregs) (Wang et al., 2018). Mast cells play an important role in immunity against certain infections, as well as in allergy, and inflammation (Ekoff et al., 2007). Therefore, studies targeting macrophages are crucial for understanding the underlying strategies of parasite-host interactions. In recent years, there have been many national and international studies focusing on using T.gondii to infect human macrophages (Murray, 2011). Macrophages are important defense cells that protect body against invasion by foreign pathogens and serve as ideal cellular models for studying the mechanisms associated with T.gondii infection (Shapouri-Moghaddam et al., 2018). However, there are relatively few studies examining the role of the ROP16 protein in human macrophages and some suggest that different types of ROP16 can polarize macrophages into classically activated M1 or alternatively activated M2 phenotypes (Hu et al., 2022). Therefore, the specific molecular mechanism of Toxoplasma ROP16 protein in macrophages remains unclear. In this study, we successfully constructed stable cell lines overexpressing ROP16 type II protein and performed transcriptome analysis to better understand its mechanism in THP-1 macrophages.
The total RNA of ME49 strain was extracted using the Trizol method, and the purity and concentration of the total RNA were assessed, and the cDNA of ME49 strain was obtained by reverse transcription using a reverse transcription kit. Based on the rop16 gene sequence, the following primers were designed: forward 5 ‘- GCGAATTCACCATAGAAAGTGACCACGAAAGGGCTTGC - 3’, and reverse 5’-GATCAGCGGCCTACATCCGATGTAAAGAAAGTTCGGTAGTTG-3’. Primers containing his-tag were designed to amplify the rop16 gene fragment. The resulting PCR fragment and pCDH-MSCV empty vector were double-digested using EcoR-I and Not-I enzymes after PCR amplification, converting blunt ends into sticky ends for ligation. The PCR fragment and vector were ligated using T4 ligase and transformed into DH5αcompetent cells, from which positive clones of the transformants were selected for sequencing and identification. The positive clones were selected for sequencing and identification. Human embryonic kidney cell line 293T was transfected with rop16 lentiviral vector packaged in a triple plasmid system (pMAL +VsVG +pREV). The supernatant was collected, concentrated and purified, and viral titer was determined. Three groups were established: the rop16 Overexpression Group (OE), an pCDH-MSCV Empty vector Group(EP) and a blank control Normal cell Group(NG) (Figure 1). In 6-well plates, pCDH-MSCV-ROP16 overexpression virus solution, pCDH empty vector virus solution and culture medium were added respectively. THP-1 macrophages induced by Phorbol-12-myristate-13-acetate (PMA) were then infected, and stable cell lines overexpressing rop16 were generated through puromycin selection, and the expression of GFP was observed using fluorescence microscope. Western blotting and RT-qPCR were used to detect the protein levels and mRNA expression of rop16, respectively.
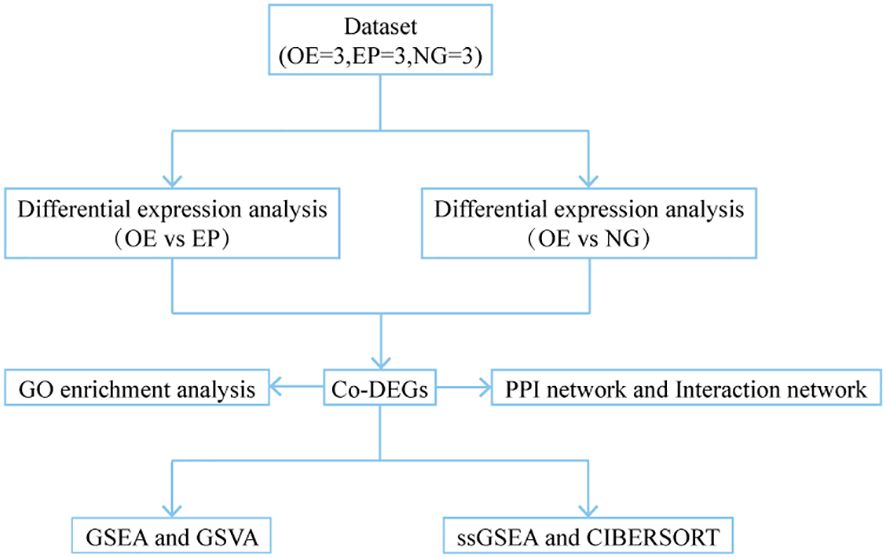
Figure 1. Technology Roadmap. OE, Overexpression group; EP, Empty group; NG, Normal group; Co-DEGs, Common differentially expressed genes; GO, Gene Ontology; GSEA, Gene Set Enrichment Analysis; GSVA, Gene Set Variation Analysis; ssGSEA, single-sample gene-set enrichment analysis.
We utilized R’s limma package (David Sibley et al., 2009) to compare samples from the Overexpression group (OE) with those from the Normal group (NG) and the Empty group (EP). Differentially expressed genes (DEGs) were identified between the groups using a significance threshold of P< 0.01. Subsequently, we determined the intersection of DEGs between the two comparisons. The co-differentially expressed genes (Co-DEGs) were identified, representing the genes with common differential expression between the OE and NG groups, as well as between the OE and EP groups. A t-test was employed to further screen for differentially expressed genes between the OE and NG groups and between the OE and EP groups. Applying the same significance criterion of P< 0.01, we again identified the intersection of DEGs across the different comparisons to derive the Co-DEGs. Finally, the Co-DEGs obtained from the limma package differential analysis were intersected with those derived from the t-test, resulting in a final set of Co-DEGs for subsequent analysis.
Gene Ontology (GO) (Murray, 2011) analysis encompasses three main categories: biological process (BP), molecular function (MF) and cell component (CC). GO enrichment analysis of Co-DEGs was performed by using the R software package clusterProfiler, with a selection criterion of P<0.05. The P correction method was Benjamini-Hochberg (BH) (Gan et al., 2017).
The GeneMANIA (Li et al., 2021) database was utilized to generate hypotheses regarding gene function, analyze gene lists, and prioritize gene function analyses. It can assign weights to each functional genome dataset based on the predicted value of the query and make gene function predictions. Given a query gene, GeneMANIA identifies genes that are likely to share functions with it, based on their interactions. Genes with similar functions to Co-DEGs were predicted through GeneMANIA online platform, and the interaction network was downloaded. In the figure, the inner circle represents the Co-DEGs, the outer circle depicts the genes with similar functions, and the line colors correspond to the line represents the interconnected functions in our study.
The ENCORI database analyzes microRNAs-mRNA interactions through data mining, which provides multiple visual interfaces for exploring miRNA targets. We used ENCORI (Mosser and Edwards, 2008) interacted with Co-DEGs (RNA binding proteins). clipExpNum > =5 to screen mRNA-RBP interactions and map interaction networks.
We used ENCORI database to predict the mirnas interacting with Co-DEGs, and also screened the mirnas interacting with pancancerNum>=5, and mapping the interaction.
The CHIPBase database predicts transcriptional regulatory relationships between many genes and transcription factors (TFS). We searched for Co-DEGs binding transcription factors (TFS) in the CHIPBase database by the number of samples found (upstream) >0 and number of samples found (downstream)>0 was used as a screening criterion to screen interaction relationships and visualize mRNA-miRNA interaction networks via Cytoscape software.
Potential drugs or small molecule compounds that interact with Co-DEGs are predicted using the public Comparative Toxicology Genomics Database (CTD), with a “reference count” > 0 was used as a screening criterion to screen MRNA-drug interaction pairs. Cytoscape software is used to visualize mRNA-drug interaction networks.
Gene Set Enrichment Analysis (GSEA) (Kong et al., 2015) is commonly used to analyze changes in the activity of pathways and biological processes in samples. Based on the results of the previous differential analysis between the overexpression and normal group (OE/NG), we divided all genes into logFC value related positive and negative groups according to the positive and negative order of logFC value of genes between the two groups. Gene enrichment analysis was performed using clusterProfiler software package. The specific parameters are as follows: the seed is 2022, the number of calculations is 1000, the number of genes in each gene set is at least 10, the number of genes in each gene set is at most 500, and the P-value correction method is Benjamini-Hochberg (BH). We from Molecular Signatures Database (MSigDB) (Croken et al., 2014) Database access “c2. Cp. All. V2022.1. Hs. Symbols. The GMT [all Canonical Pathways] (3050)” gene set, The screening criteria for significant enrichment were p. Adj < 0.05 and FDR value (q.value) < 0.05.
Gene Set Variation Analysis (GSVA) (Deichaite et al., 2022) evaluates the genomic enrichment of the transcriptome on a chip by converting the gene expression matrix between different samples into an inter-sample gene expression matrix. To assess whether different pathways are enriched in different samples. We performed “GMT “GSVA analysis of the gene expression matrix of the overexpressed and normal groups through the MSigDB (Molecular Signature Database) database to calculate the functional differences of the enrichment pathway between the two groups. In this study, from the pathways with P<0.05, 10 pathways each with the largest and smallest logFC were selected for subsequent analyses.
A single sample genomic enrichment analysis (ssGSEA) algorithm was used to quantify the relative abundance of different immune cell infiltrations, while labeling the infiltrated immune cell types, such as CD8+ T cells, and various human immune cell subtypes, such as denatured cells, macrophages, and regulatory T cells. We obtained the enrichment scores of each immune cell by analyzing and calculating the ssGSEA algorithm in the GSVA (Li et al., 2022) package of R package (version 1.46.0), and the relative abundance of each type of immune cell infiltration in each sample is represented by the enrichment fraction. The difference of immune cell infiltration abundance between OE group and NG group was shown by block diagram. The correlation between immune cells is shown by a lollipop chart. The correlation between immune cells and Co-DEGs was visualized by the correlation dot plot drawn by the R package ggplot2.
CIBERSORT (Bao et al., 2020) is an analytical algorithm for estimating the composition and abundance of immune cells in mixed cell populations. We screened immune cells with enrichment scores greater than 0 by CIBERSORT. The correlation between immune cells was calculated using spearman statistical algorithm and visualized using R software package ggplot2. The difference in the abundance of immune cell infiltration between the OE group and the NG group was shown by the columnar stack diagram. The correlation between immune cells and Co-DEGs was calculated by spearman statistical algorithm, and the correlation point plot was drawn by R software package ggplot2.
Total RNA was extracted from the cells of NG, EP and OE groups by Trizol method, reverse transcribed into cDNA, and the mRNA levels of AAMDC, GPR158, RAD9A, STOML1, and STRA13 genes were determined by RT-PCR in the cells of different groups. The results were detected by Light Cycler 480 system PCR instrument software and analyzed to obtain the Ct values, and the relative expression of mRNA of cell-related factors in the three groups was calculated by applying the 2-△△Ct value, The mRNA expression of the cells in the NG group was set to 1, and all experiments were performed in 3 replications. Differential gene primer sequence are as follows: AAMDC, 5 ‘-TTGGCCGAGGGATGAGTGA-3 ‘ and 5’-GCAACCAAGGCATTATACTCCT-3 ‘; GPR158, 5 ‘-ATCTACGGGTTGCAGCCTAAC-3 ‘ and 5’-AACCAGCCATCACTTGAGCAT-3 ‘; RAD9A, 5 ‘-CATTGACTCTTACATGATCGCCA-3 ‘ and 5’-GCCAGGTGAAAGGGAAATGG-3 ‘; STOML1, 5 ‘-GGGAGCCGATGTCCAGTTTC-3 ‘, and 5’-CTGGTCGCTGATCTTGAGC-3 ‘; STRA13, 5 ‘-ATCCAGCGGACTTTCGCTC-3 ‘ and 5’-TAATTGCGCCGATCCTTTCTC-3 ‘.
All data processing and analysis in this paper are based on R software. For the comparison of continuous variables between the two groups, an independent student t test was used to estimate the statistical significance of the normally distributed variables. The differences between the non-normally distributed variables were analyzed by Mann-Whitney U test (Wilcoxon rank sum test). If not otherwise specified, the results are calculated using the Mauman correlation analysis method. All statistical P-values were bilateral, with a P-value less than 0.05 indicating statistical significance.
In this study, β-actin was employed as an internal reference for RT-qPCR and western blot analysis to compare the transcriptional levels of ROP 16 among the overexpressed group (OE), empty carrier group (EP) and normal control group (NG). The findings demonstrated successful transfection of ROP 16 into THP-1 macrophages (Figure 2).
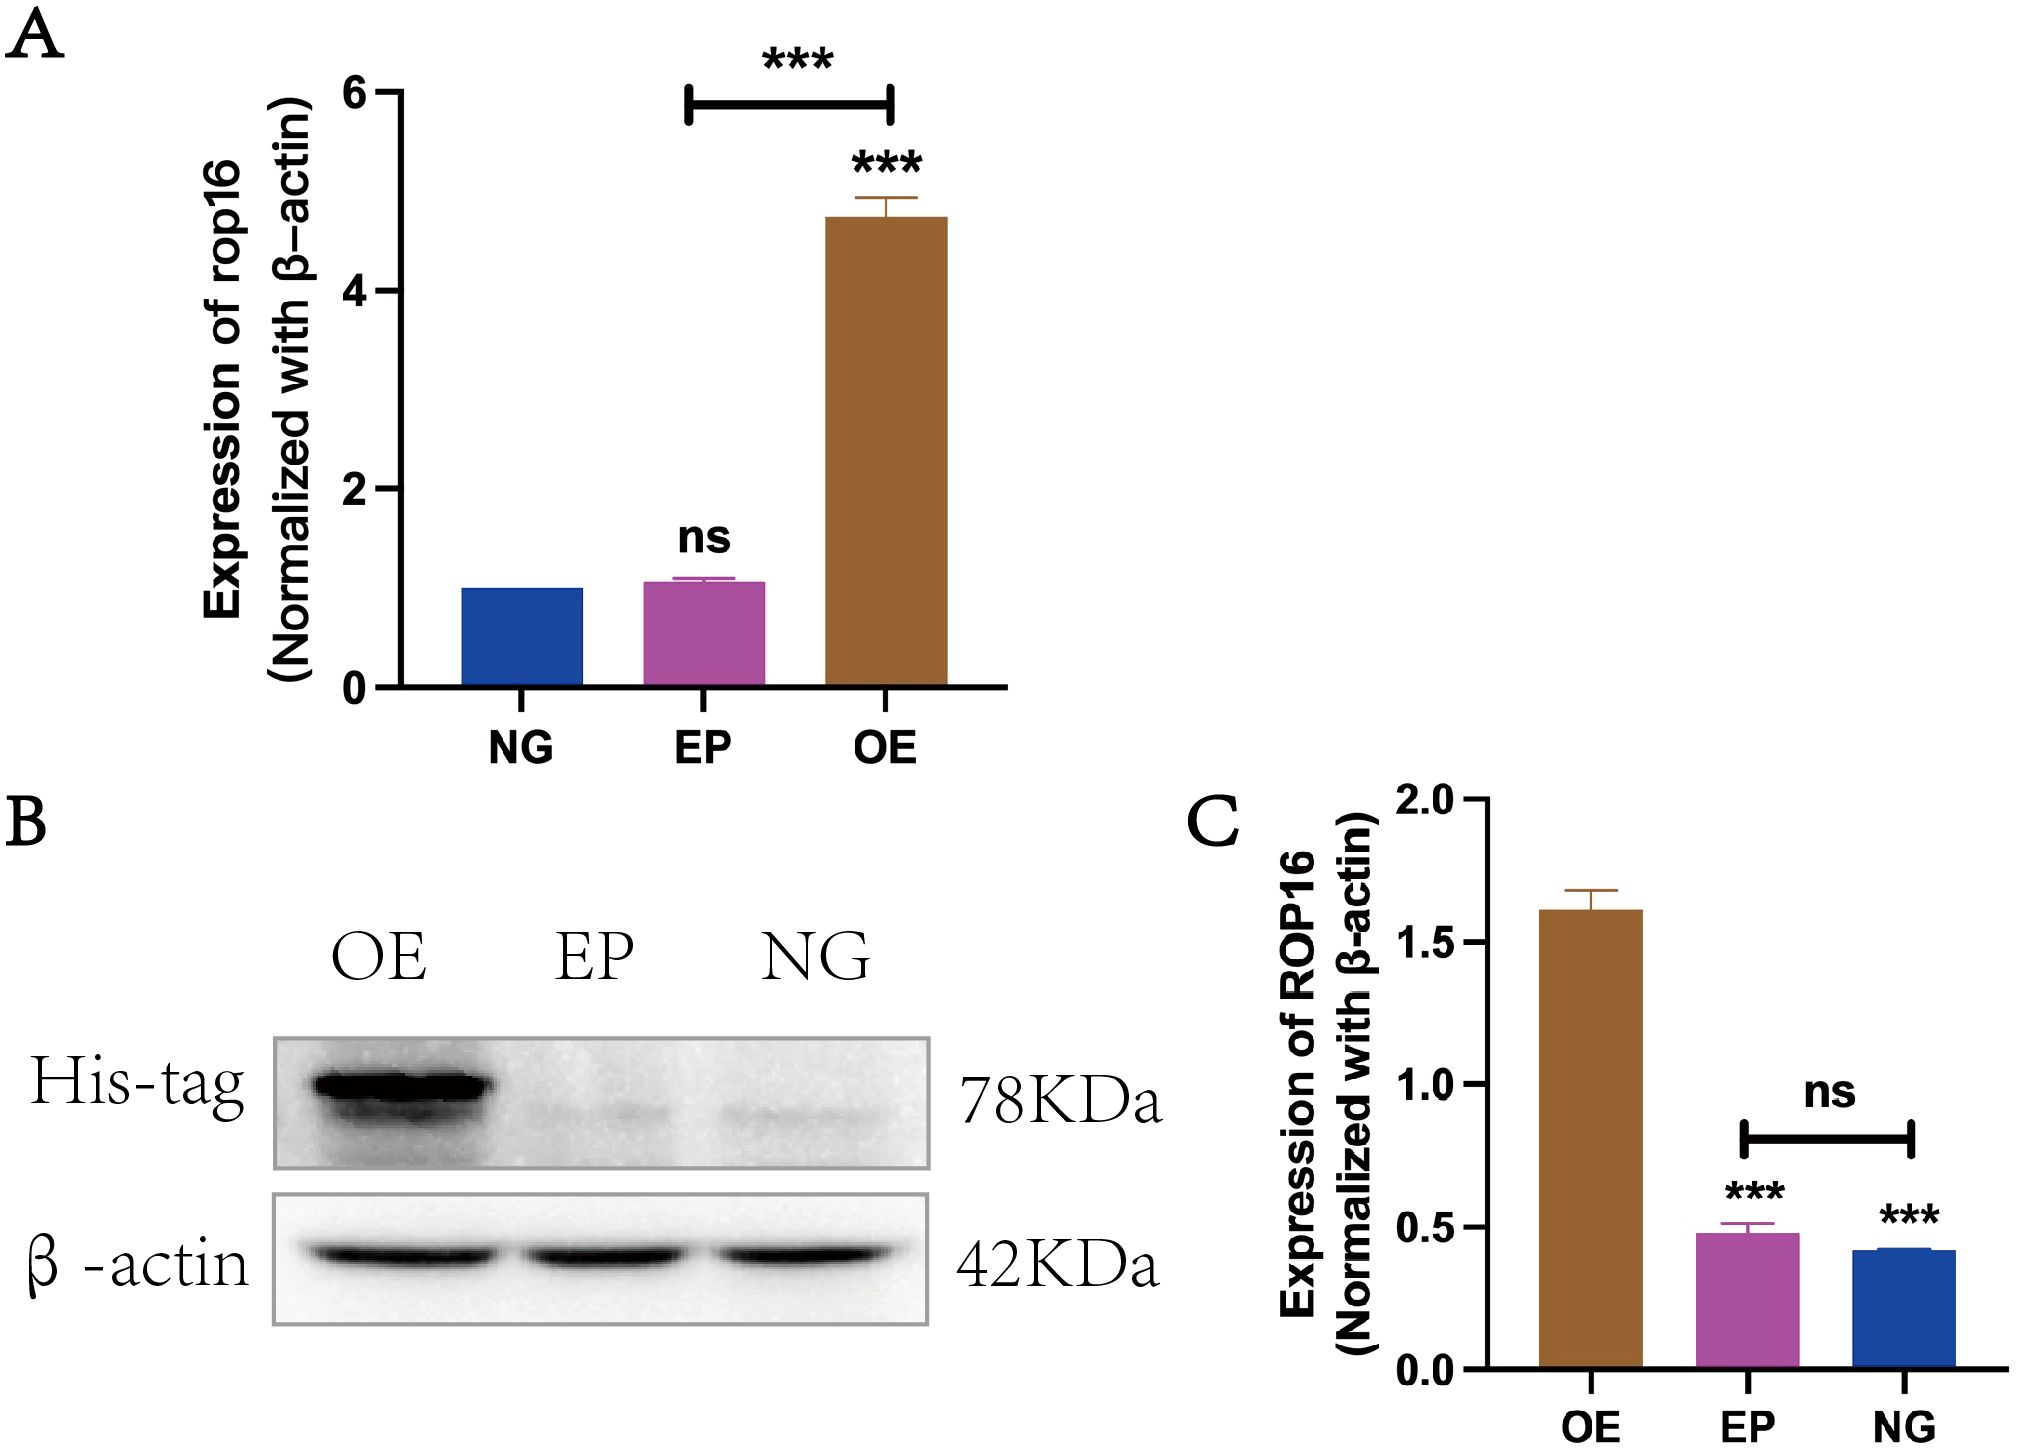
Figure 2. Expression of ROP16 in THP-1 Macrophages: (A). RT-PCR to detect the expression of rop16 mRNA in THP-1 macrophages of ZC(normal growth), EP(Empty growth) and OE(overexpression) groups after transfection with pCDH-ROP16. (B, C). Blot was used to detect ROP 16 in cells of ZC, EP and OE groups for gray-scale analysis. The ROP 16 protein was detected by His-tag antibody. The internal parameter uses β-actin.The symbol ns was equivalent to P ≥ 0.05, which was not statistically significant. The symbol *** is equivalent to P < 0.001 and highly statistically significant. OE, Overexpression group; EP, Empty group; NG, Normal group.
We performed a differential analysis of all genes between the Overexpression group (OE) and Normal group (NG) samples, as well as between the OE and Empty group (EP) samples, using the limma package in R. The significance threshold was set at P< 0.01. A total of 367 differentially expressed genes were identified between the OE and NG groups, with 260 genes showing higher expression in the OE group compared to the NG group, and 107 genes showing lower expression in the OE group compared to the NG group. Similarly, we found a total of 466 differentially expressed genes between the OE and EP groups, with 289 genes exhibiting higher expression in the OE group relative to NG, and 177 genes displaying lower expression in the OE group relative to NG. The results of differential analysis were visualized using volcano plot (Figures 3A, B). Subsequently, we conducted an intersection analysis on these two sets of differentially expressed genes to identify a subset of 75 co-differentially expressed genes (Co-DEGs) (Figure 3C).
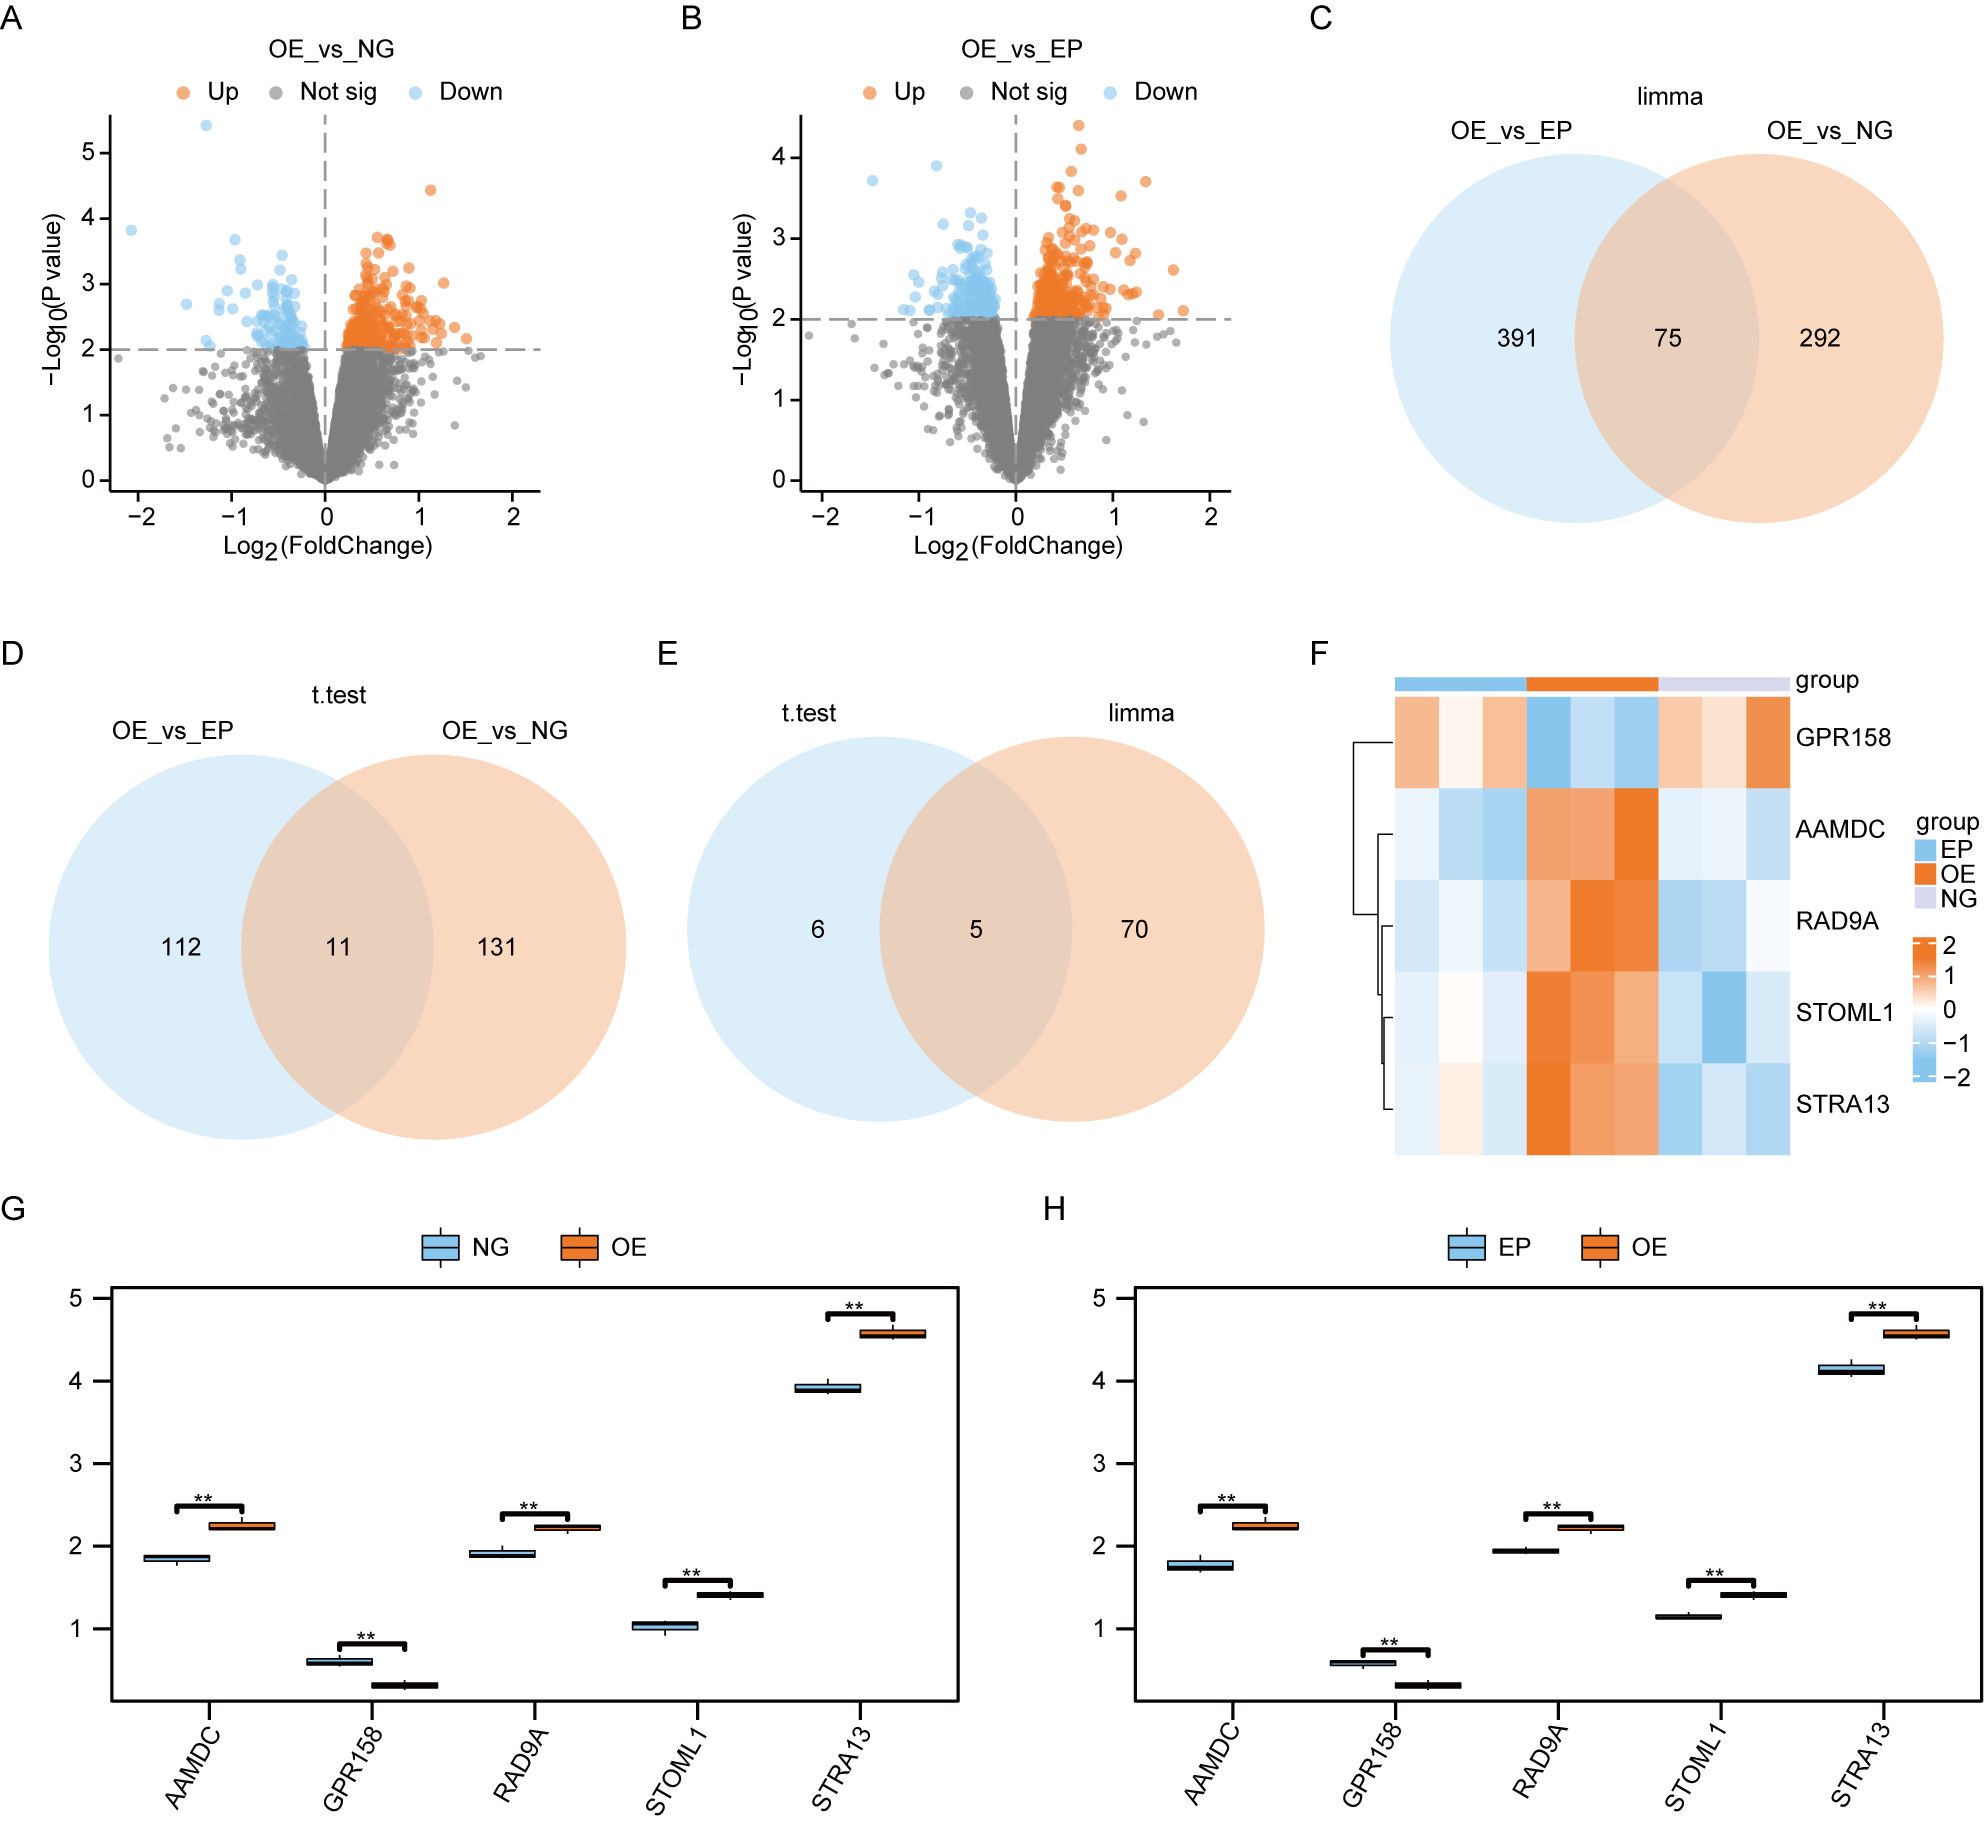
Figure 3. Screening of differentially expressed genes. (A). Volcano plot of the results of limma package difference analysis between OE and NG groups. (B). Volcano plot of limma package difference analysis results between OE and EP groups. (C). Venn diagram of the results of limma packet difference analysis between OE and EP groups, and the results of limma packet difference analysis between OE and NG groups. (D).Venn diagram of the results of t-test difference analysis between OE and EP groups, and the results of t-test difference analysis between OE and NG groups. Venn diagram of Co-DEGs obtained by difference analysis of (E). lomma package and Co-DEGs obtained by difference analysis of t test. Heat map of (F).Co-DEGs expression among the three groups. Group comparison map of Co-DEGs between G-H.O and NG groups (G) and OE and EP groups (H). The symbol ns was equivalent to P ≥ 0.05, which was not statistically significant. The symbol ** is equivalent to P < 0.01, which is highly statistically significant and highly statistically significant. OE, Overexpression group; EP, Empty group; NG, Normal group; Co-DEGs, Common differentially expressed genes.
We employed t-tests to identify differentially expressed genes between the OE group and NG group, as well as between the OE group and EP group. Using a significance threshold of P< 0.01, we identified 142 differentially expressed genes between the OE and NG groups, along with 123 differentially expressed genes between the OE group and EP group. The overlapping set of differentially expressed genes yielded 11 co-expressed differentially regulated genes Co-DEGs (Figure 3D).
The Co-DEGs obtained through differential analysis using the limma package and t-test were intersected (Figure 3E), resulting in the identification of five final Co-DEGs: AAMDC, GPR158, RAD9A, STOML1, and STRA13.
We subsequently generated an expression heat map to show the differential expression patterns of 5 Co-DEGs across the three experimental groups (Figure 3F). This analysis revealed a significant divergence in the expression profiles of these genes between the OE group and the other two groups.
We generated group comparison maps for 5 Co-DEGs between the NG and OE group (Figure 3G), as well as between the EP and OE group (Figure 3H). The results revealed significant differences in the expression of these 5 Co-DEGs between the NG and OE groups (Figure 3G), as well as between the EP and OE groups (Figure 3H).
To investigate the relationship among biological processes, molecular functions, cellular components and biological pathways of 5 Co-DEGs (AAMDC, GPR158, RAD9A, STOML1, STRA13), we conducted Gene Ontology (GO) gene function enrichment analysis for these genes. Enriched items were screened based on a significance level of P< 0.05, and pathways meeting the screening criteria were considered statistically significant. The results revealed that the 5 Co-DEGs were primarily enriched in DNA replication checkpoint signaling, mitotic intra-S DNA damage checkpoint signaling, mitotic intra-S DNA damage checkpoint signaling, regulation of intrinsic apoptotic signaling pathway in response to DNA damage, positive regulation of intrinsic apoptotic signaling pathway, positive regulation of apoptotic signaling pathway as well as other biological process (BP). Additionally, they showed enrichment in condensed nuclear chromatin and late endosome membrane among other cellular component (CC). Furthermore, these genes exhibited exodeoxyribonuclease activity, 3’-5’ exonuclease activity, deoxyribonuclease activity, exonuclease activity, and nuclease activity, along with other molecular function (MF) detailed in Table 1. We presented the results of GO functional enrichment analysis using bar graphs (Figure 4A). Moreover, the enrichment results for BP pathway (Figure 4B), CC pathway (Figure 4C) and MF pathway (Figure 4D) from GO gene functional enrichment analysis were illustrated using a ring network diagram.

Table 1. GO and KEGG enrichment analysis results of Co-DEGs.
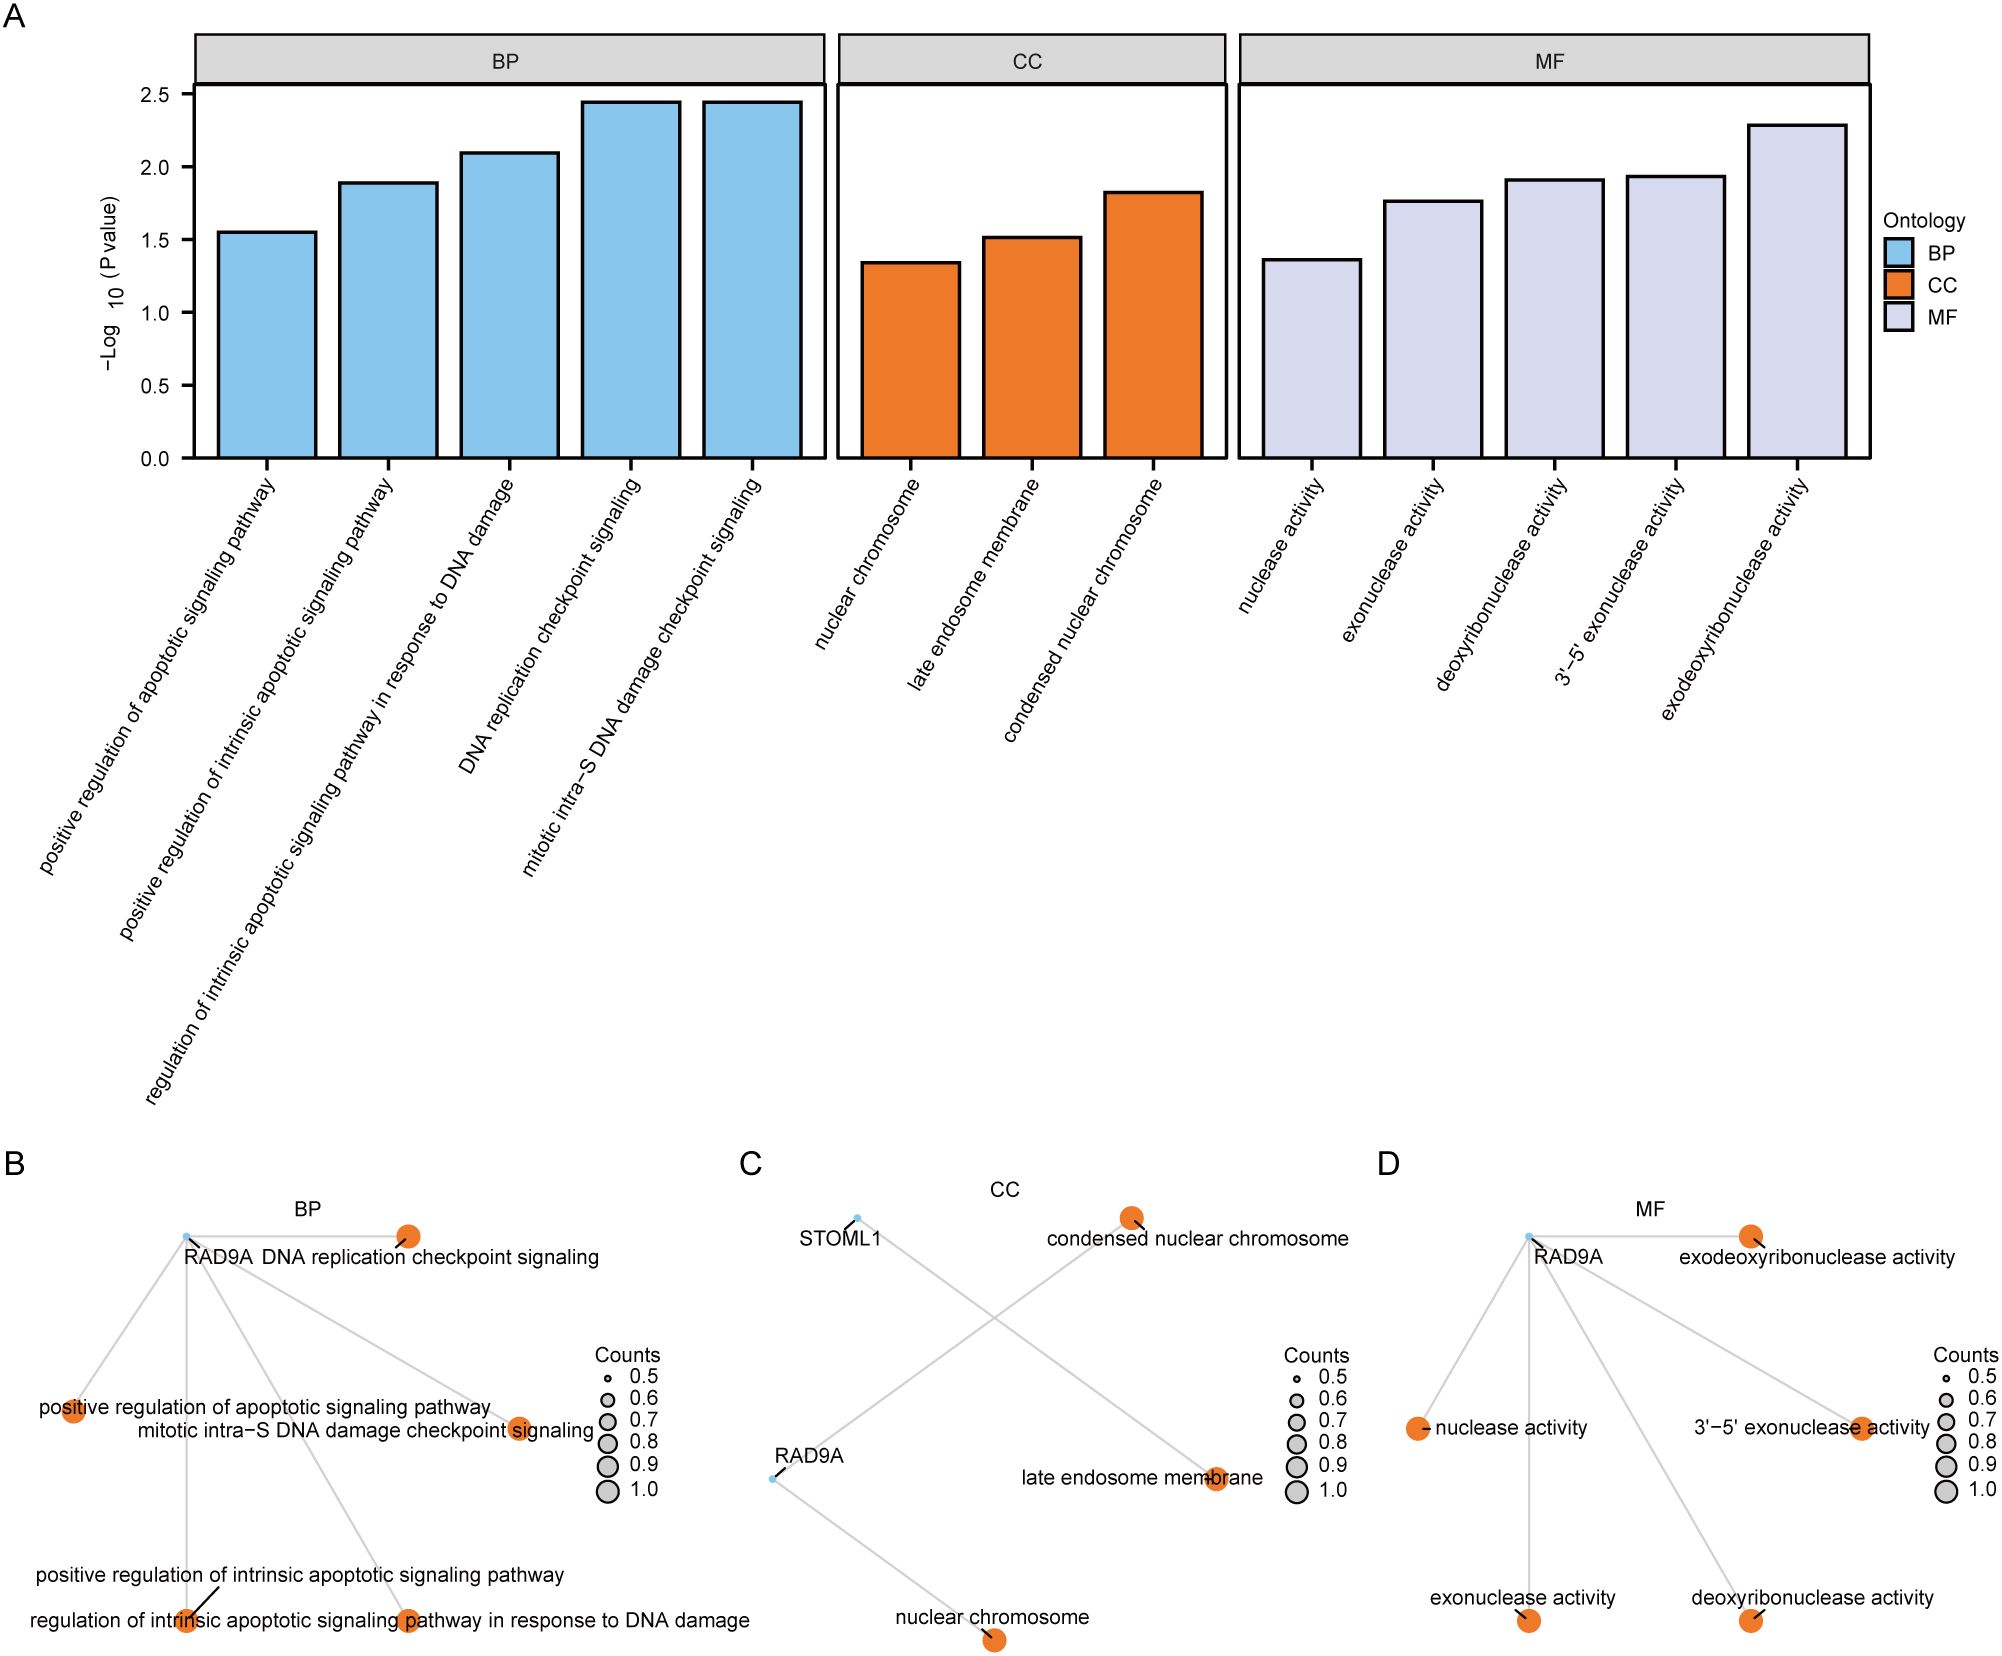
Figure 4. Functional enrichment analysis (GO) of Co-DEGs. The bar chart of GO enrichment analysis results of (A) co-degs is displayed. B-d. Circular network diagram of BP pathway (B), CC pathway (C), and MF pathway (D) in GO functional enrichment analysis results of Co-DEGs. In the bar graph (A), the abscissa is the GO terms s, and the height of the bar represents the P value of the GO terms or KEGG terms. In the network diagram (B-D), blue dots represent specific genes, and orange dots represent specific pathways. Co-DEGs, Common differentially expressed genes; GO, Gene Ontology; BP, biological process; CC, cellular component; MF, molecular function; The screening criterion for GO enrichment items was P< 0.05.
We utilized the GeneMANIA website to predicted and constructed an interaction network for 5 Co-DEGs (AAMDC, GPR158, RAD9A, STOML1, STRA13) with similar functions (Figure 5A). This allowed us to observe their physical interaction, shared protein domains, gene interaction and other information between them. The details of the interaction relationships are shown in Table 2.
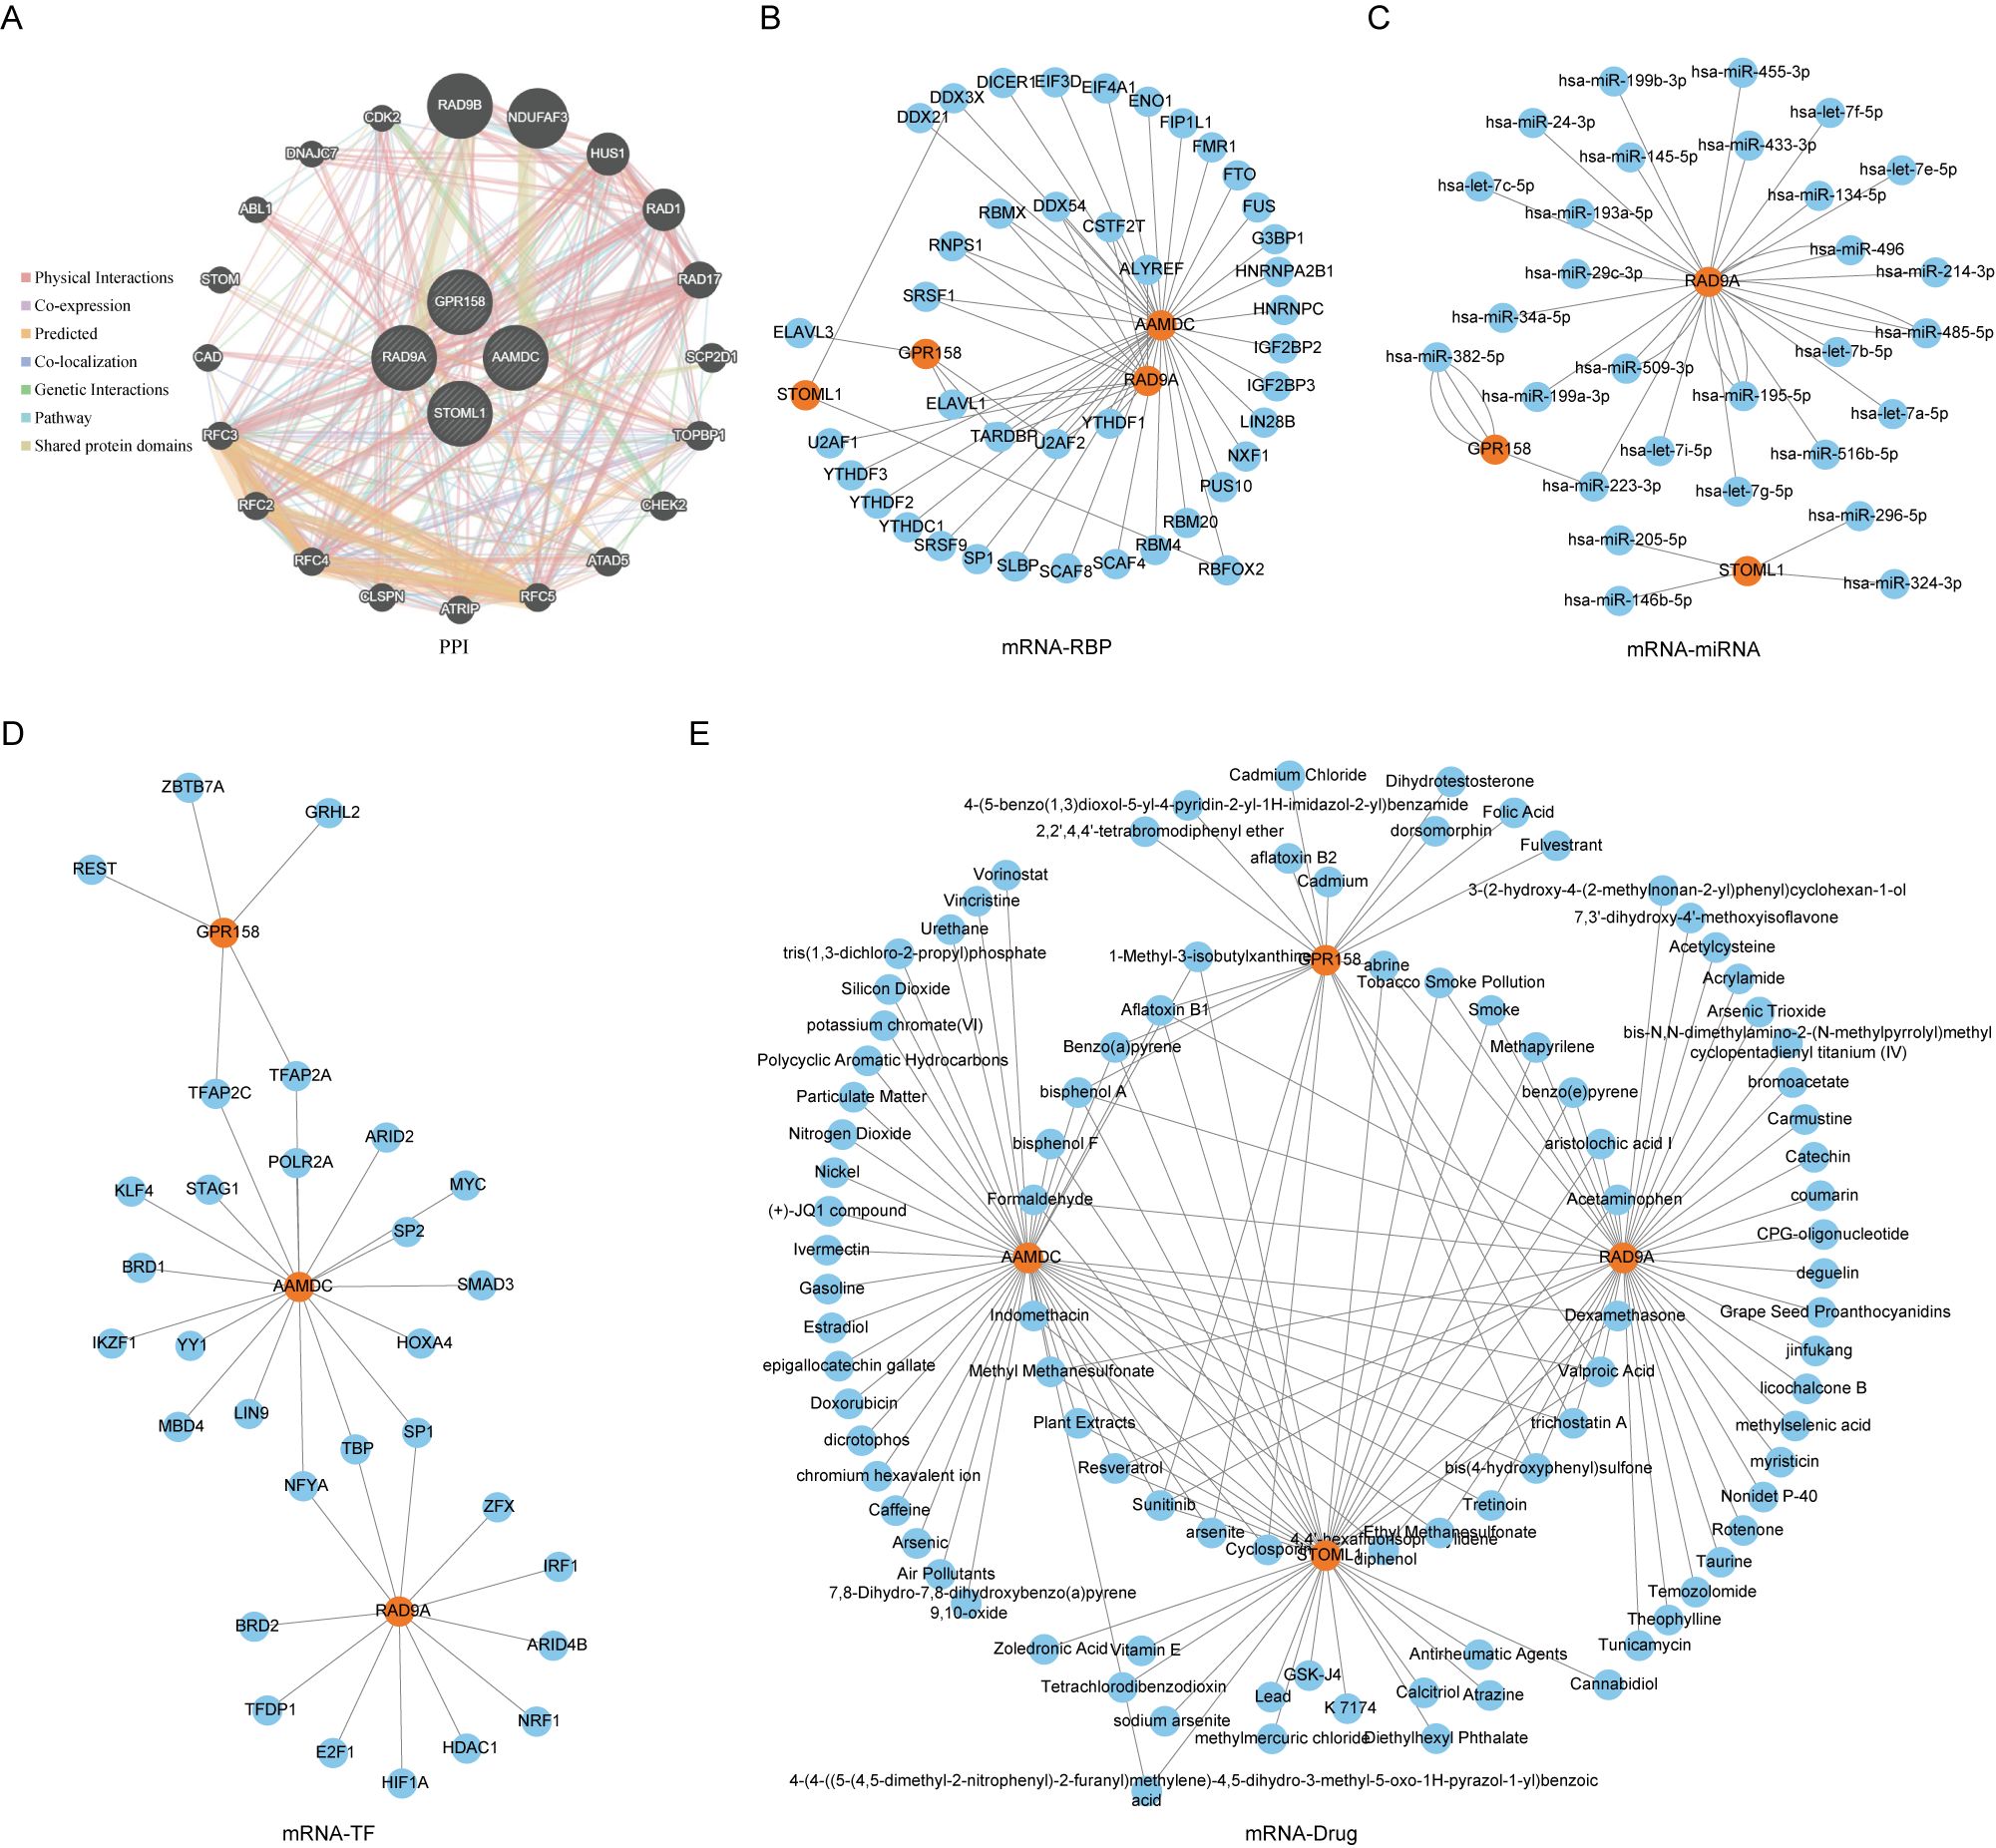
Figure 5. PPI network of Co-DEGs and interaction network of mRNA-RBP, mRNA-miRNA, mRNA-TF and mRNA-drug. (E) PPI (A), mRNA-RBP (B), mRNA-miRNA (C), mRNA-TF (D), mRNA-drug (E) interaction network of Co-DEGs. In PPI (A) network, the inner circle was the Co-DEGs in our study, and the outer circle was the genes with similar functions. The blue circle is miRNA. In the mRNA-RBP (B) interaction network, the orange circle is mRNA, and the blue circle is RBP. In the mRNA-miRNA (C) interaction network, orange circles are mRNA and blue circles are miRNA. In the mRNA-TF (D) interaction network, orange circles are mRNAs and blue circles are transcription factors (TFS). In the mRNA-drug (E) interaction network, orange circles are mRNAs and blue circles are drugs or compounds (drugs). RBP, RNA binding protein; TF, Transcription factors; Co-DEGs, Common differentially expressed genes.

Table 2. PPI interaction network nodes.
We utilized the ENCORI database to predict RNA binding proteins (RBP) that interacted with five Co-DEGs. Following rigorous screening, we identified four Co-DEGs (AAMDC, GPR158, RAD9A, STOML1), resulting in a total of 41 RBP molecules forming 56 pairs of mRNA-RBP interaction relationships (Figure 5B). The specific mRNA-RBP interaction relationships are shown in Table 3.
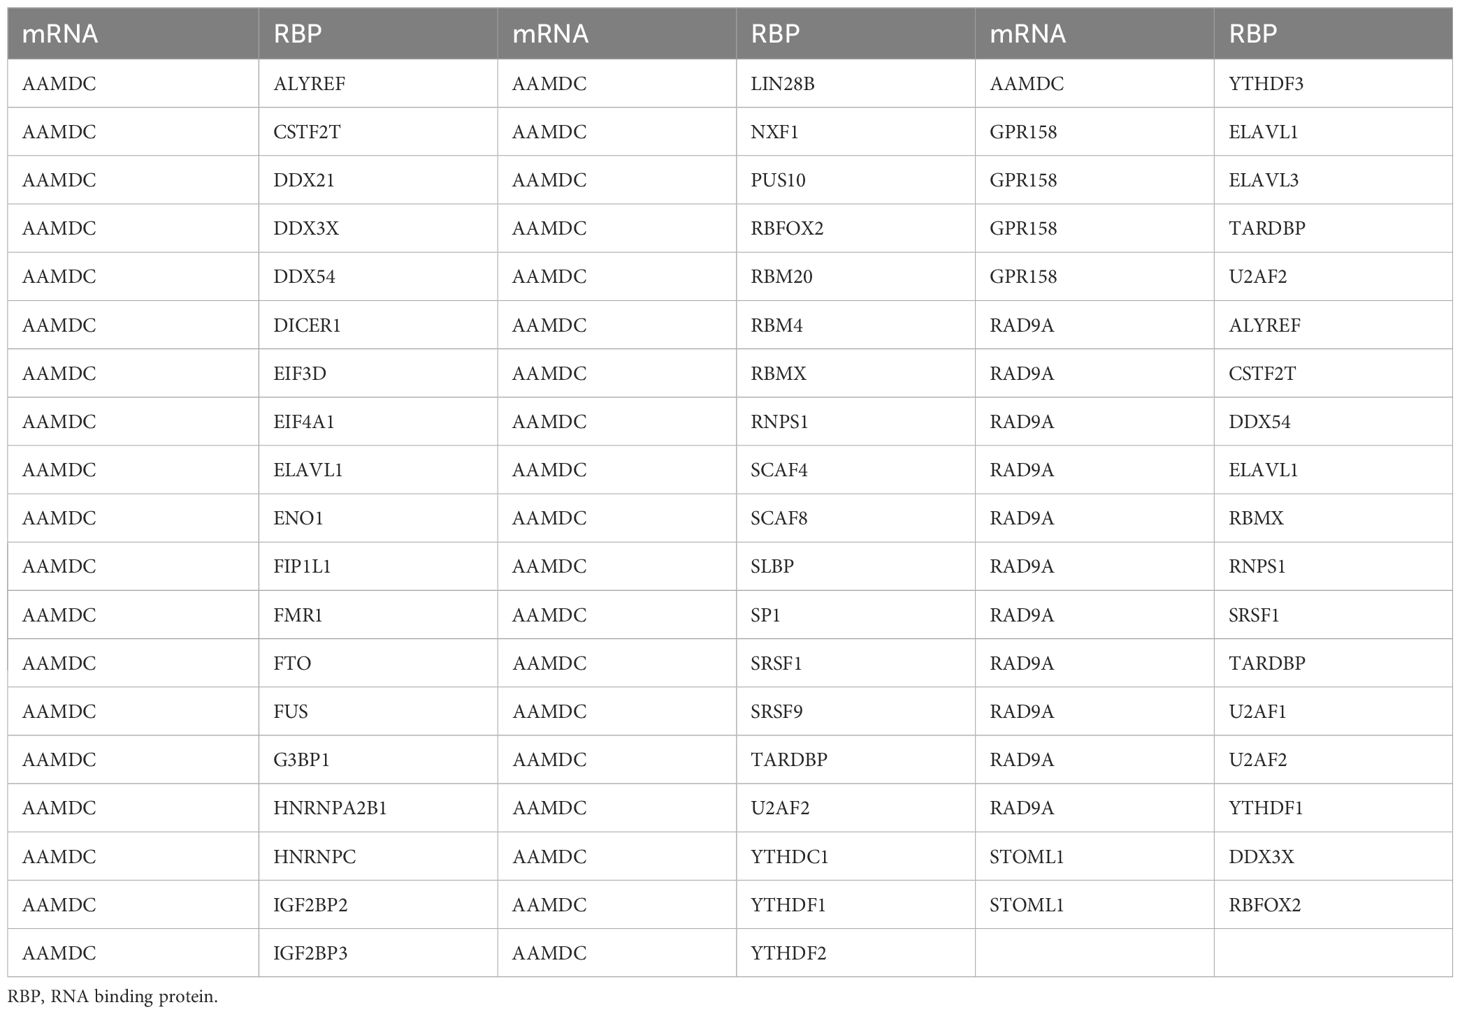
Table 3. mRNA-RBP interaction network nodes.
ENCOR database was utilized for the prediction of RNA binding proteins (RBP) that interact with 5 Co-DEGs. Following screening, a total of 3 Co-DEGs (GPR158, RAD9A, STOML1) and 29 miRNA molecules were identified. This resulted in the formation of 39 pairs of mRNA-miRNA interaction relationships (Figure 5C), and the specific mRNA-miRNA interaction relationships are shown in Table 4.
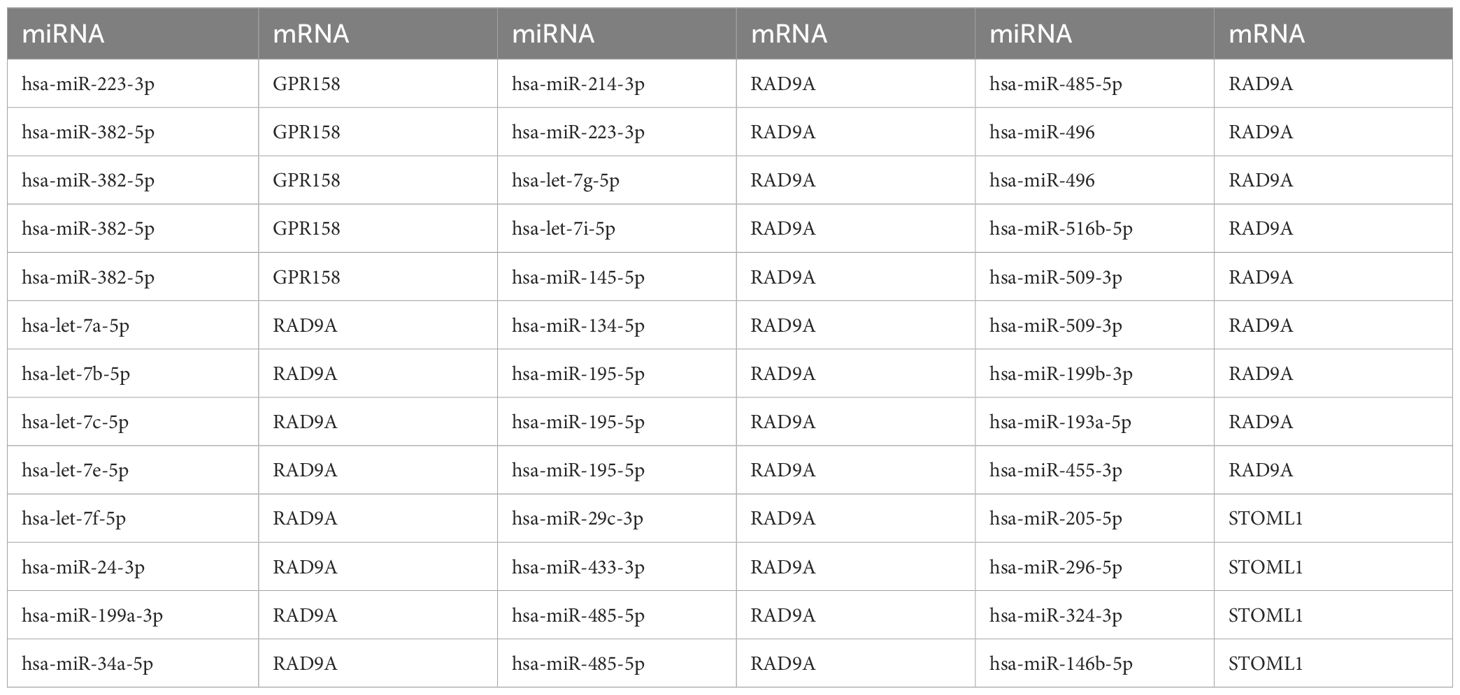
Table 4. mRNA-miRNA interaction network nodes.
We conducted a search in the CHIPBase database (version 3.0) to identify Transcription factors (TFS) that bind to 5 Co-DEGs, resulting in the identification of 3 Co-DEGs (AAMDC, GPR158, GPRS) after rigorous screening. The interaction data between RAD9A and 30 transcription factors (TFS) of 35 pairs of interaction data were visualized by Cytoscape software (Figure 5D). mRNA-TF interaction relationships are shown in Table 5.
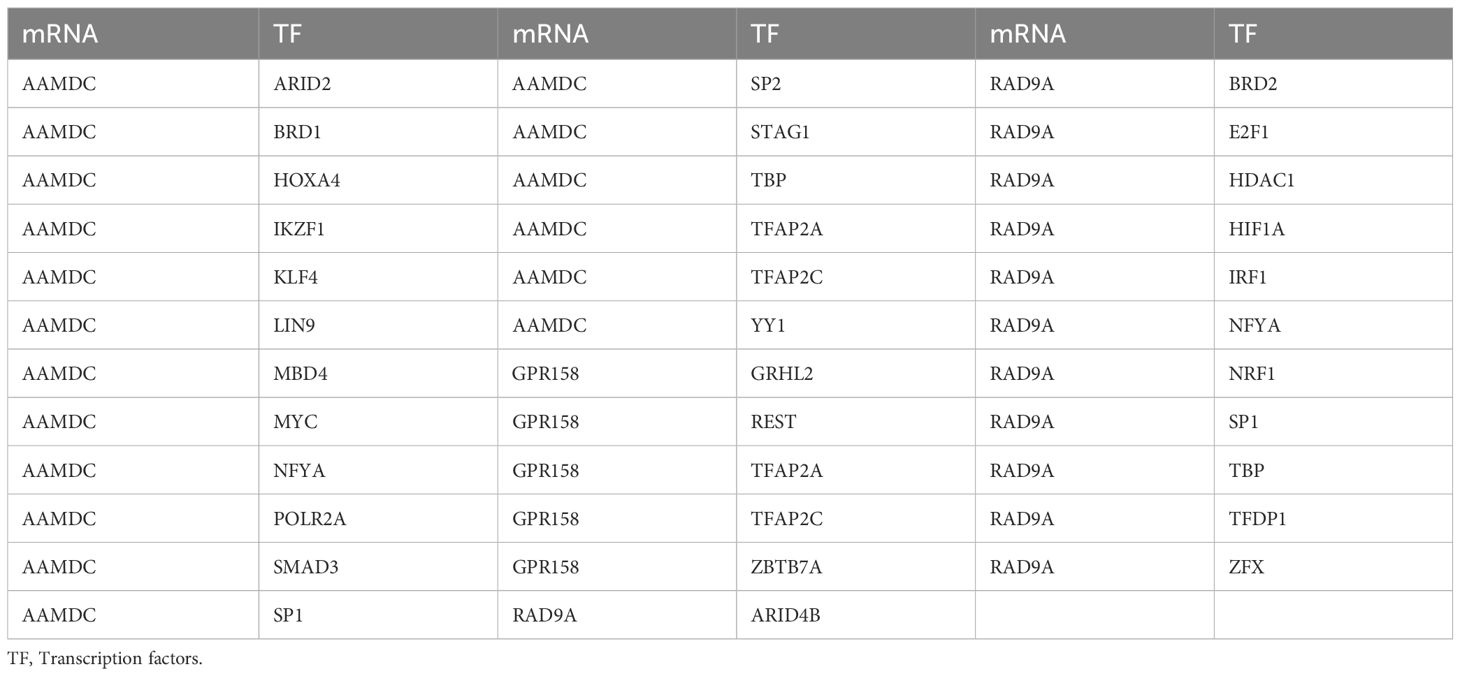
Table 5. mRNA-TF interaction network nodes.
We utilized the CTD database to predict potential drugs or small molecule compounds that interact with 5 Co-DEGs. Ultimately, we identified a total of 95 drug molecules composed of 4 Co-DEGs (AAMDC, GPR158, RAD9A, STOML1). Furthermore, this analysis resulted in the formation of 138 mRNA-drug interaction relationships (Figure 5E), which are detailed in Table 6.
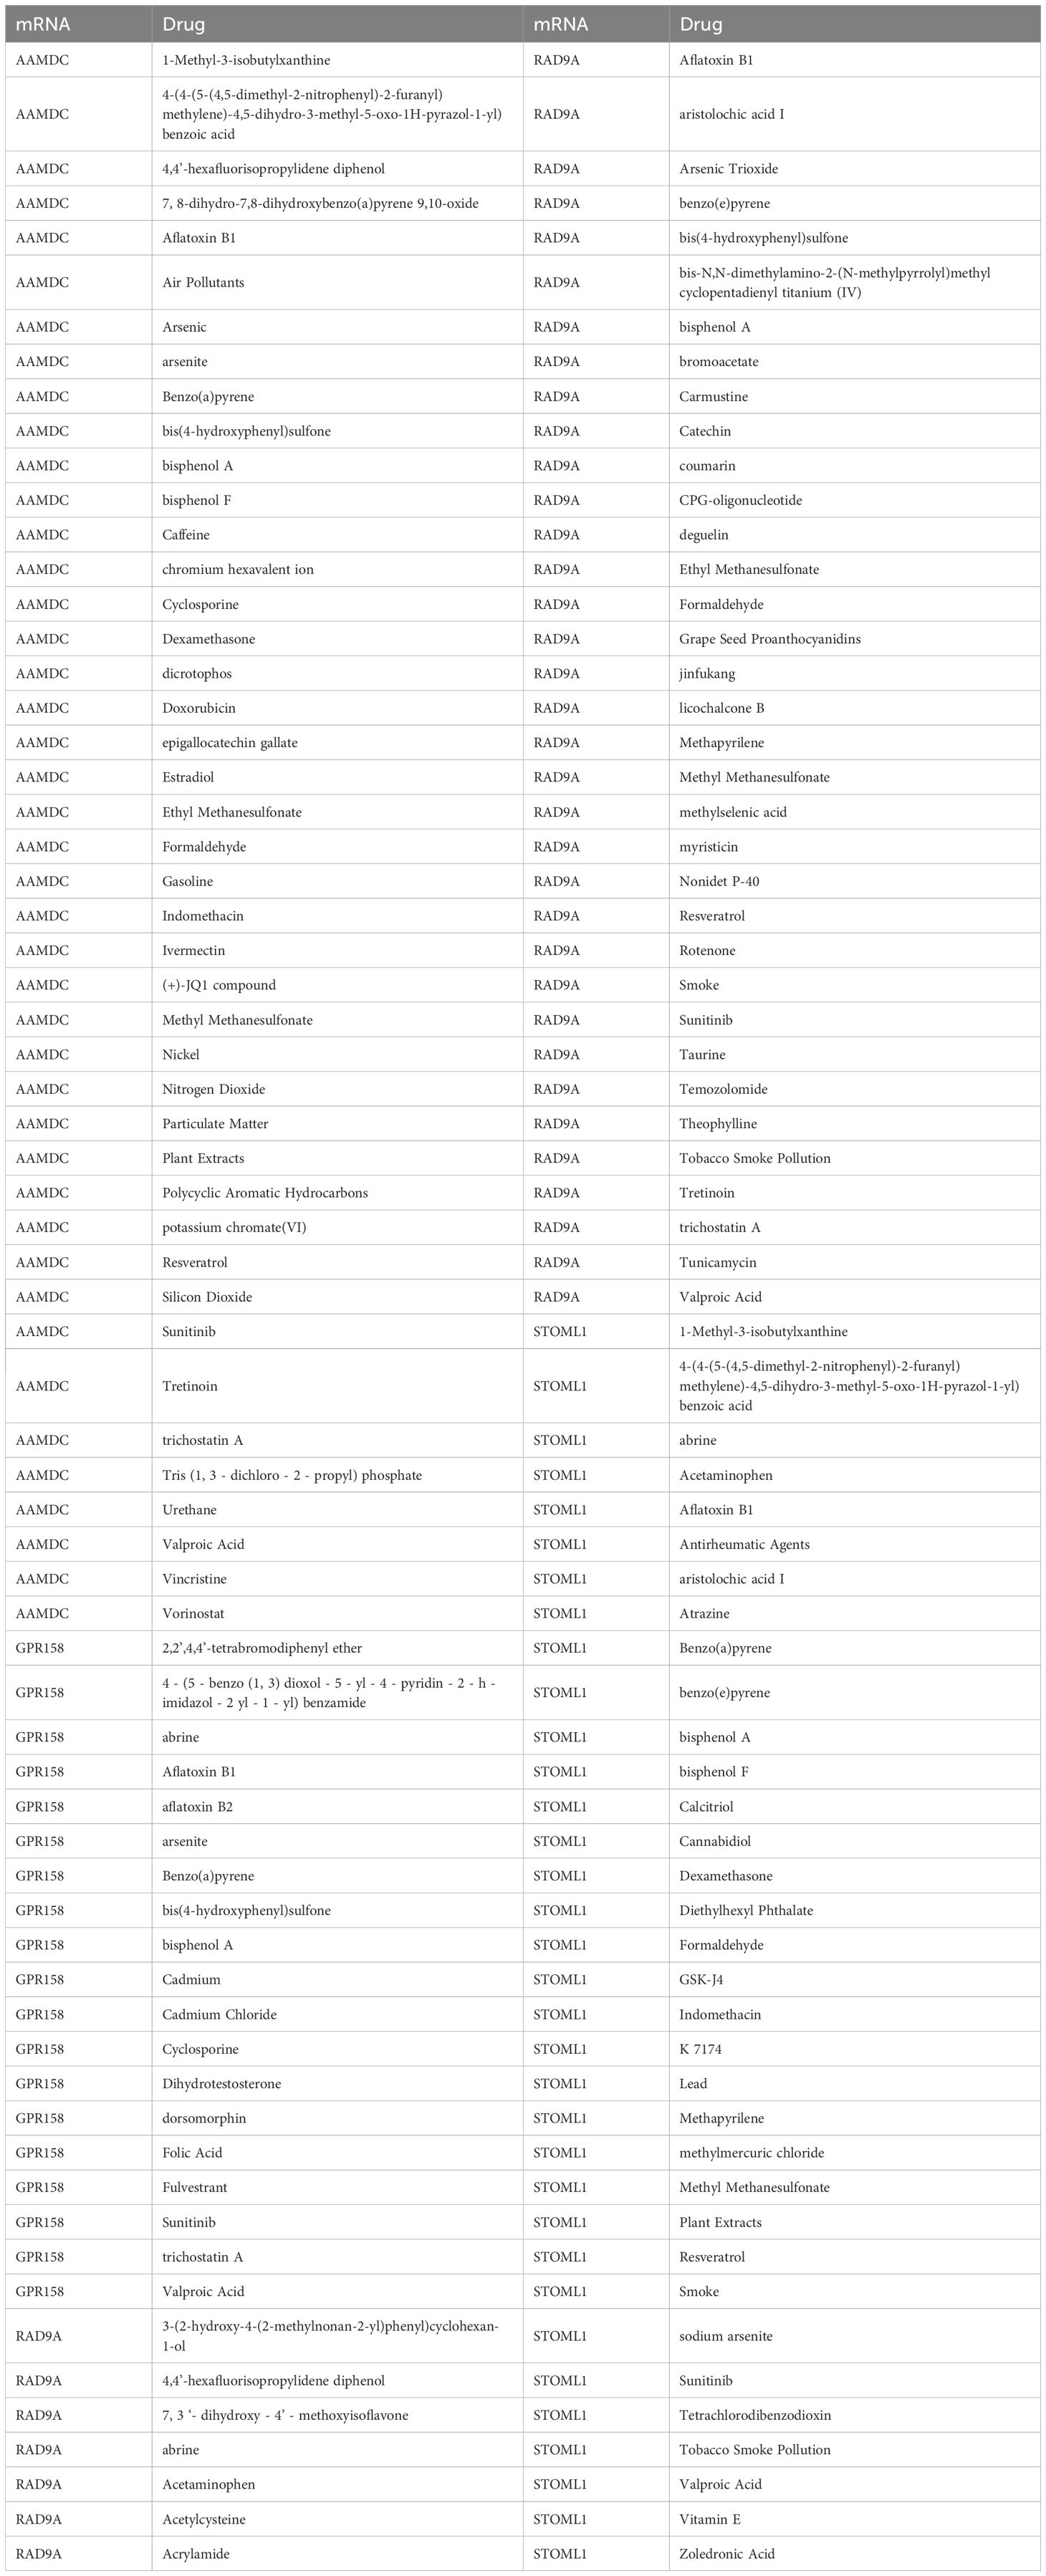
Table 6. mRNA-drug interaction network nodes.
The Gene Set Enrichment Analysis (GSEA) was employed to analyze the relationship between gene expression and biological processes, cellular components and molecular functions of OE and NG groups. Significance enrichment was determined based on p.adj < 0.05 and FDR value (q.value) < 0.05 criteria. The results showed that genes in the Combined dataset disease Control group (CD/Control) were significantly enriched in PID_ATR_PATHWAY (Figure 6B), REACTOME_SYNTHESIS_OF_DNA (Figure 6C), and P. WP_DNA_REPLICATION (Figure 6D), WP_CYTOKINES_AND_INFLAMMATORY_RESPONSE (Figure 6E), PID_IL5_PATHWAY (Figure 6F), BIOCARTA_IL10_PATHWAY (Figure 6G) and other pathways (see Table 7 for pathway details). Furthermore, a mountain plot was utilized to present the results of GSEA for genes between OE and NG groups. (Figure 6A).
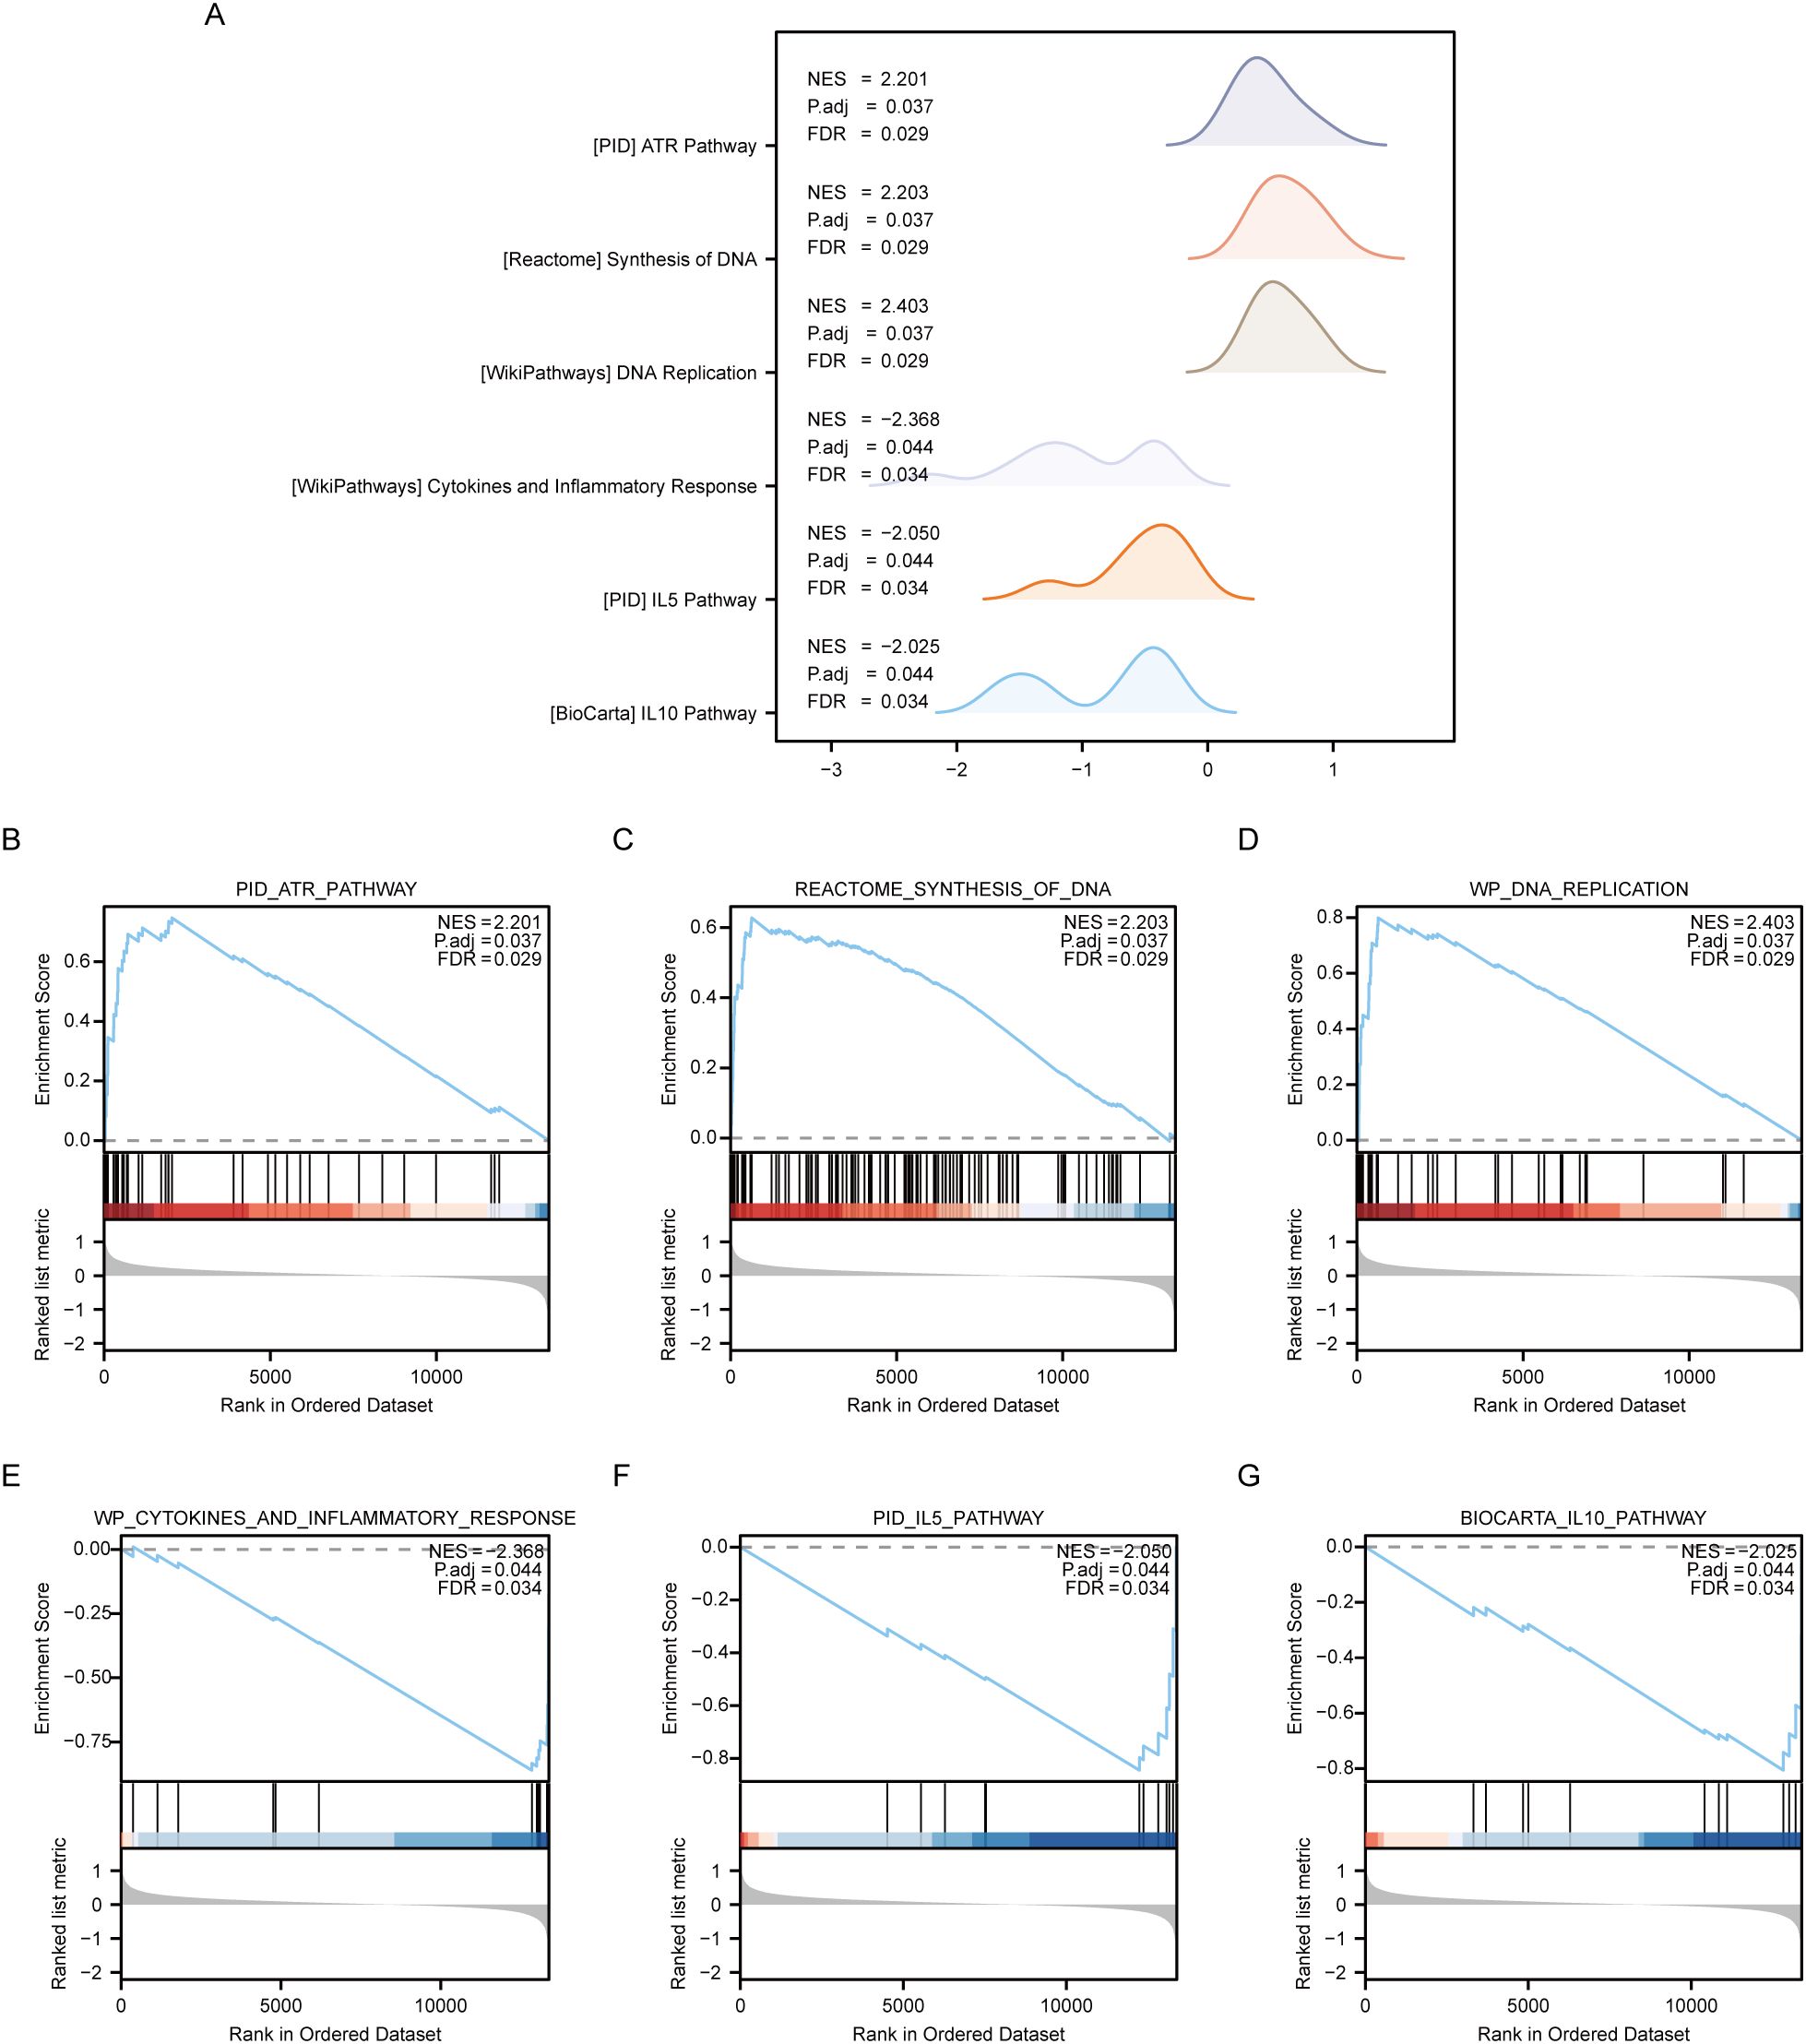
Figure 6. GSEA enrichment analysis between OE group and NG group. (A). Six main biological features of GSEA enrichment analysis between OE and NG groups. B-g. Genes significantly enriched in PID_ATR_PATHWAY (B), REACTOME_SYNTHESIS_OF_DNA (C), WP_DNA_REPLICATION (D) between OE group and NG group. WP_CYTOKINES_AND_INFLAMMATORY_RESPONSE (E), PID_IL5_PATHWAY (F), BIOCARTA_IL10_PATHWAY (G). OE, Overexpression group; NG, Normal group; GSEA, Gene Set Enrichment Analysis. The significant enrichment screening criteria for GSEA enrichment analysis were p. Adj < 0.05 and FDR value (q.value) < 0.05.

Table 7. Result of GSEA enrichment analysis.
Subsequently, we conducted Gene Set Variation Analysis (GSVA) by selecting the top 10 pathways with the largest and smallest logFC values from pathways with P<0.05 for further analysis (refer to Table 8 for details). The GSVA analysis of all genes between OE group and NG group revealed significant differences in a total of 20 pathways including methylated_lcp_in_sperm, soleus_vs_edl_myofibers, and korkola_choriocarcinoma. Based on these results, we performed differential expression analysis of these 20 pathways between the two groups and visualized them using pheatmap R package to generate a heatmap illustrating specific differential patterns (Figure 7A). Additionally, we assessed the degree of group differences in these 20 pathways between the OE group and the NG group through comparative mapping (Figure 7B), which demonstrated statistically significant distinctions in their expression levels (P<0.05).

Table 8. Result of GSVA enrichment analysis.
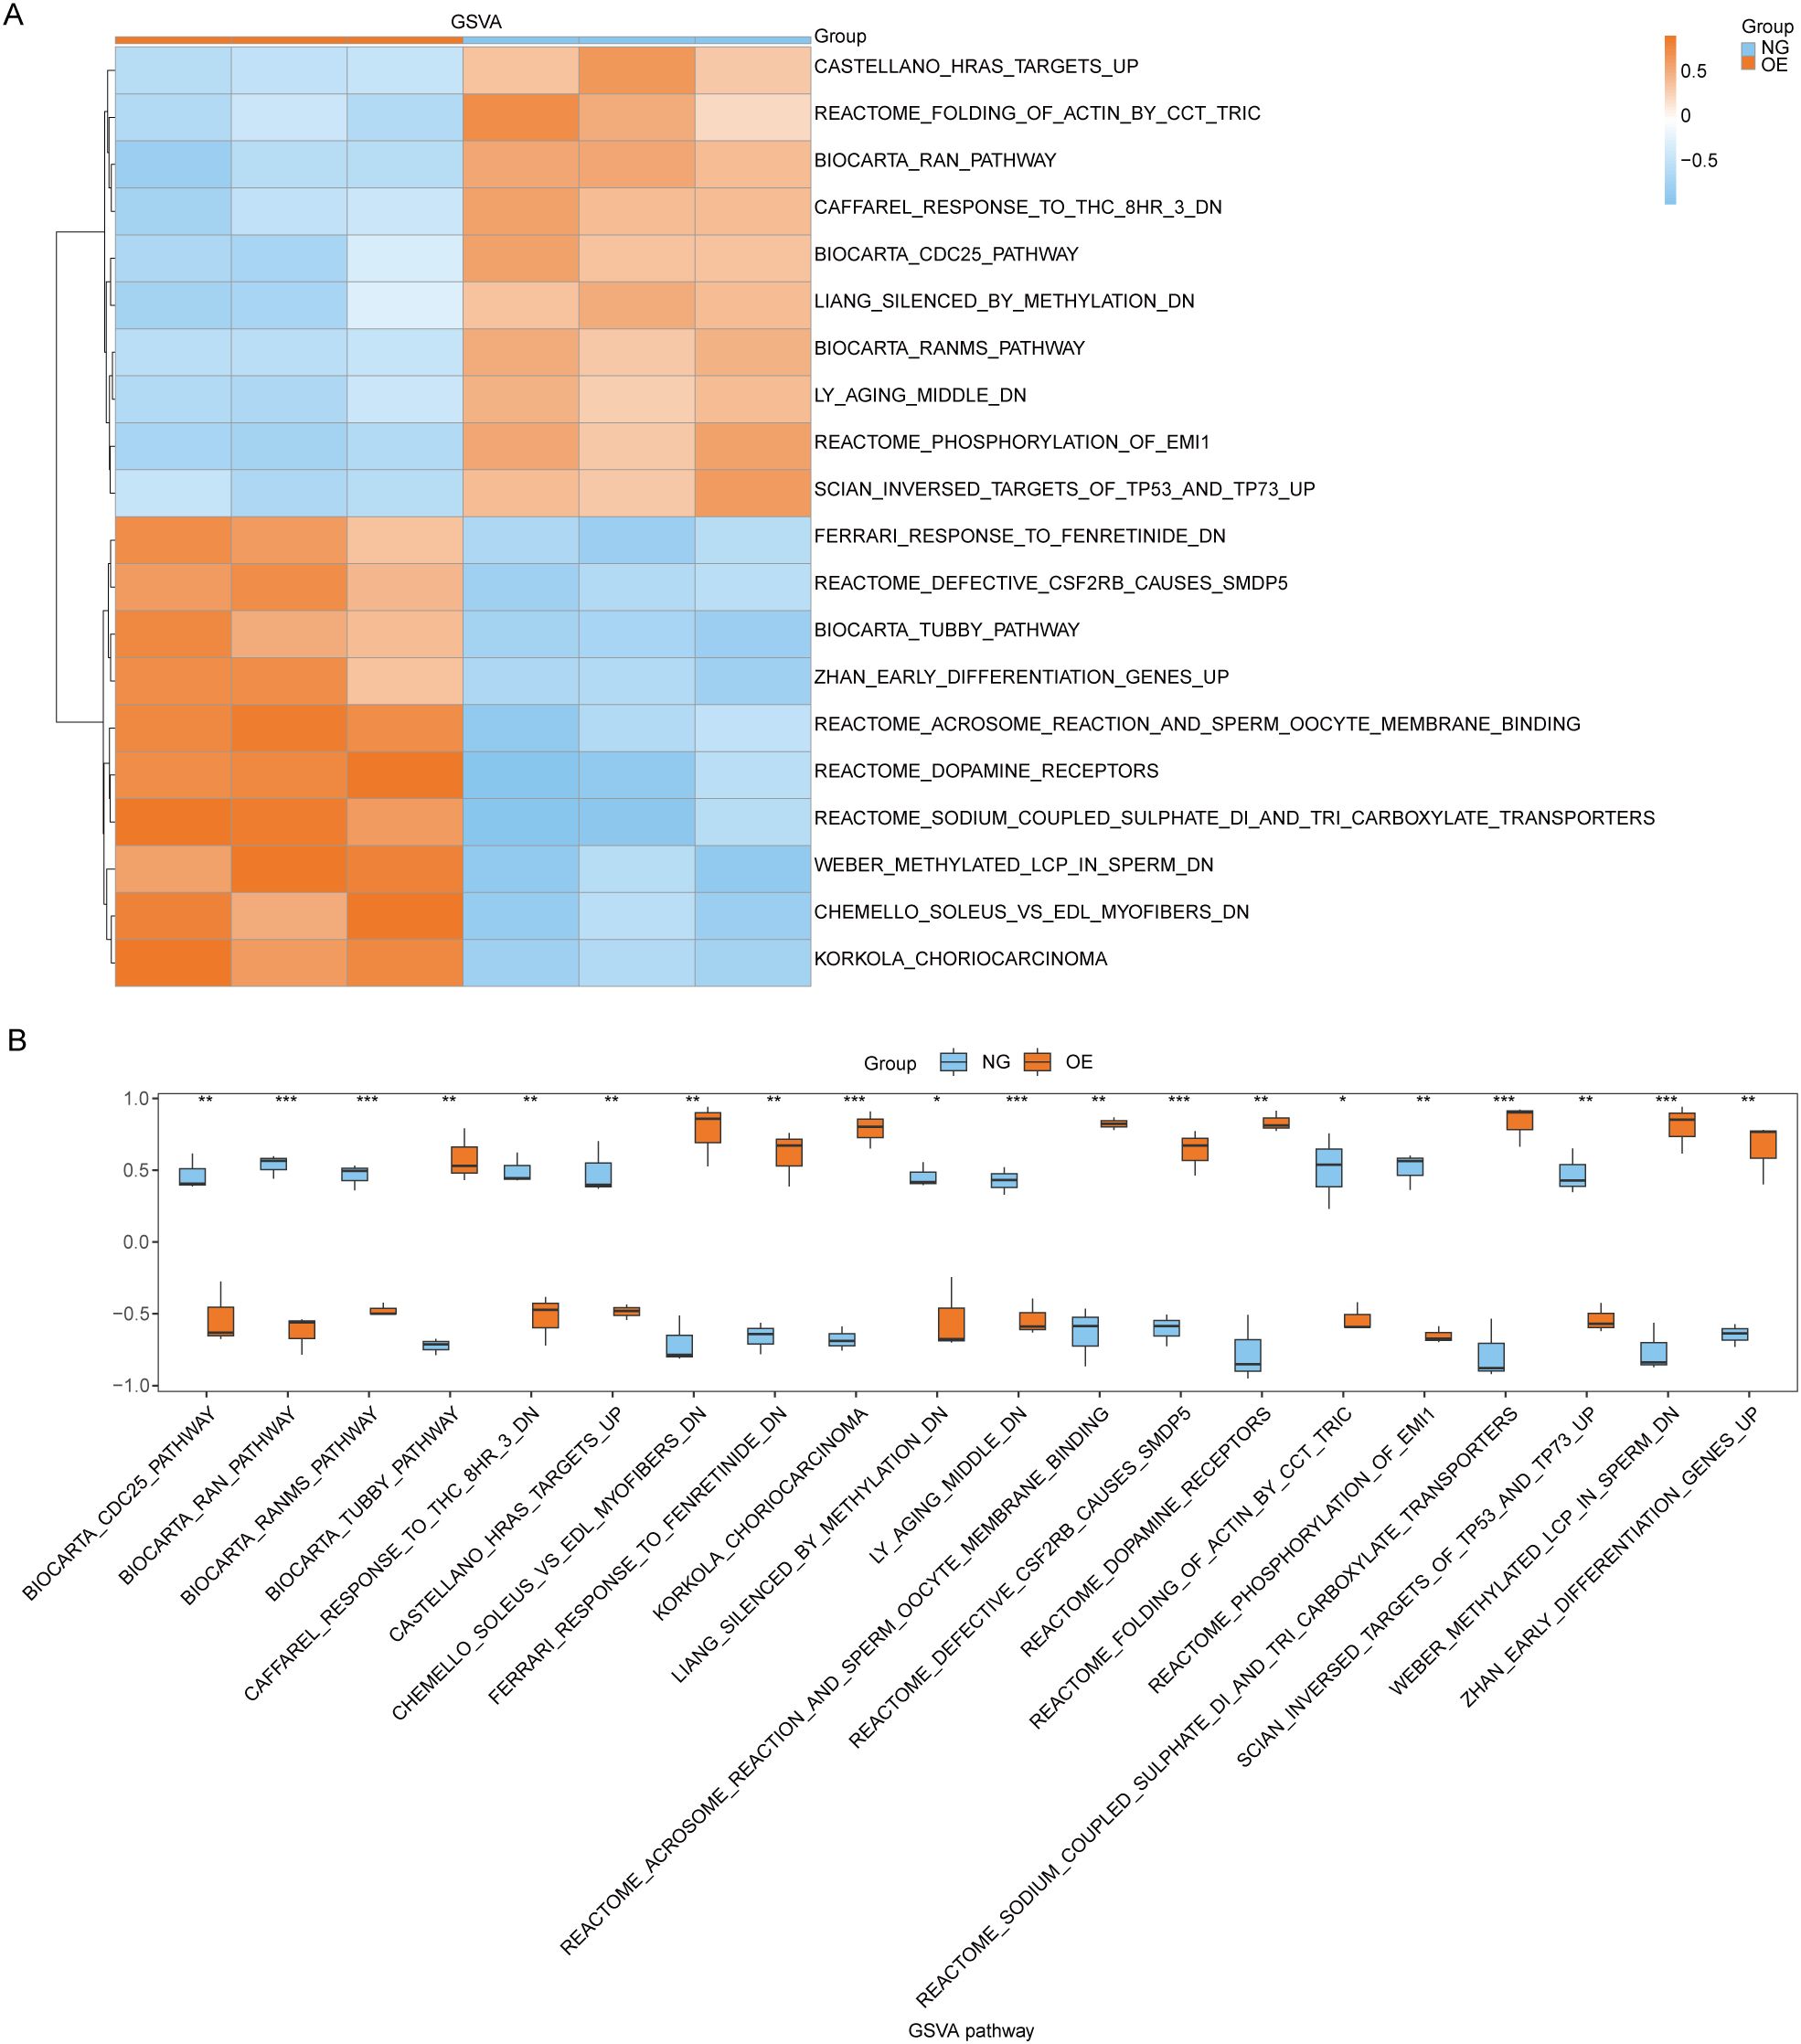
Figure 7. GSVA enrichment analysis between OE group and NG group. (A, B). Complex numerical heat map of GSVA enrichment analysis results between OE group and NG group (A), group comparison plot display (B). OE, Overexpression group; NG, Normal group; GSVA: Gene Set Variation Analysis. The symbol ns is equivalent to P ≥ 0.05 and has no statistical significance; The symbol * is equivalent to P < 0.05, which is statistically significant; The symbol ** is equivalent to P < 0.01, which is highly statistically significant; The symbol *** is equivalent to P < 0.001 and highly statistically significant.
To explore the difference in immune infiltration between the OE group and the NG group, we used the ssGSEA algorithm to calculate the infiltration abundance of 28 immune cells in the OE group and the NG group samples, and then displayed the difference degree of infiltration of 28 immune cells by group comparison plot (Figure 8A). The results showed that the infiltration abundance of Type 17 T helper cells was significantly different between the OE group and the NG group (P<0.05).
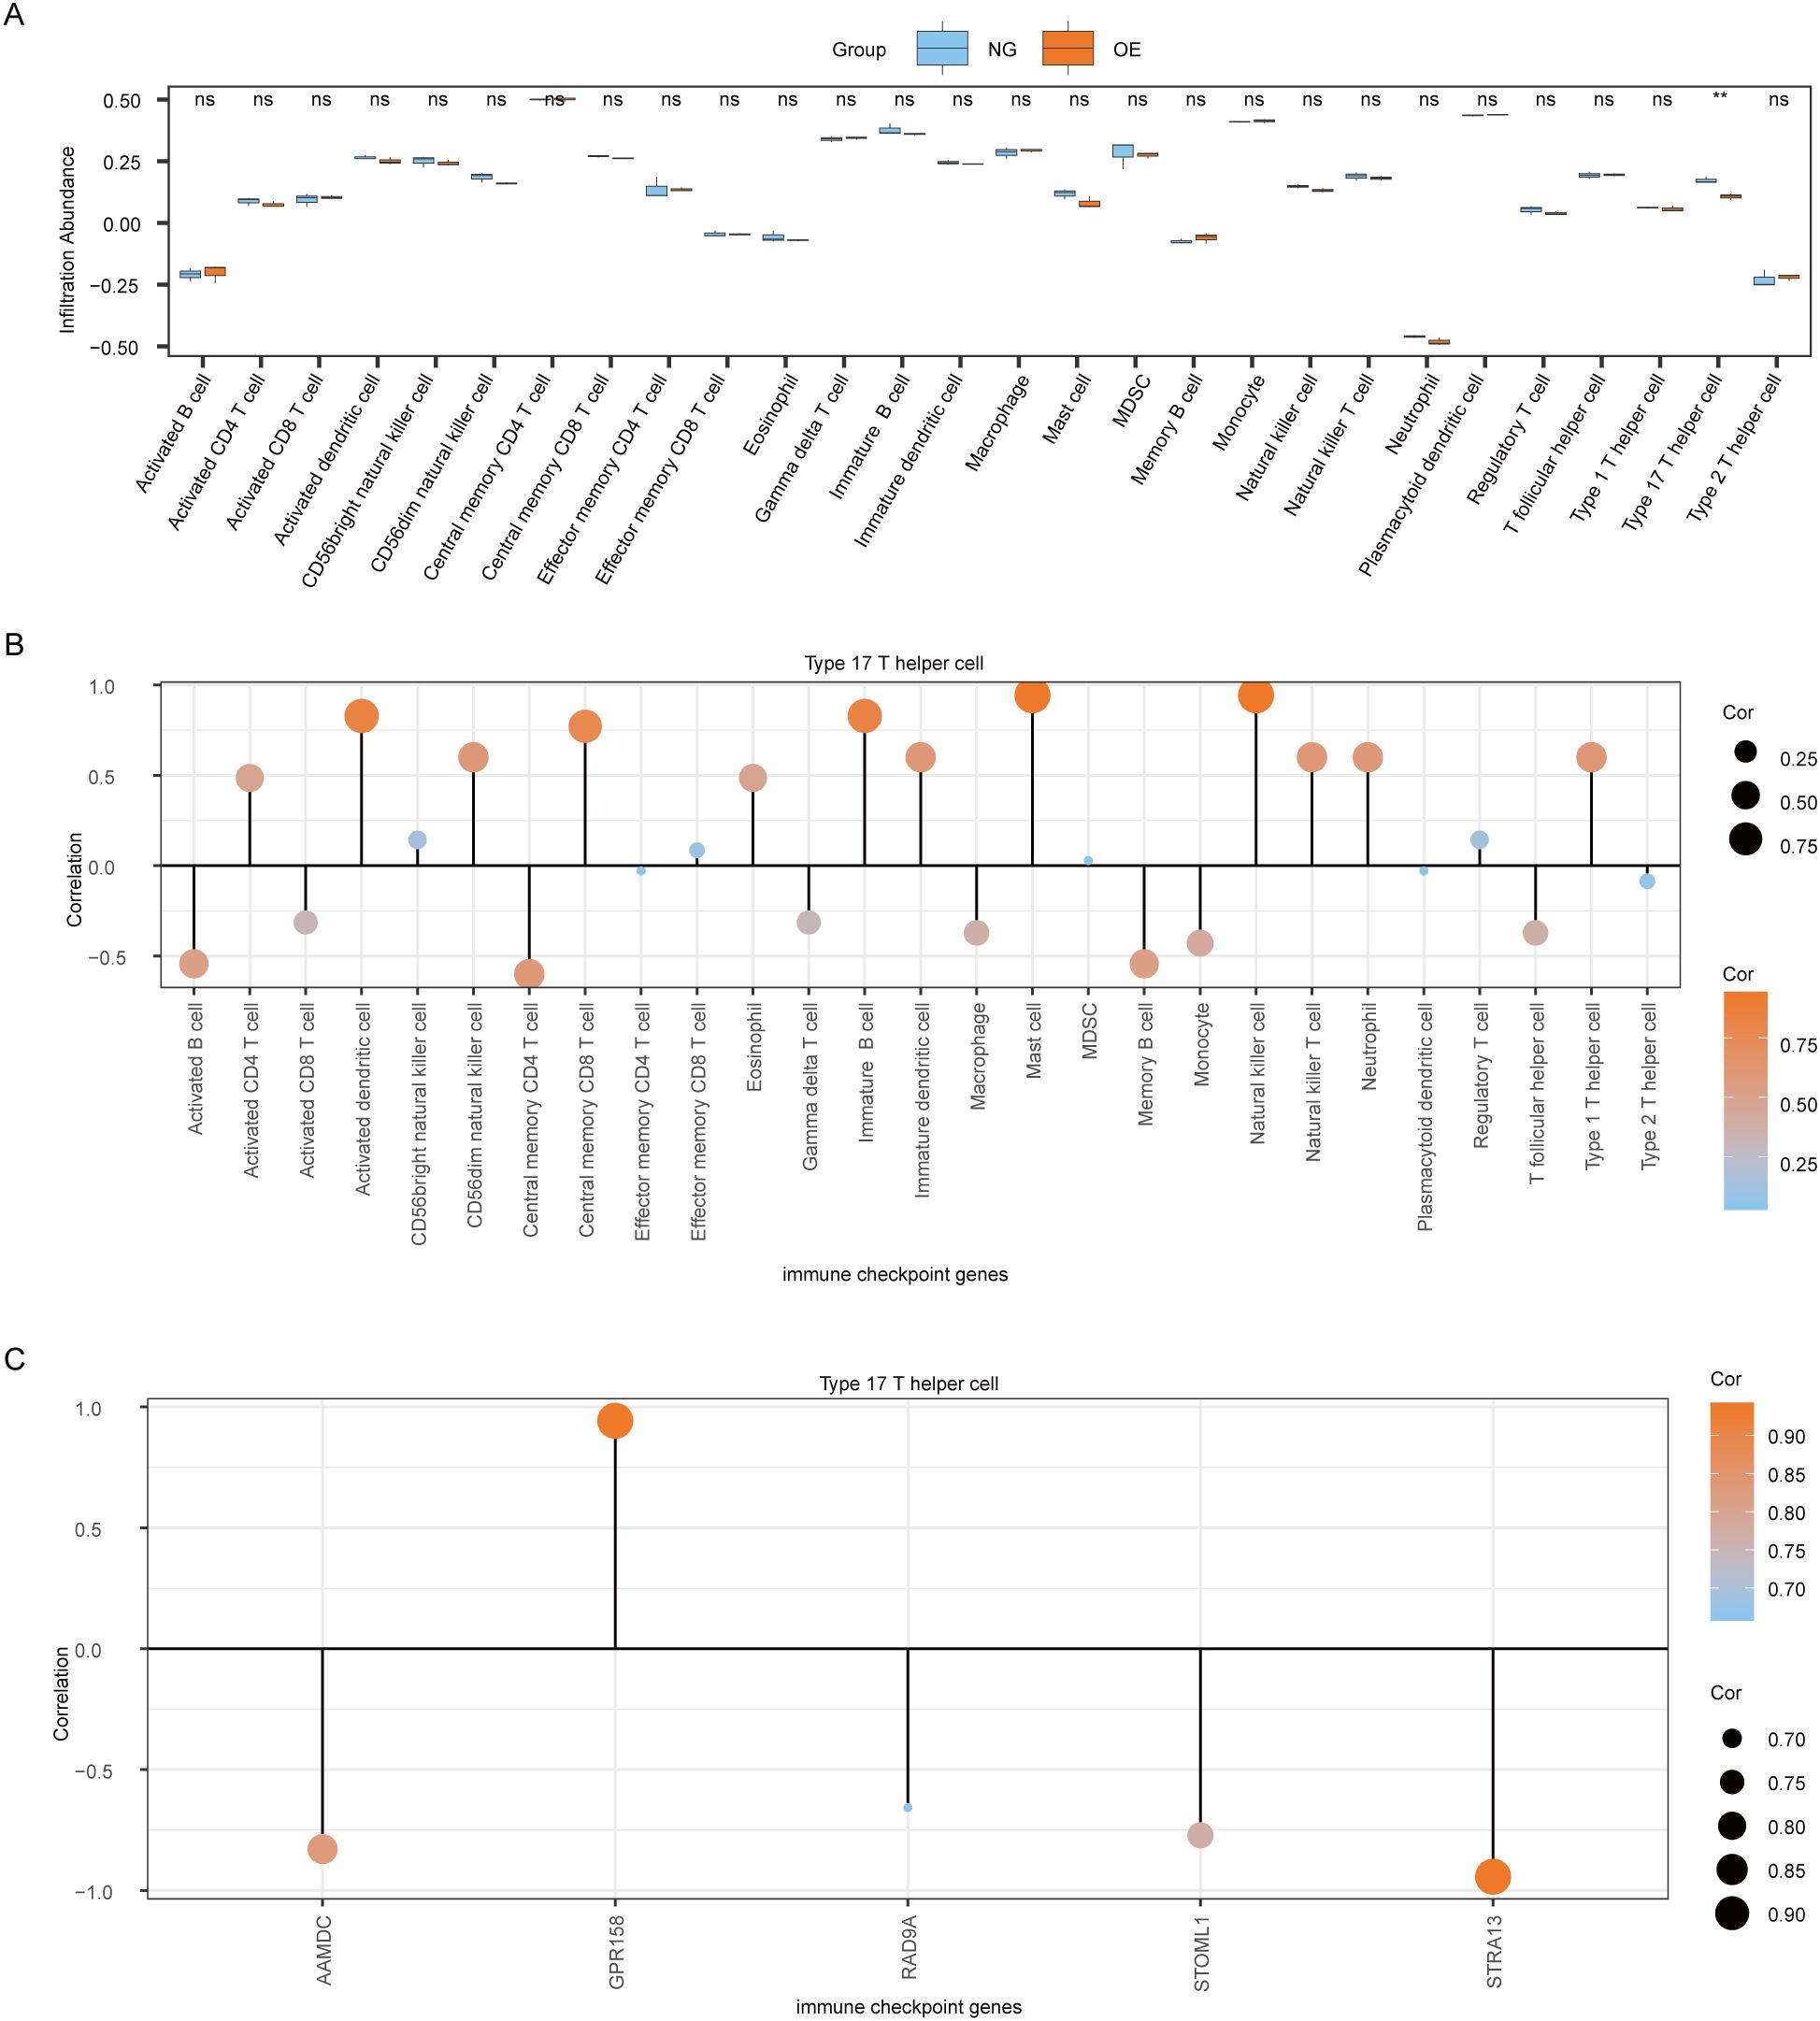
Figure 8. Analysis of ssGSEA immune characteristics between OE group and NG group. (A). Group comparison of ssGSEA immune infiltration analysis results between OE group and NG group is shown. (B). Lollipop chart showing the correlation between Type 17 T helper cells and immune cells. (C). Lollipop diagram of the correlation between Type 17 T helper cells and Co-DEGs. The symbol ns is equivalent to P≥ 0.05, which is not statistically significant. The symbol ** is equivalent to P < 0.01, which is highly statistically significant; and highly statistically significant. OE, Overexpression group; NG, Normal group; ssGSEA, single-sample gene-set enrichment Analysis; Co-DEGs, Common differentially expressed genes.
Then we plotted the correlation lollipop diagram to show the correlation between Type 17 T helper cells and other immune cells. According to the figure, Mast cells and Natural killer cells were the most strongly correlated with Type 17 T helper cells (Figure 8B).
At the same time, we also plotted the correlation lollipop graph to show the correlation between Type 17 T helper cells and 5 Co-DEGs (AAMDC, GPR158, RAD9A, STOML1, STRA13). The results showed that Type 17 T helper cells were strongly correlated with GPR158 and STRA13 (Figure 8C).
The CIBERSORT algorithm was employed to calculate the infiltration abundance of 22 immune cells in the disease Control group (CD/Control). A stacked bar chart was utilized to visually represent the proportion of immune cells visually represent (Figure 9A). The findings revealed that the infiltrating abundance of 15 immune cells in the Combined dataset samples was not all 0, and these 15 immune cells were B cells memory, B cells naive, Dendritic cells resting, Eosinophils, and eosinophils. Macrophages M0, Macrophages M1, Macrophages M2, Mast cells activated, Neutrophils, NK cells resting, T cells CD4 memory resting, T cells CD8, T follicular helper (Tfh)cells, γδT-cells and regulatory T-cells (Tregs).
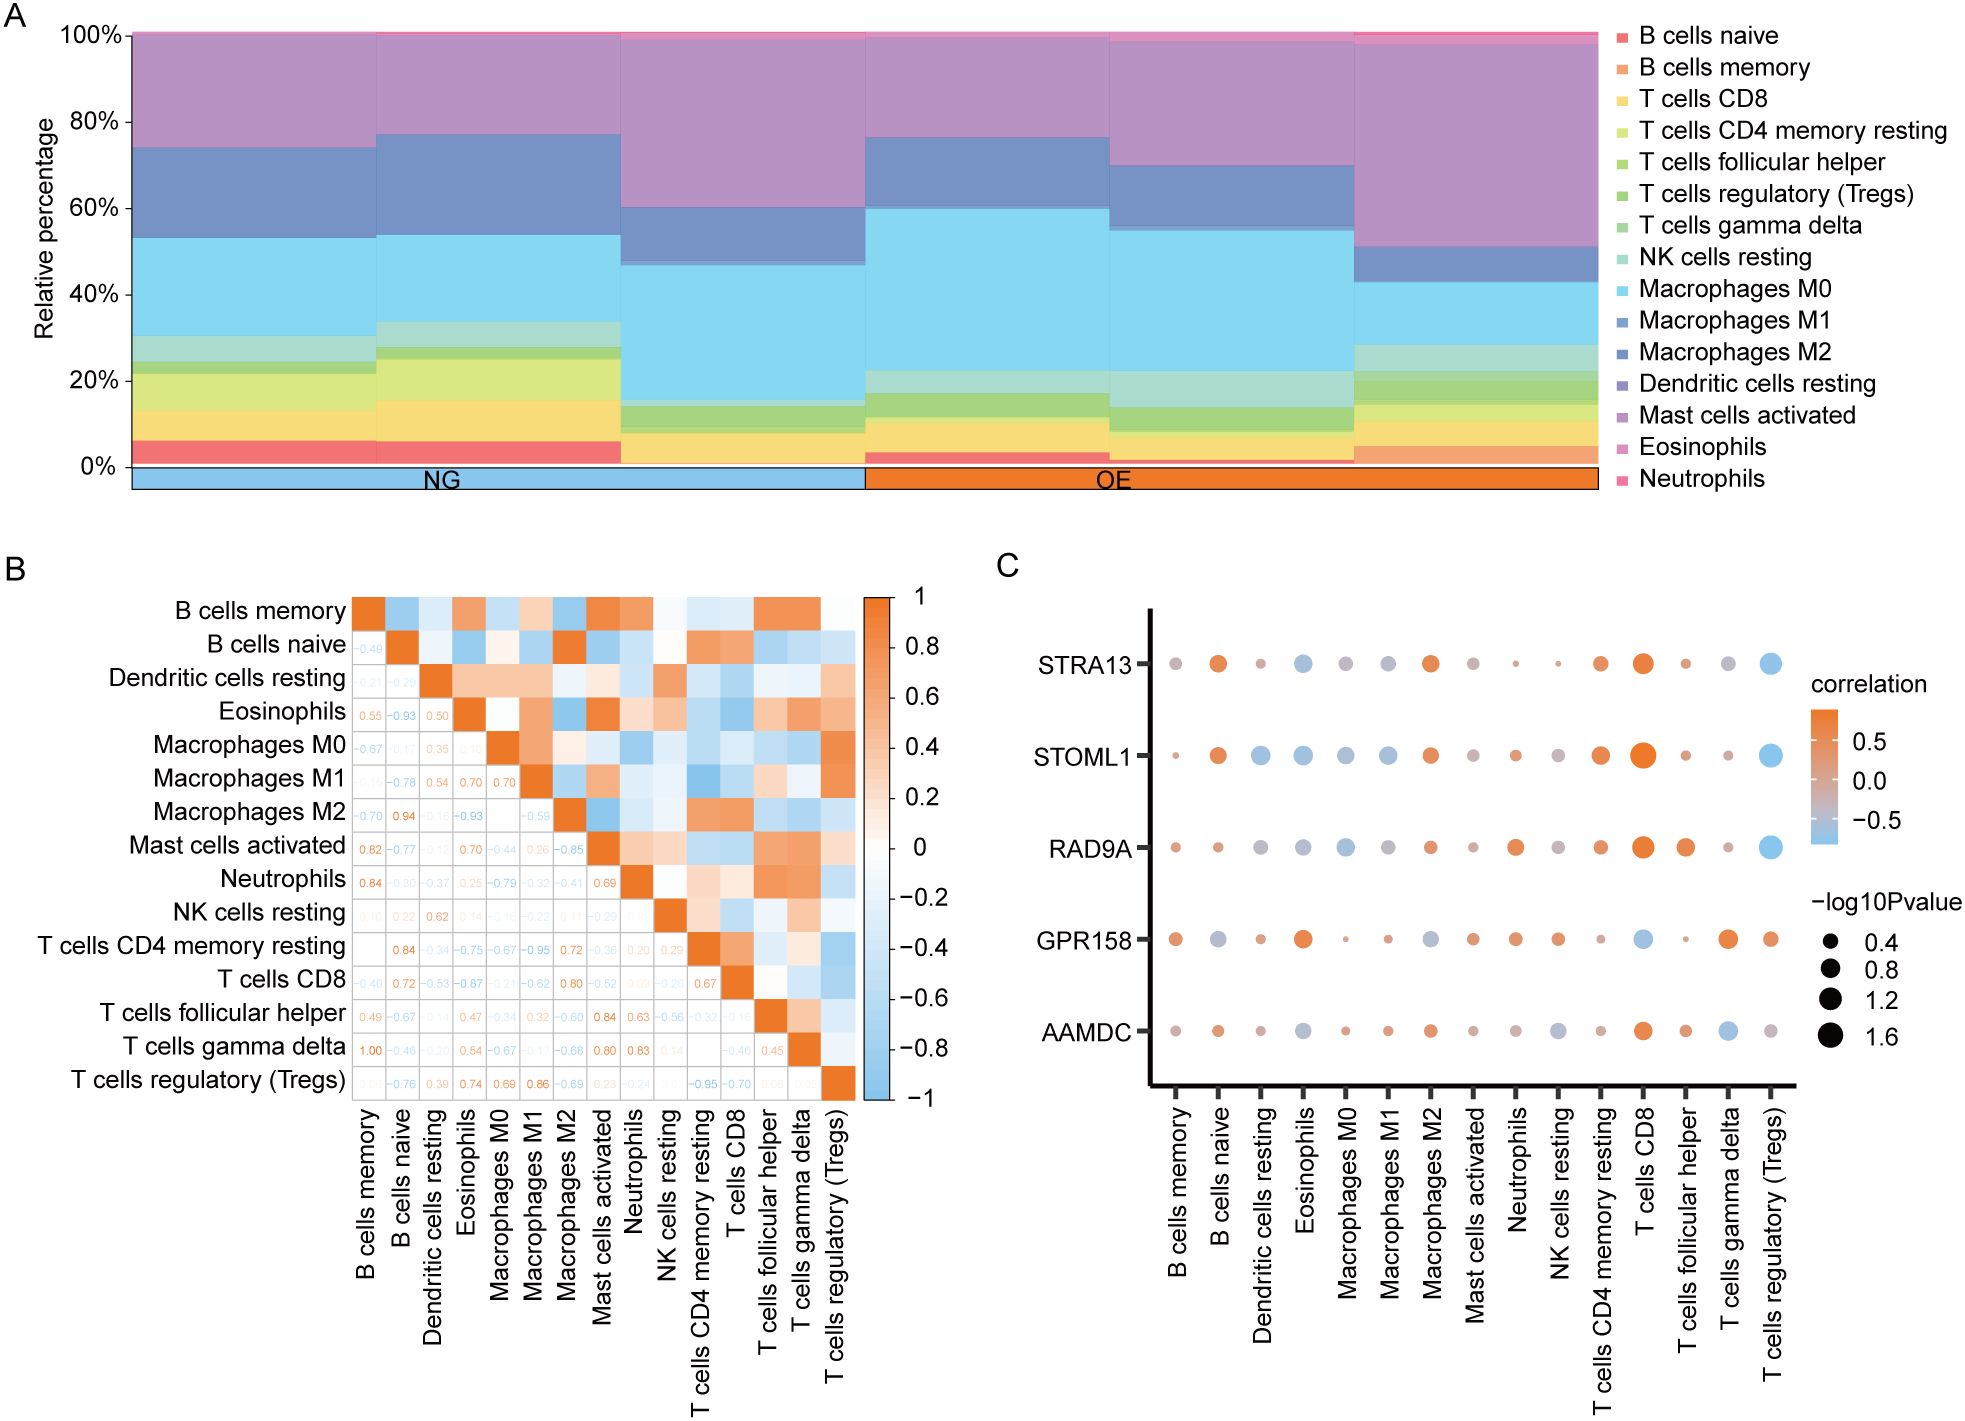
Figure 9. CIBERSORT immune characteristics difference analysis between OE group and NG group. (A). The infiltration abundance of immune cells between OE group and NG group was shown by stacking bar chart. (B). The correlation between immune cells is shown. (C). Dot plot of correlation between immune cells and Co-DEGs. OE, Overexpression group; NG, Normal group; Co-DEGs, Common differentially expressed genes.
The spearman statistical algorithm was employed to compute the correlation among 15distinct immune cell types, revealing a balanced distribution of positive and negative correlations. Notably, Macrophages M2 and B cells naive exhibited the most robust association.
We subsequently employed Spearman’s statistical algorithm to calculate the correlation between 15 immune cells and 5 Co-DEGs (AAMDC, GPR158, RAD9A, STOML1, STRA13) (Figure 9B). The findings revealed a balanced distribution of positive and negative correlations among the immune cells and Co-DEGs. Notably, T cells CD8 exhibited the strongest association with STOML1 (Figure 9C).
The differential gene expression results were validated by performing RT-PCR analysis on five selected genes (AAMDC, GPR158, RAD9A, STOML1, and STRA13). These genes exhibited consistent patterns with the transcriptome analysis data; however, slight variations in individual values were observed due to disparities in method sensitivity (Figure 10).
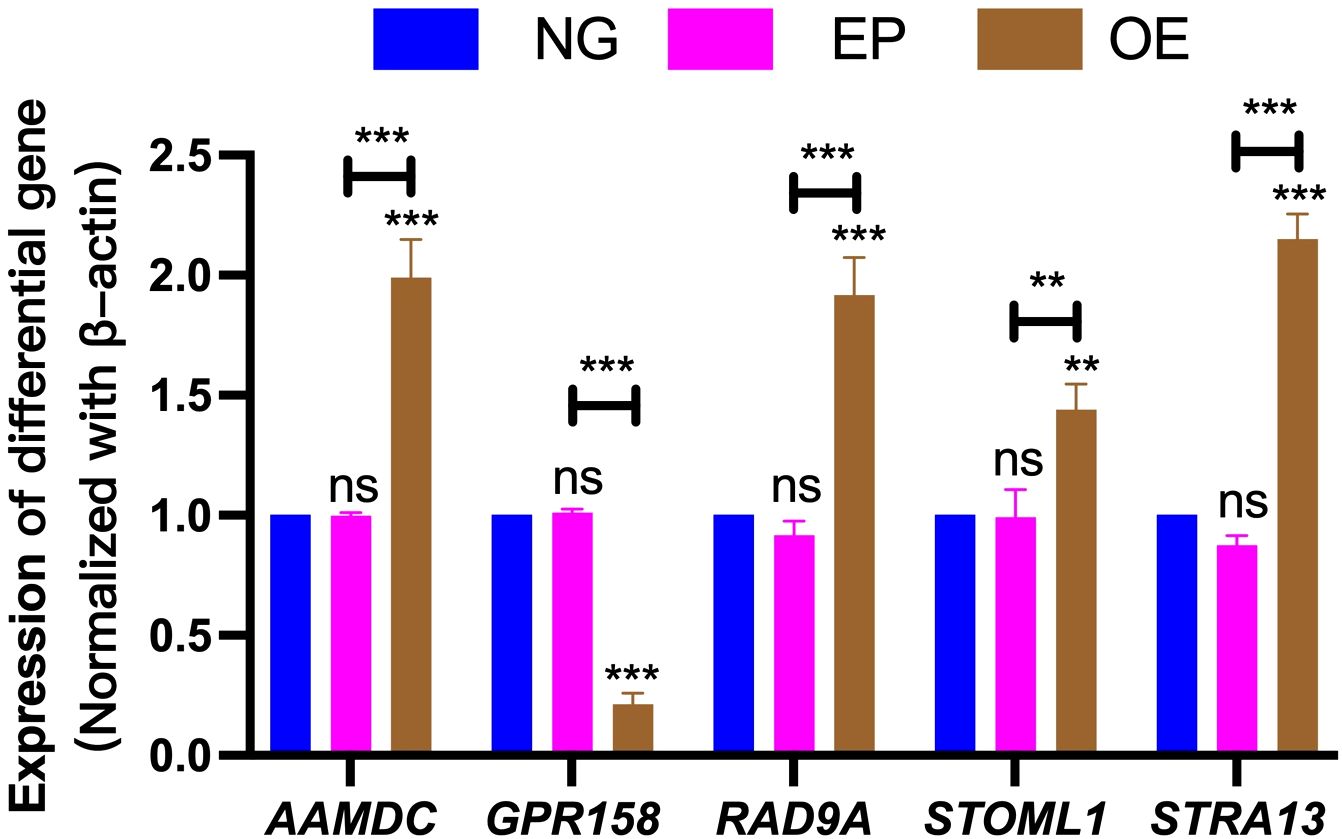
Figure 10. Validation of differentially expressed gene results. Verification of differentially expressed genes AAMDC, GPR158, RAD9A, STOML1 and STRA13 among NG, EP and OE groups. NG, Normal group;EP, Empty group; OE, Overexpression group.The symbol ns was equivalent to P ≥ 0.05, which was not statistically significant. The symbol ** is equivalent to P < 0.01, which is highly statistically significant; The symbol *** is equivalent to P < 0.001 and highly statistically significant.
T.gondii has the ability to infect a wide range of warm-blooded animals, including humans (Bao et al., 2021). During the infection process of host nucleated cells by T.gondii, the ROP16 protein is secreted and released into the cytoplasmic lysate. It then rapidly translocates and localizes to the host nucleus by nuclear translocation sequences and exerts its function (Xin et al., 2020). In macrophages, which are an important preferential target cell for parasite infection, ROP16 plays diverse roles such as reducing inflammatory progenitor cytokines and macrophage differentiation (Jin et al., 2023).
The study of T.gondii infection necessitates an examination of immunity to infection, wherein macrophages assume a pivotal role owing to their ubiquitous presence in various tissues or organs, ability to migrate into tissues or organs during homeostatic or inflammatory states, and crucial defense function in the intrinsic immune response (Chen et al., 2020).
Because macrophages are crucial for studying the immune mechanism of infection (Jiménez-Garcia et al., 2015), the direct use of primary macrophages in experiments closely mimics the physiological state compared to cell lines. However, due to challenges associated with obtaining primary macrophages, individual differences, individual variations, labor-intensive procedures, and limited survival time during isolation, stable transmissible rat or mouse macrophage cell lines or induced monocytes as macrophages are still the main source of macrophages in current experimental research. The present study aimed to investigate the direct or indirect transcriptional regulation and heterogeneous effects of T.gondii ROP16 II on human-derived THP-1 macrophages, differentiated by PMA (light stabilizer 12-mystate 13-acetate), which holds significant research implications (Jiménez-Garcia et al., 2015; Yoo et al., 2022). Additionally, we sought to explore the regulation of genes and signaling pathways associated with human-derived macrophages following rop16 overexpression, potentially offering a novel immunotherapy strategy utilizing effector molecules derived from parasites.
The aim of this study was to investigate the relationship between toxoplasmosis and target genes. This was achieved by conducting differential expression analysis to screen Co-DEGs, followed by GO, GSEA and GSVA analysis. Additionally, a PPI network and mRNA interaction network were constructed to elucidate the interplay among these genes. Furthermore, immune infiltration analysis was performed using the ssGSEA algorithm.
The present study employed bioinformatics analysis to identify five key genes, namely AAMDC, GPR158, RAD9A, STOML1, and STRA13 among the Co-DEGs. These genes are potentially involved in the regulatory mechanism of T.gondii ROP16 protein-infected cells and may affect the occurrence and prognosis of toxoplasmosis through the regulation of infection. Furthermore, the expression patterns of these genes are associated with the onset, progression, and metastasis of toxoplasmosis. They also hold promise as potential therapeutic targets for developing new treatments against toxoplasmosis. Additionally, we observed significant differences in 20 pathways related to hras targets, folding of actin by cct tric, and ran pathway among CD/Control datasets for disease controls. Notably enriched pathways included atr pathway, synthesis of DNA, DNA replication, cytokines and inflammatory response, IL5 pathway as well as L10 pathway. Moreover, the abundance of Type 17 T helper cell infiltration showed statistically significantly different between the OE and NG groups (P<0.05). By analyzing mRNA-miRNA, mRNA-RBP, and mRNA-TF interactions networks, it is possible to gain insights into the regulatory mechanisms underlying toxoplasmosis-related gene expression. Furthermore, this analysis can help identify potential regulatory pathways involved in this process. Immune cell infiltration analysis revealed strong correlations between Mast cell, Natural killer cell and Type 17 T helper cell. Type 17 T helper cell exhibited a strong correlation with GPR158 and STRA13. Among immune cell correlations the strongest correlation was between M2 Macrophages and B cells naive, and cellular CD8 T cells correlated most strongly with STOML1.
The key gene AAMDC plays a crucial role in cellular energy utilization and storage by interacting with multiple signaling pathways. Their specific structural domains are essential for regulating cell differentiation, metabolism and formation (Xiao et al., 2019). In certain types of cancers (Golden et al., 2021), AAMDC proteins may have either promotional or inhibitory effects. GPR158 transduces signals through coupling to RGS proteins (Laboute et al., 2023) and regulates key ion channels, kinases, and neurotrophic factors involved in neuronal excitability and synaptic transmission by modulating signaling of the second messenger 3’,5’ -adenosine monophosphate (cAMP) (Piaggi et al., 2017). RAD9A is a cell cycle checkpoint protein required for cell cycle arrest and DNA damage repair. Its 3’ to 5’ nuclease activity may be related to its role in sensing and repairing DNA damage (Vasileva et al., 2013; Pelaia et al., 2016). Stomatin Like 1 (STOML1) is a protein-coding gene highly expressed in the brain but with lower expression levels observed in cardiac, skeletal muscle, and DRG sensory neurons (Kozlenkov et al., 2014). Significantly levels of STOML 1 expression are detected in the frontal lobe, cerebral cortex, hippocampus, and other basal ganglia. STOML1 consists of a structural domain resembling stomatocystin and SCP -2, an acid-sensitive cell membrane protein that regulates acid sensitivity in ion channels, and is believed to regulate the function of ion channels and transporter proteins (Edqvist and Blomqvist, 2006; Wang et al., 2020). STRA13 is a transcription factor involved in immune cell homeostasis regulation autoimmunity; it is up-regulated at mRNA levels across various cancer cell lines (Ivanova et al., 2004). These genes have been shown to participate in processes such as cell differentiation and regeneration, circadian regulation, immune homeostasis and metabolism (Ow et al., 2014). The identification of AAMDC, GPR158, RAD9A, STOML1, STRA13 genes provides potential molecular therapeutic or immunotherapeutic targets that could contribute towards precision diagnosis and personalized treatment for T.gondii infection breakthroughs.
In light of these crucial factors and in conjunction with the present study, it is of immense significance to comprehend the modulation of host immune function by T.gondii ROP16 protein, elucidate the inter-regulatory mechanism between ROP16 and host macrophages, unravel the underlying mechanism governing the transition between pro-inflammatory and anti-inflammatory roles of immune cells, as well as to identify novel targets for drug intervention in immune-inflammation.
The pathways significantly enriched in this study included the ATR pathway, DNA synthesis, DNA replication, cytokines and inflammatory response, IL5 pathway, and L10 pathway. Among these pathways IL-5 primarily produced by T cells, acts as the key cytokine influencing eosinophil growth, differentiation, recruitment, activation, and survival. It also impacts the activation of several subsequent signaling pathways including JAK/STAT, MAPK, PI3K, and NF-κB, which are responsible for transcription of genes involved in eosinophil differentiation, degranulation, survival, proliferation, chemotaxis, and adhesion (Takatsu and Nakajima, 2008). Interleukin 10 (IL-10), a pleiotropic cytokine with potent anti-inflammatory properties, is mainly secreted by antigen-presenting cells such as activated T cells, monocytes, B cells, and macrophages. It inhibits the expression of inflammatory cytokines, such as TNF-α, IL-6, and IL-1 by activating macrophages (Pelaia et al., 2016). The enrichment of these pathways aligns with the findings of this study suggesting that rop16 overexpression indeed affects host macrophage-associated inflammatory factors secretion and expression.
This study has several limitations. Firstly, the bioinformatics analysis results were solely based on data obtained from rop16 overexpression in cell lines without further functional validation through wet experiments. Secondly, the lack of corresponding clinical correlation studies prevented the analysis of clinical information alongside the findings. Lastly, potential batch-to-batch variations within the large dataset or insufficient sample sizes may affected the reliability and stability of the experiment’s; thus, a larger sample size is required for ensuring robustness. Consequently, this paper provides a comprehensively exploration of toxoplasmosis pathogenesis and presents a scoring model. Nevertheless, further verification is necessary to elucidate specific pathogenic and molecular targets.
The pivotal genes AAMDC, GPR158, RAD9A, STOML1and STRA13 identified in this study have the potential to serve as molecular therapeutic or immunotherapeutic targets for toxoplasmosis; however, their specific function mechanisms require further verification. Additionally, the high expression of one of the AAMDC genes suggests a possible avenue for using toxoplasma proteins to treat tumors. These findings enhance our understanding of ROP16 and may inform future therapeutic strategies against toxoplasmosis by guiding the development of new and safer approaches.
The original contributions presented in the study are included in the article/supplementary material. Further inquiries can be directed to the corresponding author.
Ethical approval was not required for the studies on humans in accordance with the local legislation and institutional requirements because only commercially available established cell lines were used.
NY: Writing – original draft, Writing – review & editing, Data curation, Methodology, Supervision. ML: Writing – review & editing, Data curation, Validation. HY: Writing – original draft, Data curation. JL: Writing – original draft, Data curation. TD: Writing – original draft, Formal analysis. GL: Writing – original draft, Software. ZZ: Writing – original draft, Writing – review & editing, Conceptualization, Supervision.
The author(s) declare financial support was received for the research, authorship, and/or publication of this article. This study was supported by the Natural Science Foundation of Ningxia (No. 2022AAC03547). Supported by the National Natural Science Foundation of China (No. 81560333). Supported by the School-level Project of Ningxia Medical University (No. XM2021037).
We are grateful to the Ningxia Key Laboratory of Clinical Pathogenic Microorganisms for their assistance in this study.
The authors declare that the research was conducted in the absence of any commercial or financial relationships that could be construed as a potential conflict of interest.
All claims expressed in this article are solely those of the authors and do not necessarily represent those of their affiliated organizations, or those of the publisher, the editors and the reviewers. Any product that may be evaluated in this article, or claim that may be made by its manufacturer, is not guaranteed or endorsed by the publisher.
Bao, X., Shi, R., Zhao, T., Wang, Y. (2020). Immune landscape and a novel immunotherapy-related gene signature associated with clinical outcome in early-stage lung adenocarcinoma. J. Mol. Med. (Berl) 98, 805–818. doi: 10.1007/s00109-020-01908-9
Bao, X., Shi, R., Zhao, T., Wang, Y., Anastasov, N., Rosemann, M., et al. (2021). Integrated analysis of single-cell RNA-seq and bulk RNA-seq unravels tumour heterogeneity plus M2-like tumour-associated macrophage infiltration and aggressiveness in TNBC. Cancer Immunol. Immunother. 70, 189–202. doi: 10.1007/s00262-020-02669-7
Chang, S., Shan, X., Li, X., Fan, W., Zhang, S. Q., Zhang, J., et al. (2015). Toxoplasma gondii Rhoptry Protein ROP16 Mediates Partially SH-SY5Y Cells Apoptosis and Cell Cycle Arrest by Directing Ser15/37 Phosphorylation of p53. Int. J. Biol. Sci. 11, 1215–1225. doi: 10.7150/ijbs.10516
Chen, L., Christian, D. A., Kochanowsky, J. A., Phan, A. T., Clark, J. T., Wang, S., et al. (2020). The Toxoplasma gondii virulence factor ROP16 acts in cis and trans, and suppresses T cell responses. J. Exp. Med. 217, e20181757. doi: 10.1084/jem.20181757
Croken, M. M., Qiu, W., White, M. W., Kim, K. (2014). Gene Set Enrichment Analysis (GSEA) of Toxoplasma gondii expression datasets links cell cycle progression and the bradyzoite developmental program. BMC Genomics 15, 515. doi: 10.1186/1471-2164-15-515
David Sibley, L., Khan, A., Ajioka, J. W., Rosenthal, B. M. (2009). Genetic diversity of Toxoplasma gondii in animals and humans. Philos. Trans. R Soc. Lond B Biol. Sci. 364, 2749–2761. doi: 10.1098/rstb.2009.0087
Deichaite, I., Sears, T. J., Sutton, L., Rebibo, D., Morgan, K., Nelson, T., et al. (2022). Differential regulation of TNFα and IL-6 expression contributes to immune evasion in prostate cancer. J. Transl. Med. 20, 527. doi: 10.1186/s12967-022-03731-x
Edqvist, J., Blomqvist, K. (2006). Fusion and fission, the evolution of sterol carrier protein-2. J. Mol. Evol. 62, 292–306. doi: 10.1007/s00239-005-0086-3
Ekoff, M., Kaufmann, T., Engström, M., Motoyama, N., Villunger, A., Jönsson, J.-I., et al. (2007). The BH3-only protein Puma plays an essential role in cytokine deprivation induced apoptosis of mast cells. Blood 110, 3209–3217. doi: 10.1182/blood-2007-02-073957
Fan, W., Chang, S., Shan, X., Gao, D., Zhang, S. Q., Zhang, J., et al. (2016). Transcriptional profile of SH-SY5Y human neuroblastoma cells transfected by Toxoplasma rhoptry protein 16. Mol. Med. Rep. 14, 4099–4108. doi: 10.3892/mmr.2016.5758
Gan, Z.-S., Wang, Q.-Q., Li, J.-H., Wang, X.-L., Wang, Y.-Z., Du, H.-H. (2017). Iron reduces M1 macrophage polarization in RAW264.7 macrophages associated with inhibition of STAT1. Mediators Inflammation 2017, 8570818. doi: 10.1155/2017/8570818
Golden, E., Rashwan, R., Woodward, E. A., Sgro, A., Wang, E., Sorolla, A., et al. (2021). The oncogene AAMDC links PI3K-AKT-mTOR signaling with metabolic reprograming in estrogen receptor-positive breast cancer. Nat. Commun. 12, 1920. doi: 10.1038/s41467-021-22101-7
Hu, C., Li, J., Tan, Y., Liu, Y., Bai, C., Gao, J., et al. (2022). Tanreqing Injection Attenuates Macrophage Activation and the Inflammatory Response via the lncRNA-SNHG1/HMGB1 Axis in Lipopolysaccharide-Induced Acute Lung Injury. Front. Immunol. 13, 820718. doi: 10.3389/fimmu.2022.820718
Ivanova, D. L., Fatima, R., Gigley, J. P. (2016). Comparative analysis of conventional natural killer cell responses to acute infection with toxoplasma gondii strains of different virulence. Front. Immunol. 7, 347. doi: 10.3389/fimmu.2016.00347
Ivanova, A. V., Ivanov, S. V., Zhang, X., Ivanov, V. N., Timofeeva, O. A., Lerman, M. I. (2004). STRA13 interacts with STAT3 and modulates transcription of STAT3-dependent targets. J. Mol. Biol. 340, 641–653. doi: 10.1016/j.jmb.2004.05.025
Jiménez-Garcia, L., Herránz, S., Luque, A., Hortelano, S. (2015). Critical role of p38 MAPK in IL-4-induced alternative activation of peritoneal macrophages. Eur. J. Immunol. 45, 273–286. doi: 10.1002/eji.201444806
Jin, Q.-W., Yu, T., Pan, M., Fan, Y.-M., Huang, S.-Y. (2023). ROP16 of Toxoplasma gondii Inhibits Innate Immunity by Triggering cGAS-STING Pathway Inactivity through the Polyubiquitination of STING. Cells 12, 1862. doi: 10.3390/cells12141862
Kong, L., Zhang, Q., Chao, J., Wen, H., Zhang, Y., Chen, H., et al. (2015). Polarization of macrophages induced by Toxoplasma gondii and its impact on abnormal pregnancy in rats. Acta Trop. 143, 1–7. doi: 10.1016/j.actatropica.2014.12.001
Kozlenkov, A., Lapatsina, L., Lewin, G. R., Smith, E. S. J. (2014). Subunit-specific inhibition of acid sensing ion channels by stomatin-like protein 1. J. Physiol. 592, 557–569. doi: 10.1113/jphysiol.2013.258657
Laboute, T., Zucca, S., Holcomb, M., Patil, D. N., Garza, C., Wheatley, B. A., et al. (2023). Orphan receptor GPR158 serves as a metabotropic glycine receptor: mGlyR. Science 379, 1352–1358. doi: 10.1126/science.add7150
Li, Y., Poppoe, F., Chen, J., Yu, L., Deng, F., Luo, Q., et al. (2017). Macrophages polarized by expression of toxoGRA15(II) inhibit growth of hepatic carcinoma. Front. Immunol. 8, 137. doi: 10.3389/fimmu.2017.00137
Li, C., Zhang, W., Fang, T., Li, N., Wang, Y., He, L., et al. (2021). Identification of the prognostic value among suppressor of cytokine signaling family members in kidney renal clear cell carcinoma. Front. Mol. Biosci. 8. doi: 10.3389/fmolb.2021.585000
Li, Z., Zheng, H., Liu, L., Fen, Z., Cao, H., Yang, J., et al. (2022). A novel inflammatory signature for evaluating immune microenvironment status in soft tissue sarcoma. Front. Oncol. 12, 990670. doi: 10.3389/fonc.2022.990670
Mosser, D. M., Edwards, J. P. (2008). Exploring the full spectrum of macrophage activation. Nat. Rev. Immunol. 8, 958–969. doi: 10.1038/nri2448
Murray, P. J. (2011). Macrophages as a battleground for toxoplasma pathogenesis. Cell Host Microbe 9, 445–447. doi: 10.1016/j.chom.2011.05.010
Ow, J. R., Tan, Y. H., Jin, Y., Bahirvani, A. G., Taneja, R. (2014). Stra13 and Sharp-1, the non-grouchy regulators of development and disease. Curr. Top. Dev. Biol. 110, 317–338. doi: 10.1016/B978-0-12-405943-6.00009-9
Pelaia, G., Vatrella, A., Busceti, M. T., Gallelli, L., Preianò, M., Lombardo, N., et al. (2016). Role of biologics in severe eosinophilic asthma - focus on reslizumab. Ther. Clin. Risk Manag 12, 1075–1082. doi: 10.2147/TCRM.S111862
Piaggi, P., Masindova, I., Muller, Y. L., Mercader, J., Wiessner, G. B., Chen, P., et al. (2017). A genome-wide association study using a custom genotyping array identifies variants in GPR158 associated with reduced energy expenditure in American Indians. Diabetes 66, 2284–2295. doi: 10.2337/db16-1565
Shapouri-Moghaddam, A., Mohammadian, S., Vazini, H., Taghadosi, M., Esmaeili, S.-A., Mardani, F., et al. (2018). Macrophage plasticity, polarization, and function in health and disease. J. Cell Physiol. 233, 6425–6440. doi: 10.1002/jcp.v233.9
Sun, H.-C., Huang, J., Fu, Y., Hao, L.-L., Liu, X., Shi, T.-Y. (2021). Enhancing immune responses to a DNA vaccine encoding toxoplasma gondii GRA7 using calcium phosphate nanoparticles as an adjuvant. Front. Cell Infect. Microbiol. 11, 787635. doi: 10.3389/fcimb.2021.787635
Takatsu, K., Nakajima, H. (2008). IL-5 and eosinophilia. Curr. Opin. Immunol. 20, 288–294. doi: 10.1016/j.coi.2008.04.001
Vasileva, A., Hopkins, K. M., Wang, X., Weisbach, M. M., Friedman, R. A., Wolgemuth, D. J., et al. (2013). The DNA damage checkpoint protein RAD9A is essential for male meiosis in the mouse. J. Cell Sci. 126, 3927–3938. doi: 10.1242/jcs.126763
Wang, C., Cheng, W., Yu, Q., Xing, T., Chen, S., Liu, L., et al. (2018). Toxoplasma chinese 1 strain of WH3Δrop16I/III/gra15II genetic background contributes to abnormal pregnant outcomes in murine model. Front. Immunol. 9, 1222. doi: 10.3389/fimmu.2018.01222
Wang, D., Qi, H., Li, A., Deng, F., Xu, Y., Hu, Z., et al. (2020). Coexisting overexpression of STOML1 and STOML2 proteins may be associated with pathology of oral squamous cell carcinoma. Oral. Surg. Oral. Med. Oral. Pathol. Oral. Radiol. 129, 591–599. doi: 10.1016/j.oooo.2020.01.011
Xiao, .R., Li, C., Wang, C., Cao, Y., Zhang, L., Guo, Y., et al. (2019). Adipogenesis associated Mth938 domain containing (AAMDC) protein expression is regulated by alternative polyadenylation and microRNAs. FEBS Lett. 593, 1724–1734. doi: 10.1002/feb2.2019.593.issue-14
Xin, S., Su, R., Jiang, N., Zhang, L., Yang, Y. (2020). Low prevalence of antibodies against toxoplasma gondii in chinese populations. Front. Cell Infect. Microbiol. 10, 302. doi: 10.3389/fcimb.2020.00302
Yamamoto, M., Standley, D. M., Takashima, S., Saiga, H., Okuyama, M., Kayama, H., et al. (2009). A single polymorphic amino acid on Toxoplasma gondii kinase ROP16 determines the direct and strain-specific activation of Stat3. J. Exp. Med. 206, 2747–2760. doi: 10.1084/jem.20091703
Ye, H., Zhou, X., Zhu, B., Xiong, T., Huang, W., He, F., et al. (2024). Toxoplasma gondii suppresses proliferation and migration of breast cancer cells by regulating their transcriptome. Cancer Cell Int. 24, 144. doi: 10.1186/s12935-024-03333-1
Yoo, K.-C., Kang, J.-H., Choi, M.-Y., Suh, Y., Zhao, Y., Kim, M.-J., et al. (2022). Soluble ICAM-1 a pivotal communicator between tumors and macrophages, promotes mesenchymal shift of glioblastoma. Adv. Sci. (Weinh). 9, e2102768. doi: 10.1002/advs.202102768
Keywords: Toxoplasma gondii, ROP16, RNA-seq, THP-1, macrophage
Citation: Yang N, Li M, Yang H, Li J, Dang T, Li G and Zhao Z (2025) Transcriptional profiles analysis of effects of Toxoplasma gondii rhoptry protein 16 on THP-1 macrophages. Front. Cell. Infect. Microbiol. 14:1436712. doi: 10.3389/fcimb.2024.1436712
Received: 26 May 2024; Accepted: 30 December 2024;
Published: 28 January 2025.
Edited by:
Ana Claudia Torrecilhas, Federal University of São Paulo, BrazilReviewed by:
Shuai Wang, Xinxiang Medical University, ChinaCopyright © 2025 Yang, Li, Yang, Li, Dang, Li and Zhao. This is an open-access article distributed under the terms of the Creative Commons Attribution License (CC BY). The use, distribution or reproduction in other forums is permitted, provided the original author(s) and the copyright owner(s) are credited and that the original publication in this journal is cited, in accordance with accepted academic practice. No use, distribution or reproduction is permitted which does not comply with these terms.
*Correspondence: Zhijun Zhao, ejE1ODE1ekAxNjMuY29t
Disclaimer: All claims expressed in this article are solely those of the authors and do not necessarily represent those of their affiliated organizations, or those of the publisher, the editors and the reviewers. Any product that may be evaluated in this article or claim that may be made by its manufacturer is not guaranteed or endorsed by the publisher.
Research integrity at Frontiers
Learn more about the work of our research integrity team to safeguard the quality of each article we publish.