
94% of researchers rate our articles as excellent or good
Learn more about the work of our research integrity team to safeguard the quality of each article we publish.
Find out more
ORIGINAL RESEARCH article
Front. Cell. Infect. Microbiol., 26 January 2023
Sec. Bacteria and Host
Volume 12 - 2022 | https://doi.org/10.3389/fcimb.2022.957512
This article is part of the Research TopicMycobacterial Dormancy, Culturability, and Resuscitation: State-of-the-art, Challenges, and Future ProspectsView all 10 articles
 Arpana Verma1Maninder Kaur1
 Princy Luthra1Lakshyaveer Singh2Divya Aggarwal3
 Indu Verma1
 Bishan D. Radotra3
 Sanjay Kumar Bhadada4
 Sadhna Sharma1*
Introduction: Diabetes is a potent risk factor for the activation of latent tuberculosis and worsens the tuberculosis (TB) treatment outcome. The major reason for mortality and morbidity in diabetic patients is due to their increased susceptibility to TB. Thus, the study was conducted to understand the crosstalk between M. tuberculosis and its host upon latent tuberculosis infection and under hyperglycemic conditions or diabetes.
Methods: An animal model was employed to study the relationship between latent tuberculosis and diabetes. BCG immunization was done in mice before infection with M. tuberculosis, and latency was confirmed by bacillary load, histopathological changes in the lungs and gene expression of hspX, tgs1, tgs3 and tgs5. Diabetes was then induced by a single high dose of streptozotocin (150 mg/kg body weight). Host factors, like various cytokines and MMPs (Matrix metalloproteinases), which play an important role in the containment of mycobacterial infection were studied in vivo and in vitro.
Results: A murine model of latent TB was developed, which was confirmed by CFU counts (<104 in the lungs and spleen) and granuloma formation in lungs in the latent TB group. Also, the gene expression of hspX, tgs1, and tgs5 was upregulated, and after diabetes induction, blood glucose levels were >200 mg/dl. An in vitro study employing a THP-1 macrophage model of latent and active tuberculosis under normal and high glucose conditions showed that dormant bacilli were better contained in the presence of 5.5 mM glucose concentration as compared with active bacilli. However, the killing and restriction efficiency of macrophages decreased, and CFU counts increased significantly with an increase in glucose concentration.
Discussion: The decreased levels of MCP-1, decreased expression of mmp-9, and increased expression of mmp-1 in the latent group at high glucose concentrations could explain the failure of granuloma formation at high glucose conditions.
Diabetic patients are twice as vulnerable to M. tuberculosis infection compared to non-diabetics, and diabetes also increases the risk of premature death in tuberculosis patients (Faurholt-Jepsen et al., 2013). There is a two-way association between tuberculosis and diabetes. Although diabetes is a potent risk factor for TB and affects treatment outcomes (Baker et al., 2011), tuberculosis, on the other hand, influences glycemic control in diabetic patients as well (Fisher-Hoch et al., 2013). At present, the mechanisms behind the association between tuberculosis and diabetes are not completely known. Compromised immunological condition plays a crucial role in the susceptibility to the tuberculosis. As diabetes is a pandemic, it is now among the well-known causes for an immune compromised state, which facilitates TB development along with HIV, aging, malnutrition, and smoking (Fox and Menzies, 2013; Rieder, 2014). In diabetes, the immunity of the host against M. tuberculosis is “dysfunctional” to be precise instead of “compromised” as in the case of other risk factors with exaggerated or delayed immune responses against M. tuberculosis, which renders the host susceptible for activation of latent tuberculosis.
Monocytes play a crucial role in tuberculosis by migrating to the lungs in response to M. tuberculosis exposure and differentiating into macrophages and dendritic cells that act as antigen-presenting cells and release cytokines. Chronic hyperglycemia alters the expression of various chemokines and cytokines, causes phagocytic dysfunction in monocytes, and inhibits the complement system, thereby affecting the immune system directly (Stegenga et al., 2008; Hair et al., 2012; Restrepo et al., 2014). The immune susceptibility of diabetics to TB is not clearly understood. Increased TB susceptibility in diabetes patients can be attributed to multiple factors, with direct effects linked to insulin resistance and hyperglycemia, whereas indirect effects have been linked to lymphocyte and macrophage function (Dooley and Chaisson, 2009; Restrepo and Schlesinger, 2013; Martinez and Kornfeld, 2014). Compromised immunity in diabetic patients, which either reactivates latent tuberculosis or promotes primary infection of tuberculosis, could be a possible explanation for overall impaired immunity (Ponce-de-Leon et al., 2004).
MMPs are tightly regulated by various growth factors, hormones, cytokines and are also controlled by tissue inhibitors of MMPs (TIMPs) and endogenous MMP inhibitors (MMPIs). Cytokines modulate MMPs production at the gene level via negative or positive regulatory elements (Woessner, 1991), and may affect the proteolytic enzymes production that inhibit or activate MMPs (Ries and Petrides, 1995; Galboiz et al., 2002). Thus, during M. tuberculosis infection, where cytokine levels are upscaled, the activity and regulation of MMPs is expected to be controlled by cytokines. MMPs intercede in the immunological response toward infectious pathogens (Turner et al., 2001; Lee et al., 2005). MMPs, particularly MMP-9, have been reported to be expressed during various types of tuberculosis, including meningitis (Matsuura et al., 2000; Price et al., 2001; Thwaites et al., 2003; Lee et al., 2004), active cavitary tuberculosis (Chang et al., 1996; Price et al., 2001; Hrabec et al., 2002), and pleuritis (Hoheisel et al., 2001; Hrabec et al., 2002; Jin et al., 2004). Inhibition of MMP-9 along with the TB treatment has shown increased bacillary clearance and inhibited inflammation in tuberculosis meningitis (Majeed et al., 2016). Thus, the emerging data suggest an important role of MMPs in tuberculosis and its various associated pathological states. Extracellular matrix (ECM) plays a vital role in the structural composition of granuloma in terms of leucocyte trafficking in and out of this dynamic environment (Rhoades, 1997; Gonzalez-Juarrero et al., 2001), but the underlying events during this structural reorganization to establish a stable granuloma or advancement toward a pathological lesion as the granuloma dissolves are unfolding slowly. Interestingly, MMPs are the key factors involved in both the granuloma creation and lung tissue destruction (Salgame, 2011). So, the present study was focused on understanding the crosstalk between M. tuberculosis and host upon latent TB infection under hyperglycemic conditions/diabetes with respect to various cytokines and MMPs involved in granuloma formation in TB diabetes copathogenesis.
All animal procedures were performed in the Bio-Safety Level-III (BSL-III) facility at the International Centre for Genetic Engineering and Biotechnology (ICGEB), New Delhi. Animal procedures were approved by the Institutional Animal Ethical Committee with ref. no. 89/90/IAEC/616 and also by the Animal Ethical Committee of the ICGEB, New Delhi, with ref. no. ICGEB/IAEC/02042019/TACF-PGIMER-16 (Verma et al., 2021).
M. tuberculosis H37Rv (NCTC-7416), originally procured from the national collection of type culture in London, UK, was cultured in Soutan’s media containing 2% glycerol and 0.05% Tween 80 under shaking conditions at 200 rpm. Logarithmically growing cultures were enumerated by comparing with McFarland standards and stored at −80°C till further use.
The mouse model of latent tuberculosis was developed by infecting 5 to 6-week-old Balb/c mice with BCG through aerosolization at 0.5 O.D. (600 nm), and after six weeks, M. tuberculosis H37Rv infection was given at 1.1 O.D. (600 nm). Latency was confirmed by CFU counts after 4 and 6 weeks of infection with M. tuberculosis. Six weeks post infection with M. tuberculosis, latently infected animals were divided into three groups, i.e., Group-I: latent tuberculosis only (n = 24), Group-II: latent tuberculosis with diabetes (n = 24), and Group-III: latent tuberculosis with immunosuppression (n = 24). Group-I animals were kept untreated. Group-II animals were induced with diabetes by a single dose of streptozotocin (150 mg/kg body weight), and Group-III animals were induced with immunosuppression by dexamethasone (Ahmad et al., 2006). Animals were sacrificed at weeks 9 and 13 of diabetes induction.
Aseptically removed lungs and spleen were transferred to 10% buffered formalin and further processed for paraffin embedding and sectioning (Ramos-Vara, 2011). Paraffin sections were deparaffinized and stained with the standard hematoxylin and eosin (H&E) and the acid-fast bacilli (AFB) stain.
The human leukemic monocytic cell line THP-1 was obtained from the cell repository at the National Centre for Cell Science (NCCS) Pune, India, and was routinely maintained as suspended cells in RPMI 1640 media, supplemented with 10% fetal bovine serum, 2 mM glutamine, and 100 μg/ml of an antibiotic–antimycotic cocktail from Sigma (penicillin, streptomycin, and gentamycin) at 37°C and 5% CO2 in a humidified incubator. Cells were grown to a density of 2–5 × 10⁶ cells/ml in 25 cm2 flat-bottom tissue culture flasks and passaged every third day.
An in vitro nutritional starvation model of latent tuberculosis was developed according to the method described by Betts et al. (2002). Briefly, M. tuberculosis H37Rv was cultured and grown in nutrition-rich media, i.e., Soutan’s media containing 2% glycerol and 0.05% Tween 80, under constant shaking conditions at 200 rpm for 7 days. After 7 days, the culture was centrifuged at 5,000×g for 10–15 min, and the bacterial pellet was washed and transferred to PBS containing 0.05% Tween 80 (PBST) for 6 weeks under shaking conditions at 200 rpm in an incubator shaker. After 6 weeks of incubation, it was used as a latent TB culture and stored at −80°C until further use.
For infection experiments, 3 × 10⁵ THP-1 cells/well were plated in complete RPMI-1640 media containing 5% FBS and different glucose concentrations, i.e., 5.5 mM (normoglycemic condition), 15 mM, and 25 mM (hyperglycemic condition). D-mannitol was used as an osmotic control at the same molar concentrations. Approximately 20 ng/ml of phorbol myristate acetate (MP Biomedicals, USA) was added to the media for 24 h for differentiation of monocytes to macrophages. After 24 h, cell monolayers were then covered with fresh RPMI media containing no antibiotics and respective glucose concentrations, supplemented with 2% FBS, and incubated at 37°C and 5% CO2 for 24 h. After 48 h of cell plating, cells were divided into three groups, i.e., an uninfected group, an active TB group, and a latent TB group. Active M. tuberculosis culture was used to infect cells of the active TB group, whereas dormant M. tuberculosis culture was used to infect THP-1 cells of the latent TB group at a multiplicity of infection (MOI) of 1:5 (5 bacteria/1 cell) for 3 h (Iona et al., 2012). After 3 h, cells were washed twice with warm RPMI 1640 and replenished with complete RPMI 1640 medium containing different glucose concentrations and amikacin (50 μg/ml) to prevent extracellular replication of mycobacteria.
Lungs and spleen were aseptically removed and homogenized in phosphate buffer saline (PBS) and plated on Middlebrook 7H11 agar (Becton-Dickinson, USA) containing 10% oleic acid-albumin-dextrose-catalase (OADC) (Difco-Becton Dickinson, USA). For the latent group, where BCG was given to animals prior to M. tuberculosis infection, 4 mg/ml of 2-thiophenecarboxylic acid hydrazide (TCH) (Sigma Aldrich) was added to 7H11 agar media to select for M. tuberculosis (Lecoeur et al., 1989). The latently and actively infected THP-1 cells grown under the above-mentioned glucose concentrations were lysed in 0.1% Triton X-100 for 5 min at different time points, i.e., 0 day, 1 day, 3 day, and 6 day of infection. Lysates were plated on Middlebrook 7H11 agar plates supplemented with 10% OADC in triplicate. Plates were incubated at 37°C in a 5% CO2 environment, and CFU counts were determined after 28 days of incubation.
The uninfected, latently, and actively infected THP-1 cells grown under different glucose concentrations were washed with FBS-free RPMI media and treated with a Trypsin-EDTA solution. After centrifugation at 1,600×g for 3 min, the cell pellet was resuspended in TRIzol. For gene expression studies in animals, lung tissue was directly transferred to 2–3 ml of TRIzol, depending on the size of the tissue. RNA was then isolated with the standard phenol–chloroform method (Adilakshmi et al., 2006). For quantitative real-time polymerase chain reaction (qRT-PCR), RNA (500 ng) was reverse transcribed using the Revert Aid First Strand cDNA Synthesis Kit (Thermo Scientific, USA). qRT-PCR amplification was done using SYBR® Green chemistry on Roche LightCycler® 96 Real-Time PCR Systems. The sequence of primers used for the amplification of different genes is given in Table 1.
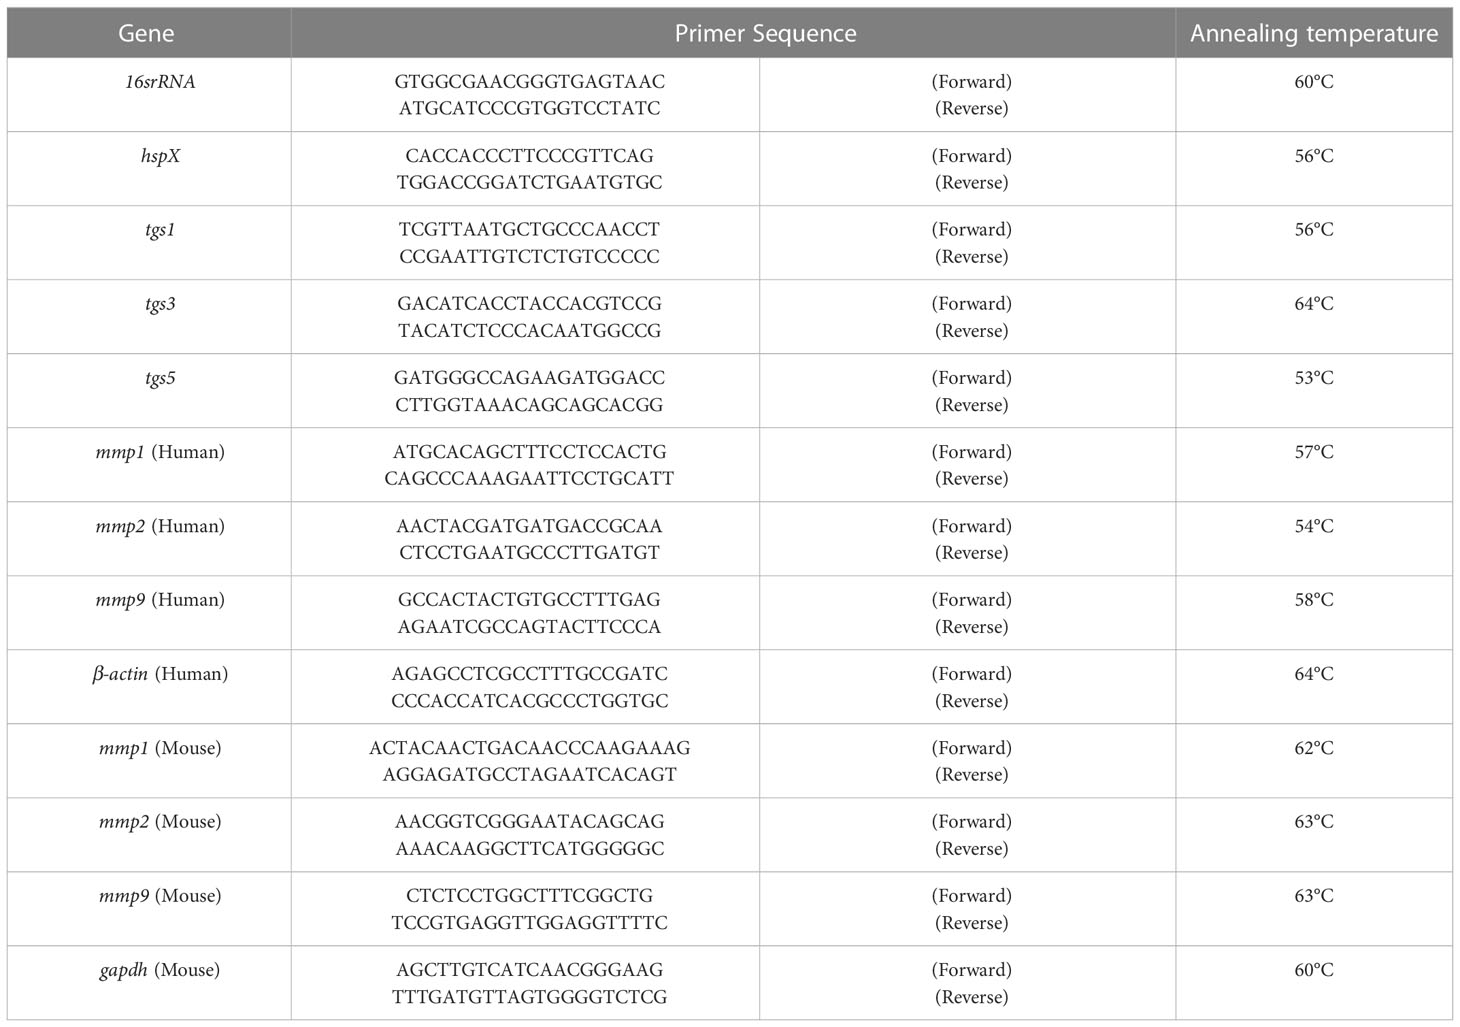
Table 1 Primer sequence for various genes.
Cytokines were determined in THP-1 culture supernatants by using the Cytometric Bead Array (CBA) Human Soluble Protein Master Buffer Kit (Becton Dickinson, USA) and in mouse serum by using the CBA Mouse Th1/Th2/Th17 cytokine kit. In the serum and culture supernatants, protein inhibitor cocktail (Sigma Aldrich, USA) was added and stored at −80°C. The cytokine assay was performed according to the manufacturer’s protocol.
Matrix metalloproteinases were determined in the serum of mice using ELISA kits from ImmunoTag, USA. Protein inhibitor cocktail (PIC) (Sigma Aldrich, USA) was added to the serum and stored at −80°C. The assay was performed according to the manufacturer’s protocol.
The level of significance was determined by the Mann–Whitney test and the Kruskal–Wallis test using the GraphPad Prism package, version 8.0 (GraphPad Software, San Diego, USA) (Verma et al., 2021).
Mice were infected with BCG through aerosol, and one day after immunization, the mean CFU counts of BCG in the lungs were found to be 1.92 ± 0.04 log10 (data not shown). After six weeks, the mean M. tuberculosis CFU counts after 1 day of infection were 1.84 ± 0.03 log10 (data not shown). Four weeks after challenge, the mean M. tuberculosis CFU counts in the lungs and spleen of the latent TB group were found to be significantly decreased as compared to the active TB group (Figures 1A, B). Similarly, after 6 weeks of infection, the mean CFU counts in the lungs and spleen were significantly lower in the latent TB group as compared to the active TB group (Figures 1C, D). Further, the mean CFU count of the lungs and spleen after 8 weeks of infection in the latent TB group were 3.79 ± 0.034 log10 and 3.02 ± 0.04 log10, respectively (Figure 1E). The CFU counts of the latent TB group after 4 and 6 weeks post-infection with M. tuberculosis confirmed the establishment of latent tuberculosis. The latent infection was sustained up to week 8 post-infection, as well, a stable CFU count was observed in the lungs and spleen of latent TB group animals.
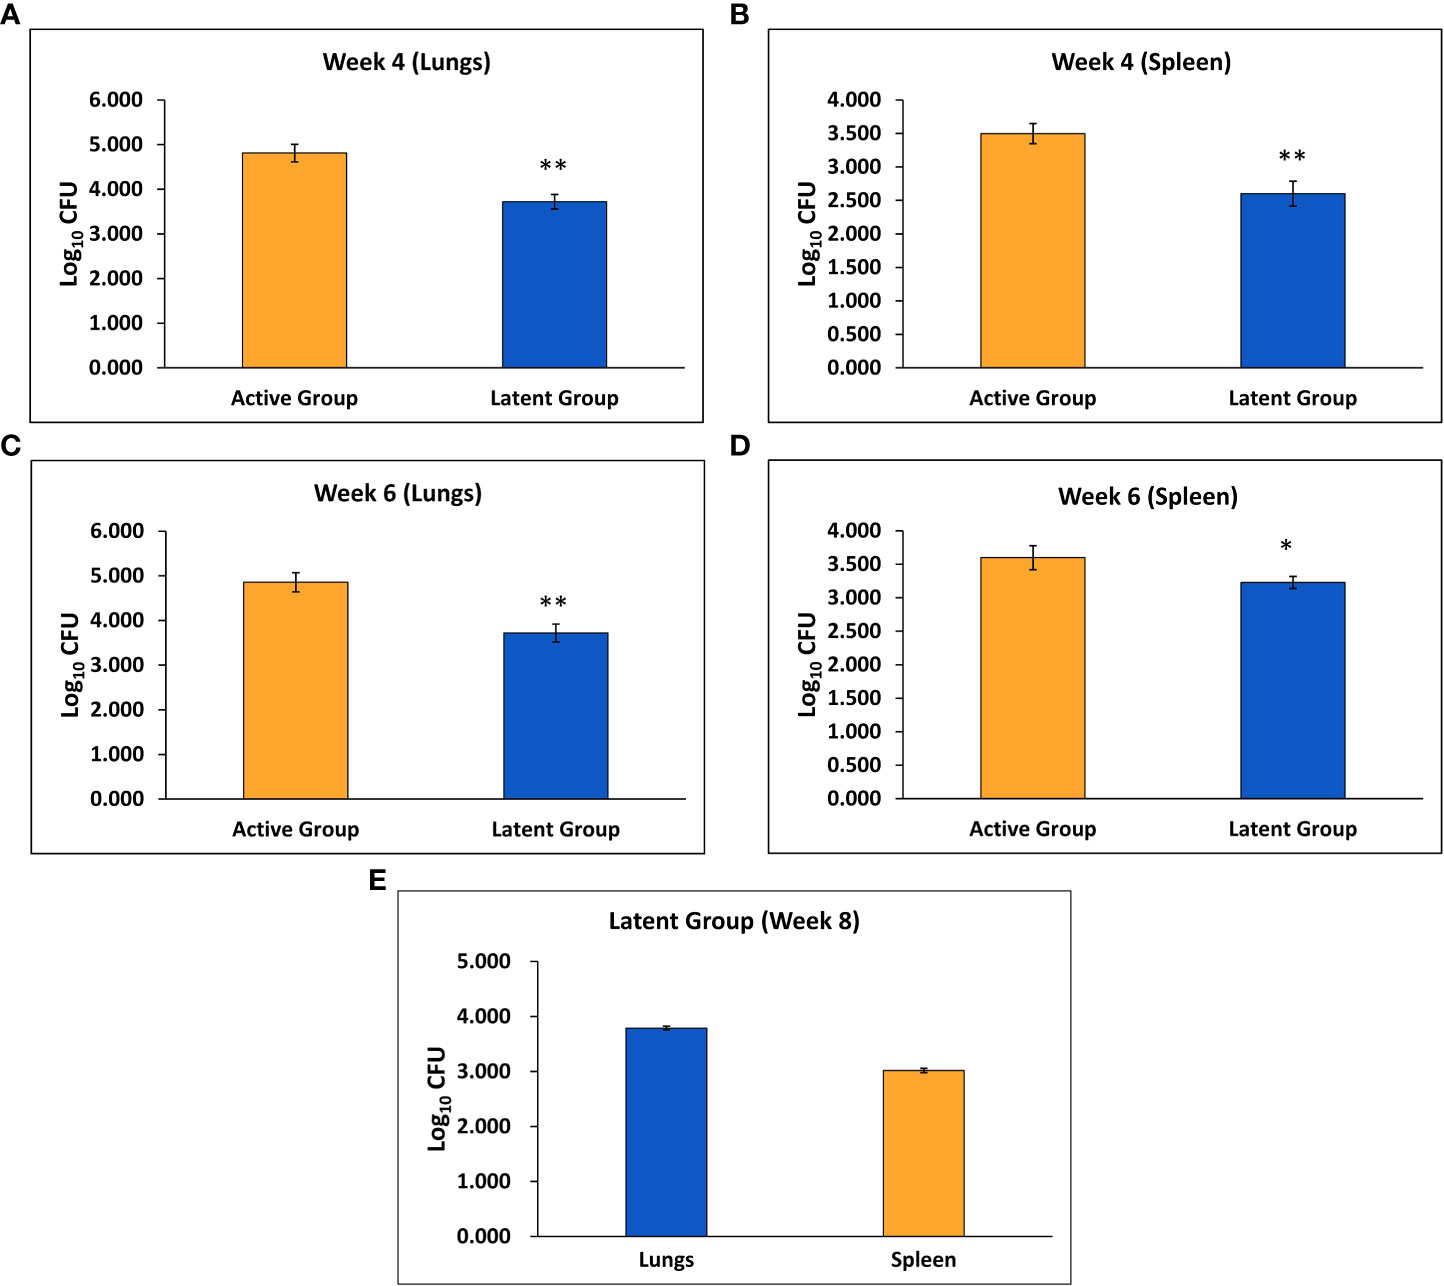
Figure 1 Log10 CFU counts of M. tuberculosis H37Rv in the active TB and latent TB groups. (A) After 4 weeks of infection in the lungs. (B) After 4 weeks of infection in the spleen. (C) After 6 weeks of infection in the lungs. (D) After 6 weeks of infection in the spleen. (E) After 8 weeks of infection in the lungs and spleen of the latent group. Values are Mean ± SE of five animals from each group. *p ≤0.05, **p ≤0.01 as compared to the active group.
After 4 and 6 weeks of infection, peri-bronchial and peri-vascular inflammation was observed in the lungs of animals from the active TB group (Figures 2A, C) whereas in the latent TB group, the lungs were presented with parenchymal inflammation and inflammatory cell collection in air spaces. Also, histiocytic collection leading to the formation of sparse granulomas was observed after 4 weeks of infection in the latent TB group (Figure 2B). After 6 weeks of infection, collection of inflammatory cells at the pleural surface in the air spaces of the lungs was observed and ill-formed granulomas were observed in the latent TB group (Figure 2D). Lung tissues of animals from the latent TB group after 8 weeks of infection also displayed lymphoid and histiocytic collections, which indicated the formation of ill-formed granulomas (Figure 2E).
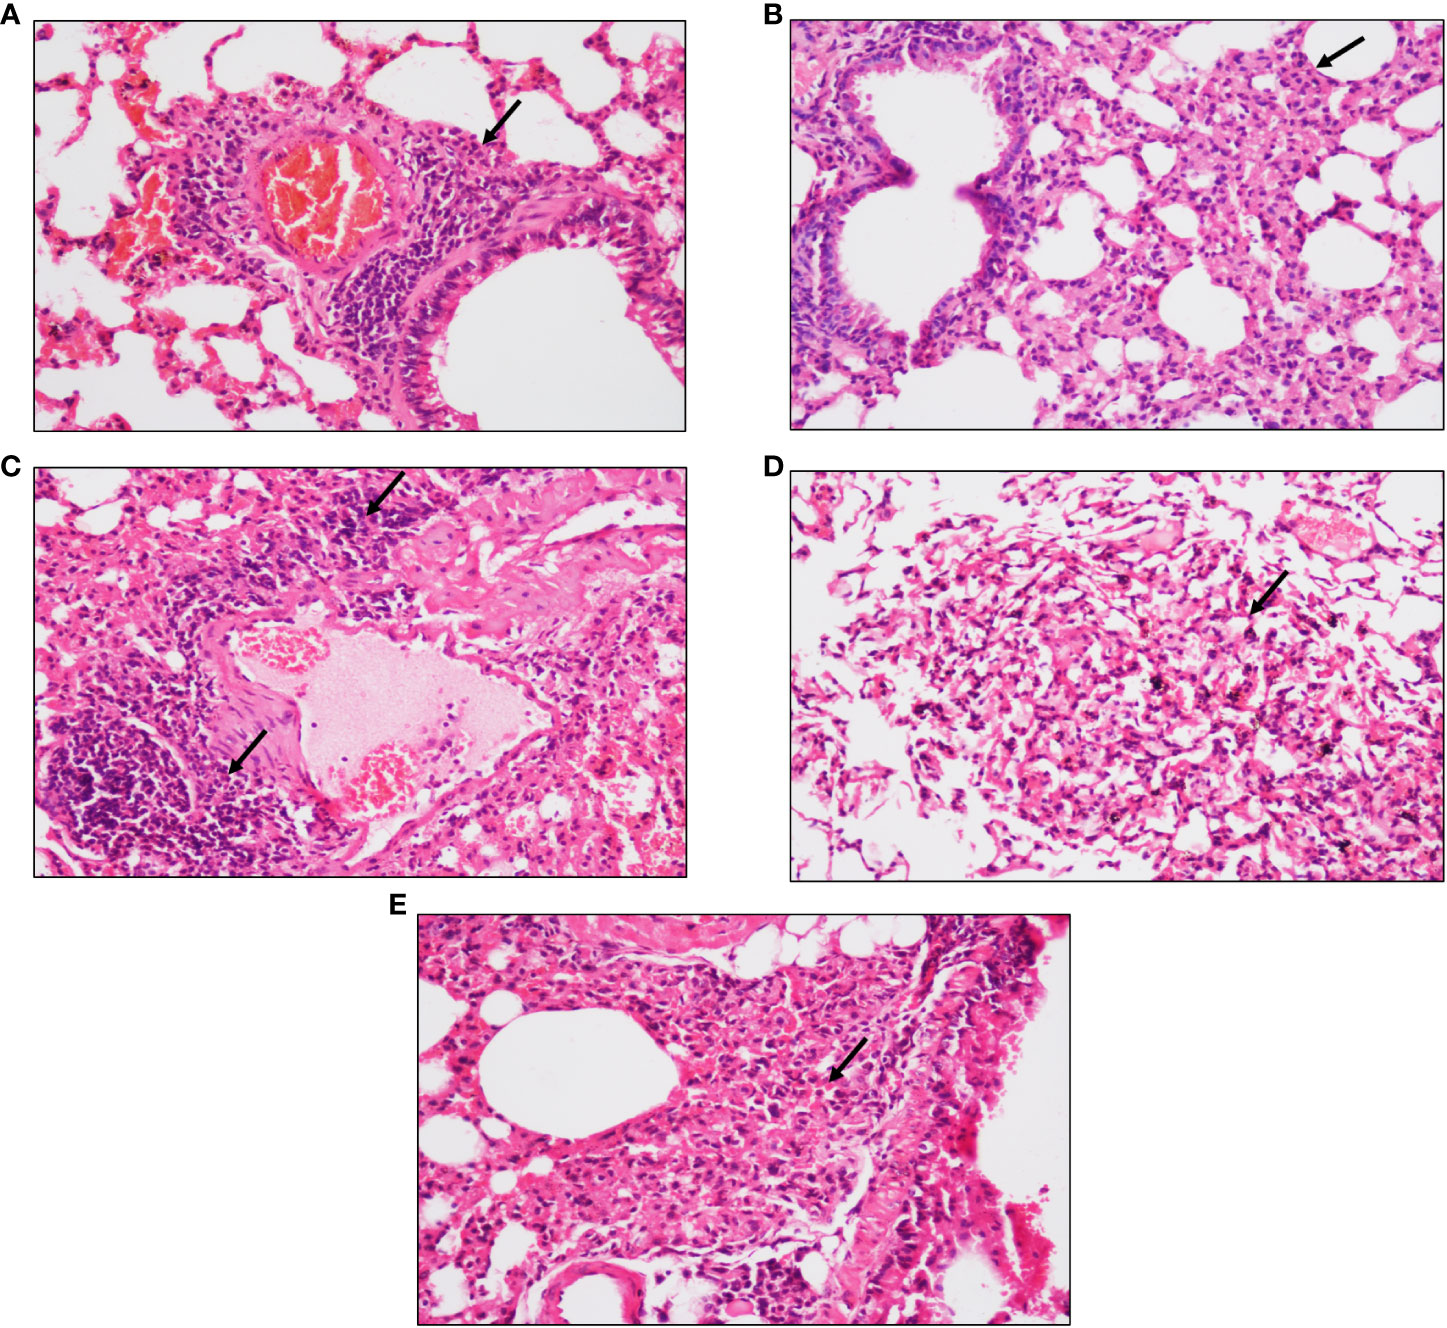
Figure 2 Representative images of hematoxylin and eosin staining of lung tissue of mice after 4, 6, and 8 weeks of infection with M. tuberculosis at ×20 magnification. (A) Section of the active TB group mice after 4 weeks. (B) Section of the latent TB group mice after 4 weeks. (C) Section of the active TB group mice after 6 weeks. (D) Section of the latent TB group mice after 6 weeks. (E) Section of the latent TB group mice after 8 weeks. Arrows indicate granulomas in the latent group and inflammation in the active group.
The expression of various latency-associated genes of M. tuberculosis was studied, including hspX, tgs1, tgs3, and tgs5. The gene expression of the tgs1 and tgs5 was found to be 3.8-fold and 2.6-fold upregulated, respectively, in the latent TB group as compared to the active TB group, and no significant change was observed in the expression of the hspX gene after 4 weeks of infection (Figures 3A–C). However, the expression of the hspX was found to be approximately 3.5-fold upregulated, and an approximately 1.4-fold increase in the expression of the tgs5 was observed in the latent TB group as compared to the active TB group after 6 weeks of M. tuberculosis infection (Figures 3D, F), signifying the development of latency in the latent TB group. Also, the expression of tgs1 was found to be increased non-significantly in latent TB group as compared to active TB group at week 6 (Figure 3E). No significant change was observed in the expression of tgs3 after 4 and 6 weeks of infection between the latent and active TB groups (data not shown).
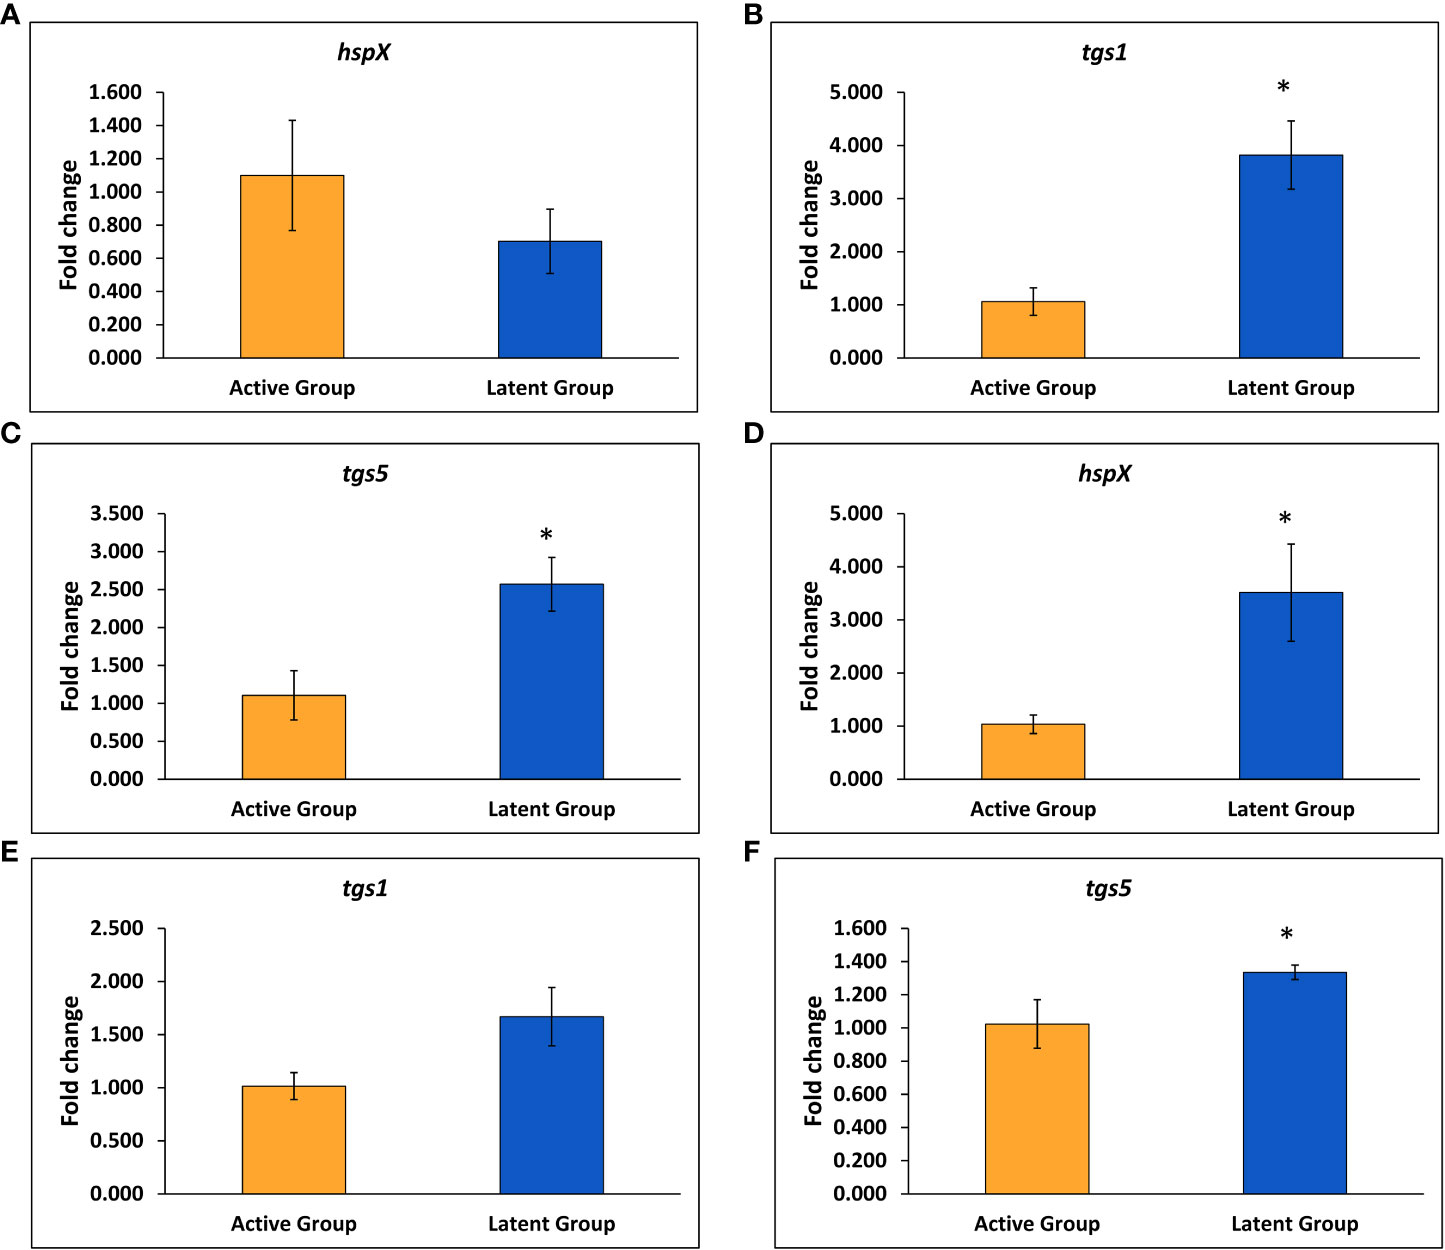
Figure 3 Expression of various genes in the latent TB group and active TB group. (A) hspX after 4 weeks. (B) tgs1 after 4 weeks. (C) tgs5 after 4 weeks. (D) hspX after 6 weeks. (E) tgs1 after 6 weeks. (F) tgs5 after 6 weeks. Values are Mean ± SE of three animals from each group. *p ≤0.05 as compared to the active TB and latent TB groups. 16srRNA was used as constitutive gene.
Initially we tried to establish diabetes in latently infected mice with multiple low doses of streptozotocin and blood glucose levels were measured. However, diabetes in latently infected animals could not be established as blood glucose levels were found to be below 200 mg/dl until week 7 of their streptozotocin treatment at this dose (Figure 4). Thus, another single high dose of streptozotocin was given to these animals at week 7 of first streptozotocin treatment, and diabetes was found to have been successfully established in the latent TB group animals at week 8 as blood glucose levels were found to be greater than 200 mg/dl (Figure 4). Also, the pancreatic tissues of animals with latent TB and diabetes showed inflammation at weeks 9 (two weeks after diabetes development) and 13 (six weeks after diabetes development). The islets of Langerhans were densely inflamed, and loss of cellularity, necrosis, and admixture of cells were observed (Supplementary Figures 1B, D).
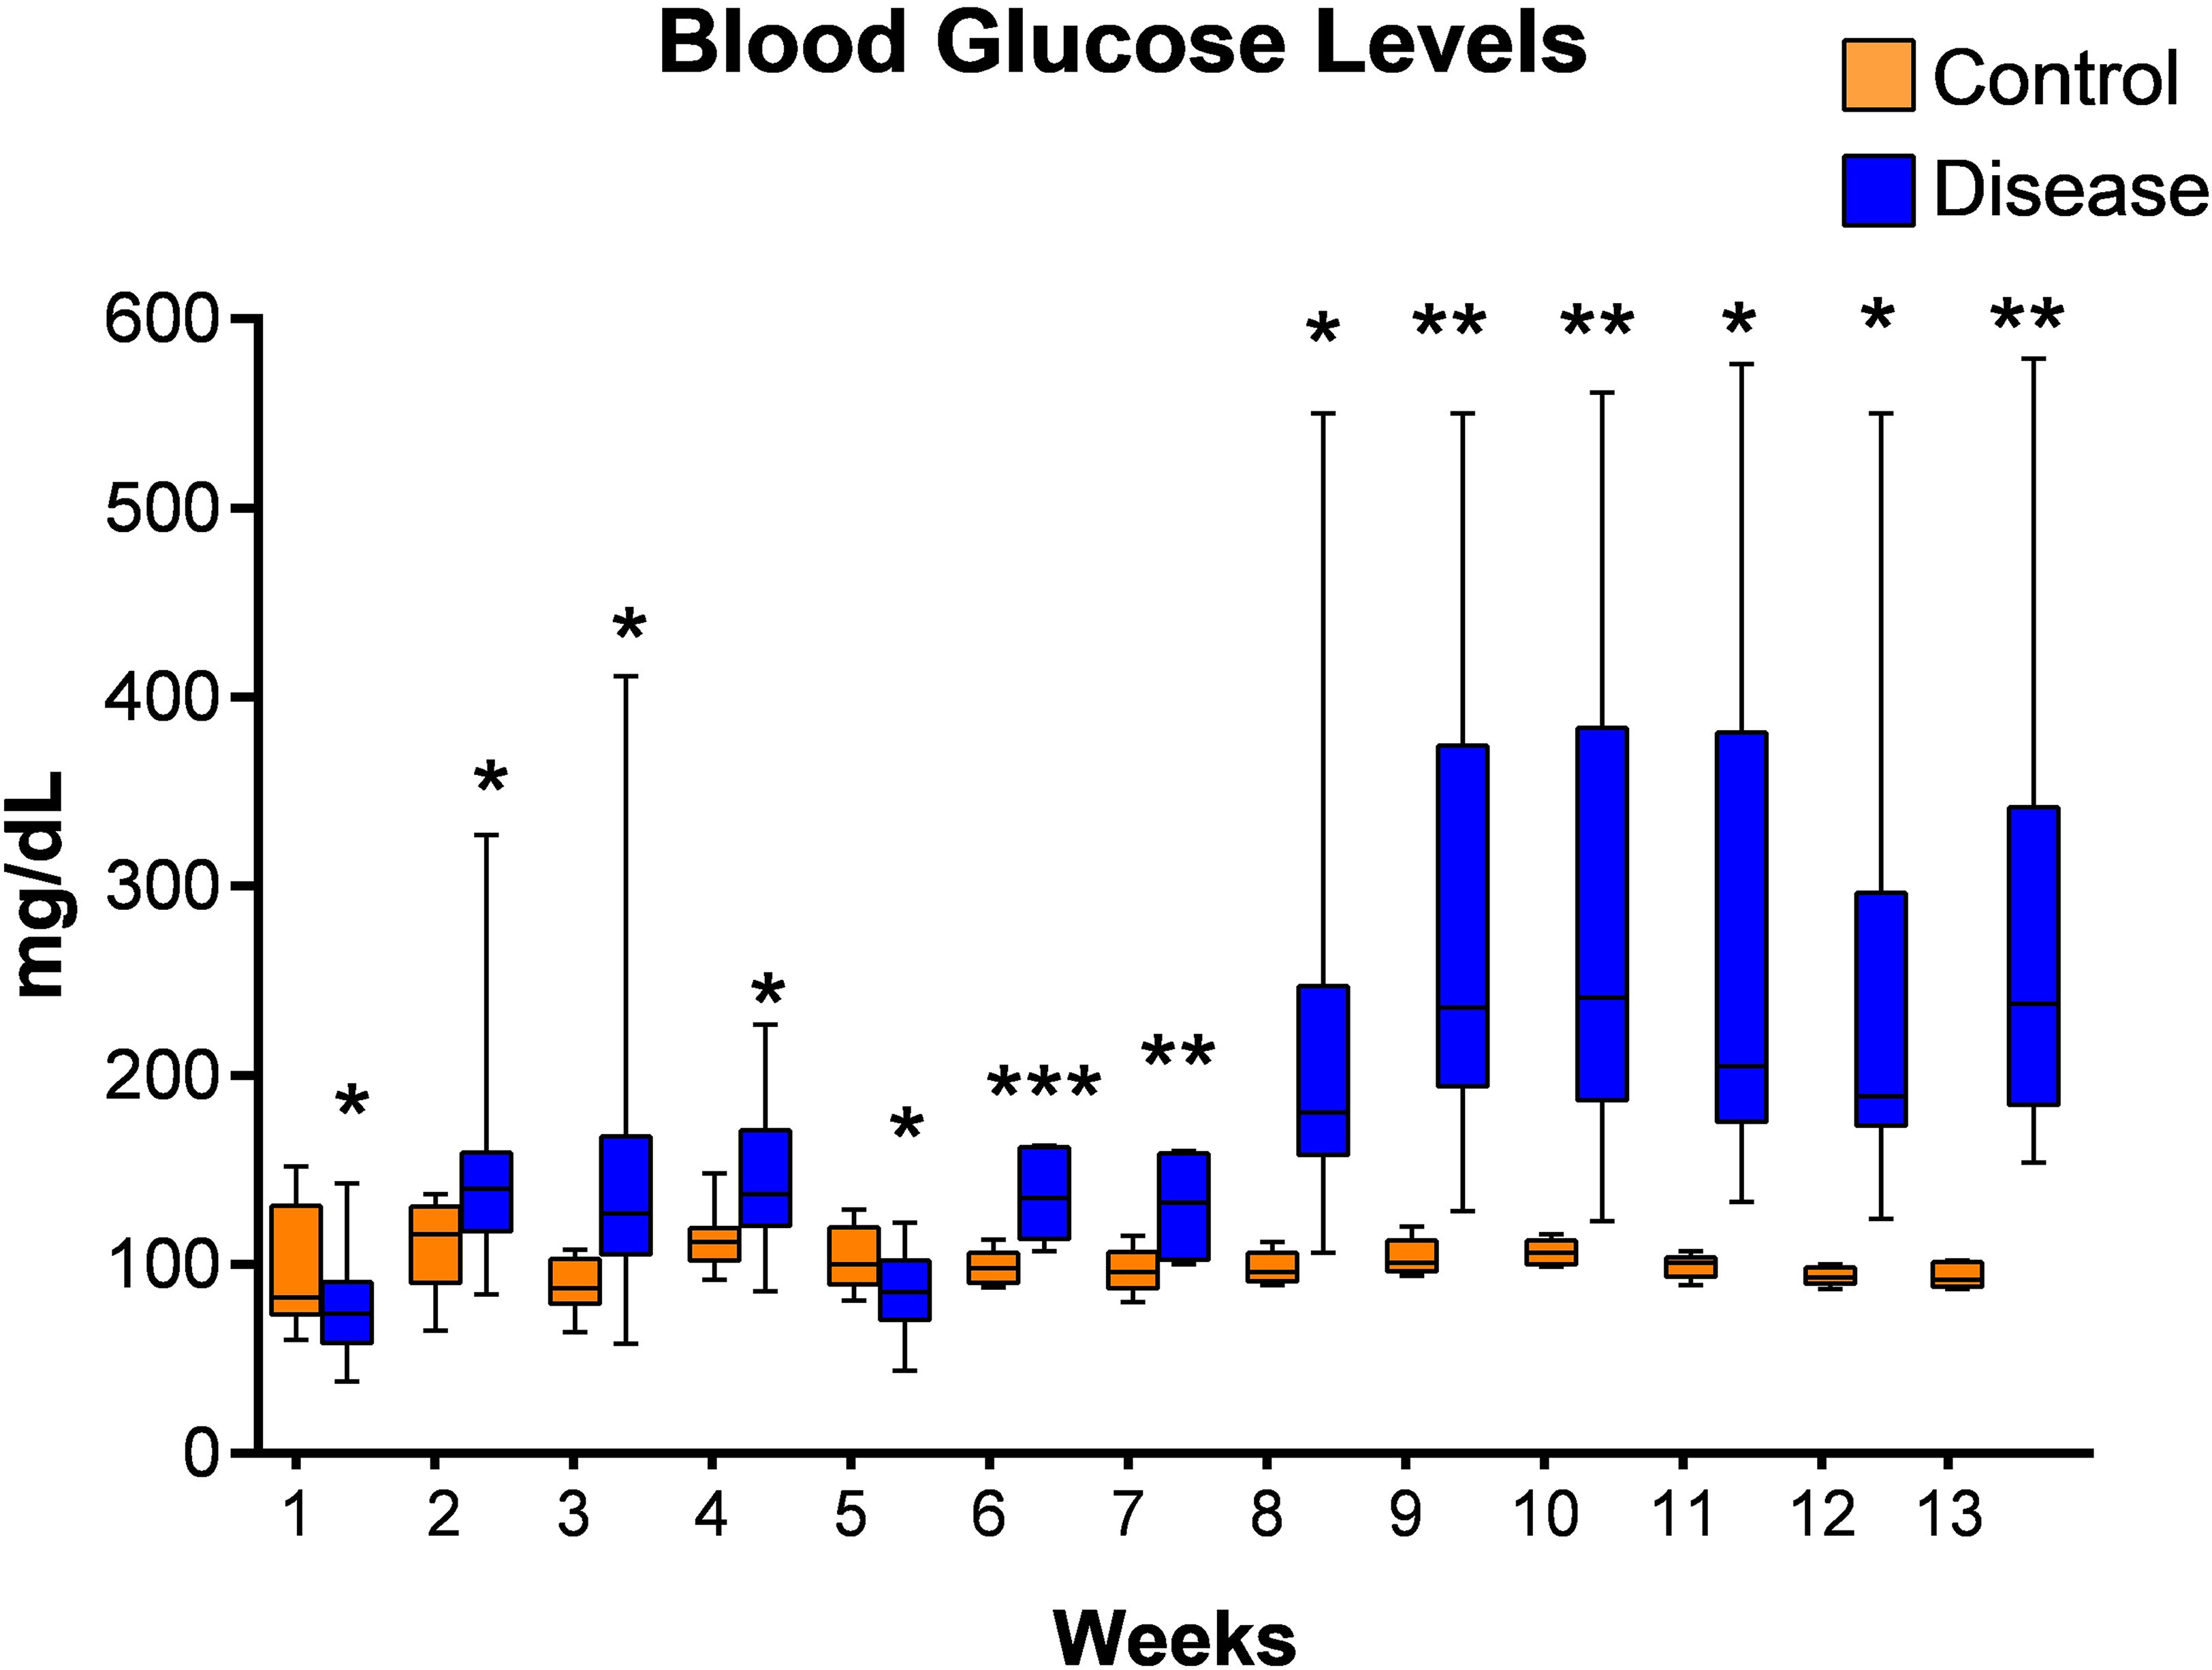
Figure 4 Blood glucose levels of mice from latent tuberculosis with diabetes group after streptozotocin treatment. Values are Mean ± SE of 24 animals until week 6, and 8–22 animals from week 7 until week 13. *p ≤0.05, **p ≤0.01, ***p ≤0.001 as compared to the control group. Blue bars indicate the streptozotocin treated group (latent tuberculosis with diabetes) and orange bars indicate the control group (healthy group without TB infection or diabetes).
After the establishment of diabetes in latently infected mice, the animals were divided into three groups, i.e., Group-I (latent tuberculosis only), Group-II (latent tuberculosis with diabetes), and Group-III (latent tuberculosis with immunosuppression). Two weeks after the development of diabetes, i.e., week 9, the expression of the mmp-1 was found to be significantly downregulated in Group-II as compared to Group-I, and no significant change in expression was observed in Group-III (Supplementary Figure 2A). Also, no significant change was observed in the gene expression of mmp-2 and mmp-9 in Groups-II and -III as compared to Group-I (data not shown). After six weeks of diabetes development, i.e., at week 13, an increase was observed in the expression of mmp-1 in Group-II as compared to Group-I, but the increase was not significant (Supplementary Figure 2B). Moreover, no significant change was observed in the expression of mmp-2 and mmp-9 genes in Groups-I, -II, and -III respectively (data not shown). Thus, an increase in expression of mmp-1 was observed in the diabetes group co-infected with latent tuberculosis, although the increase was non-significant. The levels of MMP-1, MMP-2, and MMP-9 were also measured in the serum of animals. At week 9, no significant change in the levels of MMP-1, MMP-2, and MMP-9 was observed between Groups-I, -II, and -III (data not shown). At week 13, the levels of MMP-1 were found to be significantly higher in Group-III in comparison to Groups-I and -II. The levels of MMP-1 and MMP-2 were significantly reduced in Group-II as compared to Group-I (Supplementary Figures 2C, D). The levels of MMP-9 were found to be the same between Group-I and Group-II. In Group-III, the levels of MMP-9 were significantly raised as compared to Group-II (Supplementary Figure 2E).
At week 9, the levels of TNF-α were higher in Group-I, but the increase was not significant. The levels of IL-10, IFN-γ, IL-4, and IL-17 were found to be significantly increased in Group-III as compared to the control group, Group-I, and Group-II, but no change was found in the levels between Group-I and Group-II (data not shown). The levels of IL-6 were found to be significantly reduced in Group-II as compared to Group-I (Supplementary Figure 3A). No significant change was observed in the levels of IL-2 and TNF-α in any group (data not shown). At week 13, no significant change was observed in the levels of IL-10, TNF-α, IFN-γ, and IL-17 in any group (data not shown). A significant decrease was observed in the levels of IL-2 and IL-6 in Group-III as compared to the control group, Group-I, and Group-II (Supplementary Figures 3B, C). The levels of IL-4 were found to be significantly higher in Group-III as compared to Group-I, but no change was observed in the levels between the other groups (Supplementary Figure 3D).
In THP-1 cells infected with active and latent cultures of M. tuberculosis H37Rv, the mean CFU counts were found to be significantly increased in the active as well as the latent group in the presence of 25 mM glucose concentration as compared to 5.5 mM and 15 mM glucose concentration on day 0 and day 1 (Figures 5A, B). On day 3, the mean CFU counts in the active group at 25 mM glucose were significantly increased as compared to 5.5 mM glucose, whereas in the latent group, the mean CFU counts were significantly increased in the presence of 15 mM and 25 mM glucose concentration as compared to 5.5 mM glucose concentration (Figure 5C). Similarly, on day 6 also the mean CFU counts in the active and latent groups were significantly increased with an increase in glucose concentration (Figure 5D). The CFU data indicated that as the glucose concentration is increased, the bacterial clearing capacity of macrophages is decreased in both active and latent infection.
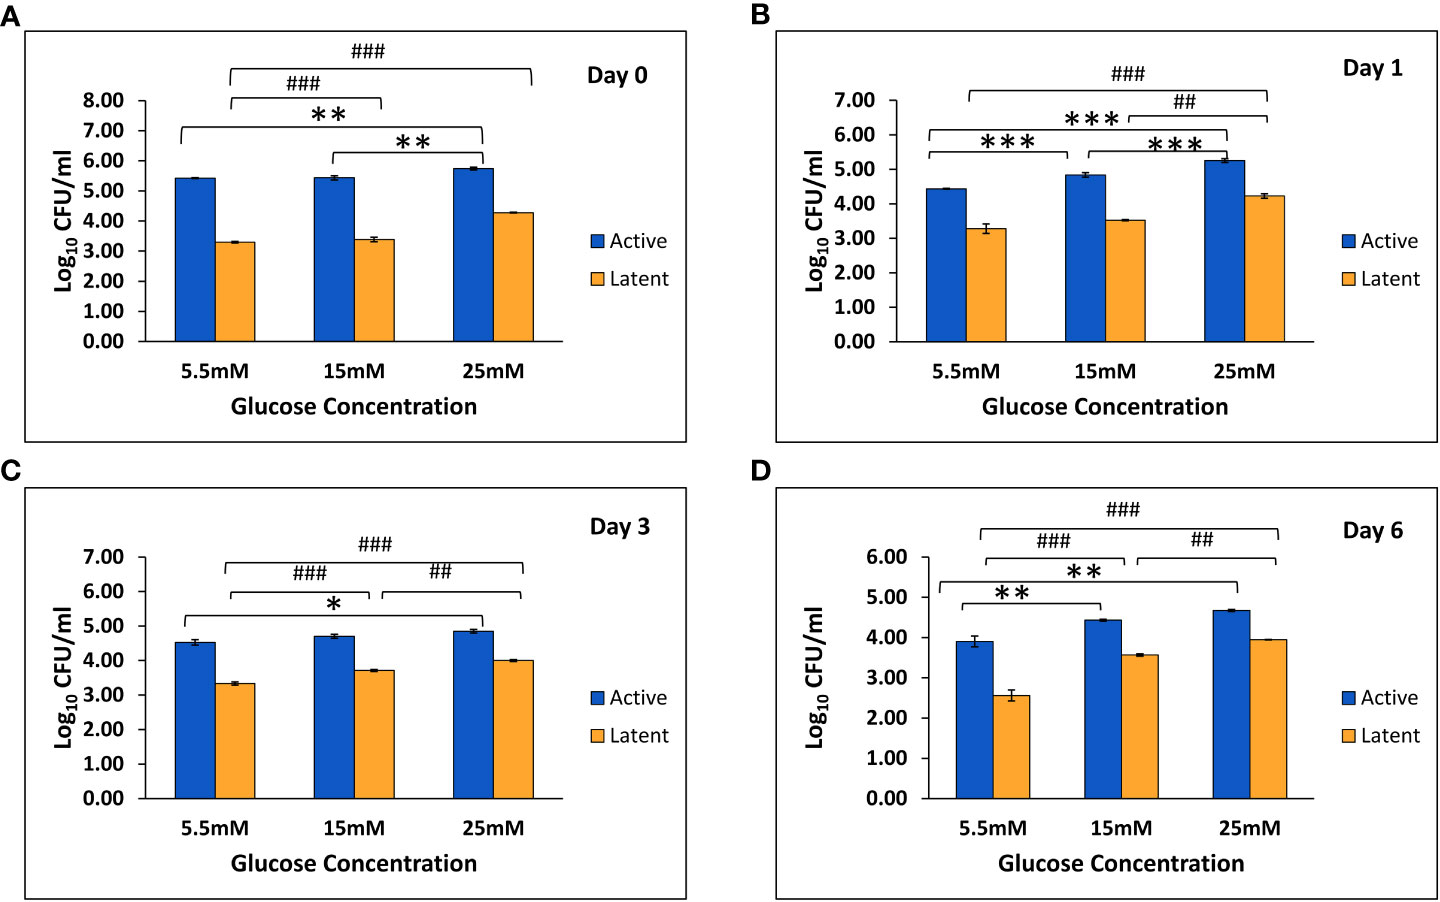
Figure 5 Log10 CFU counts of M. tuberculosis H37Rv in THP-1 cells infected with active and latent bacilli in the presence of different glucose concentrations at different time intervals. (A) On day 0 of infection. (B) On day 1 of infection. (C) On day 3 of infection. (D) On day 6 of infection. Values are Mean ±SE of three independent experiments. *p ≤0.05, **p ≤0.01, and ***p ≤0.001 represent the comparison between different glucose concentrations in the active group. ##p ≤0.01 and ###p ≤0.001 represent the comparison between different glucose concentrations in the latent group.
With an increase in glucose concentration, the expression of the mmp-1 gene was found to be upregulated in both active and latent groups as compared to the uninfected group at all time points, i.e., day 0, day 1, day 3, and day 6. At 25 mM glucose concentration, expression was observed to be 21-fold upregulated in the active group and approximately 29-fold upregulated in the latent group on day 0, whereas a 16.7-fold increase in the active group and a 19.7-fold increase in the latent group was observed on day 1 as compared to the uninfected group (Figures 6A–D). The expression of the mmp-9 was found to be downregulated in the active and latent groups at 25 mM as compared to 15 mM glucose concentration at all time points, but the expression was significantly downregulated in the latent group as compared to the active group at later time points at high glucose conditions (Figures 7A–D). At higher glucose concentrations, the gene expression of mmp-2 was found to be significantly increased in the active group at earlier time points, whereas at later time points it was observed to be downregulated. However, in the latent group a significant decrease in expression was observed on day 6 at 25 mM glucose concentration as compared to 5.5 mM and 15 mM glucose concentration (Figures 8A–D).
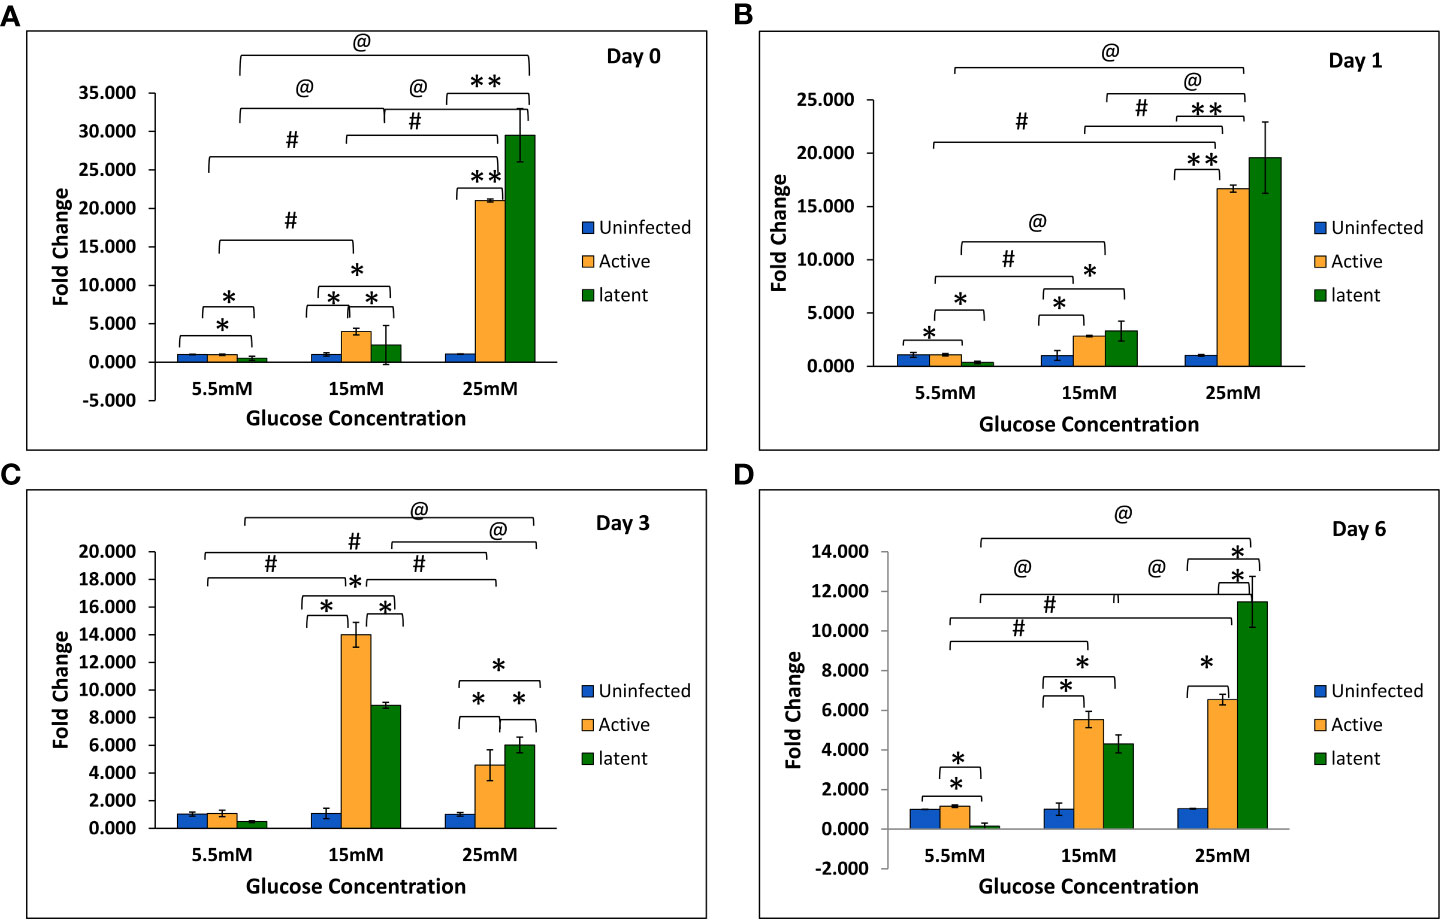
Figure 6 Expression of the mmp-1 gene in the uninfected, active, and latent groups of THP-1 cells in the presence of different glucose concentrations at different time intervals. (A) On day 0 of infection. (B) On day 1 of infection. (C) On day 3 of infection. (D) On day 6 of infection. Values are Mean ±SE of three independent experiments. *p ≤0.05 represents the comparison between the uninfected, active, and latent groups within the same glucose concentration. **p ≤0.01 represents the comparison between the uninfected, active, and latent groups within the same glucose concentration. #p ≤0.05 represents the comparison between different glucose concentrations in the active group. @p ≤0.05 represents the comparison between different glucose concentrations in the latent group.
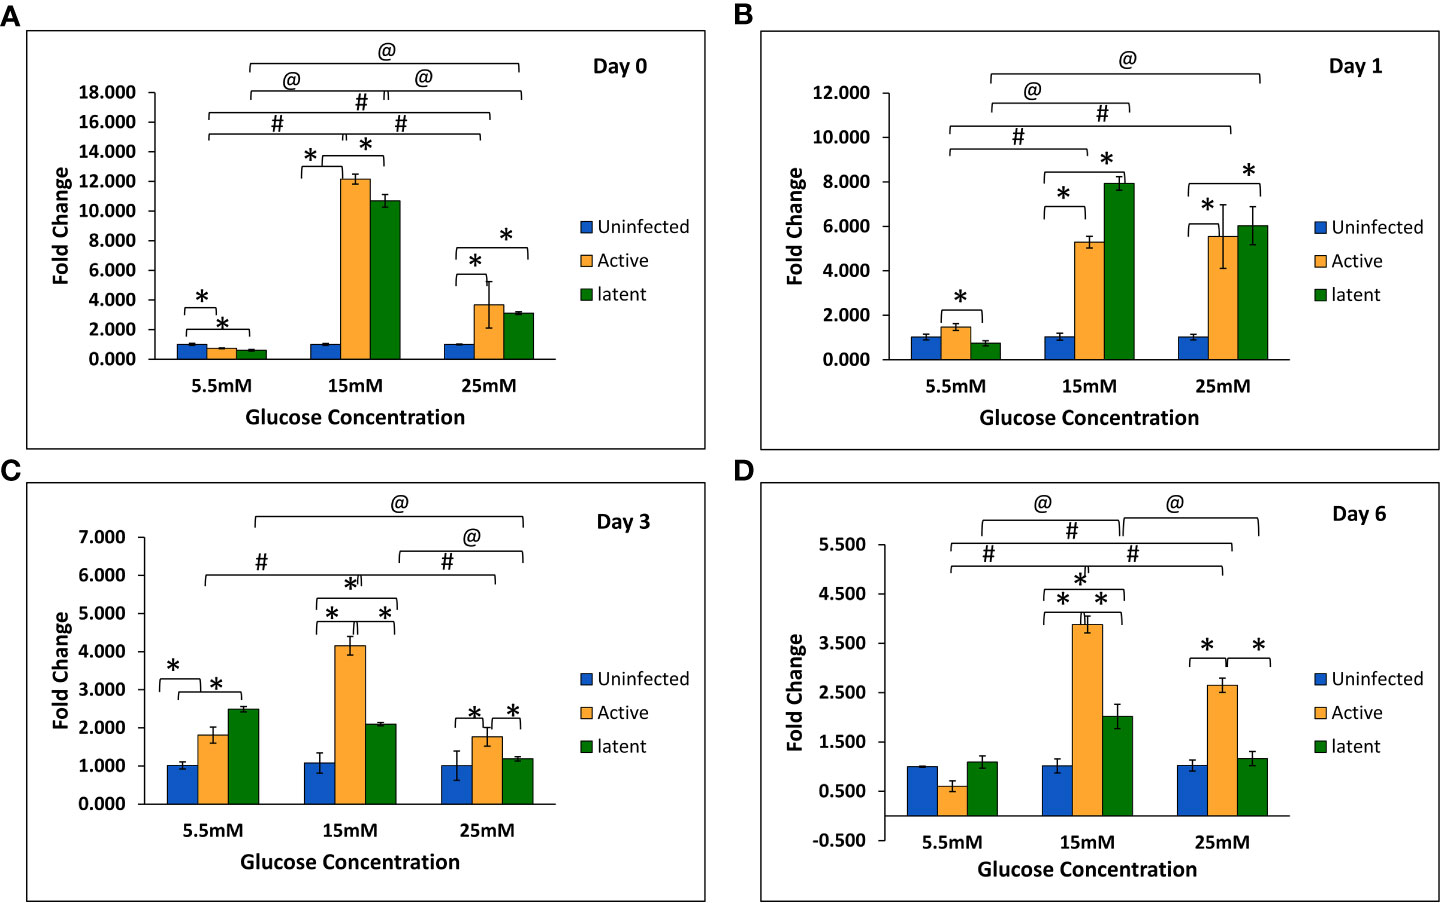
Figure 7 Expression of the mmp-9 gene in the uninfected, active, and latent groups of THP-1 cells in the presence of different glucose concentrations at different time intervals. (A) On day 0 of infection. (B) On day 1 of infection. (C) On day 3 of infection. (D) On day 6 of infection. Values are Mean ±SE of three independent experiments. *p ≤0.05 represents the comparison between the uninfected, active, and latent groups within the same glucose concentration. #p ≤0.05 represents the comparison between different glucose concentrations in the active group. @p ≤0.05 represents the comparison between different glucose concentrations in the latent group.
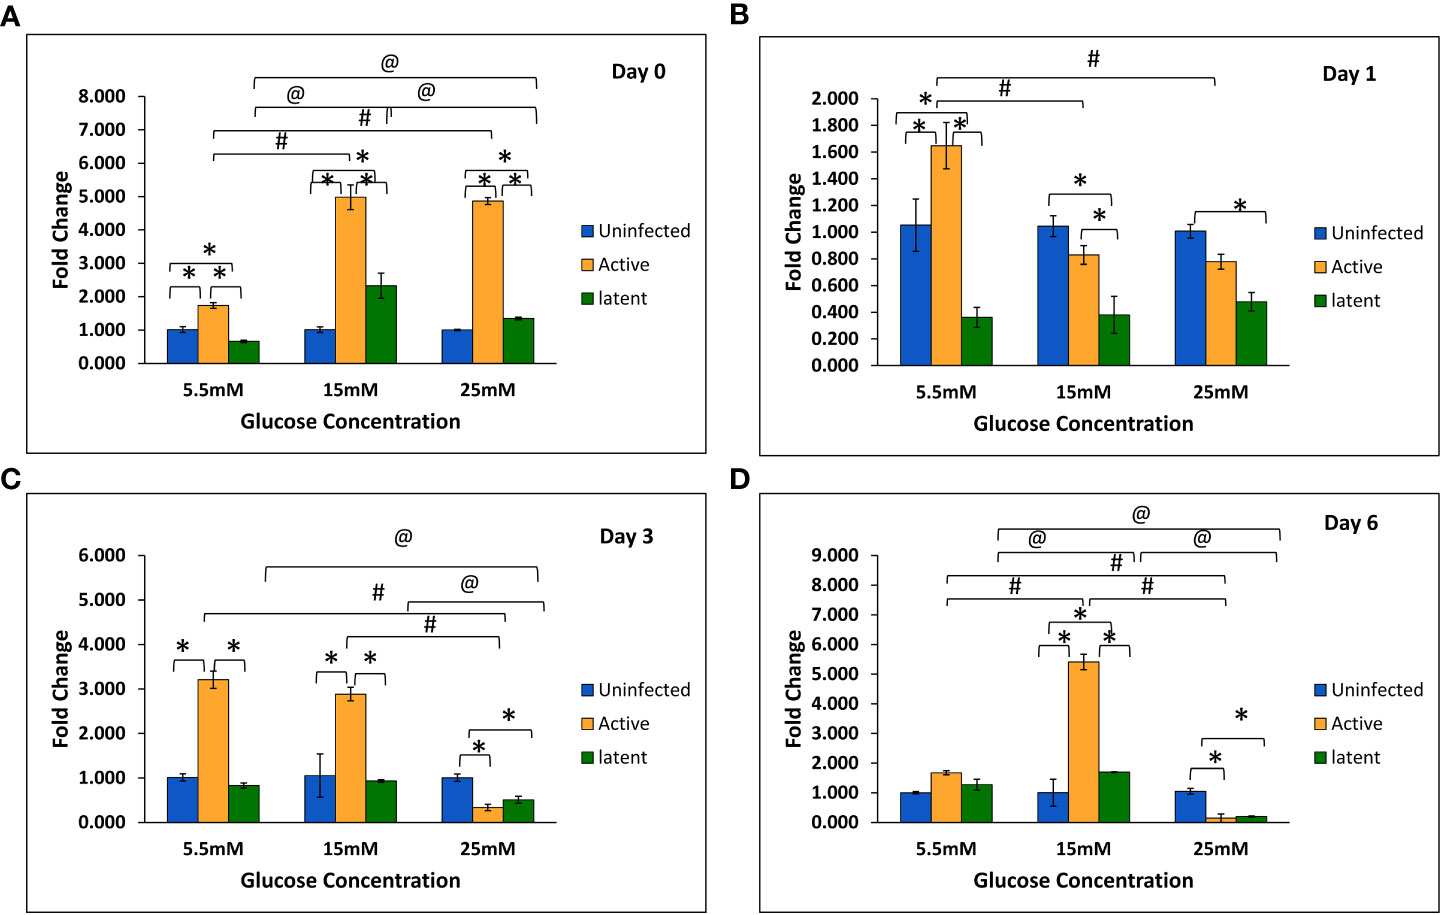
Figure 8 Expression of the mmp-2 gene in the uninfected, active, and latent groups of THP-1 cells in the presence of different glucose concentrations at different time intervals. (A) On day 0 of infection. (B) On day 1 of infection. (C) On day 3 of infection. (D) On day 6 of infection. Values are Mean ±SE of three independent experiments. *p ≤0.05 represents the comparison between the uninfected, active, and latent groups within the same glucose concentration. #p ≤0.05 represents the comparison between different glucose concentrations in the active group. @p ≤0.05 represents the comparison between different glucose concentrations in the latent group.
The levels of different cytokines, i.e., IL-12, MCP-1, TNF-α, and MIP-1α, were determined in the THP-1 cell culture supernatants of the uninfected, active, and latent groups at different time intervals, i.e., 0 h, 6 h, 18 h, and 24 h of infection, in the presence of different glucose concentrations. With an increase in glucose concentration, the levels of MCP-1 were found to be decreased in the uninfected, active, and latent groups at all time points. This decrease in MCP-1 levels was more drastic in the active group as compared to the uninfected group with an increase in glucose concentration, which further explains reduced chemotaxis with an increase in glucose concentrations (Supplementary Figures 4A–D). The levels of TNF-α were found to be very high in both the active and latent groups with an increase in glucose concentrations (Supplementary Figures 5A–D). However, the levels of MIP-1α and IL-12 were found to be approximately similar in all the groups at 5.5 mM, 15 mM, and 25 mM glucose (data not shown).
Diabetes is considered as a contributing factor to the dissemination of tuberculosis. Diabetes and active tuberculosis are well associated, yet the link between latent tuberculosis and diabetes has not been explored. Thus, a mice model of latent tuberculosis, developed by Zhang et al. (2009) was used and simultaneously diabetes was induced after establishment of latency which was confirmed by the CFU counts in lungs and spleen after infection with M. tuberculosis. The CFU counts were less than 104 and remained stable, which affirmed the establishment of latent tuberculosis. The bacterial load in LTBI is presumed to be ≤104 CFU, as the lower limit of detection for acid-fast smears is 104 CFU/ml (Nuermberger et al., 2004; Zhang et al., 2009). Histological studies also supported the establishment of a latent tuberculosis model as granulomas were detected in the lungs after M. tuberculosis challenge. The results were supported by a study conducted by Dutta et al. (2014) wherein necrotic lung granulomas were observed after infection with M. tuberculosis in C3HeB/FeJ mice that were previously immunized with BCG. The development of granulomatous lesions after 2 and 10 weeks of low-aerosol infection with M. tuberculosis in the lungs of C57BL/6 mice has also been reported (Botha and Ryffel, 2002).
Alpha crystallin sustains the tubercle bacilli during the dormant or latent phase of infection, therefore qualifying HspX as a potential biomarker for latent TB infection (Mustafa et al., 1999; Botha and Ryffel, 2002). In our study, the gene expression of hspX was significantly upregulated in the latent TB group in comparison with the active TB group. This observation was in accordance with a study that revealed elevated HspX levels by tubercle bacilli in the latent state and its reversal to normal levels when exponential growth was resumed (Hu et al., 2006). It is known that M. tuberculosis can synthesize or accumulate triacylglycerol (TG), which leads to its long-term survival or persistence or dormancy under stress conditions (Daniel et al., 2004). M. tuberculosis synthesizes different TG synthases, which are responsible for the accumulation of TG under different stress conditions (Sirakova et al., 2006). The expression of the tgs1 and tgs5 genes has been observed to be upregulated in the latent TB group as compared to the active TB group. The results were supported by a study wherein the tgs1 gene was found to be the prime contributor to TG synthesis in M. tuberculosis cultures grown under hypoxic and nitric oxide stress conditions (Daniel et al., 2004).
Further, diabetes was induced in latently infected mice using multiple, low doses of streptozotocin. A multiple, low-dose streptozotocin-induced diabetes model was developed by Leiter in 1982 using C57BL/6 mice (Leiter, 1982). After that, many researchers have also used this multiple, low-dose model to develop diabetes (McEvoy et al., 1984; Sun et al., 2005; Ventura-Sobrevilla et al., 2011). However, diabetes was not induced using multiple, low doses of streptozotocin in this study, which was thought to be due to BCG immunization as it has an important role in protection against diabetes. Various studies have observed that diabetes was not induced by multiple, low doses of streptozotocin in mice previously immunized with BCG (Baik et al., 1999; Rosa et al., 2013). Therefore, another single high dose of streptozotocin was given to the animals. and diabetes was successfully induced in latently infected mice.
To understand the crosstalk between intracellular mycobacteria and host macrophages, the THP-1 monocytic cell line was grown under hyperglycemic conditions and infected with latent as well as active cultures of M. tuberculosis for 3 h. Accordingly, mycobacterial phagocytosis by macrophages under high glucose conditions was studied. THP-1 cells were used as model phagocytic cells (Ranaivomanana et al., 2018; Riaz et al., 2020). CFU enumeration at normal glucose conditions suggested that the dormant bacilli were better contained within the macrophages as compared to the active bacilli. The data was supported by a study wherein the growth of dormant bacilli was better suppressed by macrophages as compared to aerobic bacilli (Iona et al., 2012). However, as the glucose concentration increased, the CFU counts in both the active and latent TB groups increased significantly as compared to normal glucose conditions at each time point. Similar results were obtained in a study in which bacterial internalization and killing were reduced by macrophages isolated from diabetic mice (Alim et al., 2017). Also, Gomez et al. observed that the monocytes isolated from diabetic patients had reduced intake of M. tuberculosis in comparison to monocytes isolated from nondiabetic patients (Gomez et al., 2013).
Cytokines play a critical role in active and latent TB infection. Th1 cytokines differentiate between latent tuberculosis and active tuberculosis, as their levels are higher in LTBI (Wu et al., 2017). A study by Kumar et al. found that latent tuberculosis infection and diabetes co-pathology are characterized by decreased systemic Th1 cytokine levels (Kumar et al., 2014). In this study, the levels of TNF-α were found to be lower in the latent group as compared to the active group at 0 h. However, with an increase in time, the levels of TNF-α were found to be higher in the latent group as compared to the active group at high glucose conditions. In a mouse model of latent tuberculosis, TNF-α levels were found to be decreased non-significantly in the latent tuberculosis with diabetes group at week 9 of diabetes induction as compared to latent tuberculosis alone; however, levels were comparable between both groups at week 13. The results were in contrast to a study in which reduced levels of type-1 and type-17 cytokines along with diminished circulating levels of pro-inflammatory cytokines were reported in individuals with latent tuberculosis and diabetes as compared to individuals with latent tuberculosis without diabetes (Kumar and Babu, 2017). The possible reasons for this variation could be the species difference as the present study was performed on mice, and another possible reason could be the early time points as the sacrifice was done after the second (week 9) and sixth (week 13) weeks of diabetes establishment. Th2 cytokines, i.e., IL-4, IL-6, IL-10, IL-13, etc., inhibit Th1 responses and thus cross-regulate and influence the progression to active tuberculosis (O’Garra et al., 2013). In the mouse model, the levels of IL-6 and IL-10 were found to be significantly decreased in the latent tuberculosis with diabetes group in comparison to the latent tuberculosis only group. The results were supported by a study in which no difference in the levels of IL-4, IL-5, IL-6, and IL-13 and a decrease in IL-10 levels were reported between latently infected individuals with diabetes and those without diabetes (Kumar et al., 2014).
Along with the cytokines, levels of chemokines, i.e., monocyte chemotactic protein-1 (MCP-1) and macrophage inflammatory protein-1a (MIP-1α), were measured. MCP-1 plays an important role in latent infection, primarily in the establishment and maintenance of granulomas by recruiting leukocytes at the site of infection (Deshmane et al., 2009). In this study, the levels of MCP-1 were found to be decreased in the culture supernatants of the active group as compared to the latent and uninfected groups, and the levels were greatly reduced at higher glucose concentrations as compared to normal glucose concentrations in both the active and latent groups. Results were supported by a study in diabetic mice infected with M. tuberculosis, which showed reduced levels of MCP-1 in lung lysates, resulting in delayed migration of dendritic cells from the lungs to lymph nodes (Vallerskog et al., 2010). Chemokines like MIP-1α, CCL4, and CCL5 function in synergy with IFN-γ as pro-inflammatory chemokines (Dorner et al., 2002). However, no change in the levels of MIP-1α in the culture supernatants was observed between the uninfected, active, and latent groups or between normal glucose and high glucose conditions. The results were supported by a study in which no difference was observed in the secretion and mRNA expression of CCL3 upon M. tuberculosis infection between extrapulmonary and pulmonary TB patients (Hasan et al., 2009).
ECM plays a vital role in the structural composition of granulomas in terms of leucocyte trafficking in and out of this dynamic environment (Gonzalez-Juarrero et al., 2001). Interestingly, MMPs appear to play a key role in both granuloma formation and in lung tissue destruction. In the present study, the expression of the mmp-1 gene was observed to be increased non-significantly at week 13 in latently infected mice with diabetes in comparison with non-diabetic mice. Similarly, in in vitro studies, the gene expression of mmp-1 was observed to be significantly upregulated in the latent group as compared to the active group at high glucose concentrations. The results were supported by a study wherein the circulating levels of MMP-1 were found to be elevated in active pulmonary TB patients as compared to individuals with LTBI (Andrade et al., 2015). However, no significant change was observed in the protein levels of MMP-1 at week 9, and a significant decrease was observed in levels at week 13 in the serum of latently infected mice with diabetes compared to those without diabetes. Results were comparable to a study in which no significant difference was observed in the plasma levels of MMP-1 between tuberculosis patients with or without diabetes (Andrade et al., 2014). The MMP-9 elevation was related with monocyte and macrophage recruitment, which is essential for the maturation of granulomas (Volkman et al., 2010). In this study, the gene expression of mmp-9 was found to be significantly decreased in the latent group as compared to the active group at high glucose concentrations in THP-1 cells. The results were in accordance with a study on HIV-TB in which the concentrations of MMP-1, -2, -3, and -9 were decreased in the sputum of TB patients with HIV as compared to those without HIV (Walker et al., 2017). However, in vivo studies did not show any significant difference either in gene expression or in the serum levels of MMP-9 in actively infected mice or in latently infected mice with or without diabetes. The results were supported by another study in which no changes in the circulating levels of MMP-9 were observed between TB patients with or without diabetes (Kumar et al., 2018).
In conclusion, an animal model was employed to study latent tuberculosis and diabetes. Although animal models of tuberculosis and diabetes co-morbidity have been developed in the past, no animal model of latent tuberculosis and diabetes has been developed so far. This model of latent tuberculosis and diabetes was further used to study the role of diabetes in the activation of latent tuberculosis (Verma et al., 2021). Further, diabetes and hyperglycemic conditions lead to a decrease in levels of MCP-1, increased gene expression of mmp-1, and decreased gene expression of mmp-9, which together may lead to a disruption in the process of granuloma formation and in the activation of latent TB infection.
The original contributions presented in the study are included in the article/Supplementary Material. Further inquiries can be directed to the corresponding author.
The animal study was reviewed and approved by the Institutional Animal Ethical Committee, PGIMER, Chandigarh with ref. no. 89/90/IAEC/616 and the Animal Ethical Committee, ICGEB, New Delhi with ref. no. ICGEB/IAEC/02042019/TACF-PGIMER-16.
AV—Conception & design of the work, acquisition, analysis, and interpretation of data, wrote the main manuscript text and prepared figures. MK, PL, LS—Acquisition of data. DA, IV, BR, SB—Interpretation of data. SS—Conception and design of the work, interpretation of data and substantively revised the work. All authors listed have made a substantial, direct, and intellectual contribution to the work and approved it for publication.
The authors are grateful to the Indian Council of Medical Research (wide no. 5/8/5/14/2014/ECD-1 and 3/1/3 JRF-2015/HRD-LS/20/10882/33) for financially supporting this work.
The authors declare that the research was conducted in the absence of any commercial or financial relationships that could be construed as a potential conflict of interest.
All claims expressed in this article are solely those of the authors and do not necessarily represent those of their affiliated organizations, or those of the publisher, the editors and the reviewers. Any product that may be evaluated in this article, or claim that may be made by its manufacturer, is not guaranteed or endorsed by the publisher.
The Supplementary Material for this article can be found online at: https://www.frontiersin.org/articles/10.3389/fcimb.2022.957512/full#supplementary-material
Adilakshmi, T., Lease, R. A., Woodson, S. A. (2006). Hydroxyl radical footprinting in vivo: Mapping macromolecular structures with synchrotron radiation. Nucleic Acids Res 34 (8), e64. doi: 10.1093/nar/gkl291
Ahmad, Z., Sharma, S., Khuller, G. K. (2006). The potential of azole antifungals against Latent/Persistent tuberculosis. FEMS Microbiol. Lett. 258 (2), 200–2035. doi: 10.1111/j.1574-6968.2006.00224.x
Alim, M. A., Sikder, S., Bridson, T. L., Rush, C. M., Govan, B. L., Ketheesan, N. (2017). Anti-mycobacterial function of macrophages is impaired in a diet induced model of type 2 diabetes. Tuberculosis 102, 47–54. doi: 10.1016/j.tube.2016.12.002
Andrade, B. B., Kumar, N. P., Amaral, E. P., Riteau, N., Mayer-Barber, K. D., Tosh, K. W., et al. (2015). Heme oxygenase-1 regulation of matrix metalloproteinase-1 expression underlies distinct disease profiles in tuberculosis. J. Immunol. 195 (6), 2763–73. doi: 10.4049/jimmunol.1500942
Andrade, B. B., Kumar, N. P., Sridhar, R., Banurekha, V. V., Jawahar, M. S., Nutman, T. B., et al. (2014). Heightened plasma levels of heme oxygenase-1 and tissue inhibitor of metalloproteinase-4 as well as elevated peripheral neutrophil counts are associated with TB-diabetes comorbidity. Chest 145 (6), 1244–1254. doi: 10.1378/chest.13-1799
Baik, S. H., Park, I. B., Choi, K. M., Kim, Y. H., Kim, N. H., Kim, S. J., et al. (1999). BCG Vaccine prevents insulitis in low dose streptozotocin-induced diabetic mice. Diabetes Res. Clin. Practice 46 (2), 91–7. doi: 10.1016/S0168-8227(99)00079-0
Baker, M. A., Harries, A. D., Jeon, C. Y., Hart, J. E., Kapur, A., Lönnroth, K., et al. (2011). The impact of diabetes on tuberculosis treatment outcomes: A systematic review. BMC Med. 9 (1), 815. doi: 10.1186/1741-7015-9-81
Betts, J. C., Lukey, P. T., Robb, L. C., McAdam, R. A., Duncan, K. (2002). Evaluation of a nutrient starvation model of mycobacterium tuberculosis persistence by gene and protein expression profiling. Mol. Microbiol. 43 (3), 717–315. doi: 10.1046/j.1365-2958.2002.02779.x
Botha, T., Ryffel, B. (2002). Reactivation of latent tuberculosis by an inhibitor of inducible nitric oxide synthase in an aerosol murine model. Immunology 107 (3), 350–7. doi: 10.1046/j.1365-2567.2002.01511.x
Chang, J. C., Wysocki, A., Tchou-Wong, K. M., Moskowitz, N., Zhang, Y., Rom, W. N. (1996). Effect of mycobacterium tuberculosis and its components on macrophages and the release of matrix metalloproteinases. Thorax 51 (3), 306–11. doi: 10.1136/thx.51.3.306
Daniel, J., Deb, C., Dubey, V. S., Sirakova, T. D., Abomoelak, B., Morbidoni, H. R., et al. (2004). Induction of a novel class of diacylglycerol acyltransferases and triacylglycerol accumulation in mycobacterium tuberculosis as it goes into a dormancy-like state in culture. J. Bacteriol 186 (15), 5017–30. doi: 10.1128/JB.186.15.5017-5030.2004
Deshmane, S. L., Kremlev, S., Amini, S., Sawaya, B. E. (2009). Monocyte chemoattractant protein-1 (MCP-1): An overview. J. Interferon Cytokine Res 29 (6), 313–26. doi: 10.1089/jir.2008.0027
Dooley, K. E., Chaisson, R. E. (2009). Tuberculosis and diabetes mellitus: Convergence of two epidemics. Lancet Infect. Dis 9 (12), 737–46. doi: 10.1016/S1473-3099(09)70282-8
Dorner, B. G., Scheffold, A., Rolph, M. S., Huser, M. B., Kaufmann, S. H., Radbruch, A., et al. (2002). MIP-1alpha, MIP-1beta, RANTES, and ATAC/Lymphotactin function together with IFN-gamma as type 1 cytokines. Proc. Natl. Acad. Sci. U.S.A 99 (9), 6181–6. doi: 10.1073/pnas.092141999\n092141999
Dutta, N. K., Illei, P. B., Jain, S. K., Karakousis, P. C. (2014). Characterization of a novel necrotic granuloma model of latent tuberculosis infection and reactivation in mice. Am. J. Pathol. 184 (7), 2045–55. doi: 10.1016/j.ajpath.2014.03.008
Faurholt-Jepsen, D., Nyagosya, R., Praygod, G., Jeremiah, K., Faurholt-Jepsen, M., Aabye, M. G., et al. (2013). Diabetes is a strong predictor of mortality during tuberculosis treatment: A prospective cohort study among tuberculosis patients from mwanza, Tanzania. Trop. Med. Int. Health 18 (7), 822–9. doi: 10.1111/tmi.12120
Fisher-Hoch, S. P., Mathews, C. E., Mccormick, J. B. (2013). Obesity, diabetes and pneumonia: The menacing interface of non-communicable and infectious diseases. Trop. Med. Int. Health 18 (12), 1510–9. doi: 10.1111/tmi.12206
Fox, G. J., Menzies, D. (2013). Epidemiology of tuberculosis immunology. Adv. Exp. Med. Biol. 783, 1–32. doi: 10.1007/978-1-4614-6111-1_1
Galboiz, Y., Shapiro, S., Lahat, N., Miller, A. (2002). Modulation of monocytes matrix metalloproteinase-2, MT1-MMP and TIMP-2 by interferon-γ and -β: Implications to multiple sclerosis. J. Neuroimmunol 131 (1-2), 191–200. doi: 10.1016/S0165-5728(02)00266-7
Gomez, D. I., Twahirwa, M., Schlesinger, L. S., Restrepo, B. I. (2013). Reduced mycobacterium tuberculosis association with monocytes from diabetes patients that have poor glucose control. Tuberculosis 93 (2), 192–7. doi: 10.1016/j.tube.2012.10.003
Gonzalez-Juarrero, M., Turner, O. C., Turner, J., Marietta, P., Brooks, J. V., Orme, I. M. (2001). Temporal and spatial arrangement of lymphocytes within lung granulomas induced by aerosol infection with mycobacterium tuberculosis. Infect. Immun. 69 (3), 1722–8. doi: 10.1128/IAI.69.3.1722-1728.2001
Hair, P. S., Echague, C. G., Rohn, R. D., Krishna, N. K., Nyalwidhe, J. O., Cunnion, K. M. (2012). Hyperglycemic conditions inhibit C3-mediated immunologic control of staphylococcus aureus. J. Trans. Med 10, 35. doi: 10.1186/1479-5876-10-35
Hasan, Z., Cliff, J. M., Dockrell, H. M., Jamil, B., Irfan, M., Ashraf, M., et al. (2009). CCL2 responses to mycobacterium tuberculosis are associated with disease severity in tuberculosis. PloS One 4 (12), e8459. doi: 10.1371/journal.pone.0008459
Hoheisel, G., Sack, U., Hui, D. S. C., Huse, K., Chan, K. S., Chan, K. K., et al. (2001). Occurrence of matrix metalloproteinases and tissue inhibitors of metalloproteinases in tuberculous pleuritis. Tuberculosis 81 (3), 203–9. doi: 10.1054/tube.2000.0276
Hrabec, E., Strek, M., Zieba, M., Kwiatkowska, S., Hrabec, Z. (2002). Circulation level of matrix metalloproteinase-9 is correlated with disease severity in tuberculosis patients. Int. J. Tuberculosis Lung Dis 6 (8), 713–9.
Hu, Y., Movahedzadeh, F., Stoker, N. G., Coates, A. R. M. (2006). Deletion of the mycobacterium tuberculosis α-crystallin-like HspX gene causes increased bacterial growth in vivo. Infect. Immun. 74 (2), 861–8. doi: 10.1128/IAI.74.2.861-868.2006
Iona, E., Pardini, M., Gagliardi, M. C., Colone, M., Stringaro, A. R., Teloni, R., et al. (2012). Infection of human THP-1 cells with dormant mycobacterium tuberculosis. Microbes Infect. 14 (11), 959–675. doi: 10.1016/j.micinf.2012.04.003
Jin, H. Y., Lee, K. S., Jin, S. M., Lee, Y. C. (2004). Vascular endothelial growth factor correlates with matrix metalloproteinase-9 in the pleural effusion. Respir. Med. 98 (2), 115–212. doi: 10.1016/j.rmed.2003.09.002
Kumar, N. P., Babu, S. (2017). Influence of diabetes mellitus on immunity to human tuberculosis. Immunology 152 (1), 13–245. doi: 10.1111/imm.12762
Kumar, N. P., George, P. J., Kumaran, P., Dolla, C. K., Nutman, T. B., Babu, S. (2014). Diminished systemic and antigen-specific type 1, type 17, and other proinflammatory cytokines in diabetic and prediabetic individuals with latent mycobacterium tuberculosis infection. J. Infect. Dis 210 (10), 1670–8. doi: 10.1093/infdis/jiu329
Kumar, N. P., Moideen, K., Viswanathan, V., Shruthi, B. S., Sivakumar, S., Menon, P. A., et al. (2018). Elevated levels of matrix metalloproteinases reflect severity and extent of disease in tuberculosis-diabetes Co-morbidity and are predominantly reversed following standard anti-tuberculosis or metformin treatment. BMC Infect. Dis. 18 (1), 345. doi: 10.1186/s12879-018-3246-y
Lecoeur, H. F., Truffot-Pernot, C., Grosset, J. H. (1989). Experimental short-course preventive therapy of tuberculosis with rifampin and pyrazinamide. Am. Rev. Respir. Dis 140 (5), 1189–93. doi: 10.1164/ajrccm/140.5.1189
Lee, K. Y., Kim, E. H., Yang, W. S., Ryu, H., Cho, S. N., Lee, B. I., et al. (2004). Persistent increase of matrix metalloproteinases in cerebrospinal fluid of tuberculous meningitis. J. Neurol. Sci 220 (1-2), 73–8. doi: 10.1016/j.jns.2004.02.008
Lee, M. M., Yoon, B. J., Osiewicz, K., Preston, M., Bundy, B., Heeckeren, A. M. V., et al. (2005). Tissue inhibitor of metalloproteinase 1 regulates resistance to infection. Infect. Immun. 73 (1), 661–5. doi: 10.1128/IAI.73.1.661-665.2005
Leiter, E. H. (1982). Multiple low-dose streptozotocin-induced hyperglycemia and insulitis in C57BL mice: Influence of inbred background, sex, and thymus. Proc. Natl. Acad. Sci. 79 (2), 630–634. doi: 10.1073/pnas.79.2.630
Majeed, S., Radotra, B. D., Sharma, S. (2016). Adjunctive role of MMP-9 inhibition along with conventional anti-tubercular drugs against experimental tuberculous meningitis. Int. J. Exp. Pathol. 97 (3), 230–7. doi: 10.1111/iep.12191
Martinez, N., Kornfeld, H. (2014). Diabetes and immunity to tuberculosis. Eur. J. Immunol. 44 (3), 617–26. doi: 10.1002/eji.201344301
Matsuura, E., Umehara, F., Hashiguchi, T., Fujimoto, N., Okada, Y., Osame, M. (2000). Marked increase of matrix metalloproteinase 9 in cerebrospinal fluid of patients with fungal or tuberculous meningoencephalitis. J. Neurol. Sci. 173 (1), 45–52. doi: 10.1016/S0022-510X(99)00303-2
McEvoy, R. C., Andersson, J., Sandler, S., Hellerstrom, C. (1984). Multiple low-dose streptozotocin-induced diabetes in the mouse. evidence for stimulation of a cytotoxic cellular immune response against an insulin-producing beta cell line. J. Clin. Invest. 74 (3), 715–722. doi: 10.1172/JCI111487
Mustafa, T., Phyu, S., Nilsen, R., Jonsson, R., Bjune, G. (1999). A mouse model for slowly progressive primary tuberculosis. Scandinavian J. Immunol. 50 (2), 127–136. doi: 10.1046/j.1365-3083.1999.00596.x
Nuermberger, E. L., Yoshimatsu, T., Tyagi, S., Bishai, W. R., Grosset, J. H. (2004). Paucibacillary tuberculosis in mice after prior aerosol immunization with mycobacterium bovis BCG. Infect. Immun. 72 (2), 1065–71. doi: 10.1128/IAI.72.2.1065-1071.2004
O’Garra, A., Redford, P. S., McNab, F. W., Bloom, C. I., Wilkinson, R. J., Berry, M. P. R. (2013). The immune response in tuberculosis. Annu. Rev. Immunol. 31, 475–527. doi: 10.1146/annurev-immunol-032712-095939
Ponce-de-Leon, A., Garc°a-Garc°a, M., Gomez-Perez, F. J., Valdespino-G¢mez, J. L., Olaiz-Fernandez, G., Rojas, R., et al. (2004). Tuberculosis and diabetes in southern Mexico. Diabetes Care 27, 1584–1590. doi: 10.2337/diacare.27.7.1584
Price, N. M., Farrar, J., Thi Hong Chau, T., Thi Hoang Mai, N., Tinh Hien, T., Friedland, J. S. (2001). Identification of a matrix-degrading phenotype in human tuberculosis in vitro and In vivo. J. Immunol. 166 (6), 4223–30. doi: 10.4049/jimmunol.166.6.4223
Ramos-Vara, J. A. (2011). Principles and methods of immunohistochemistry. Methods Mol. Biol. 691, 83–96. doi: 10.1007/978-1-60761-849-2_5
Ranaivomanana, P., Raberahona, M., Rabarioelina, S., Borella, Y., Machado, A., De Dieu Randria, M. J., et al. (2018). Cytokine biomarkers associated with human extra-pulmonary tuberculosis clinical strains and symptoms. Front. Microbiol. 9, 275. doi: 10.3389/fmicb.2018.00275
Restrepo, B. I., Schlesinger, L. S. (2013). Host-pathogen interactions in tuberculosis patients with type 2 diabetes mellitus. Tuberculosis 93 (Suppl 0), S10–4. doi: 10.1016/S1472-9792(13)70004-0
Restrepo, B. I., Twahirwa, M., Rahbar, M. H., Schlesinger, L. S. (2014). Phagocytosis via complement or fc-gamma receptors is compromised in monocytes from type 2 diabetes patients with chronic hyperglycemia. PloS One 9 (3), e92977. doi: 10.1371/journal.pone.0092977
Rhoades, E. R. (1997). Progression of chronic pulmonary tuberculosis in mice aerogenically infected with virulent mycobacterium tuberculosis. Tubercle Lung Dis 78 (1), 57–66. doi: 10.1016/S0962-8479(97)90016-2
Riaz, M. S., Kaur, A., Shwayat, S. N., Behboudi, S., Kishore, U., Pathan, A. A. (2020). Dissecting the mechanism of intracellular mycobacterium smegmatis growth inhibition by platelet activating factor c-16. Front. Microbiol. 11, 1046. doi: 10.3389/fmicb.2020.01046
Rieder, H. L. (2014). The dynamics of tuberculosis epidemiology. Indian J. Tuberculosis 61 (1), 19–29.
Ries, C., Petrides, P. E. (1995). Cytokine regulation of matrix metalloproteinase activity and its regulatory dysfunction in disease. Biol. Chem. Hoppe-Seyler 376 (6), 345–55.
Rosa, L., Chiuso-Minicucci, F., Zorzella-Pezavento, S. F. G., França, T. G. D., Ishikawa, L. L. W., Colavite, P. M., et al. (2013). Bacille calmette-Guérin/DNAhsp65 prime-boost is protective against diabetes in non-obese diabetic mice but not in the streptozotocin model of type 1 diabetes. Clin. Exp. Immunol. 173 (3), 430–437. doi: 10.1111/cei.12140
Salgame, P. (2011). MMPs in tuberculosis: Granuloma creators and tissue destroyers. J. Clin. Invest. 121 (5), 1686–1688. doi: 10.1172/JCI57423
Sirakova, T. D., Dubey, V. S., Deb, C., Daniel, J., Korotkova, T. A., Abomoelak, B. (2006). Identification of a diacylglycerol acyltransferase gene involved in accumulation of triacylglycerol in mycobacterium tuberculosis under stress. Microbiology 152 (Pt 9), 2717–2725. doi: 10.1099/mic.0.28993-0
Stegenga, M. E., van der Crabben, S. N., Dessing, M. C., Pater, J. M., van den Pangaart, P. S., de Vos, A. F., et al. (2008). Effect of acute hyperglycaemia and/or hyperinsulinaemia on proinflammatory gene expression, cytokine production and neutrophil function in humans. Diabetic Med. 25 (2), 157–164. doi: 10.1111/j.1464-5491.2007.02348.x
Sun, N., Yang, G., Zhao, H., Savelkoul, H. F. J., An, L. (2005). Multidose streptozotocin induction of diabetes in BALB/c mice induces a dominant oxidative macrophage and a conversion of TH1 to T H2 phenotypes during disease progression. Mediators Inflammation 4, 202–209. doi: 10.1155/MI.2005.202
Thwaites, G. E., Simmons, C. P., Quyen, N. T. H., Thi Hong Chau, T., Mai, P. P., Thi Dung, N. (2003). Pathophysiology and prognosis in Vietnamese adults with tuberculous meningitis. J. Infect. Dis. 188 (8), 1105–15. doi: 10.1086/378642
Turner, J., Gonzalez-Juarrero, M., Saunders, B. M., Brooks, J. V., Marietta, P., Ellis, D. L., et al. (2001). Immunological basis for reactivation of tuberculosis in mice. Infect. Immun. 69 (5), 3264–70. doi: 10.1128/IAI.69.5.3264-3270.2001
Vallerskog, T., Martens, G. W., Kornfeld, H. (2010). Diabetic mice display a delayed adaptive immune response to mycobacterium tuberculosis. J. Immunol. 184 (11), 6275–82. doi: 10.4049/jimmunol.1000304
Ventura-Sobrevilla, J., Boone-Villa, V. D., Aguilar, C. N., Román-Ramos, R., Vega-Avila, E., Campos-Sepúlveda, E., et al. (2011). Effect of varying dose and administration of streptozotocin on blood sugar in Male CD1 mice. Proc. Western Pharmacol. Soc. 54, 5–9.
Verma, A., Kaur, M., Singh, L. V., Aggarwal, D., Verma, I., Radotra, B. D., et al. (2021). Reactivation of latent tuberculosis through modulation of resuscitation promoting factors by diabetes. Sci. Rep. 11 (1), 197005. doi: 10.1038/s41598-021-99257-1
Volkman, H. E., Pozos, T. C., Zheng, J., Davis, J. M., Rawls, J. F., Ramakrishnan, L. (2010). Tuberculous granuloma induction via interaction of a bacterial secreted protein with host epithelium. Science 327 (5964), 466–9. doi: 10.1126/science.1179663
Walker, N. F., Wilkinson, K. A., Meintjes, G., Tezera, L. B., Goliath, R., Peyper, J. M., et al. (2017). Matrix degradation in human immunodeficiency virus type 1-associated tuberculosis and tuberculosis immune reconstitution inflammatory syndrome: A prospective observational study. Clin. Infect. Dis. 65 (1), 121–132. doi: 10.1093/cid/cix231
Woessner, J. F. (1991). Matrix metalloproteinases and their inhibitors in connective tissue remodeling. FASEB J 5 (8), 2145–54. doi: 10.1096/fasebj.5.8.1850705
Wu, J., Wang, S., Lu, C., Shao, L., Gao, Y., Zhou, Z., et al. (2017). Multiple cytokine responses in discriminating between active tuberculosis and latent tuberculosis infection. Tuberculosis 102, 68–75. doi: 10.1016/j.tube.2016.06.001
Keywords: Latent tuberculosis, diabetes, triglyceride synthase, matrix metalloproteinases, cytokines
Citation: Verma A, Kaur M, Luthra P, Singh L, Aggarwal D, Verma I, Radotra BD, Bhadada SK and Sharma S (2023) Immunological aspects of host–pathogen crosstalk in the co-pathogenesis of diabetes and latent tuberculosis. Front. Cell. Infect. Microbiol. 12:957512. doi: 10.3389/fcimb.2022.957512
Received: 31 May 2022; Accepted: 28 December 2022;
Published: 26 January 2023.
Edited by:
Bavesh Kana, University of the Witwatersrand, South AfricaReviewed by:
Abhilasha Madhvi, Rutgers University, Newark, United StatesCopyright © 2023 Verma, Kaur, Luthra, Singh, Aggarwal, Verma, Radotra, Bhadada and Sharma. This is an open-access article distributed under the terms of the Creative Commons Attribution License (CC BY). The use, distribution or reproduction in other forums is permitted, provided the original author(s) and the copyright owner(s) are credited and that the original publication in this journal is cited, in accordance with accepted academic practice. No use, distribution or reproduction is permitted which does not comply with these terms.
*Correspondence: Sadhna Sharma, c2FkaG5hYmlvY2hlbUBnbWFpbC5jb20=
Disclaimer: All claims expressed in this article are solely those of the authors and do not necessarily represent those of their affiliated organizations, or those of the publisher, the editors and the reviewers. Any product that may be evaluated in this article or claim that may be made by its manufacturer is not guaranteed or endorsed by the publisher.
Research integrity at Frontiers
Learn more about the work of our research integrity team to safeguard the quality of each article we publish.