
95% of researchers rate our articles as excellent or good
Learn more about the work of our research integrity team to safeguard the quality of each article we publish.
Find out more
ORIGINAL RESEARCH article
Front. Cell. Infect. Microbiol. , 24 June 2022
Sec. Fungal Pathogenesis
Volume 12 - 2022 | https://doi.org/10.3389/fcimb.2022.926771
This article is part of the Research Topic Molecular mechanism in the development and pathogenesis of fungi View all 5 articles
 Yue Chen1,2†
 Xiyang Wu1,2†
 Chunyan Chen3
 Qiang Huang3
 Chenggang Li1
 Xin Zhang1
 Xinqiu Tan1,2
 Deyong Zhang1,2*
 Yong Liu1,2*
Glycosylphosphatidylinositol (GPI) anchoring the protein GPI modification post-transcriptionally is commonly seen. In our previous study, MoPer1, a GPI anchoring essential factor, has a critical effect on Magnaporthe oryzae growth, pathogenicity, and conidiogenesis, but its molecular mechanism is not clear. Here, we extracted the glycoproteins from the ΔMoper1 mutant and wild-type Guy11 to analyze their differential levels by quantitative proteomic analysis of TMT markers. After background subtraction, a total of 431 proteins, with significant changes in expression, were successfully identified, and these differential proteins were involved in biological regulation, as well as cellular process and metabolic process, binding, catalytic activity, and other aspects. Moreover, we found that MoPer1 regulates the expression of 14 proteins involved in growth, development, and pathogenicity of M. oryzae. The above findings shed light on MoPer1’s underlying mechanism in regulating growth, development, and pathogenicity of M. oryzae.
Cell wall is an organelle unique to fungi, and has a critical effect on keeping an inherent. At the same time, it plays an important role in maintaining normal growth processes such as physiological cellular metabolism, osmotic pressure, and ion exchange (Ahrazem et al., 2007). Protein and polysaccharides such as chitin and glucan are major fungal cellular components. Studies have found that after transcription and translation, some cell wall proteins must be anchored by glycosylphosphatidylinositol (GPI) before they can bind to the cell wall and perform their normal biological functions (Bowman and Free, 2010). In Saccharomyces cerevisiae, more than 60 genes encoding GPI anchor proteins have been found (Kapteyn et al., 1999). According to their location, GPI anchor proteins are divided into two categories. One type is GPI-mannose protein bound to the polysaccharide on the cell wall, which is mainly involved in the following biological processes: fungus adhesion, infective hypha growth, filamentation, coagulation, and mating (Guo et al., 2000). The other type is composed of proteins with enzymatic activity, such as glucanase; these proteins are necessary for cell wall biosynthesis (Gastebois et al., 2010). The research results showed that proteins anchored by GPI have essential effects on the growth, development, and integrity of yeast cell wall. Therefore, the study of these proteins has also clarified the key role of GPI anchored in the growth and development of fungi.
The GPI anchor structure generally has 5 core components: alcoholamine phosphate, mannose, glucosamine, and phosphatidylinositol. The GPI anchoring structure is generated within the endoplasmic reticulum (ER), and its lipid groups experience reconstruction in ER by diverse modification processes, when it combines with its target protein. It mostly consists of 3 processes: first, deacylation of inositol, then formation of lyso-GPI through cutting off acyl chain on diacylglycerol’s sn-2 position, and finally connection of the saturated 26-carbon acyl group at the sn-2 position (Orlean and Menon, 2007; Fujita and Jigami, 2008; Fujita and Kinoshita, 2012). In mammals, together with the model fungus S. cerevisiae, the genes related to GPI anchoring were well studied. In S. cerevisiae, these 3 steps are respectively completed under the action of inositol deacylase Bst1, GPI phospholipase Per1, and Gup1 protein. Studies have found that the lack of BST1 delays the formation of GPI-anchored proteins (Fujita et al., 2006), while deletion of PER1 gene inhibits the transport of yeast GPI-anchored protein (Fujita et al., 2007); at the same time, the deletion of two genes can affect the integrity of yeast cell wall. The results of these series of studies indicate that the yeast GPI anchor structure has a critical effect on the GPI-anchored protein maturation, transport, as well as cell wall adhesion. Although the types and biological functions of GPI-anchored related proteins have been preliminary research results in yeast, relevant research in plant pathogenic fungi has not been reported.
In our previous study, the functions of MoPer1, a homolog of yeast ScPer1, was characterized in Magnaporthe oryzae. We found that the MoPER1 gene was significantly upregulated in the conidia and infection stages of M. oryzae, and the ΔMoper1 mutant was defective in vegetative growth, conidiation, appressoria formation, cell wall integrity, and host infection (Chen et al., 2018).
To shed further light on the role of MoPER1, we used quantitative proteomics to analyze changes in protein expression in the ΔMoper1 mutants and elucidate the molecular mechanism of MoPer1 regulating the development and pathogenicity of M. oryzae.
M. oryzae Guy11 and ΔMoper1 mutant strains were used in this study. Referring to previous studies to obtain fungal mycelium in liquid CM for total protein extraction, (Liu et al., 2020), glycoprotein was extracted by the FOCUS™ Glycoprotein kit (G-Biosciences, USA) according to the manufacturer’s instructions. The BCA (bicinchoninic acid) method was utilized to determine glycoprotein concentration, followed by preservation under −80°C until subsequent use.
After being collected in every sample, proteins (20 mg) were mixed with 5× loading buffer that contained 0.5% bromophenol blue, 10% SDS, 50% glycerol, 250 mM Tris-HCl, and 500 mM DTT. Thereafter, the mixture was boiled within the water bath for a 5-min period before 90 min of 12.5% SDS-PAGE (at 14 mA). Lastly, Coomassie blue was used to stain the gel (Hiroyuki et al., 2019).
In total, 50 μg of glycoprotein from each sample was diluted with lysis buffer to adjust to the same concentration and volume. DTT was added to the above glycoprotein solution to attain the eventual content of DTT at 5 mM, and mixed, followed by 30 min of incubation under 55°C and later cooling on ice to ambient temperature. The corresponding iodoacetamide (IAA) quantity was added to make 10 mM of the final concentration, and mixed sufficiently before 15-min preservation under ambient temperature in the dark. Acetone (6-fold volume) was added to precipitate glycoprotein prior to overnight preservation under −20°C and then centrifuged at 4°C to collect the precipitate. One hundred microliters of 200 mM tetraethylammonium (TEAB) was added to reconstitute the pellet. Then, Trypsin-TPCK (1 mg/ml) was added at 1/50 sample weight for overnight digestion under 37°C.
This work carried out six-plex TMT labeling (Thermo Fisher Scientific Inc., San Jose, CA) in line with specific protocols. After lyophilization, 100 mM TEAB buffer (50 μl) was used to resuspend samples and vortexed to mix, and the labeling reaction was performed (Bradley et al., 2019). The TMT reagent was removed from the refrigerator and equilibrated to room temperature; 88 μl of anhydrous acetonitrile was added, followed by 5-min vortexing and centrifugation. The TMT reagent (41 μl) was added into the sample, vortexed to mix, and stood for a 1-h period under ambient temperature; 5% hydroxylamine (8 μl) was added for a 15-min period to stop the reaction. The CK group (Guy11) was labeled with 126, 127, and 128. The T group (ΔMoper1 mutant) was labeled with 129, 130, and 131.
This work adopted the 1100 HPLC System (Agilent) to separate RP with the use of the 5-μm Agilent Zorbax Extend RP column (150 mm × 2.1 mm). Later, RP gradient was conducted using mobile phases A (which contained 2% acetonitrile within the HPLC water) and B (which contained 98% acetonitrile within the HPLC water). Gradient elution conditions were as follows: 8% A in 0–8 min, 98%–95% A in 8–8.01 min, 95%–75% A in 8.01–48 min, 75%–60% A in 48–60 min, 60%–10% A in 60–60.01 min, 10% A in 60.01–70 min, 10%–98% A in 70–70.01 min, and 98% A in 70.01–75 min. After separation at the 300 μl/min fluent flow rate, we observed tryptic peptides at 210 and 280 nm. At 8–60 min later, each sample was harvested, followed by the collection of respective eluents at 1-min intervals from centrifugal tubes 1–15. Sample recycling was conducted in the above order until the completion of gradient. Mass spectrometry (MS) was later conducted on those isolated peptides.
This work adopted the Q-Exactive HF mass spectrometer (Thermo, USA) for MS analysis through using the Nanospray Flex source (Thermo, USA). Furthermore, the C18 column (15 cm × 75 μm) was utilized to load and separate samples using the EASY-nLCTM 1200 system (Thermo, USA). We set the linear gradient and flow rate at 75 min (5%–45% B in 0–63 min, 45%–90% B in 63–65 min, 90% B in 65–67 min; mobile phase A consisted of 0.1% FA contained within water, whereas mobile phase B included 0.1% FA supplemented within ACN) and 300 nl/min, separately.
This work later obtained full MS scans within the 350–1500 m/z mass range with the AGC target value and mass resolution being 3e6 and 60,000, respectively. From MS spectra, we fragmented 20 peaks with the strongest intensity through higher-energy collisional dissociation (HCD), and the collision energy was 30. The following parameters were used to obtain MS/MS spectra: resolution = 15,000, max injection time = 40 ms, and AGC target = 2e5. Using the positive mode, this work set Q Exactive HF dynamic exclusion at 30.0 s.
We utilized Proteome Discoverer (v.2.4) for searching relevant raw data thoroughly from M. oryzae genome database (https://fungidb.org/fungidb/app/record/organism/NCBITAXON_242507) using Trypsin digestion specificity. During this process, this work regarded alkylation on cysteine to be the fixed modifications. For protein quantitation, 2 or more specific spectra were obtained upon the threshold of false discovery rate (FDR) < 0.01. In the meantime, this study determined differentially expressed proteins (DEPs) upon the thresholds of p < 0.05 and fold change (FC) ≤0.83 or ≥1.2.
After obtaining DEPs, GO/KEGG enrichment analysis was performed on the differential proteins, and their functions were described. GO/KEGG function enrichment analysis method is as follows: use the species protein as the background list, then use the difference protein list as the candidate list filtered based on the background list, and determine the significant enrichment of the representative function set in the difference protein list using the hypergeometric distribution test. Later, p-value is adjusted by the Benjamini–Hochberg multiple test for obtaining FDR. The GO of adjusted p < 0.05 indicates significance. KEGG is a main public database for systematic analysis of protein metabolic pathways in cells (Bowman and Free, 2010). Use the KEGG database to analyze the differential proteins (combined with the KEGG annotation results), and determine whether DEPs are significantly enriched in all pathway entries by the hypergeometric distribution test, expressed as p-value. Data were later selected upon threshold of adjusted p < 0.05.
This work utilized TRIzol Reagent (Invitrogen, Carlsbad, CA, USA) for isolating total RNA in every sample, while total RNA content and purity were detected by the nano-drop spectrophotometer (Thermo Fisher Scientific). Later, this work chose six key genes of M. oryzae to detect gene levels through qRT-PCR. Later, nucleotide sequences were obtained from the M. oryzae genome database. In every candidate, we adopted Primer Express v3.0 software (Applied Biosystems) for designing gene primers.
For RT-PCR, this work prepared first-strand cDNA from 5 μg of total RNA with the Reverse Transcription Kit (Transgen biotech) through reverse transcription. By adopting the ABI PRISM 7700 Sequence Detection System (Applied Biosystems), this work carried out qRT-PCR on 3 individual samples with SYBR Green PCR Master Mix in a 20-μl PCR system that contained cDNA template as well as gene-specific primers. The gene MGG_03982 with stable ACTIN expression was subject to amplification using FL4738 and FL4739 primers (Supplementary Table 3) for normalizing and relative quantification (2−Δ;Δ;Ct).
This work utilized OmicsBean software (http://www.omicsbean.com:88/) for GO, KEGG, and hierarchical cluster (HCL) analyses. N-Glycosylation site prediction was carried out via the URL: https://services.healthtech.dtu.dk/service.php?NetNGlyc-1.0
We carried out a preliminary experiment to ensure that the TMT proteomics quantitative test was smoothly conducted. SDS-PAGE was performed to analyze glycoprotein extracts from M. oryzae Guy11 and ΔMoper1 mutant strains. The results showed that 6 samples had bright protein bands and high total protein levels (Figure 1); after the normal operation of the preliminary experiment, we carried out follow-up experiments.
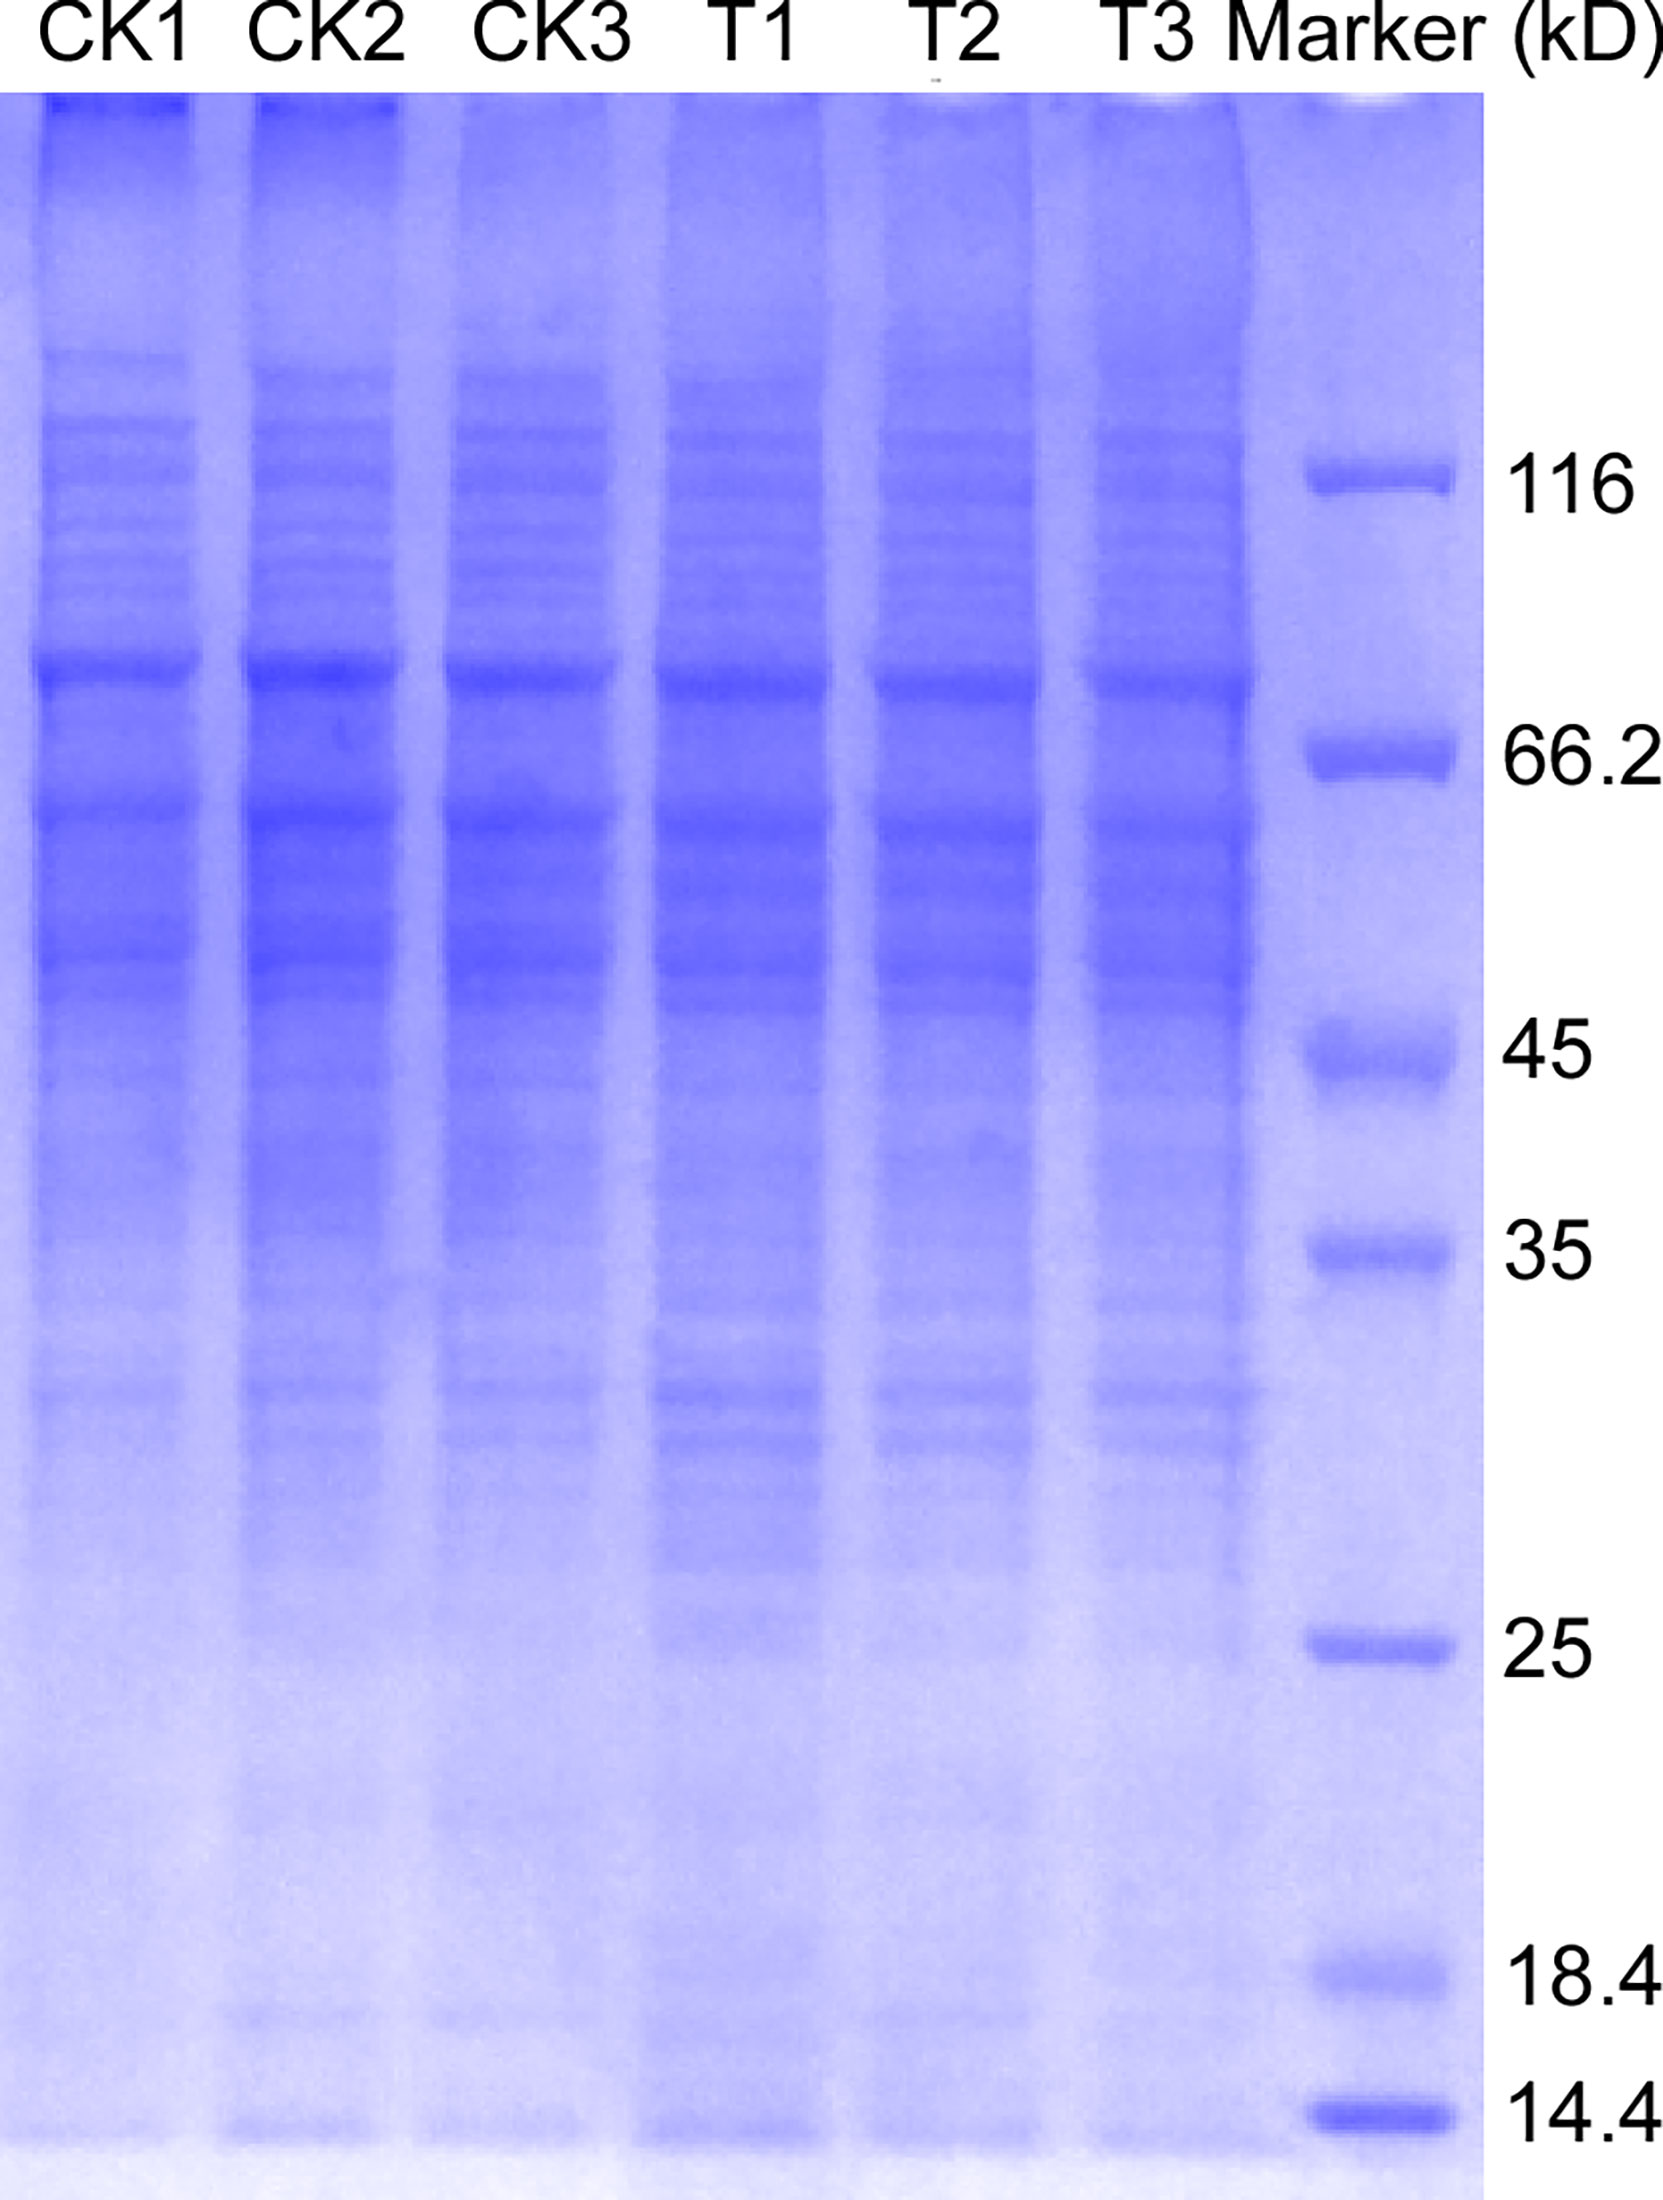
Figure 1 Glycoprotein extraction and SDS-PAGE. The total protein of M. oryzae was extracted and purified by the FOCUS™ Glycoprotein kit, and then sodium dodecyl sulfate polyacrylamide gel electrophoresis was performed. T: the ΔMoper1 mutant.
To obtain data overview, we carried out LC-MS/MS and TMT labeling on glycoproteins to compare their levels between M. oryzae, the ΔMoper1 mutant, and Guy11 strain. Proteome Discover 2.4 was applied in searching and analyzing the acquired data. We obtained altogether 2,766 proteins by 1 or more specific peptides of ≥95% confidence (Supplementary Table 1). Moreover, there were altogether 431 DEPs between the ΔMoper1 mutant and Guy11 strain, as shown in Supplementary Table 2. Of these DEPs, 230 showed upregulation, whereas 201 showed downregulation (Figure 2A). Moreover, according to the volcano plot, differentially abundant proteins (DAPs) were mostly distributed in 1.2–2.0 fold change (FC), and only a few of them showed >2.0 FC (Figure 2B). As revealed by hierarchical clustering analysis, when judging based on p-value < 0.05 and FC <0.83 or >1.2, the protein expression of the differentiated group exhibited significant difference compared with the undifferentiated group (Figure 3).
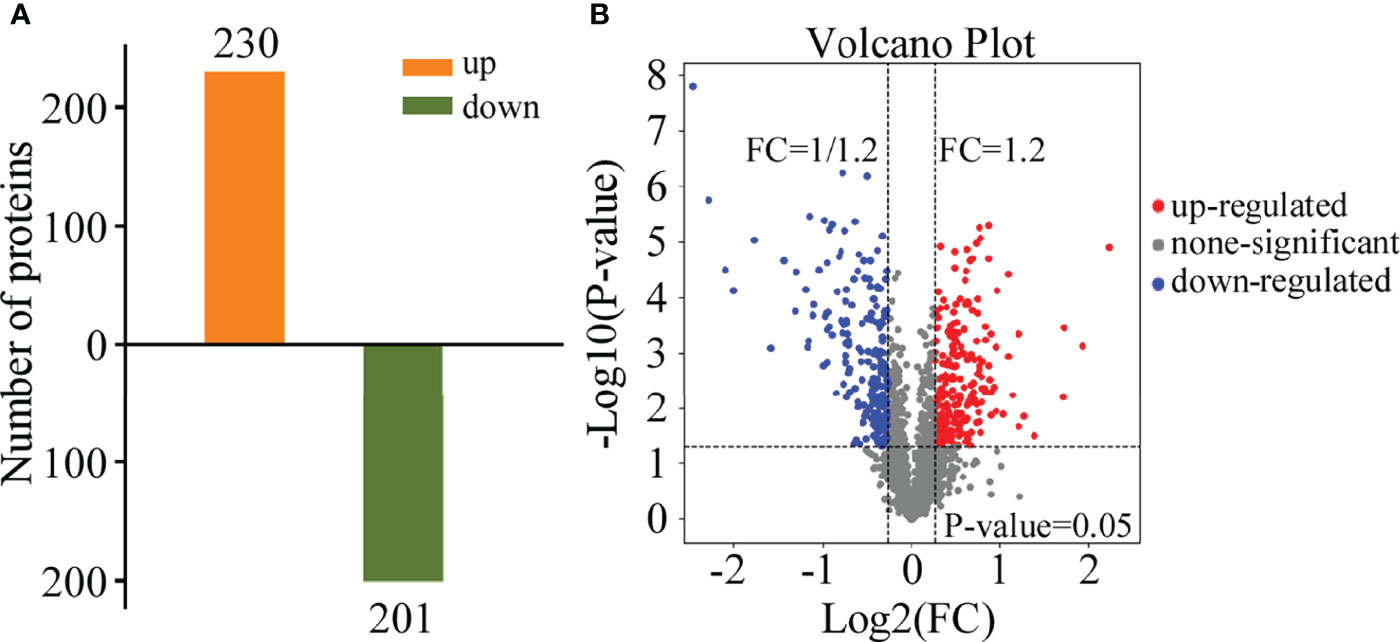
Figure 2 Differential expression protein (DEP) analysis. (A) Quantitative identifications of upregulated and downregulated proteins by TMT. (B) Distribution of the total identified protein is shown by the volcano plot. The x-axis shows various fold change groups and the y-axis shows the p-value.
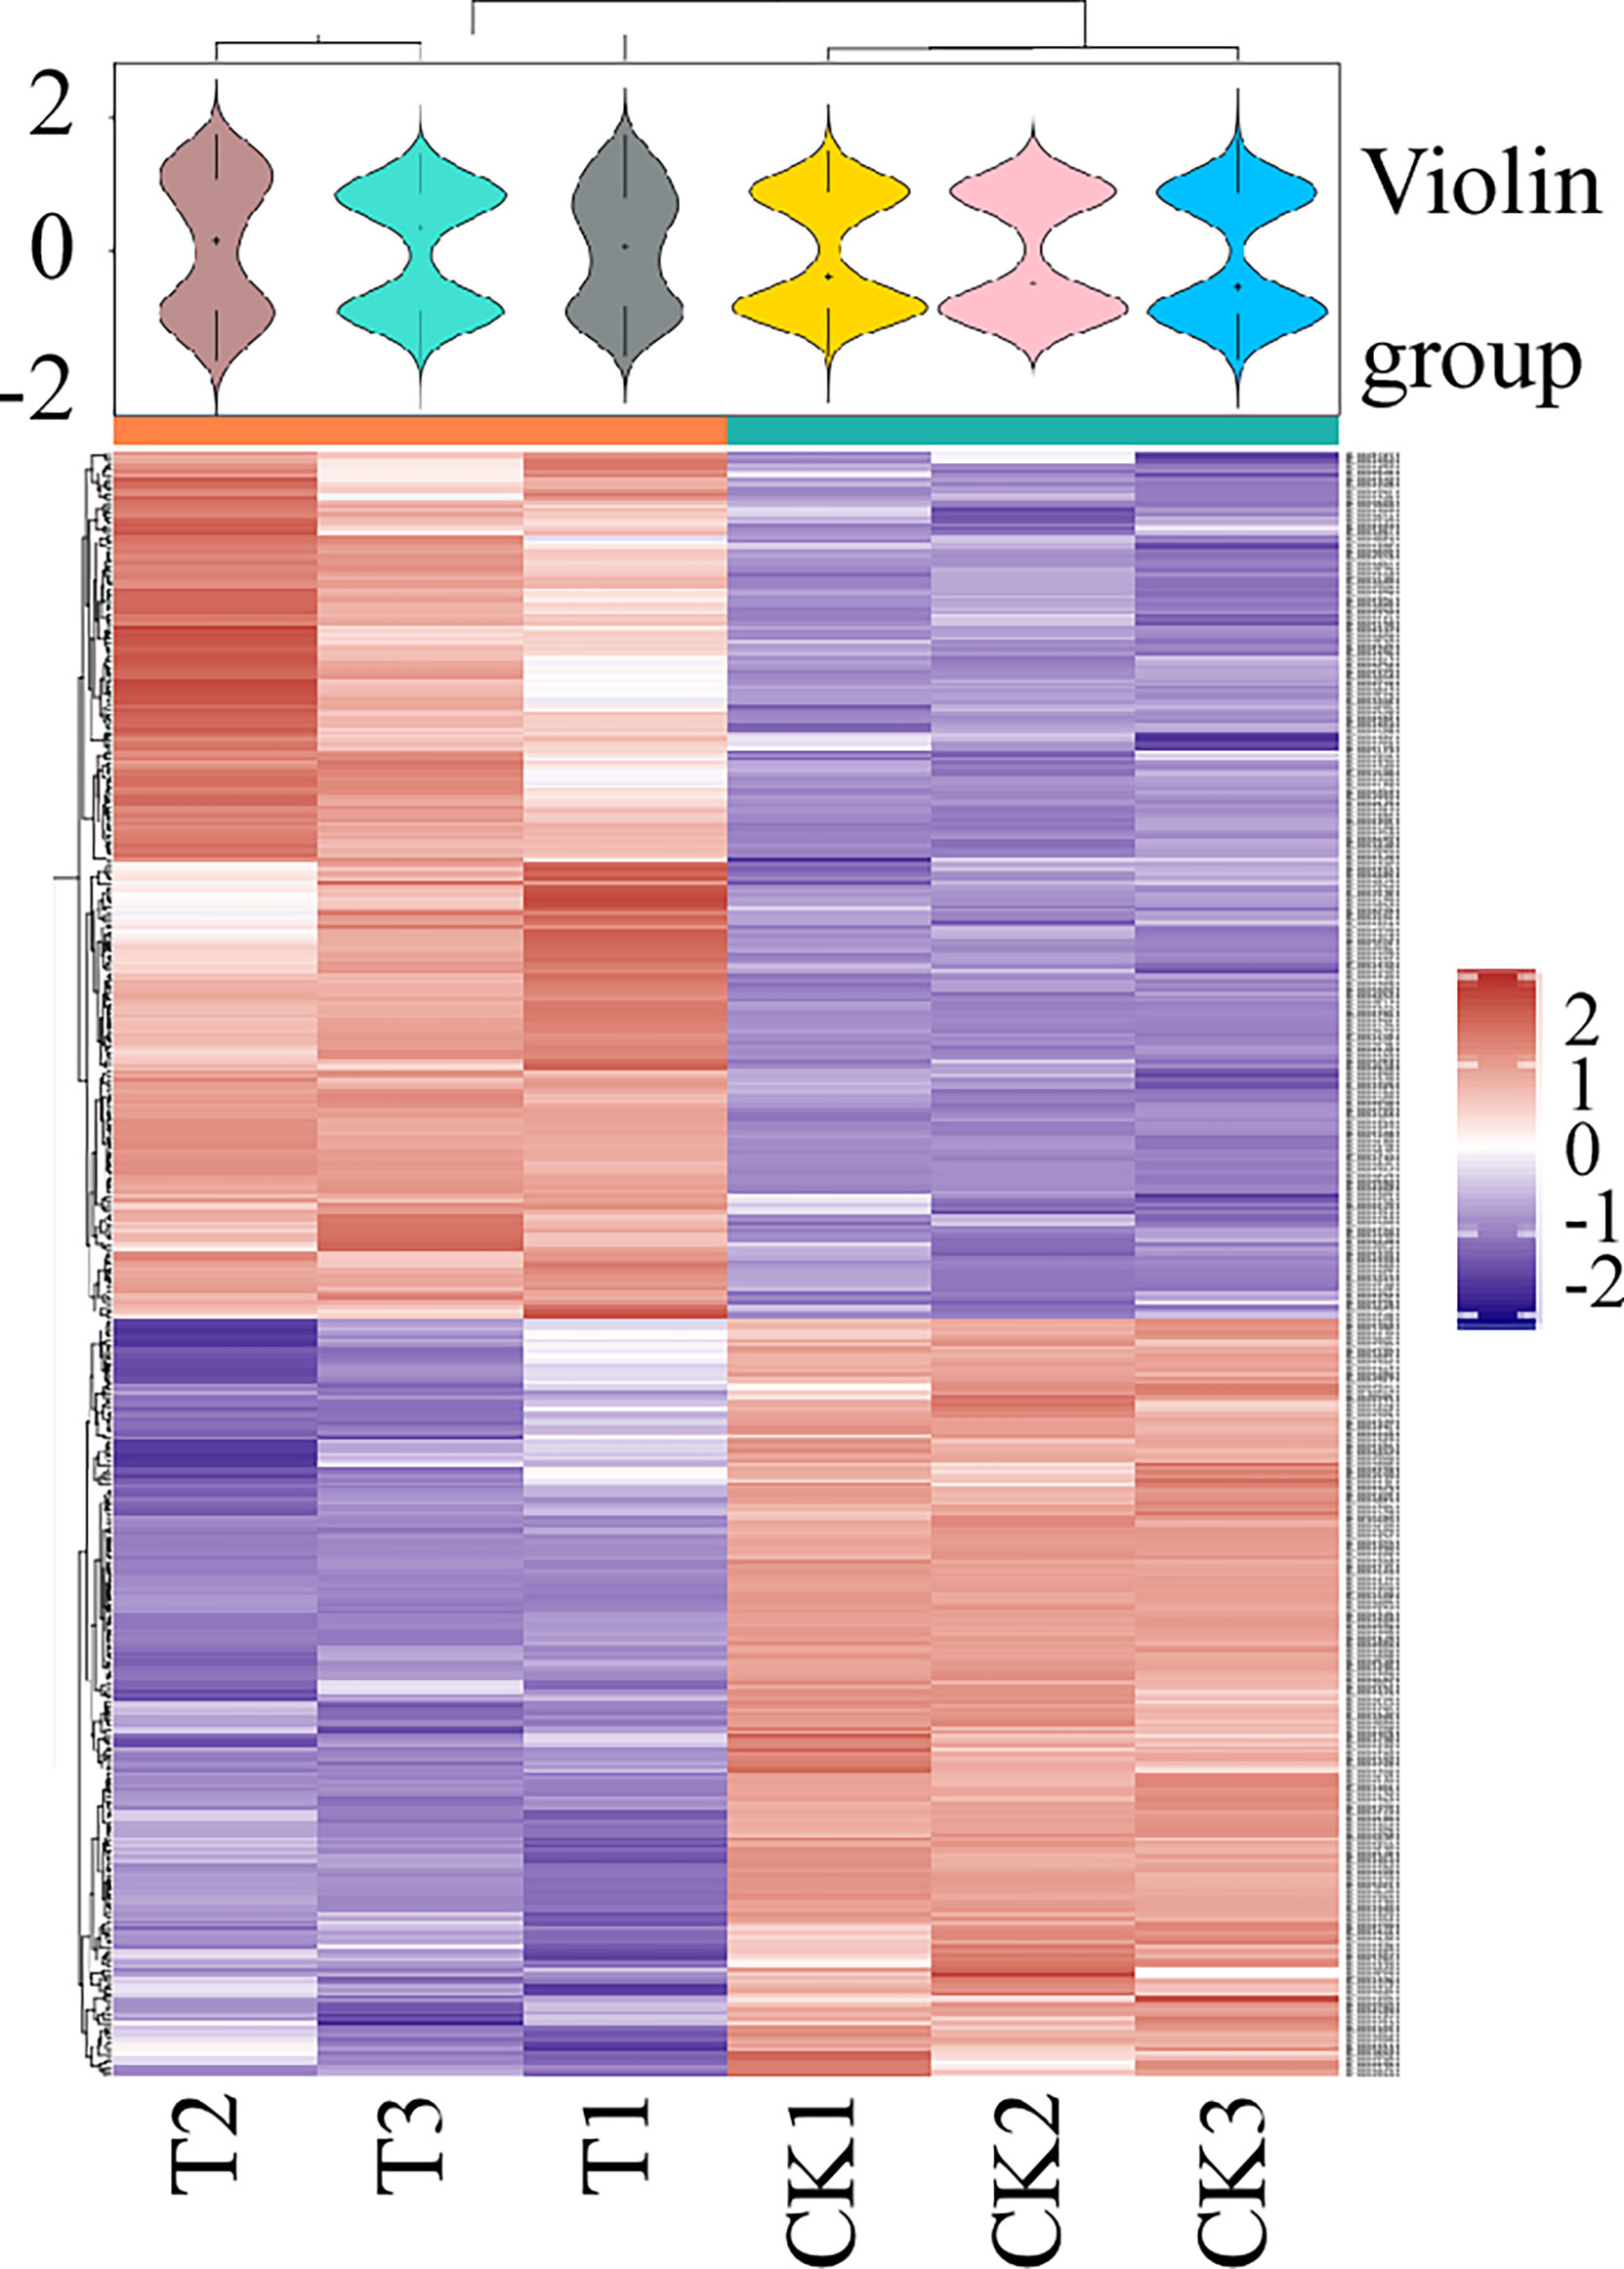
Figure 3 Hierarchical clustering was used to analyze the DEPs. Heat map shows the expression patterns of different groups. Red means a high relative expression level, whereas blue means a low relative expression level.
The GO entries corresponding to DEPs quantity >1 were screened from 3 categories, and then 10 entries were sorted in ascending order according to the −log10 p-value corresponding to each entry (Figure 4). In brief, based on classification analysis, DEPs mostly participated in biological process (BP), cellular component (CC), and molecular function (MF). In BP, the DEPs were implicated in cellular component organization or biogenesis, biological regulation, metabolic process, and cellular process. With regard to the CC category, DEPs were enriched in extracellular region, membrane, organelle, etc. In MF, DEPs were mainly enriched in catalytic activity, binding, translation regulator activity, and structural molecule activity.
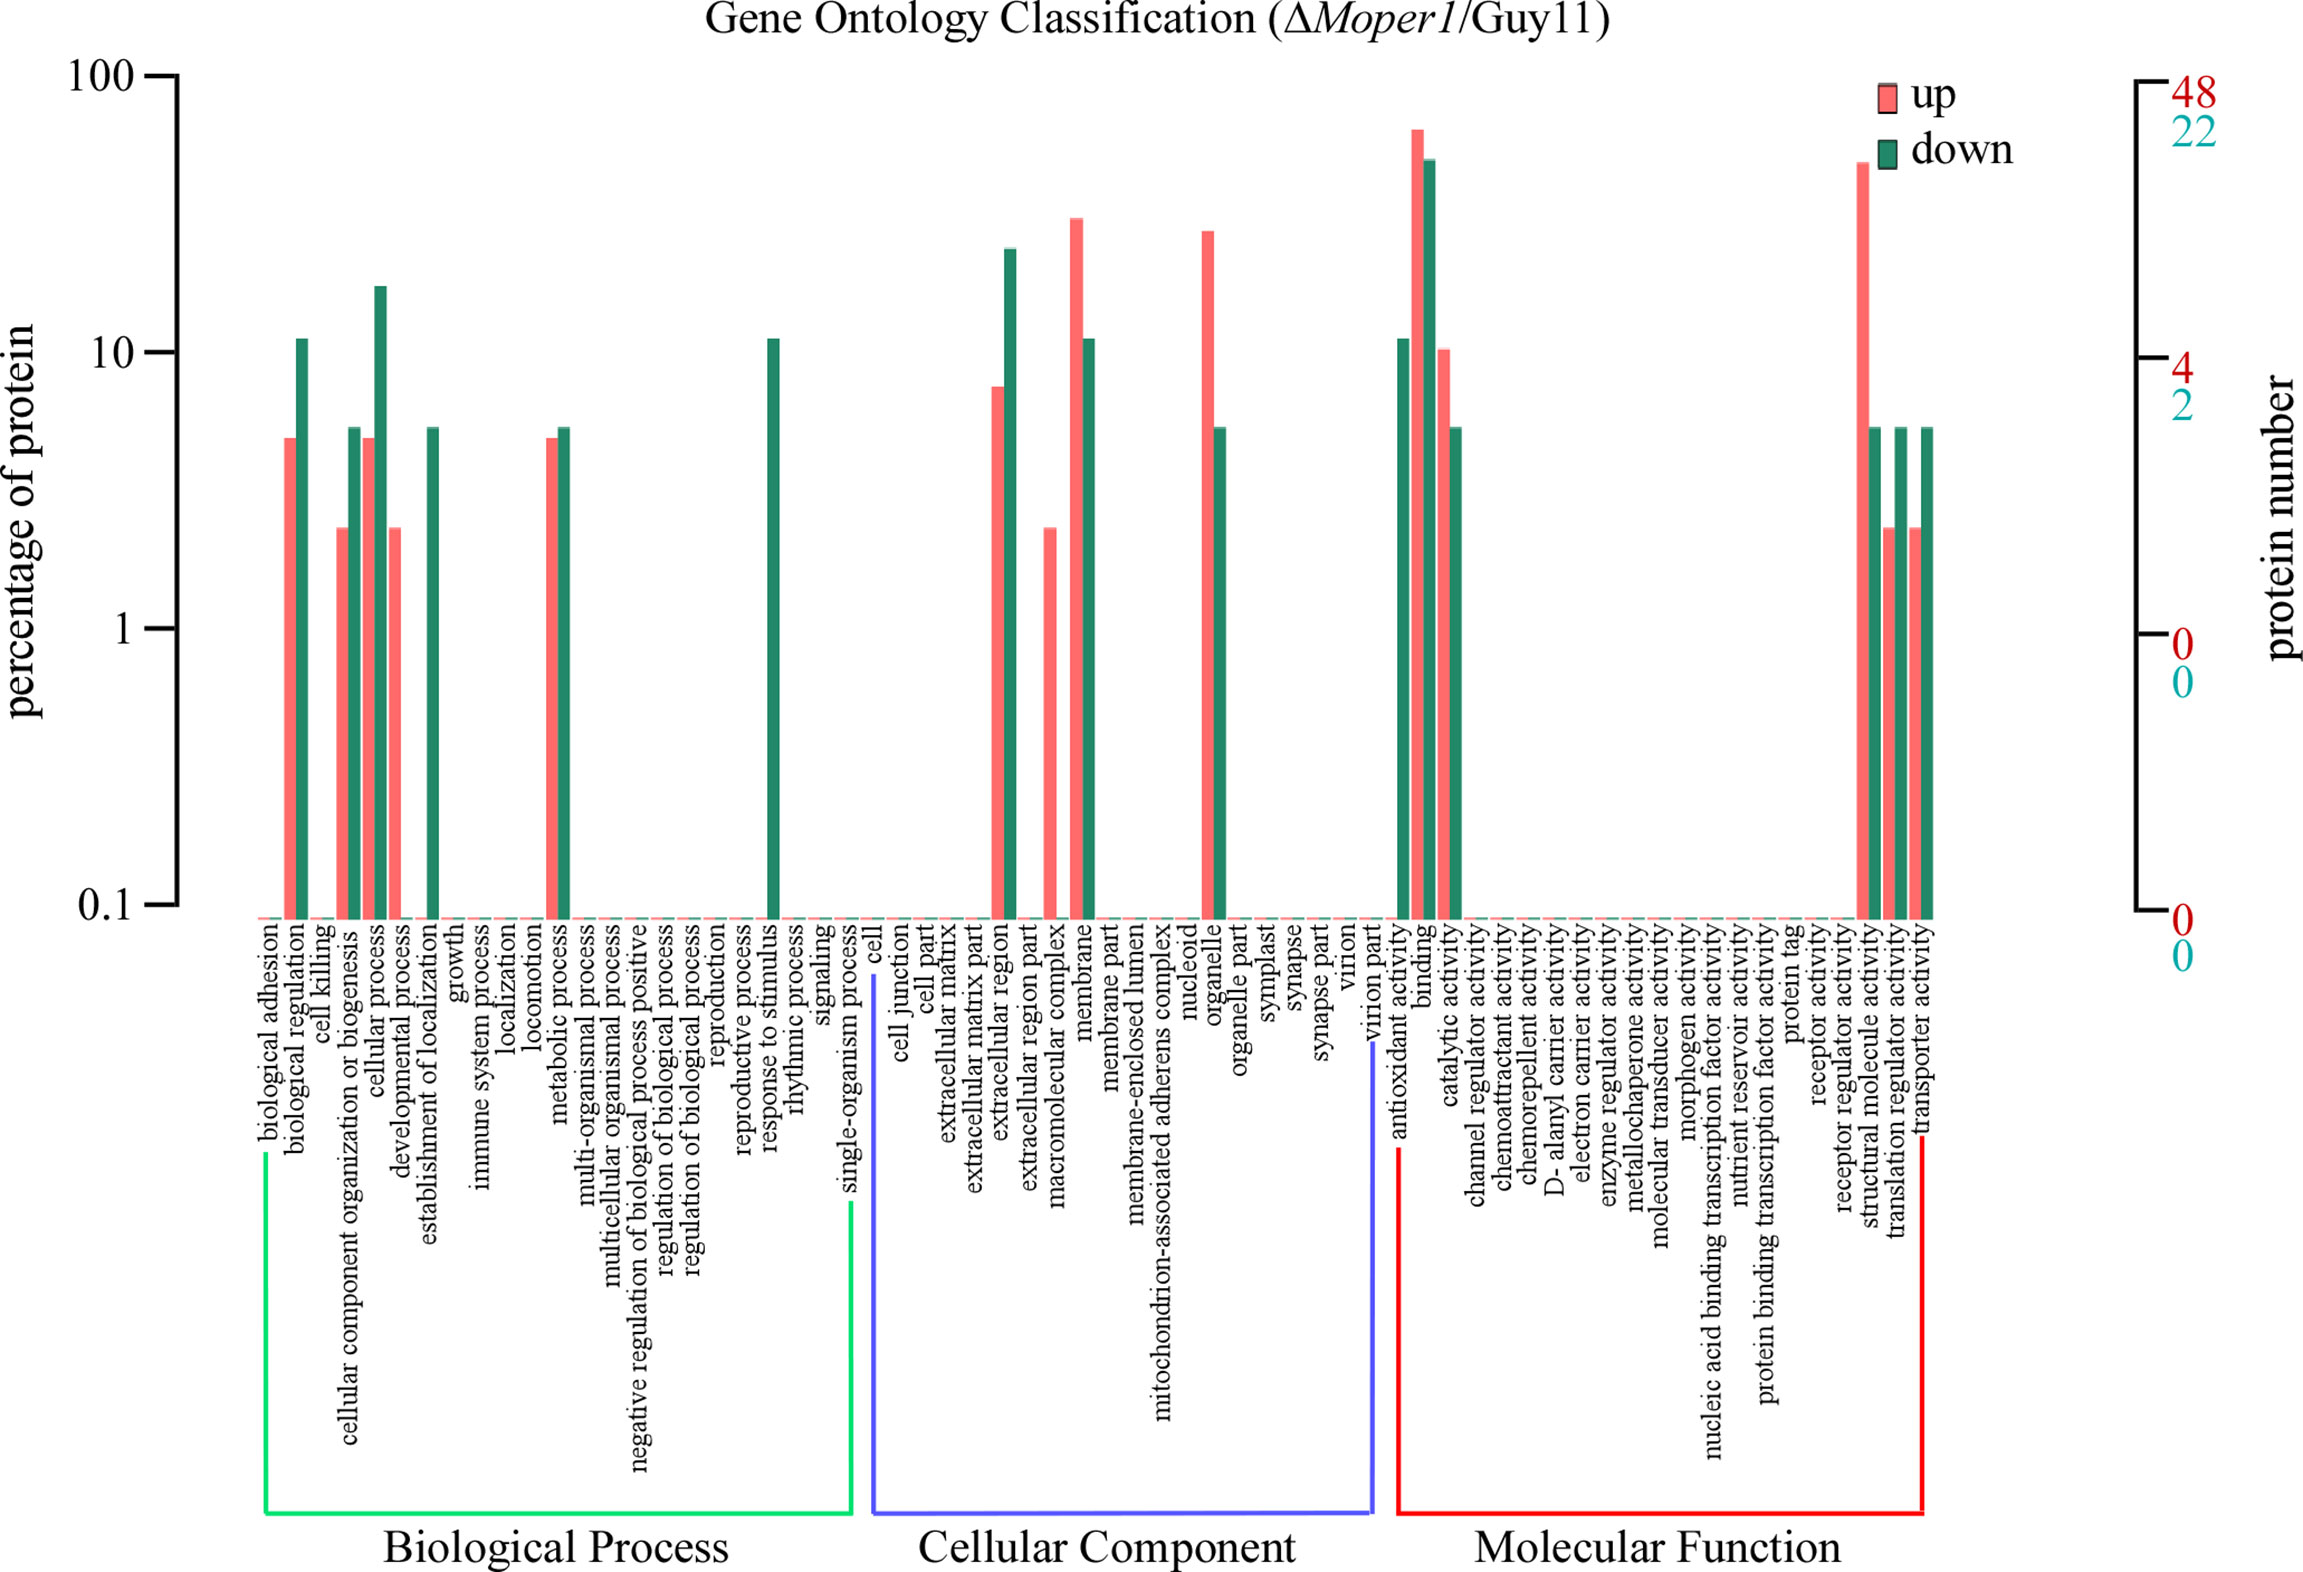
Figure 4 Comparison of the level of distribution of DEPs in GO terms. Red indicates upregulated GO entries enriched by DEPs, green indicates downregulated GO entries enriched by DEPs, the horizontal axis denotes the fixed number of entries, and the vertical axis indicates the protein number and percentage of the corresponding entry.
By analyzing the level of distribution of DEPs in the KEGG pathway, there were 18 entries, mostly related to processing of environmental information, cell process, metabolism, and processing of genetic information (Figure 5). The entry with the most DEPs was translation, including 35 with upregulation and 8 with downregulation (Figure 5). Additionally, we found 5 DEPs belonging to glycan biosynthesis and metabolism and 3 DEPs belonging to carbohydrate metabolism (Figure 5), which indicates that MoPer1 may be involved in the synthesis and metabolism of carbohydrates of M. oryzae.
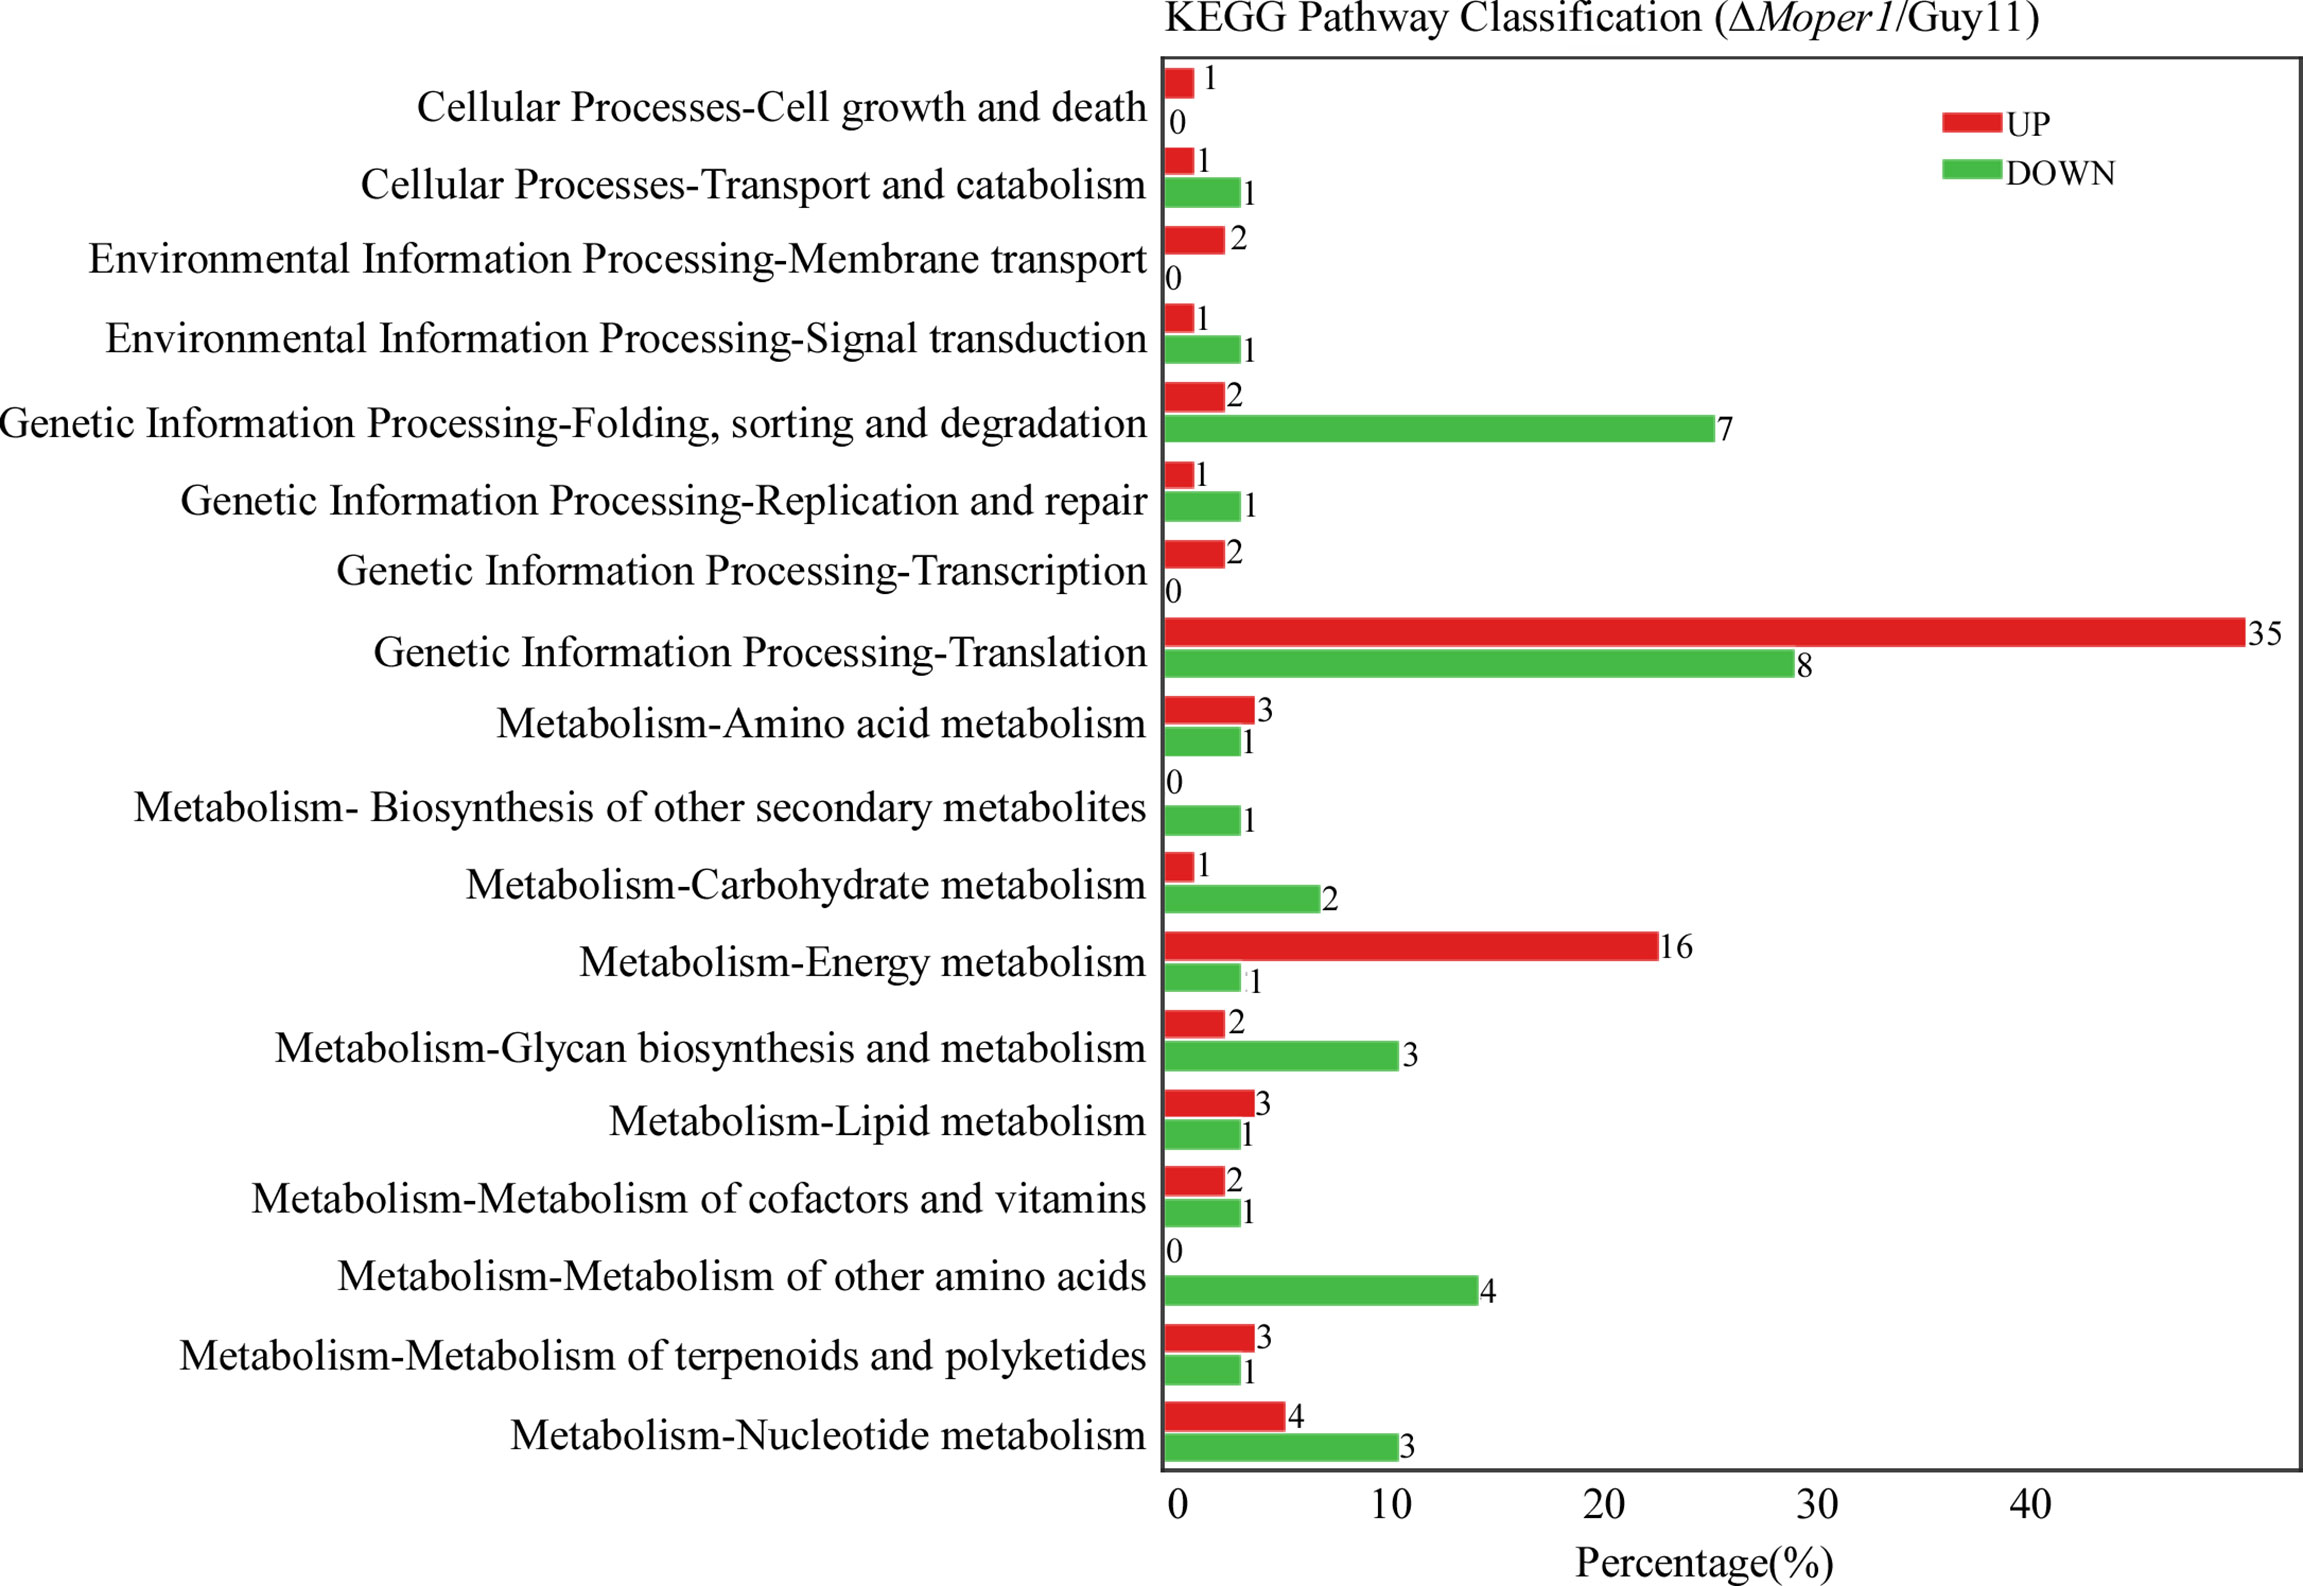
Figure 5 Comparison of the level of distribution of DEPs in the KEGG pathway. The horizontal axis denotes the ratio of the DEPs annotated to the KEGG pathway, the vertical axis represents the name of the pathway, and the numbers on the right side of the column represent the number of DEPs annotated to this pathway.
Considering that the Δ;Moper1 mutant reduced pathogenicity, we searched the proteome database for the reported proteins involved in growth, development, and pathogenicity regulated by MoPer1. Among MoPer1 regulated genes, we found that there were 14 proteins involved in growth and pathogenicity in M. oryzae, including 7 downregulated proteins and 7 upregulated proteins (Table 1). We further predicted whether these proteins have N-glycosylation sites. Interestingly, except for MoRsy1 and MoMnh6, the remaining 12 proteins all contained potential N-glycosylation sites (Table 1).
To verify the reliability of proteomic data, we selected 3 downregulated and 3 upregulated genes encoding the above pathogenic essential proteins to verify the results of the proteome, and the results indicated that MoRSY1 and MoCMK1 genes were significantly downregulated, and that MoAGL1, MoMFP1, and MoSSADH genes were significantly upregulated in the ΔMoper1 mutant, which showed good correlation with protein abundance (Figure 6). The expression of MoEmp1 protein decreased by 52% in the proteomic data however, the expression of its encoding gene was not different between the ΔMoper1 mutant and wild type (Figure 6).
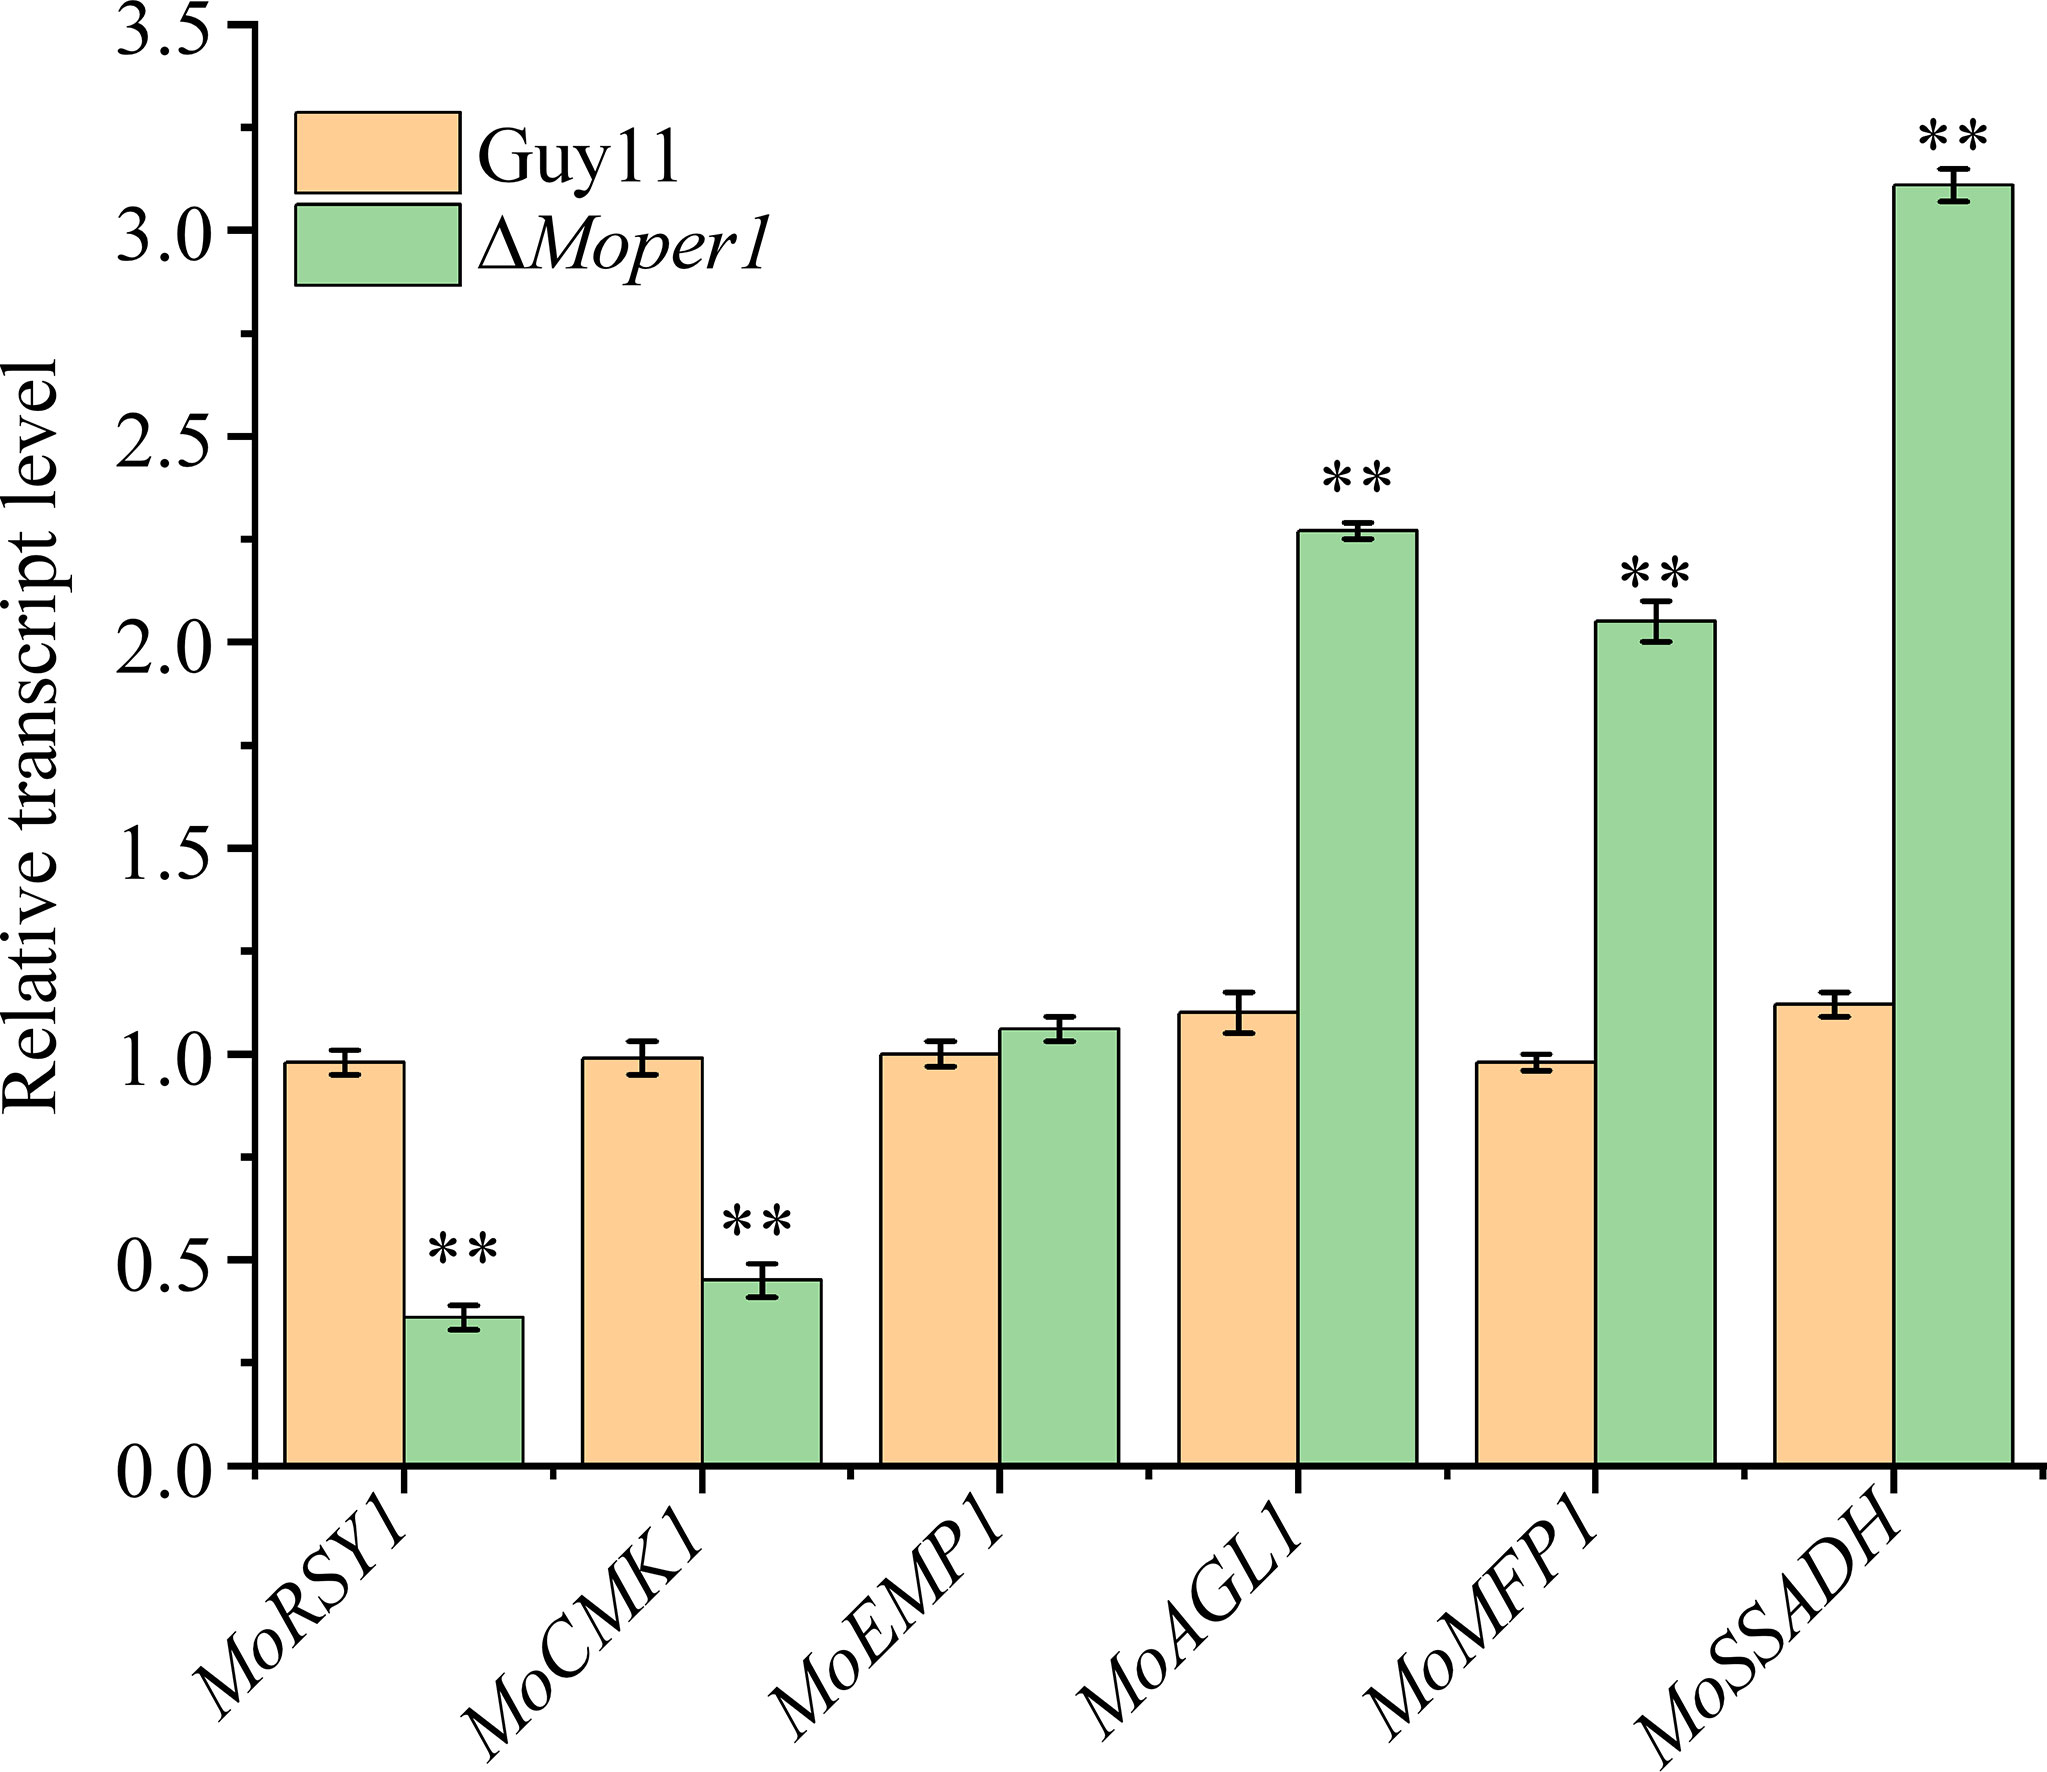
Figure 6 The expression fold changes at the mRNA levels of six DEPs that were involved in pathogenicity. Double asterisks respresent significant differences (p < 0.01).
As reported, after the MoPER1 gene was knocked out or its expression was inhibited, the fungi was defective in growth, pathogenicity, and cell wall integrity, which indicated that MoPer1 plays an important role in the growth, development and pathogenicity of M. oryzae (Chen et al., 2018; Fan et al., 2019). To investigate MoPer1 protein’s effect mechanism in M. oryzae, we applied the TMT quantitative and qualitative analysis technique to examine the DEPs between the ΔMoper1 mutant and Guy11.
According to our GO and KEGG analysis, these DEPs were involved in important biological functions. In the GO classification, DEPs were distributed in all three items and mostly associated with cell process, biological regulation, membrane, metabolic process, and molecular binding activity, and they are associated with growth and development, as well as pathogenicity of M. oryzae in a direct or indirect manner. In the KEGG pathway, we found that DEPs were involved in genetic information processing and metabolism, which was similar to the function in the GO classification. In particular, there were 8 DEPs that belonged to glycan biosynthesis and carbohydrate metabolism, indicating that deletion of MoPER1 effected the expression of the related genes. Considering that MoPer1 is a GPI phospholipase and involved in GPI-anchored protein modification, we speculate that MoPer1 is involved in both carbohydrate metabolism and glycoprotein modification, thereby participating in cell wall integrity.
The present work identified 431 DEPs, greatly affecting ribosomal protein expression, which have a critical effect on protein translation and ribosomal assembly. Notably, great attention has been paid to such ribosome-independent activities. Furthermore, the above ribosomal proteins also relate to different pathophysiological processes (Zhou et al., 2015) this also has a great influence on the biological process of the rice blast fungus. Sorted by list hit data, knocking out MoPER1 also has a huge impact on in vivo translation, and protein synthesis regulation plays a key role in eukaryotic biology through modulating homeostasis, growth, stress responses, and eukaryotic initiation. The translation initiation factor (eIF1, eIF2, eIF2B, eIF3, and eIF4G) is generally suppressed in our database; eIF3 can organize the interactions between ribosome and initiation factor and is necessary in productive translation (Lee et al., 2015), eIF-2B and eIF-4G activities have been identified as the critical factors for initiating translation (Price and Proud, 1994; Das and Das, 2016). Mitochondrial electron transport chain: Oxidative phosphorylation and oxidant production play an important role in the biological process. In the mitochondrial electron transport chain, diverse electron transfer reactions are employed for generating cell ATP by oxidative phosphorylation, MoPer1 is strongly correlated with energy metabolism, the production of ATP and NADH dehydrogenation program in the ΔMoper1 mutant is affected, and upregulation of NDUFS3 affects cell metabolism. As MoPER1 gene is knocked out, it also affects other pathways like amino acid metabolism, lipid metabolism, and carbohydrate metabolism.
Among these regulated pathogenic essential proteins, their corresponding coding genes have critical effects on M. oryzae growth, development, and pathogenicity. In previous studies, ΔMomnh6 and ΔMovpr decreased colony diameter, indicating that the deletion of these two genes affected the growth of M. oryzae (Lu et al., 2007; Guo et al., 2011). MoSfa1, MoCmk1, MoMnh6, MoArg7, MoRsy1, MoBuf1, and MoSsadh were required for conidiation, especially knockout of MoSSADH, which completely blocked conidial production (Romao and Hamer, 1992; Lu et al., 2007; Liu et al., 2010; Guo et al., 2011; Zhang et al., 2015a; Zhang et al., 2015b). More importantly, these 14 proteins were all involved in the pathogenicity on rice, and the reasons for the decreased pathogenicity of these mutants were mainly related to the reduction of appressorium formation ratio, the reduction of turgor pressure, the influence of appressorium melanin formation, etc. Except for MoEMP1, the transcript level of genes was more consistent with the proteome. As is well known, transcript level is usually, but not always, related to protein abundance. Consequently, qPCR results for those six genes conformed to TMT analysis indirectly. Considering that MoPer1 is a GPI phospholipase and potential N-glycosylation sites were predicted in 12 regulated proteins, we speculate that MoPer1 may function on some glycosylation-modified proteins to regulate the expression of these pathogenic essential proteins, and ultimately affected the normal growth, conidiogenesis, and pathogenicity of the fungi.
To summarize, we performed a quantitative proteomic analysis of TMT markers to identify the proteins regulated by MoPer1, and our results help us to further understand the molecular mechanism of MoPer1 regulating M. oryzae growth, development, and pathogenicity.
The datasets presented in this study can be found in online repositories. The names of the repository/repositories and accession number(s) can be found in the article/Supplementary Material.
YC, DZ, and YL conceived the project. YC, XW, CC, QH, CL, XZ, and XT prepared the samples and performed the research and analyzed the data. YC and XW were major contributors in writing the manuscript. DZ and YL revised the manuscript. All authors contributed to the article and approved the submitted version.
This research was supported by the Natural Science Foundation of Hunan Province (2020JJ3024), the Science and Technology Innovation Program of Hunan Province (2021RC3114), the Natural Science Foundation of China (31972323), and the Agricultural Science and Technology Innovation Program of Hunan Province (2021CX35 and 2021CX71).
The authors declare that the research was conducted in the absence of any commercial or financial relationships that could be construed as a potential conflict of interest.
All claims expressed in this article are solely those of the authors and do not necessarily represent those of their affiliated organizations, or those of the publisher, the editors and the reviewers. Any product that may be evaluated in this article, or claim that may be made by its manufacturer, is not guaranteed or endorsed by the publisher.
We thank the Shanghai LuMing biological technology co., LTD (Shanghai, China) for providing proteomics services
The Supplementary Material for this article can be found online at: https://www.frontiersin.org/articles/10.3389/fcimb.2022.926771/full#supplementary-material
Ahn, N., Kim, S., Choi, W., Im, K. H., Lee, Y. H. (2004). Extracellular Matrix Protein Gene, EMP1, Is Required for Appressorium Formation and Pathogenicity of the Rice Blast Fungus, Magnaporthe Grisea. Mol. Cells. 17, 166–173. doi: 10.1016/j.amc.2009.04.062
Ahrazem, O., Prieto, A., Leal, J. A., Giménez-Abián, M., Jiménez-Barbero, J., Bernabé, M. (2007). Fungal Cell Wall Polysaccharides Isolated From Discula Destructiva Spp. Carbohydr. Res. 342, 1138–1143. doi: 10.1016/j.carres.2007.02.011
Badaruddin, M., Holcombe, L. J., Wilson, R. A., Wang, Z. Y., Kershaw, M. J., Talbot, N. J. (2013). Glycogen Metabolic Genes Are Involved in Trehalose-6-Phosphate Synthase-Mediated Regulation of Pathogenicity by the Rice Blast Fungus Magnaporthe Oryzae. PLos Pathogens. 9, e1003604. doi: 10.1371/journal.ppat.1003604
Bowman, S. M., Free, S. J. (2010). The Structure and Synthesis of the Fungal Cell Wall. Bioessays News Rev. Mol. Cell. Dev. Biol. 28, 799–808. doi: 10.1002/bies.20441
Bradley, S., Martins-de-Souza, D., Mariana, Fioramonte (2019). A Guide to Mass Spectrometry-Based Quantitative Proteomics. Methods Mol. Biol. (Clifton N.J.). 115, 1413–1430. doi: 10.1007/978-1-4939-8994-2_1
Chen, Y., Wu, X., Li, C., Zeng, Y., Tan, X., Zhang, D., et al. (2018). MoPer1 Is Required for Growth, Conidiogenesis, and Pathogenicity in Magnaporthe Oryzae. Rice 11, 64. doi: 10.1186/s12284-018-0255-9
Das, S., Das, B. (2016). Eif4g - An Integrator of mRNA Metabolism? FEMS Yeast Res. 16, 1–9. doi: 10.1093/femsyr/fow087
Fan, X., Haruna, M., Wang, Y., Yang, Y., Liu, H. (2019). Microenvironmental Interplay Predominated by Beneficial Aspergillus Abates Fungal Pathogen Incidence in Paddy Environment. Environ. Sci. technology. 53, 13042–13052. doi: 10.1021/acs.est.9b04616
Fujita, M., Jigami, Y. (2008). Lipid Remodeling of GPI-Anchored Proteins and its Function. Biochim. Et Biophys. Acta Gen. Subjects. 1780, 410–420. doi: 10.1016/j.bbagen.2007.08.009
Fujita, M., Kinoshita, T. (2012). GPI-Anchor Remodeling: Potential Functions of GPI-Anchors in Intracellular Trafficking and Membrane Dynamics. Biochim. ET Biophys. Acta 1821, 1050–1058. doi: 10.1016/j.bbalip.2012.01.004
Fujita, M., Umemura, M., Yoko-O, T., Jigami, Y. (2007). PER1 Is Required for GPI-Phospholipase A2 Activity and Involved in Lipid Remodeling of GPI-Anchored Proteins. Mol. Biol. Cell. 17, 5253–5264. doi: 10.1091/mbc.e06-08-0715
Fujita, M., Yoko-O, T., Jigami, Y. (2006). Inositol Deacylation by Bst1p Is Required for the Quality Control of Glycosylphosphatidylinositol-Anchored Proteins. Mol. Biol. Cell. 17, 834–850. doi: 10.1091/mbc.e05-05-0443
Gastebois, A., Fontaine, T., Latge, J. P., Mouyna, I. (2010). β(1-3)Glucanosyltransferase Gel4p Is Essential for Aspergillus Fumigatus. Eukaryotic. Cell. 9, 1294–1298. doi: 10.1128/EC.00107-10
Guo, M., Chen, Y., Du, Y., Dong, Y., Guo, W., Zhai, S., et al. (2011). The bZIP Transcription Factor MoAP1 Mediates the Oxidative Stress Response and Is Critical for Pathogenicity of the Rice Blast Fungus Magnaporthe Oryzae. PLos Pathogens. 7, e1001302. doi: 10.1371/journal.ppat.1008196
Guo, B., Styles, C., Feng, Q., Fink, G. (2000). A Saccharomyces Gene Family Involved in Invasive Growth, Cell-Cell Adhesion, and Mating. Proc. Natl. Acad. Sci. U. S. A. 97, 12158–12158. doi: 10.1073/pnas.220420397
Hiroyuki, M., Hisao, H., Naoka, K. (2019). Determination of Protein Molecular Weights on SDS-PAGE. Methods Mol. Biol. 1855, 101–105. doi: 10.1007/978-1-4939-8793-1_10
Kapteyn, J., Ende, H., Klis, F. (1999). The Contribution of Cell Wall Proteins to the Organization of the Yeast Cell Wall. Biochim. Biophys. Acta 1426, 373–383. doi: 10.1016/s0304-4165(98)00137-8
Lee, A., Kranzusch, P., Cate, J. (2015). Eif3 Targets Cell-Proliferation Messenger RNAs for Translational Activation or Repression. Nature 522, 111–114. doi: 10.1038/nature14267
Liu, X., Lu, J., Dong, B., Gu, Y., Lin, F. (2010). Disruption of MoCMK1, Encoding a Putative Calcium/Calmodulin-Dependent Kinase, in Magnaporthe Oryzae. Microbiological. Res. 165, 402–410. doi: 10.1016/j.micres.2009.08.007
Liu, X., Zhou, Q., Guo, Z., Liu, P., Zhang, Z. (2020). A Self-Balancing Circuit Centered on MoOsm1 Kinase Governs Adaptive Responses to Host-Derived ROS in Magnaporthe Oryzae. eLife Sci. 9, e61605. doi: 10.7554/eLife.61605
Lu, J., Feng, X., Liu, X., Qin, L., Wang, H., Lin, F. (2007). Mnh6, a Nonhistone Protein, Is Required for Fungal Development and Pathogenicity of Magnaporthe Grisea. Fungal Genet. Biol. 44, 819–829 doi: 10.1016/j.fgb.2007.06.003
Orlean, P., Menon, A. (2007). Thematic Review Series: Lipid Posttranslational Modifications. GPI Anchoring of Protein in Yeast and Mammalian Cells, or: How We Learned to Stop Worrying and Love Glycophospholipids. J. Lipid Res. 48, 993–1011. doi: 10.1194/jlr.R700002-JLR200
Price, N., Proud, C. (1994). The Guanine Nucleotide-Exchange Factor, eIF-2b. Biochimie. 76, 748. doi: 10.1016/0300-9084(94)90079-5
Romao, J., Hamer, R. (1992). Genetic Organization of a Repeated DNA Sequence Family in the Rice Blast Fungus. Proc. Natl. Acad. Sci. U. S. A. 89, 5316–5320. doi: 10.1073/pnas.89.12.5316
Tucker, S., Besi, M., Galhano, R., Franceschetti, M., Goetz, S., Lenhert, S., et al. (2010). Common Genetic Pathways Regulate Organ-Specific Infection-Related Development in the Rice Blast Fungus. Plant Cell. 22, 953–972. doi: 10.1105/tpc.109.066340
Viaud, M. C., Balhadère, P. V., Talbot, N. J. (2002). A Magnaporthe Grisea Cyclophilin Acts as a Virulence Determinant During Plant Infection. Plant Cell Online. 14, 917–930. doi: 10.1105/tpc.010389
Wang, Z., Soanes, D. M., Kershaw, M. J., Talbot, N. J. (2007). Functional Analysis of Lipid Metabolism in Magnaporthe Grisea Reveals a Requirement for Peroxisomal Fatty Acid β-Oxidation During Appressorium-Mediated Plant Infection. Mol. Plant-Microbe Interact. 20, 475–491. doi: 10.1109/54.844339
Zhang, Y., Shi, H., Liang, S., Ning, G., Xu, N., Lu, J., et al. (2015a). MoARG1, MoARG5,6 and MoARG7 Involved in Arginine Biosynthesis Are Essential for Growth, Conidiogenesis, Sexual Reproduction, and Pathogenicity in Magnaporthe Oryzae. Microbiological. Res. 180, 11–22. doi: 10.1016/j.micres.2015.07.002
Zhang, Z., Wang, J., Chai, R., Qiu, H., Hua, J., Mao, X., et al. (2015b). An S-(Hydroxymethyl)Glutathione Dehydrogenase Is Involved in Conidiation and Full Virulence in the Rice Blast Fungus Magnaporthe Oryzae. PLos One 10, e0120627. doi: 10.1371/journal.pone.0120627
Keywords: MoPer1, proteomics, differentially expressed proteins, pathogenic protein, qRT-PCR validation
Citation: Chen Y, Wu X, Chen C, Huang Q, Li C, Zhang X, Tan X, Zhang D and Liu Y (2022) Proteomics Analysis Reveals the Molecular Mechanism of MoPer1 Regulating the Development and Pathogenicity of Magnaporthe oryzae. Front. Cell. Infect. Microbiol. 12:926771. doi: 10.3389/fcimb.2022.926771
Received: 23 April 2022; Accepted: 19 May 2022;
Published: 24 June 2022.
Edited by:
Yingzi Yun, Fujian Agriculture and Forestry University, ChinaReviewed by:
Huakun Zheng, Fujian Agriculture and Forestry University, ChinaCopyright © 2022 Chen, Wu, Chen, Huang, Li, Zhang, Tan, Zhang and Liu. This is an open-access article distributed under the terms of the Creative Commons Attribution License (CC BY). The use, distribution or reproduction in other forums is permitted, provided the original author(s) and the copyright owner(s) are credited and that the original publication in this journal is cited, in accordance with accepted academic practice. No use, distribution or reproduction is permitted which does not comply with these terms.
*Correspondence: Yong Liu, aGFvYXNsaXVAMTYzLmNvbQ==; Deyong Zhang, ZHl6aGFuZzc4QDE2My5jb20=
†These authors have contributed equally to this work
Disclaimer: All claims expressed in this article are solely those of the authors and do not necessarily represent those of their affiliated organizations, or those of the publisher, the editors and the reviewers. Any product that may be evaluated in this article or claim that may be made by its manufacturer is not guaranteed or endorsed by the publisher.
Research integrity at Frontiers

Learn more about the work of our research integrity team to safeguard the quality of each article we publish.