
95% of researchers rate our articles as excellent or good
Learn more about the work of our research integrity team to safeguard the quality of each article we publish.
Find out more
ORIGINAL RESEARCH article
Front. Cell. Infect. Microbiol. , 30 June 2022
Sec. Clinical Microbiology
Volume 12 - 2022 | https://doi.org/10.3389/fcimb.2022.909111
This article is part of the Research Topic Hot Trends in Computer-Aided Drug Design Techniques View all 6 articles
 Vikas Kumar1†
 Shraddha Parate2†
 Danishuddin1
 Amir Zeb3Pooja Singh2Gihwan Lee2
 Tae Sung Jung4
 Keun Woo Lee1
 Min Woo Ha5,6*
Spleen tyrosine kinase (SYK) is an essential mediator of immune cell signaling and has been anticipated as a therapeutic target for autoimmune diseases, notably rheumatoid arthritis, allergic rhinitis, asthma, and cancers. Significant attempts have been undertaken in recent years to develop SYK inhibitors; however, limited success has been achieved due to poor pharmacokinetics and adverse effects of inhibitors. The primary goal of this research was to identify potential inhibitors having high affinity, selectivity based on key molecular interactions, and good drug-like properties than the available inhibitor, fostamatinib. In this study, a 3D-QSAR model was built for SYK based on known inhibitor IC50 values. The best pharmacophore model was then used as a 3D query to screen a drug-like database to retrieve hits with novel chemical scaffolds. The obtained compounds were subjected to binding affinity prediction using the molecular docking approach, and the results were subsequently validated using molecular dynamics (MD) simulations. The simulated compounds were ranked according to binding free energy (ΔG), and the binding affinity was compared with fostamatinib. The binding mode analysis of selected compounds revealed that the hit compounds form hydrogen bond interactions with hinge region residue Ala451, glycine-rich loop residue Lys375, Ser379, and DFG motif Asp512. Identified hits were also observed to form a desirable interaction with Pro455 and Asn457, the rare feature observed in SYK inhibitors. Therefore, we argue that identified hit compounds ZINC98363745, ZINC98365358, ZINC98364133, and ZINC08789982 may help in drug design against SYK.
Kinases are a type of enzyme that can transfer high-energy phosphate from adenosine triphosphate to a substrate (Gagic et al; Duong-Ly and Peterson, 2013). The phosphorylation event modulates enzyme activity or communication with other molecules, leading to various biological reactions (Graves and Krebs, 1999). Tyrosine kinases are classified into receptor and non-receptor tyrosine kinases (NRTK) (Siveen et al., 2018). Spleen tyrosine kinase (SYK) is a cytoplasmic NRTK of hematopoietic lineage cells (Kobayashi et al., 1990). It was originally cloned from the cDNA of the porcine spleen, hence named SYK (Taniguchis et al., 1991). The SYK gene is situated at chromosome number nine, encoding a 629-amino-acid-long protein (Shao et al., 2021). The SYK gene is characterized by the C-terminal kinase domain ranging from 371 to 631 amino acids and two Src homology (SH2) domains: SH2 1 (15–107 residues) and SH2 2 (168–259 residues) at the N-terminal. The two SH2 domains are linked by interdomain A (108–167 residues), and the SH2 2 domain is linked to the kinase domain by interdomain B (260–370 residues) (Mócsai et al., 2010). SYK is present in an auto-inhibited form in the resting state; when antigen binds to the immunoreceptor, the Lyn protein tyrosine kinase gets activated and subsequently phosphorylates the immunoreceptor’s tyrosine-based activation motif (ITAM). As a result, SYK’s SH2 domains bind to phosphorylated ITAM, causing conformational changes in the kinase domain and eventually releasing the kinase (Kaur et al., 2013; Shao et al., 2021). The activated SYK then induces the signaling cascade to regulate the immune cell functions via phosphorylation of target cells. SYK is expressed in cell types such as B-cells, mast cells, macrophages, platelets, neutrophils, and cancer cells (Mócsai et al., 2010; Pamuk and Tsokos, 2010). SYK has been reported to contribute to various immune responses, counting cytokine production, histamine release, phagocytosis, reactive oxygen species (ROS), cell proliferation, differentiation, etc. (Currie et al., 2014; Thoma et al., 2015a). SYK acts as a pivotal protein in the downstream IgE/FcRI (FcεRI) signaling pathway to trigger allergic reactions (Nam et al., 2018; Hong et al., 2020). SYK is also important for the signaling cascade of B-cell receptors; a lack of SYK may result in the absence of mature B cells (Cheng et al., 1995; Turner et al., 1995). Recent studies indicated that SYK might regulate mitosis, differentiation, adhesion, and motility in non-hematopoietic cells such as epithelial and endothelial cells, and hepatocytes (Shao et al., 2021). Owing to the multiple roles of SYK in the cell, the dysfunction of SYK signaling has been reported in various diseases and disorders such as allergic rhinitis, asthma, autoimmune disease rheumatoid arthritis, psoriasis, systematic lupus erythematosus, leukemia, and lymphomas (Kaur et al., 2013). Therefore, several pharmaceutical companies, as well as academic institutions, have invested in the discovery of drug candidates against SYK. Several promising compounds based on naphthyridines, pyrimidine, imidazopyrimidine, and pyrido-thiazole scaffolds were identified during early drug development attempts against SYK but were not considered for clinical use due to poor pharmacokinetic profiles (Farmer et al., 2008; Hirabayashi et al., 2008; Liddle et al., 2011; Thoma et al., 2015b). However, some potential compounds such as PRT062607, R343, R112, and entospletinib (GS-9973) are among the SYK inhibitors that have entered clinical trials and are being examined for a variety of therapeutic uses (Liu and Mamorska-Dyga, 2017; Shao et al., 2021). Recently, the FDA has authorized the fostamatinib drug, developed by Rigel Pharmaceuticals to treat adult patients with immune thrombocytopenia (Mullard, 2018). A literature survey confirms that available drug options are limited against SYK as it has been reported in multiple diseases, and therefore there is a continuous need for SYK inhibitors. Over a thousand small compounds have been identified against SYK using various chemical bioassays. This information provides a good foundation for comprehending the structure–activity relationship between these molecules, making it simpler to discover novel SYK inhibitors. Therefore, the goal of the present study is to develop a pharmacophore model based on the quantitative structure–activity relationship (QSAR) using known inhibitors’ activity data. The pharmacophore models were validated via the test set and fisher randomization methods. The hypothesis was then used to screen the natural product database ZINC to retrieve potential compounds which could be used against SYK. We employed a molecular docking study to predict the binding affinity of the retrieved compounds with SYK, and results were subsequently authenticated by molecular dynamics simulations. Finally, hit compounds were selected on the basis of better binding free energy and key molecular interactions than reference drug fostamatinib and proposed as novel SYK inhibitors for further studies.
The selection of chemical scaffolds is a decisive step for developing a 3D-QSAR pharmacophore model because this determines the characteristic of the pharmacophores generated (John et al., 2011). One of the essential requirements for generating 3D QSAR is experimentally tested compounds using the same bioassay (Sakkiah and Lee, 2012). We performed the literature search and selected 180 SYK inhibitors whose activity was determined using the same bioassay (Lucas et al., 2012; Padilla et al., 2013; Lucas et al., 2014). The 2D chemical structures of the inhibitors were dawn with BIOVIA draw v2021 and after that changed to 3D in Discovery Studio (DS) v19 (www.accelrys.com). Duplicate compounds were removed to ensure further statistical relevance, and compounds with diverse chemical scaffolds were selected. The three-dimensional conformation of inhibitors was energy minimized in DS with the Steepest Descent algorithm. The remaining compounds were divided into training and test sets following four orders of magnitude in their biological activities. The training set compounds were used to build the pharmacophore hypothesis, and the test set was used to validate the hypothesis (Kumar et al., 2015). The IC50 values of the selected training set compounds reported against SYK were in the range of 1 to 31,623 nmol/L. The training set compounds were classified into three categories as active (IC50 <10 nmol/L +++), moderately active (IC50 <100 nmol/L ++), and inactive (IC50 <1,000 nmol/L +), based on their IC50 values. Similar criteria were used for test set classification.
Pharmacophore modeling is an effective and time-saving approach for identification of new scaffolds, and it may be constructed using either ligands or structure of the target biomolecule. The ligand-based hypothesis can be further developed using a common feature of most active ligands or using the structure–activity relationship of the training set compounds (Sakkiah et al., 2010; Kaserer et al., 2015; Mali and Pandey, 2021). In the current study, we utilized knowledge of available SYK inhibitors’ biological activity data to build a 3D QSAR pharmacophore model. The 3D QSAR Pharmacophore Generation module of DS was used to create quantitative pharmacophores. To find the important characteristics in the training set compounds, the Feature Mapping module in DS was exploited. The knowledge of feature mapping results was subsequently utilized for the generation of the hypothesis. Before hypothesis generation, the uncertainty value was fixed at 3, representing the ratio of the real activities to the observed biological activity for each compound (Kumar et al., 2015). At the same time, other parameters were kept as default. The minimum and maximum numbers of features were set to 0 to 5 during the quantitative hypothesis generation. The best hypothesis was chosen among 10 generated models using the following criteria: highest correlation coefficient (R2), lowest total cost, fit values, and root mean square deviation (RMSD) (Sakkiah and Lee, 2012).
The selected hypothesis was validated using test set analysis and Fischer’s randomization test (Kumar et al., 2015). The statistical relevance of the hypothesis was assessed using Fischer’s method. The hypothesis is considered significant if the overall total cost is lower than the randomly generated hypothesis (Sakkiah and Lee, 2012; Kumar et al., 2015). Using confidence level 95%, the Hypogen algorithm of DS generates 19 random spreadsheets during the Fischer’s test. The test set approach was also employed to see if the selected hypothesis could correctly predict and categorize the chemical compounds based on their biological activity scale. Randomly 19 compounds were selected with four orders of magnitude from similar literature sources, used to generate the hypothesis. The test set compounds were then mapped on the selected hypothesis using the Ligand Pharmacophore Mapping function of DS with the BEST algorithm and flexible-fitting method (Kumar et al., 2015).
Virtual screening is a computational procedure commonly used to screen chemical compound libraries to filter false binders. We used our validated QSAR model to screen the natural products (144,766) in the ZINC database (https://zinc.docking.org/). Initially, a drug-like database was prepared using commonly used filters such as Lipinski’s Rule of Five (Ro5), Veber’s, and ADMET (absorption, distribution, metabolism, excretion, and toxicity) to reduce computational cost (Lipinski et al., 2001; Veber et al., 2002; Parate et al., 2021a). As explained in the previous literature, the aforementioned drug-like rules collectively oversee compounds’ proficient retrieval based on their pharmacokinetics and physiochemical properties. The drug-like database so obtained was screened to examine and retain only the natural products able to map chemical features of the QSAR model (Sundarapandian et al., 2010). Subsequently, the mapped ZINC natural compounds have proceeded to molecular docking with the 3D X-ray structure of the SYK protein.
According to the extensive examination of published structures for SYK, there are 62 distinct inhibitor-bound structures deposited in the protein data bank (PDB). As a result, choosing an appropriate structure for molecular docking is a difficult choice; however, based on previous docking studies, researchers suggested a few key points to make a good selection, such as resolution of structure <2Å, binding with a well-known inhibitor, key molecular interaction, fewer missing residues, and mutations (Bender et al., 2021). Careful inspection of these parameters reveals that the recently published SYK structure bound with clinical candidate drug lanraplenib (PDB ID: 6VOV) is of a good choice for molecular docking-based study (Blomgren et al., 2020). The selected structure was obtained from PDB and prepared in DS using the Clean Protein module. The unwanted molecules were deleted, and gaps were filled. Subsequently, the structure was minimized using the Steepest Descent algorithm of DS and saved in PDB format for molecular docking (Kumar et al., 2021a; Mali and Pandey, 2022). The small molecules obtained from pharmacophore screening and REF drugs fostamatinib and lanraplenib were also minimized in DS using the Steepest Descent algorithm and saved in MOL2 format. In the current study, Genetic Optimization for Ligand Docking (GOLD v5.2.2) software was utilized to establish the molecular interactions between the potential inhibitors and the target receptor (Jones et al., 1997). First, the robustness of GOLD software was estimated before carrying out the docking experiment with crystallized ligand, lanraplenib, and the root mean square deviation was computed. The docking site was assigned as a 10-Å sphere by DS’s Define and Edit Binding Site module with X, Y, and Z coordinates of -13.06, 19.90, and -4.82, respectively. Following software robustness, the drug-like natural molecules were employed for docking utilizing the exact coordinates used for docking of lanraplenib. The first stage included docking-based virtual screening, where only one conformer per ligand was generated. The compounds exhibiting better docking results than lanraplenib and fostamatinib (REF inhibitors) were retained. The second stage comprised exhaustive docking of the retained compounds by generating 10 conformers per ligand. The compounds indicating higher GoldScores, lower ChemScores than REF inhibitors, and promising interactions with the active site residues within the SYK domain were further studied under atomic-level molecular simulations (Kumar et al., 2021b; Parate et al., 2021b).
The stability and binding flexibility of the selected protein-ligand docking complexes were studied under real time using molecular dynamics simulations. To accomplish this task, Groningen Machine for Chemical Simulations (GROMACS v5.1.5) was used (Van Der Spoel et al., 2005; Pronk et al., 2013). The simulation parameter files for SYK and potential inhibitor compounds were generated by Chemistry at Harvard Macromolecular Mechanics forcefield (CHARMm27) and SwissParam, respectively (Sapay and Tieleman, 2011; Zoete et al., 2011). The TIP3P system was employed for hydration of the protein–ligand complex throughout the simulation run. Further, the counter ions were used to neutralize the simulation box. Consequently, energy minimization equilibration using NVT and NPT was performed. The molecular simulations were conducted under periodic boundary conditions to reduce the edge effects (Kumar et al., 2021c; Kumar et al., 2021b). The MD simulation trajectories were assessed with the DS and VMD program (Humphrey et al., 1996).
The MD simulation results were subsequently subjected to predict the binding free energy (ΔG) using a computationally well-founded method, molecular mechanics Poisson–Boltzmann surface area (MM-PBSA) (Kollman et al., 2000). The g_mmpbsa plugin package in GROMACS was utilized to predict the ΔG of the protein–ligand complex in the solvent, which can be defined as (Kumari et al., 2014):
where Gcomplex is the protein–ligand complex’s total free energy, whereas Gprotein and Gligand are the over-all free energies of the protein and ligand alone in solvent.
A series of SYK inhibitors tested through the same biological assay method were collected from different literature sources (Lucas et al., 2012; Padilla et al., 2013; Lucas et al., 2014). A training set of 19 compounds with diverse scaffolds was carefully compiled to construct the pharmacophore model. The 2D structures and the inhibitory concentrations of the training set compounds against SYK are shown in Figure 1. Based on the experimental inhibitory concentration of compounds, the training set was classified as active (IC50 <10 nmol/L +++), moderately active (IC50 <100 nmol/L ++), and inactive (IC50 <1,000 nmol/L +). Before the generation of the hypothesis, the Feature Mapping module of the DS was exploited using training set compounds as an input to get an idea about the proportion of chemical features present in compounds. Rationally, the five most common features, viz., hydrogen bond donor (HBD), hydrogen bond acceptor (HBA), hydrogen bond acceptor lipid (HBAL), ring aromatic (RA), and hydrophobic (HYP), were carefully chosen from feature mapping results for the hypothesis generation. Subsequently, the DS’s 3D QSAR Pharmacophore Generation module was utilized to generate the set of pharmacophore models. The program generates 10 hypotheses, each with its own set of statistical parameters, including total cost, cost difference, RMSD, correlation, Max Fit, and features (Table 1). According to the previous studies, the best hypothesis should have fit value >9, maximum cost difference, least total cost values, high correlation coefficient, and lowest root mean square deviation (RMSD) values (Debnath, 2002; John et al., 2011; Kumar et al., 2015). It is shown in Table 1 that except for Hypo9, and Hypo10, all others display a fit value greater than nine. Furthermore, Hypo8 showed the highest fit value of 11.3, followed by Hypo5, Hypo3, Hypo2, and Hypo1. Table 1 also shows that the hydrogen bond acceptor lipid (HBAL) feature was dominantly found in all generated hypotheses, suggesting that it is necessary for SYK inhibition. The detailed analysis of statistical parameters revealed that Hypo1 had a low total cost of 95.78, a maximum cost difference of 50.78, the least RMSD value (0.69), and a maximum correlation (0.98). Thus, Hypo1, which contains three features of HBAL, was selected as the best hypothesis (Figure 2A). To illustrate the predictive accuracy of Hypo1, regression analysis was employed. Hypo1 estimates the inhibitory value of the compounds in their activity range with minor deviations. One active and one moderately active compound was anticipated to be moderately active and inactive, respectively, as shown in Table 2. Furthermore, the training set’s most active compound (IC50 = 1 nmol/l) was found to be well-matched with the three chemical features of Hypo 1, although one HBAL feature was not well linked with the training set’s least active compound (IC50 = 32,000 nmol/L) (Figures 2B, C). The mapping difference between most active and least active compounds reveals the possible difference between their inhibitory activities against SYK. Additionally, we studied the possible mapping of the Hyop1 with SYK active site. Figure 3A displays the overlay of Hypo1 inside the active site of the SYK protein. The enlarged view in Figure 3A indicates that three HBAL features of Hypo1 may map with K375, R499, and DFG motif residue D512. In addition, the surrounding active site residues were also shown, which may participate in various hydrophobic interactions during protein-ligand binding (Figure 3B). The feature mapping results reveal that the Hypo1-filtered compound may target mentioned active site residues. The potential of Hypo1 to predict the activity similar to the experimental activity range and mapping with active site key residues indicates that Hypo1 may act as a good 3D query to identify novel compounds from drug-like databases.
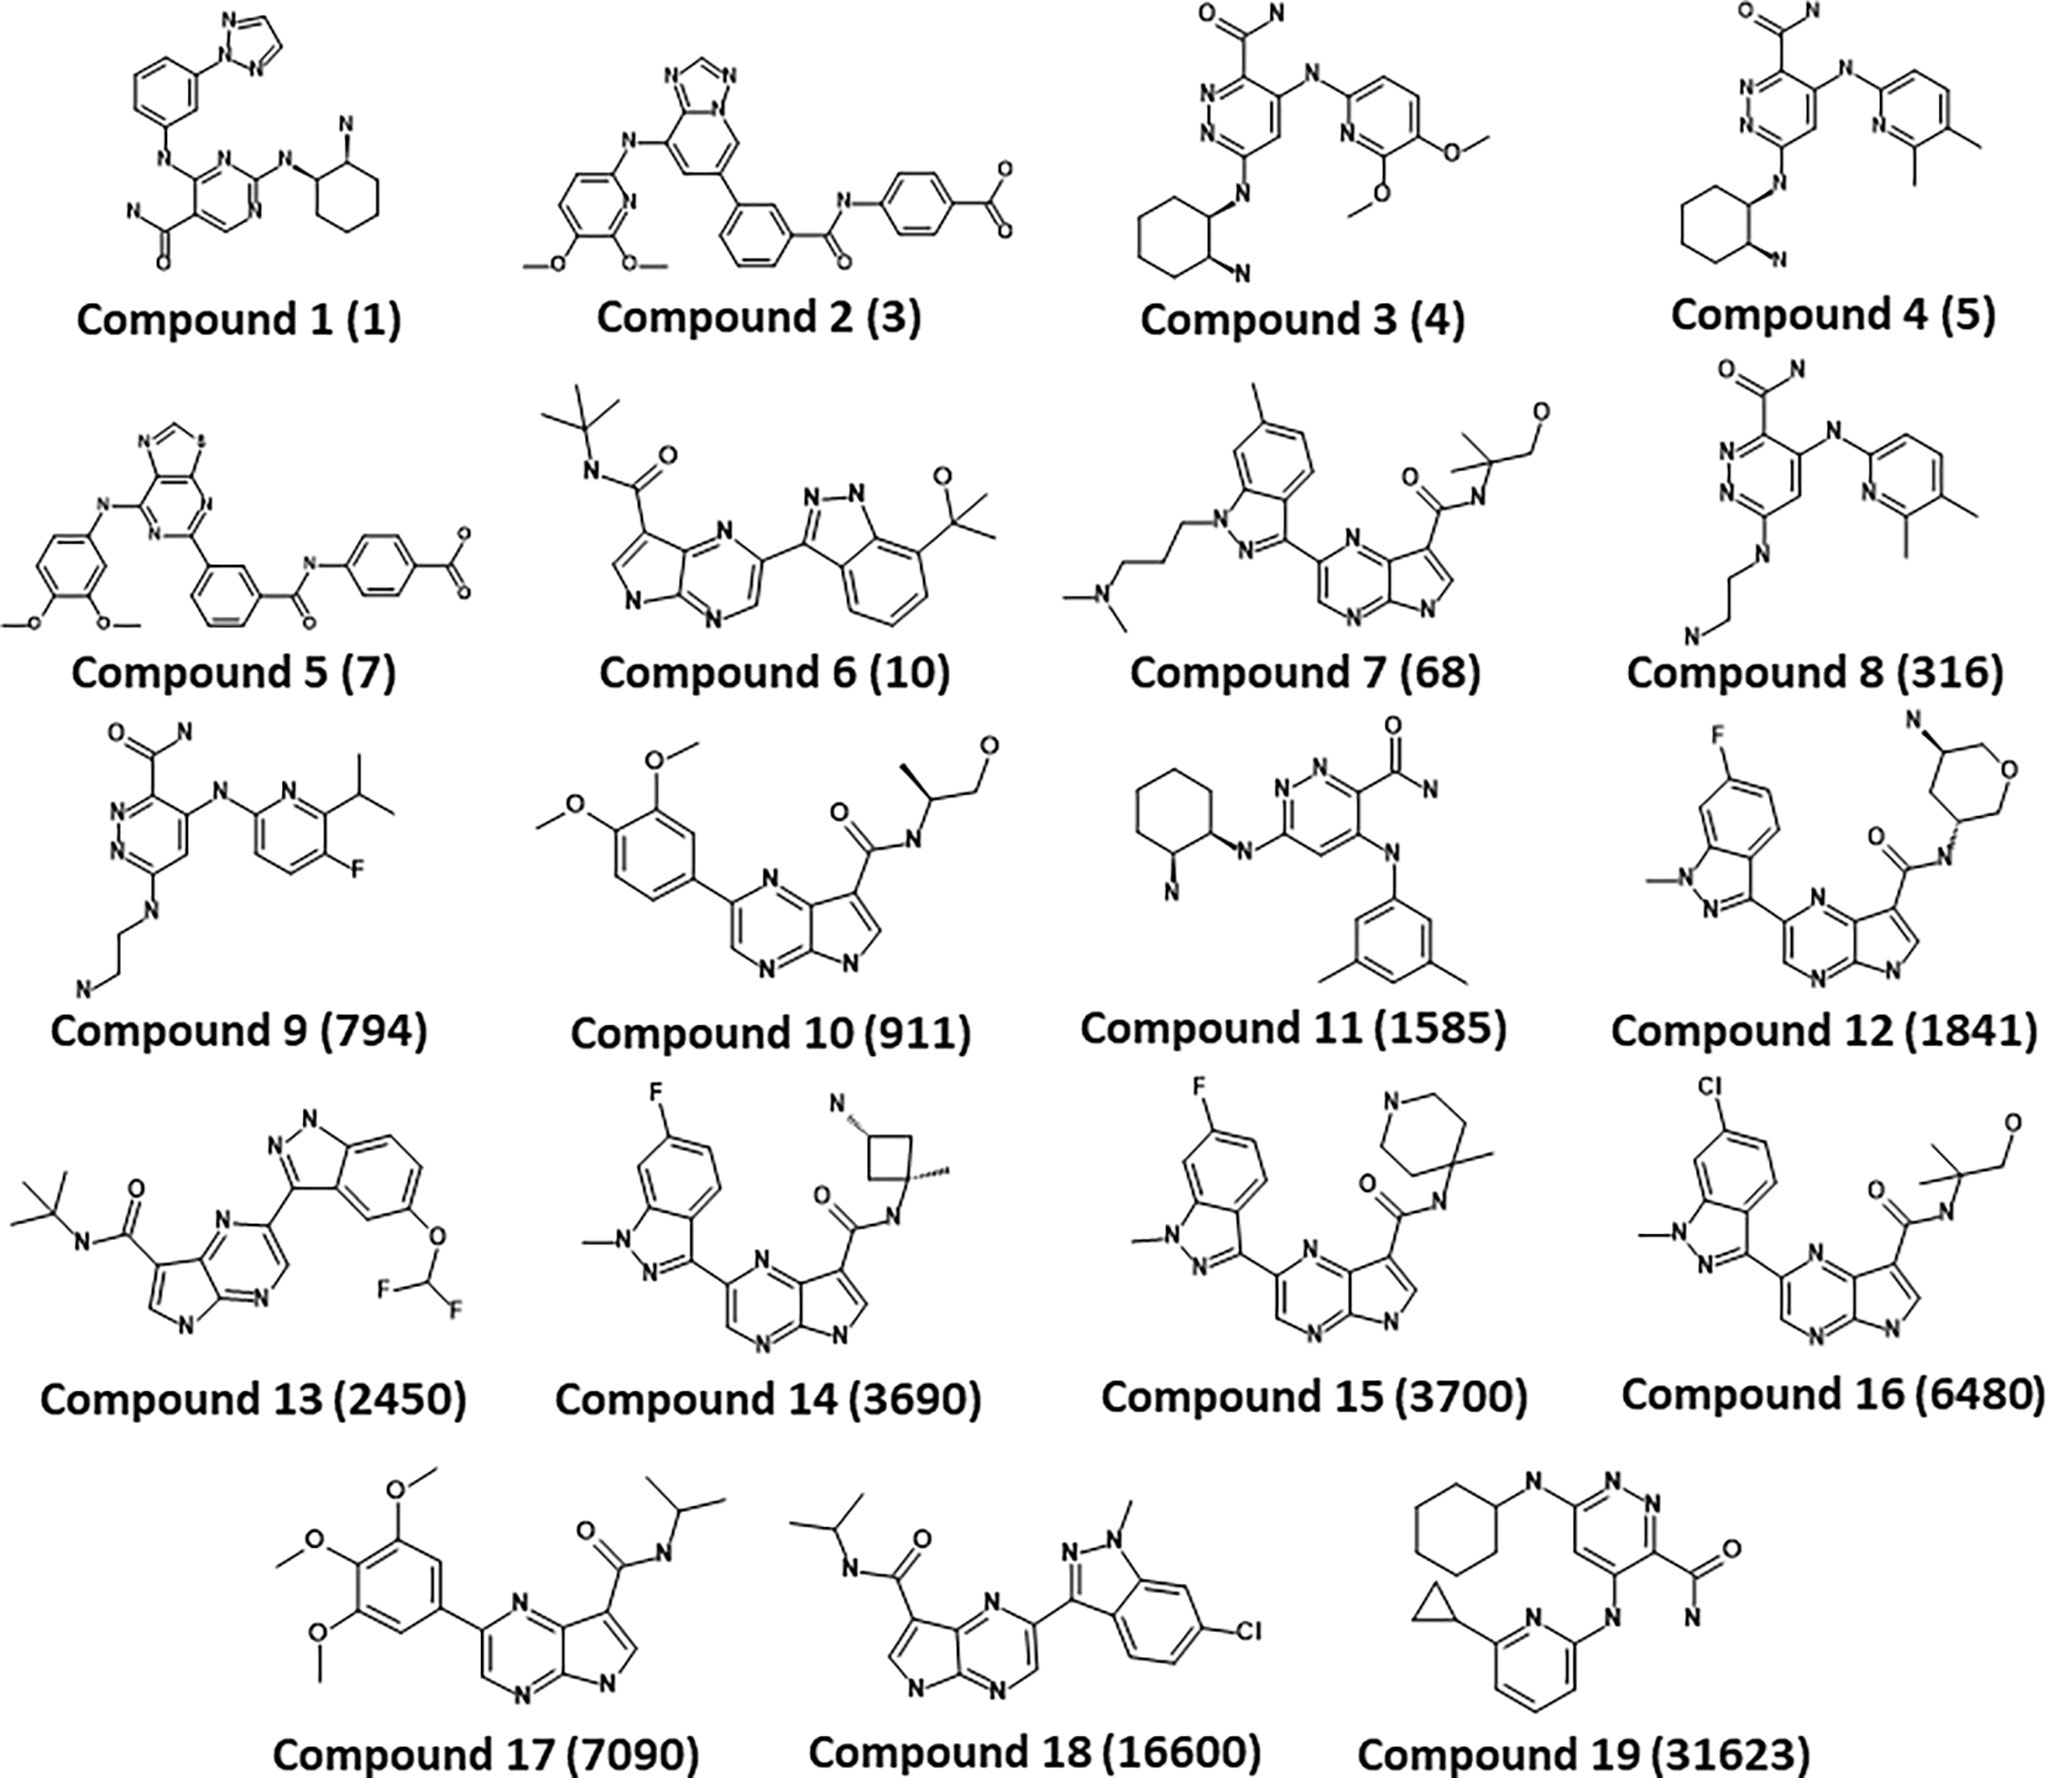
Figure 1 Chemical structures of the SYK inhibitors in the training set. The inhibitory activity of the compounds is shown in parenthesis (IC50 nmol/L).
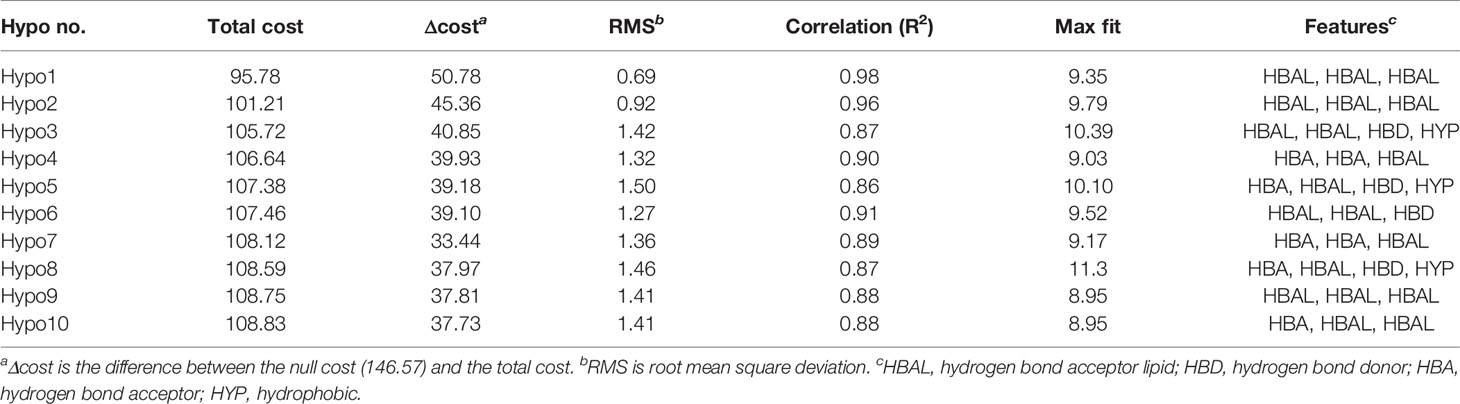
Table 1 The statistical details of 10 Hypogen algorithm-generated pharmacophore hypotheses.
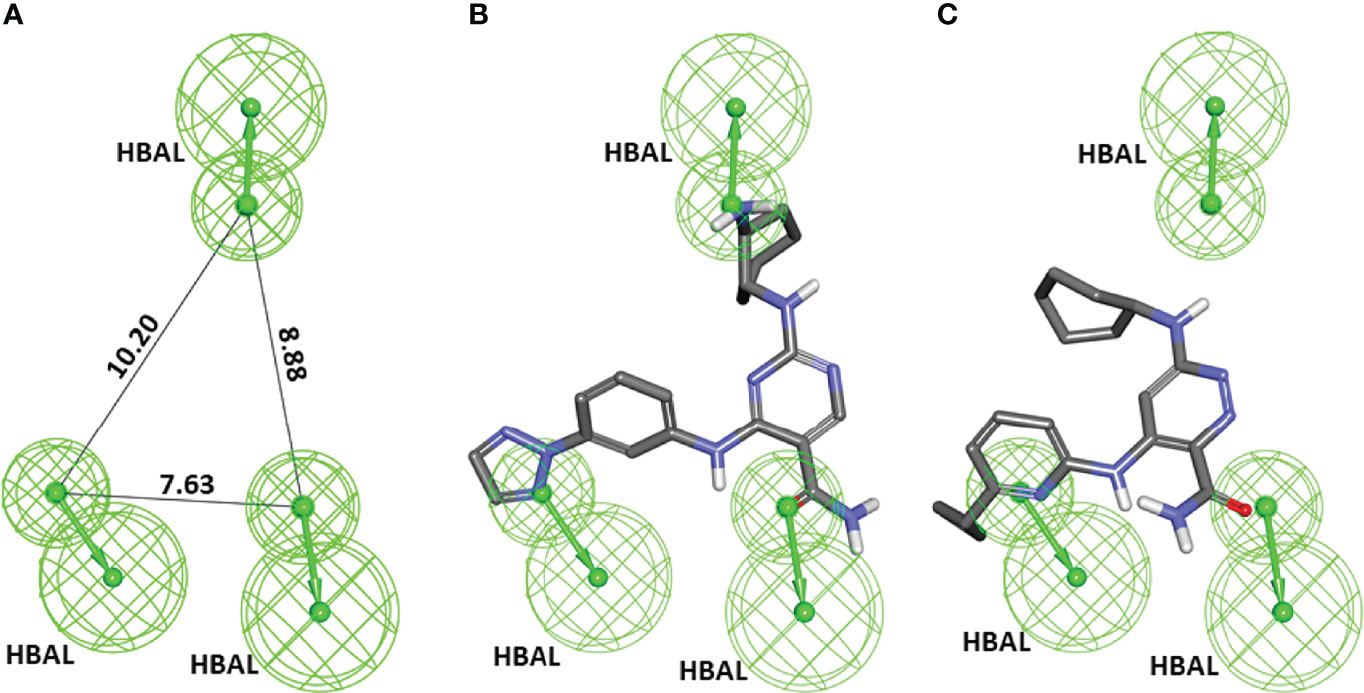
Figure 2 (A) The best pharmacophore model, Hypo1, shows chemical features and distance constraints Å. Hypo1 contains three hydrogen bond acceptor lipid (HBAL) features. (B, C) The pharmacophore mapping results of Hypo1 on the training set’s most active and least active compound, respectively.
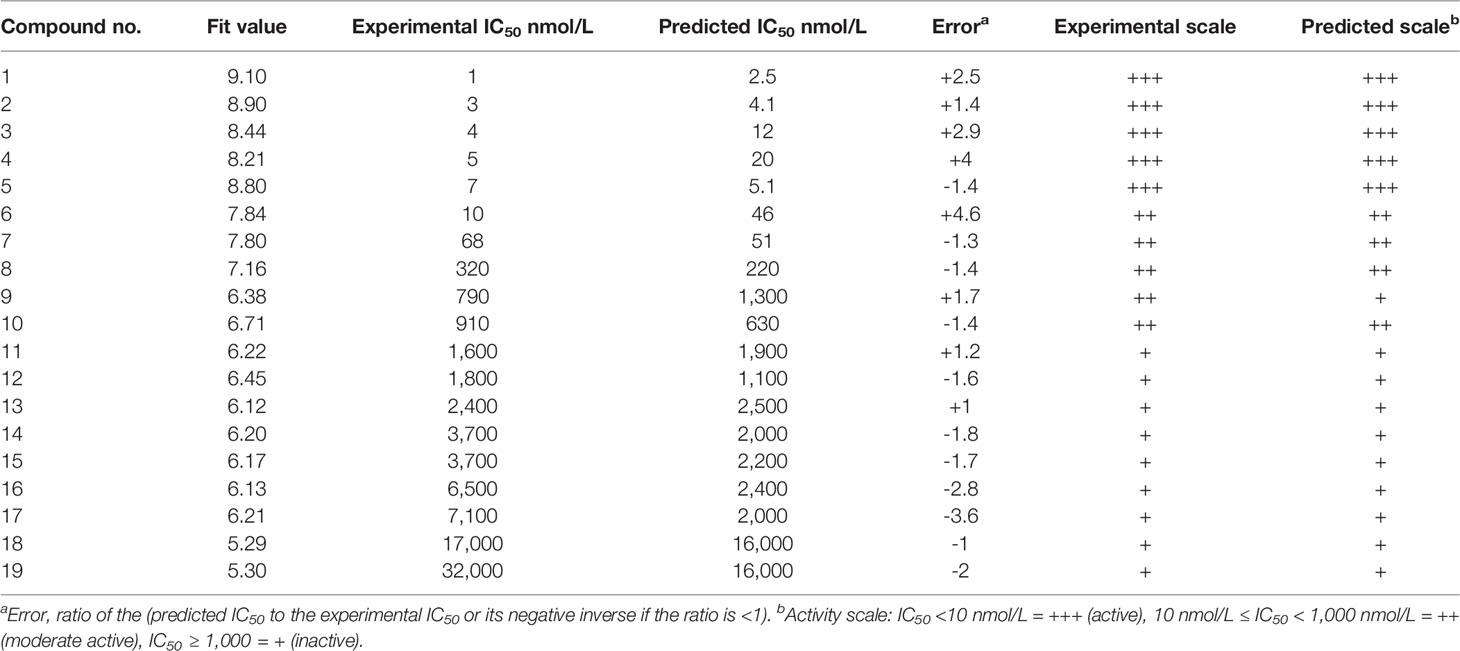
Table 2 Detailed overview of actual biological activities of training set compounds and Hypo1-predicted activities.
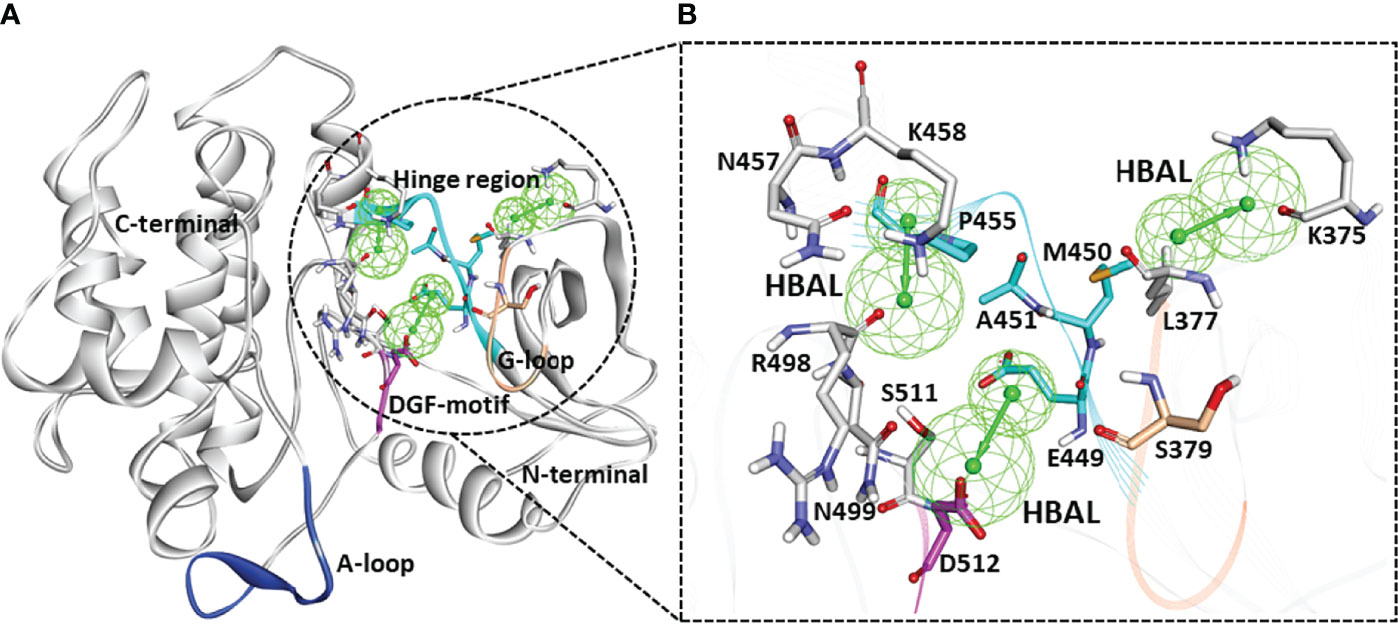
Figure 3 (A) The ribbon diagram of the SYK protein showing an overlay of Hypo1 inside the active site of different SYK domains. The regions of the SYK active site such as the hinge region (448–455), glycine-rich loop (378–383), DFG motif (512–514), and the activation loop (520–534) were highlighted. (B) The mapping of Hypo1 features with SYK active site residues. The SYK residues were shown with a stick representation in different colors: hinge (cyan), G-loop (teak), DFG motif (pink), and other active site surrounding resides (gray).
The representative hypothesis was evaluated via Fischer’s randomization test and test set validation (Kumar et al., 2015). In Fischer’s validation method, the statistical significance of the hypothesis was investigated by generating 19 random spreadsheets of the training set compounds using the actual biological activity values at the confidence level of 95%. It can be inferred from Figure 4 that Hypo1 was not developed by chance, as Hypo1 showed the lowermost cost value among 19 randomly generated hypotheses. Additionally, the correlation of the randomly generated hypothesis was also compared with Hypo1, and it was observed that Hypo1 achieved the highest correlation among randomly generated hypotheses (Figure S1). The test set validation was performed using 19 structurally different compounds (Table S1). The inhibitory activity of the compounds in the test set varied from 5 to 9,950 nmol/L. The test set compounds were classified as active, moderately active, and inactive based on their IC50 values, similar to training set compounds. Table S2 shows that most of the compounds were anticipated to be in the same range as their experimental range, except for three moderately active compounds that were overestimated active. Furthermore, Hypo1 reflects a significant correlation between the predicted and actual biological activities of the training set (R2 = 0.98) and test set (R2 = 0.91) (Figure 5). The Hypo1 validation results indicate that the selected hypothesis fulfilled the criteria suggested by previous reports to be an ideal pharmacophore model for virtual screening of drug-like databases (Sakkiah and Lee, 2012; Kumar et al., 2015).
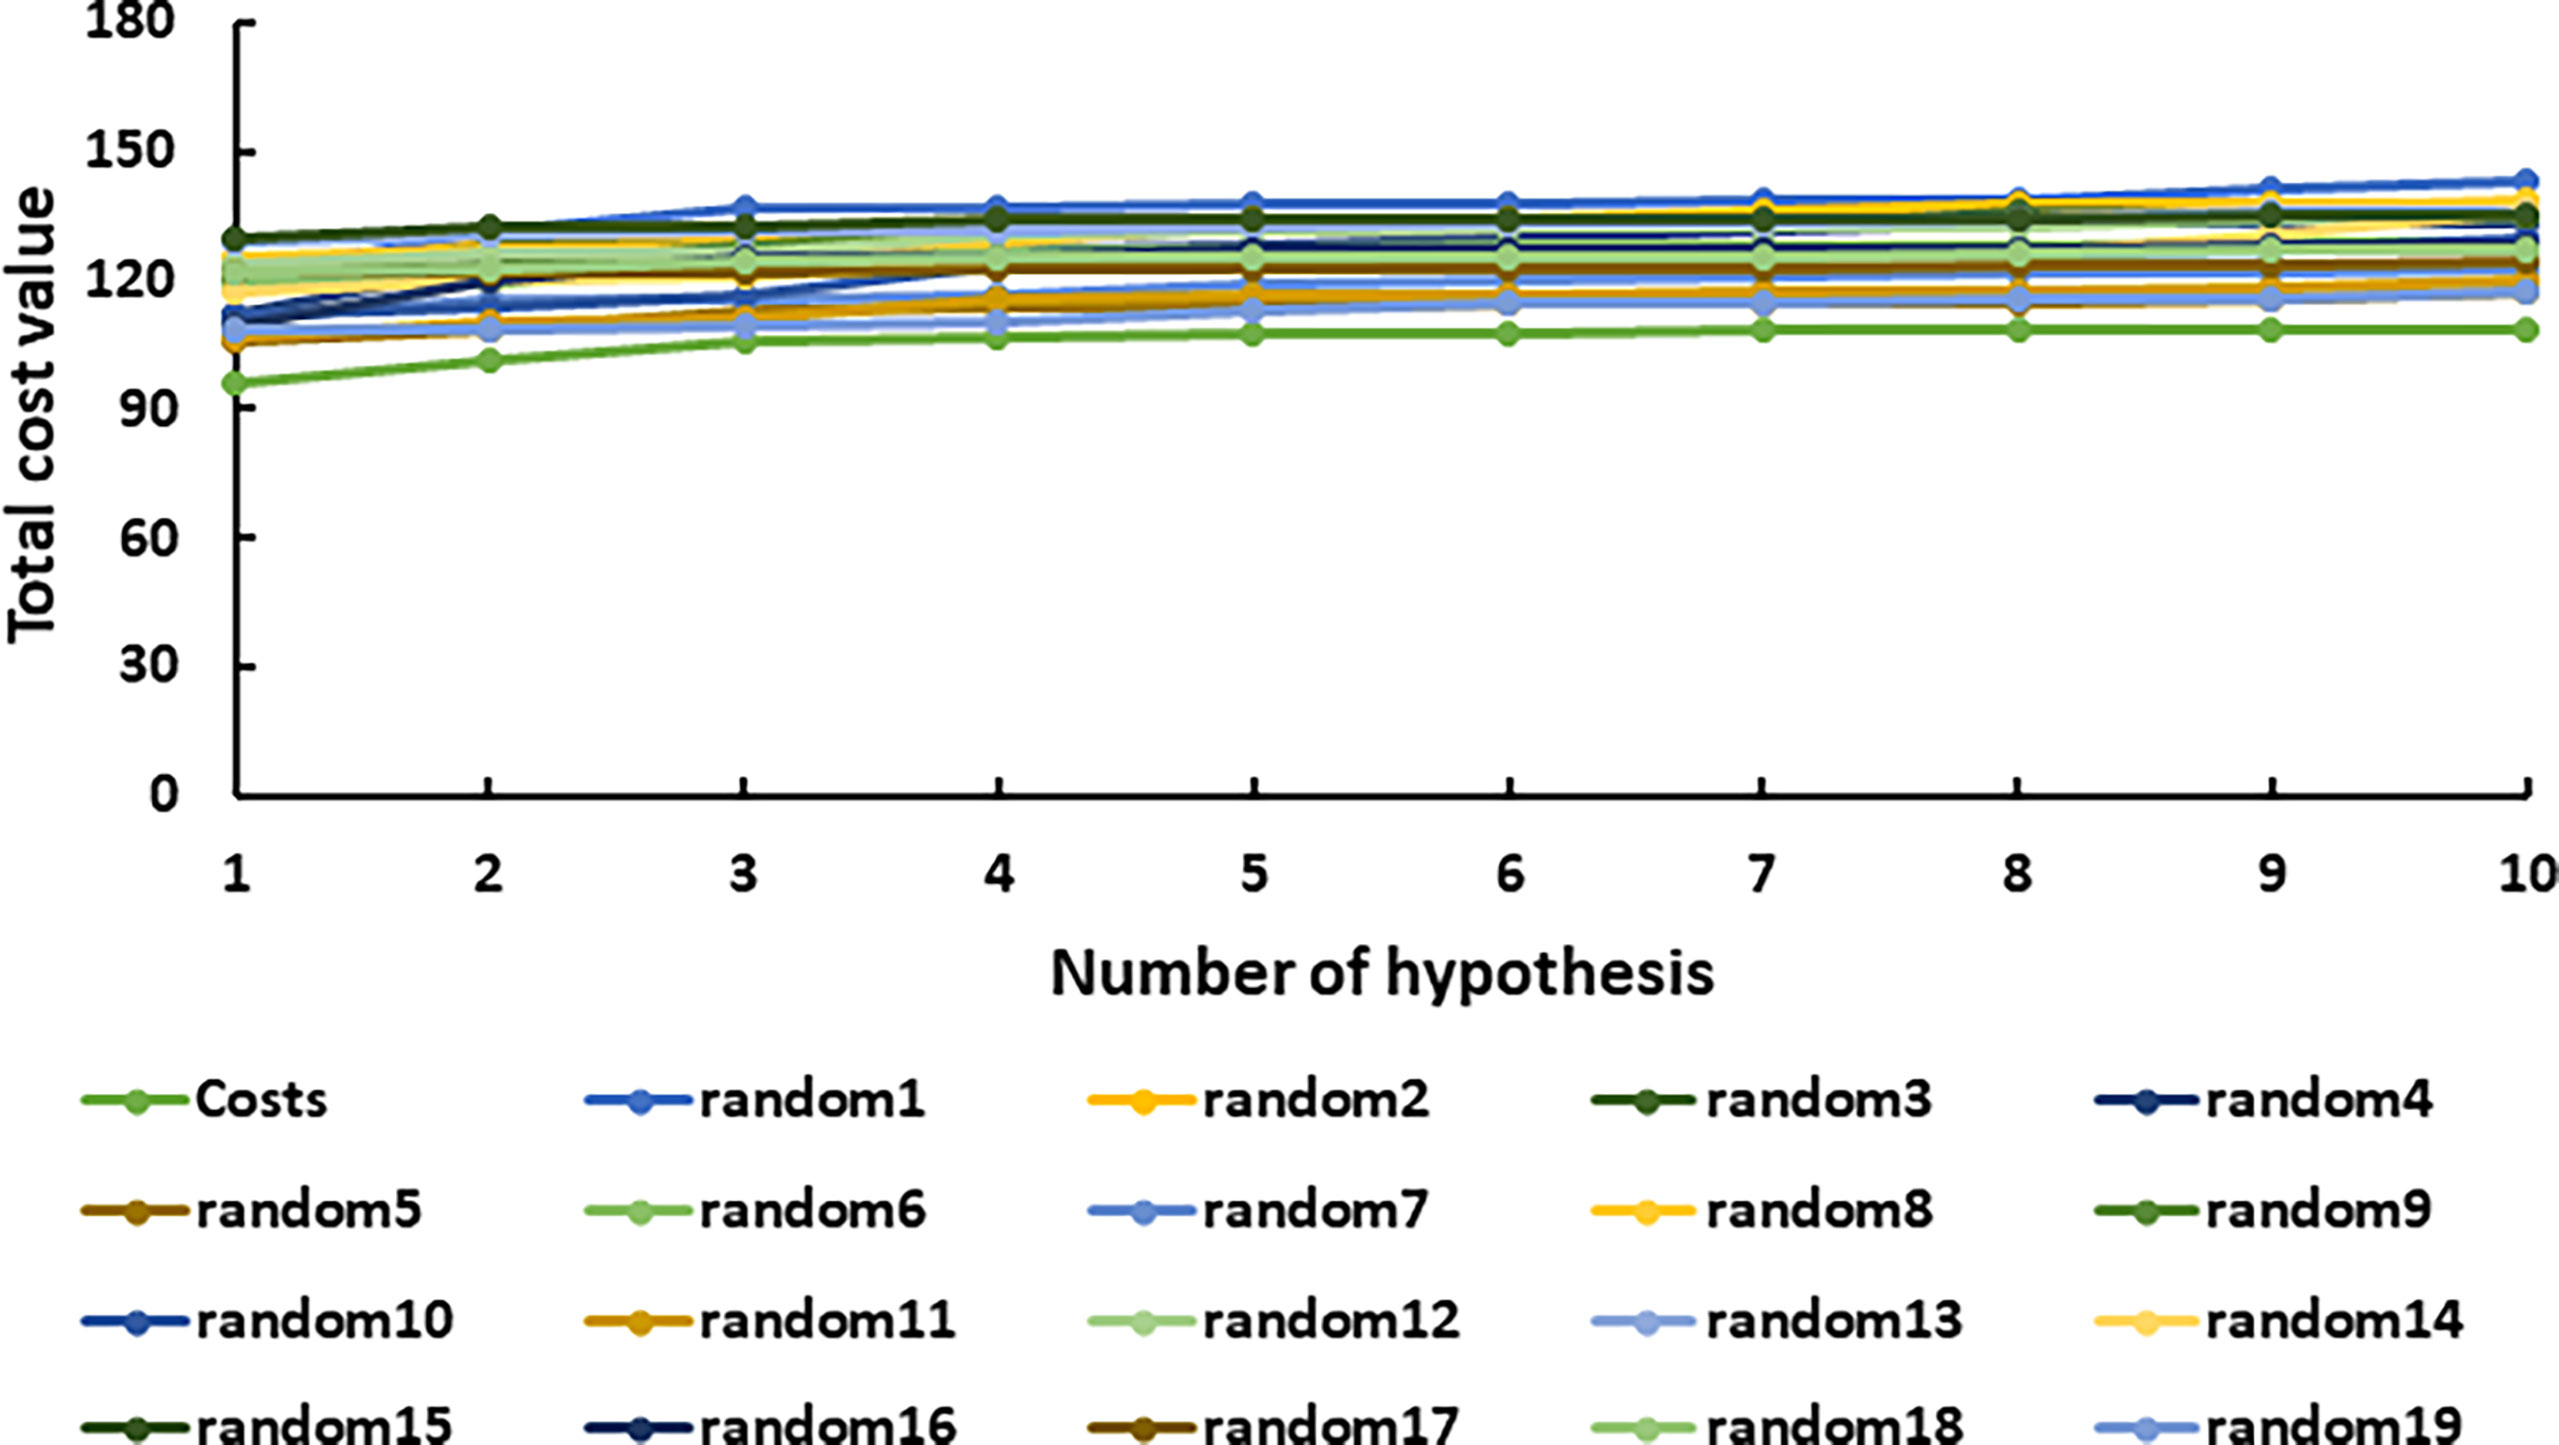
Figure 4 The graphical depiction of the total cost analysis of the initial spreadsheet (costs) and 19 random spreadsheets during Fischer’s randomization run. A confidence threshold of 95% was applied.
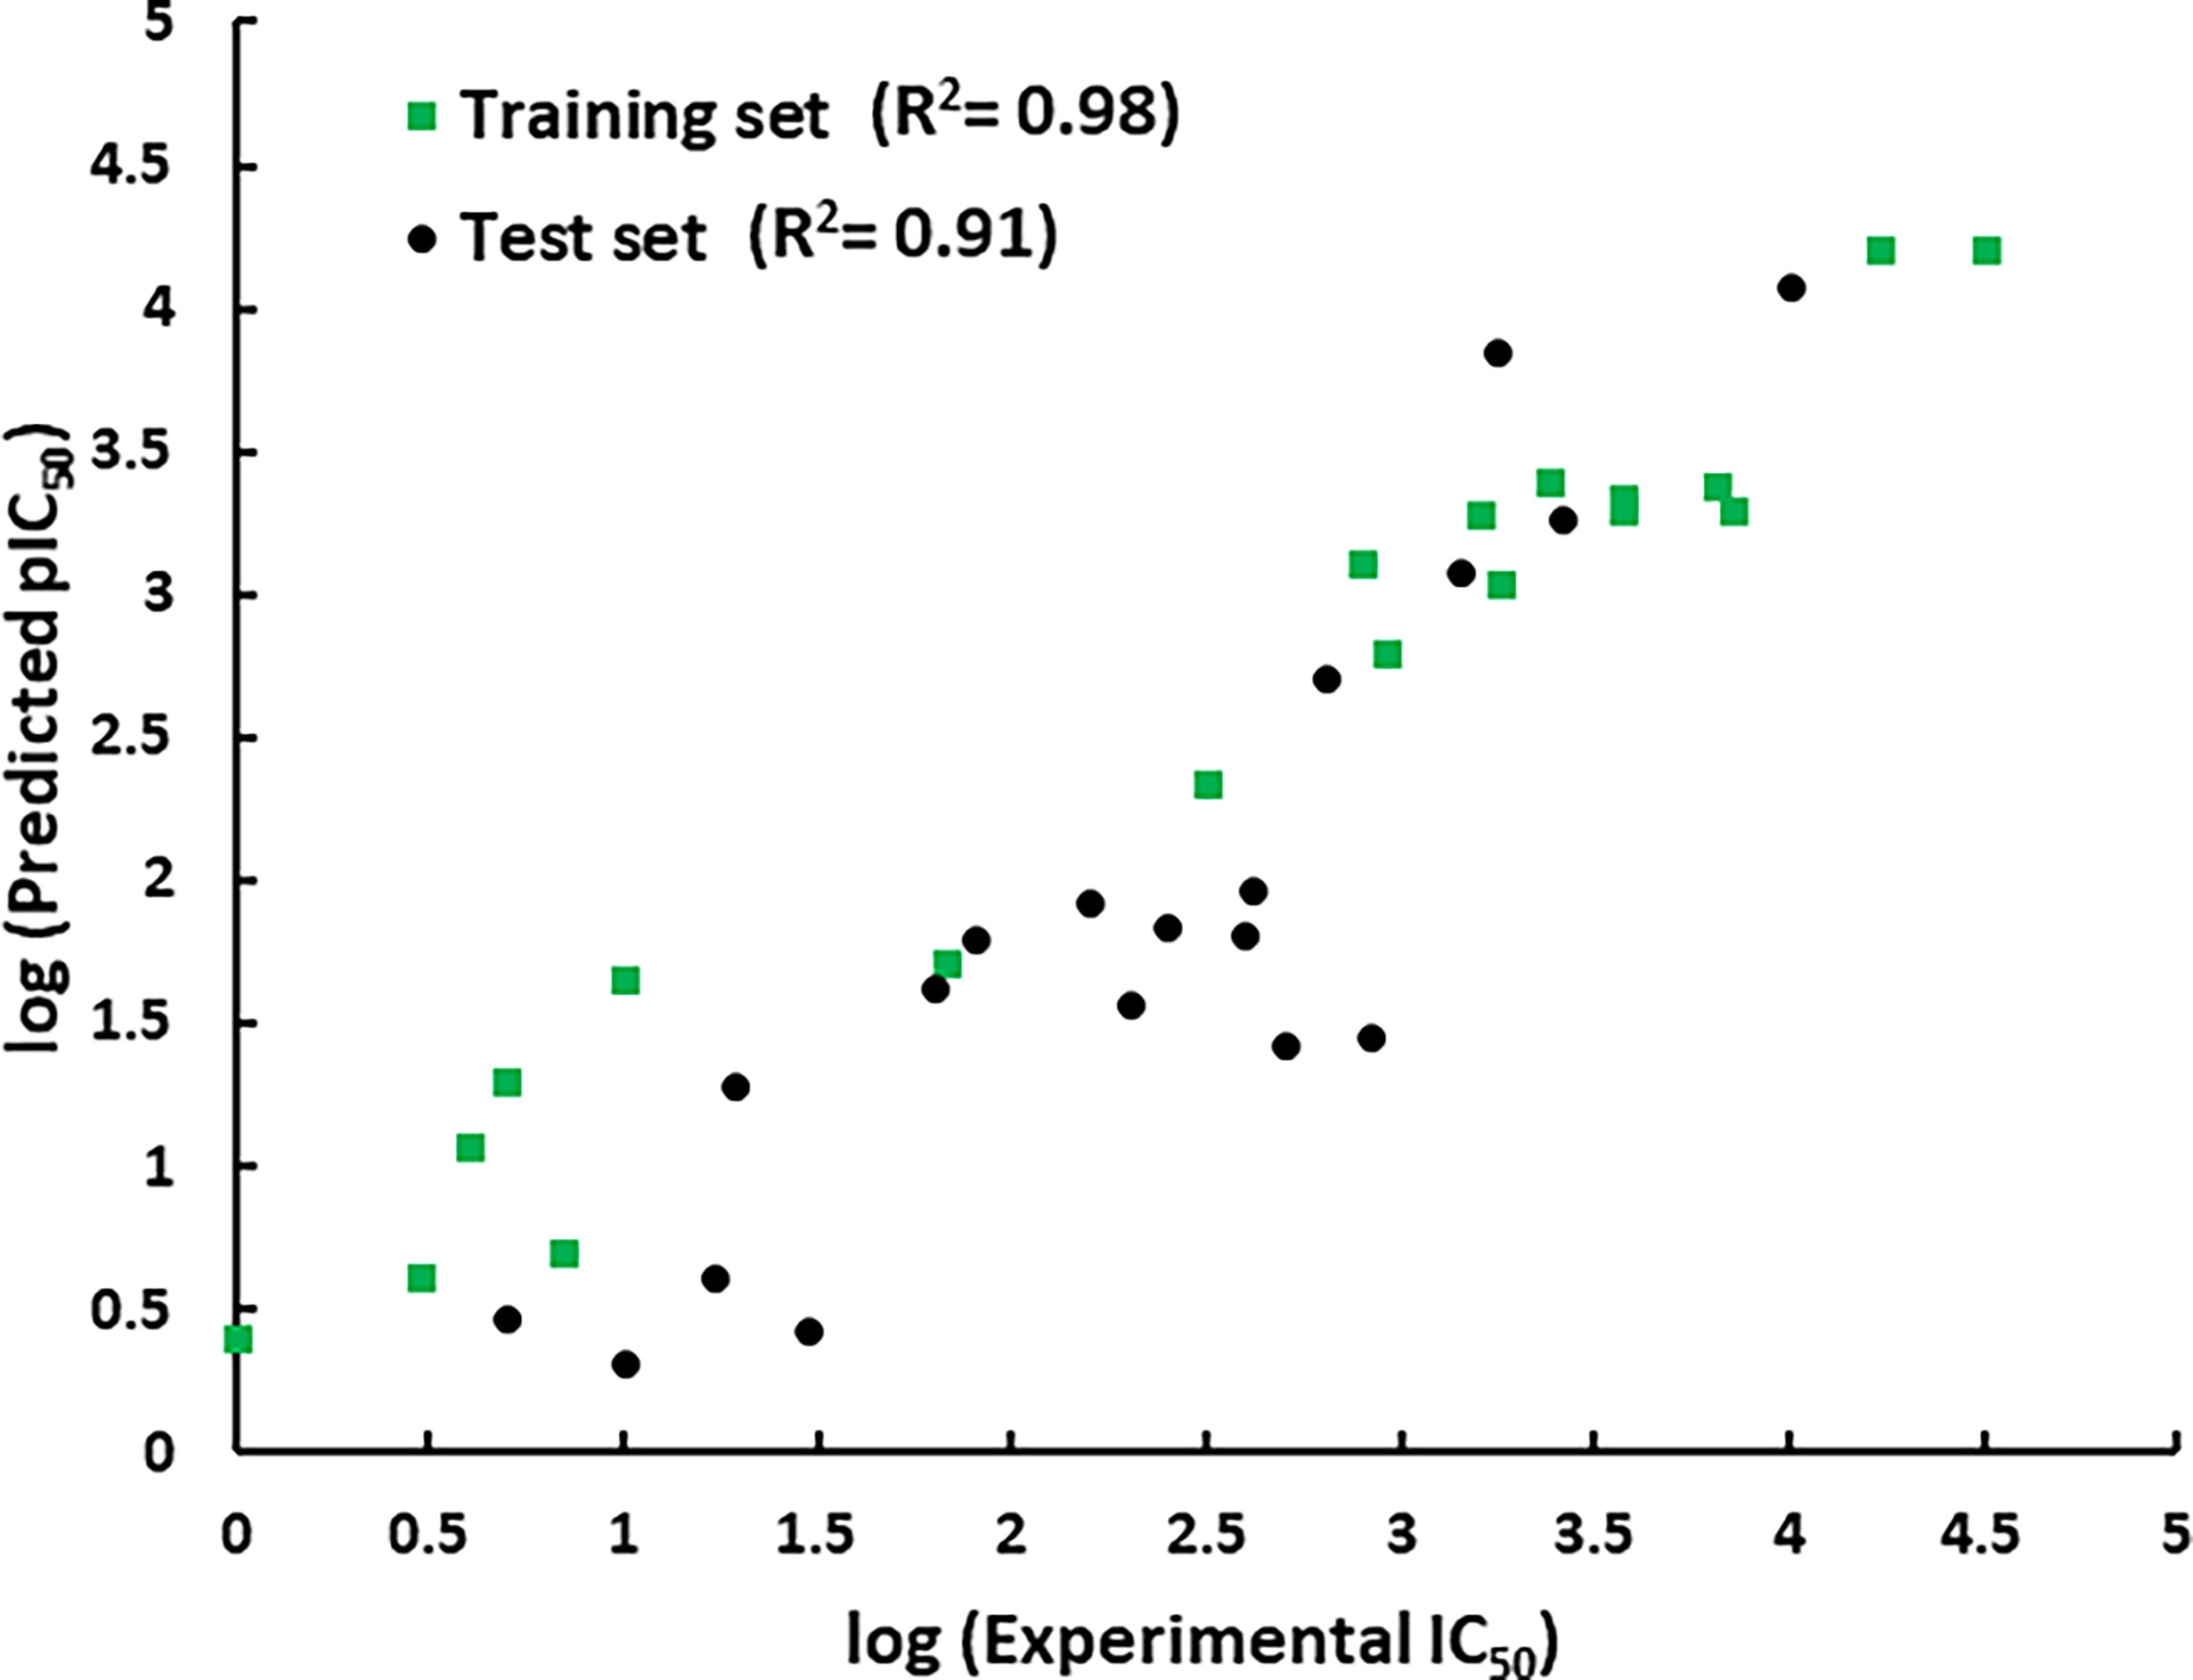
Figure 5 The graphical representation of the correlation between the training set and test set compounds’ experimental and Hypo1-predicted activities.
A compound’s drug-like properties are a prerequisite for it to be utilized as a potential drug molecule. Therefore, the ZINC database embedded with 144,766 natural products was filtered via Ro5 and Veber’s rules, resulting in 98,842 compounds (Lipinski et al., 2001; Veber et al., 2002). This huge number of compounds was further filtered via ADMET pharmacokinetic criteria, resulting in 7,378 drug-like natural compounds. Subsequently, the well-validated 3D-QSAR model Hypo1 was employed as a 3D query to screen natural compounds using the Ligand Pharmacophore Mapping function of DS. The mapping yielded 2,964 drug-like molecules that mapped every aspect of the model. Lastly, the obtained compounds were manually scrutinized for false-positive compounds mapping the model. This process resulted in 2,277 actual positive compounds, which were proceeded for molecular docking with the SYK structure.
The molecules acquired from the pharmacophore-based screening were docked with the catalytic site of the SYK domain structure (PDB ID: 6VOV) (Blomgren et al., 2020). The reliability of GOLD docking software was evaluated before the docking of drug-like molecules (Kumar et al., 2021b). In this process, the re-docking of co-crystallized ligand lanraplenib was performed, resulting in a root mean square deviation (RMSD) of <2 Å among the docked and co-crystallized poses (Figure S2A). Consequently, the docking-based virtual screening of 2,277 mapped compounds was executed with the generation of one conformer per ligand. A total of 129 compounds exhibited higher GoldScores and lower ChemScores than the REF inhibitors lanraplenib and fostamatinib selected initially for detailed molecular interaction analysis (Kumar et al., 2021b; Parate et al., 2021b). We performed a more extensive docking evaluation for the 129 molecules, with 10 conformers per ligand generation. Our docking analyses revealed that lanraplenib showed a GoldScore of 64.56 and ChemScore of -28.99, while fostamatinib demonstrated GoldScore of 66.62 and ChemScore -17.60. Using reference inhibitors’ docking scores as cutoff, 33 compounds were selected (Figure S2B). It is noteworthy to mention that selected compounds displayed significantly better docking scores when compared with REF drugs. For example, top-ranked docked compound ZINC98364146 displayed a GoldScore of 77.50 and a ChemScore of -34.12, which is much better than the REF compounds’ score. Table S3 displays the complete analysis of each compound’s docking score and hydrogen-bond details. Our structural observation of 62 SYK inhibitor-bound PDB structures reveals that Ala451 and Asp512 were targeted via hydrogen bond by 59 and 25 inhibitors, respectively. Interestingly, the selected docked compound’s hydrogen-bond analysis shows that each compound targets key residue Ala451 or Asp512 via a hydrogen bond (Table S3). Moreover, previous docking studies with the SYK protein revealed that active site residues such as Leu377, Ser379, Val385, Met448, Ala451, Lys458, Asp499, and Asp512 were actively observed during protein–ligand interactions; a similar observation during our analysis supports our selection (Huang et al., 2017; Wang et al., 2018). Finally, 33 selected compounds were forward for molecular simulations to monitor their stability under a virtual cellular environment.
The MD simulations are a broadly used method to study the steadiness of protein–ligand systems at the atomic level (Karplus and McCammon, 2002). The stability of the system was calculated using geometric features such as root mean square deviation (RMSD) and root mean square fluctuations (RMSF) (Kumar et al., 2021a). Further, the computationally rigorous method MM-PBSA was utilized to screen the simulated complexes (Kumari et al., 2014; Kumar et al., 2021c). The binding free energy of the REF inhibitors lanraplenib (REF1) and fostamatinib (REF2) was used as the first criteria for selecting the potential hit compounds among 33 simulated inhibitor–SYK complexes (Table S3) (Kumar et al., 2021d; Parate et al., 2021c). The selected hit compounds were analyzed in detail and are discussed below.
The RMSD of SYK protein backbone atoms was calculated to determine the stability of all the simulated systems throughout the simulation run. It is shown in Figure 6A that all the systems displayed stable behavior from start to endpoint. The average RMSD value for all the systems was observed below 0.3 nm, which indicated that simulated complexes displayed RMSD values below the threshold. The average RMSD values further showed that the Hit4–SYK complex displayed less deviation (0.14 nm), whereas Hit2 and Hit3 demonstrated a similar average value to REF1 (0.15 nm). Further, Hit1 and REF2 showed slightly high average RMSD values of 0.16 and 0.17 nm, respectively. RMSF is an important variable used to display each residue’s fluctuation rate upon ligand binding. Figure 6B shows the RMSF plot for all the simulated systems. It can be seen from the RMSF plot that all the simulated complexes displayed a similar pattern of fluctuations at residues 408–410, indicating significant movement of protein backbone atoms; these residues are from the loop region of the protein and are not part of the active site region. Furthermore, it was observed that none of the active site residues displayed an RMSF value >0.3 nm. This indicates that active site residues were minimally disturbed upon binding of the ligand or known drug.
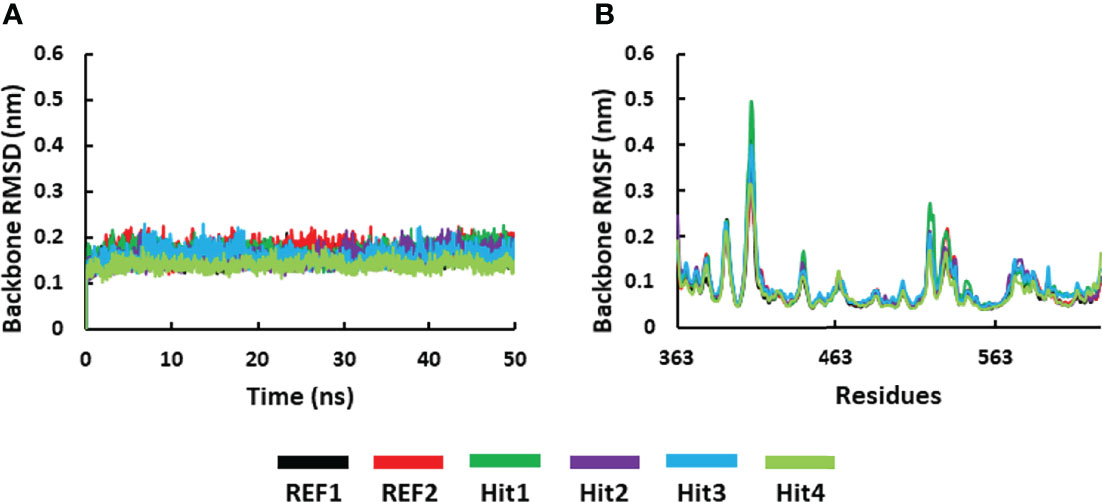
Figure 6 Molecular dynamics simulation analysis. (A) RMSD and (B) the RMSF plot for the backbone atoms of the SYK protein. The graphs were calculated for 50 ns of the simulation run.
MD simulations collective with binding free-energy calculations were used to accurately estimate the binding affinity of drug-like molecules (Table S3). The MM-PBSA scoring typically correlates with experimentally determined activity (Genheden and Ryde, 2015). Table 3 demonstrates the results of the binding free energy prediction of the REF inhibitors and selected compounds. The REF inhibitor fostamatinib and co-crystal drug lanraplenib displayed binding free energy values of -90.00 and -84.53 kJ/mol, respectively. In contrast, the potential hit compounds showed lower binding free energy values than REF compounds (Table 3 and Figure 7). The lowest free energy value is indicative of the strong binding affinity with protein; therefore, we ranked our hit compounds according to free energy values. Hit1 displayed an average binding free energy value of -111.11 kJ/mol, followed by Hit2, Hit3, and Hit4 with values of -105.30, -98.81, and -96.76 kJ/mol, respectively. The energy decomposition was further performed to understand the energetics of all the systems. Table 3 indicates that van der Waals, electrostatic, and SASA energy components energetically favored the formation of the protein–ligand complex, whereas polar solvation opposed the formation of the complex. Free energy data further reveal that van der Waals interactions contribute pointedly to the protein–ligand complexes trailed by electrostatic and SASA energy.
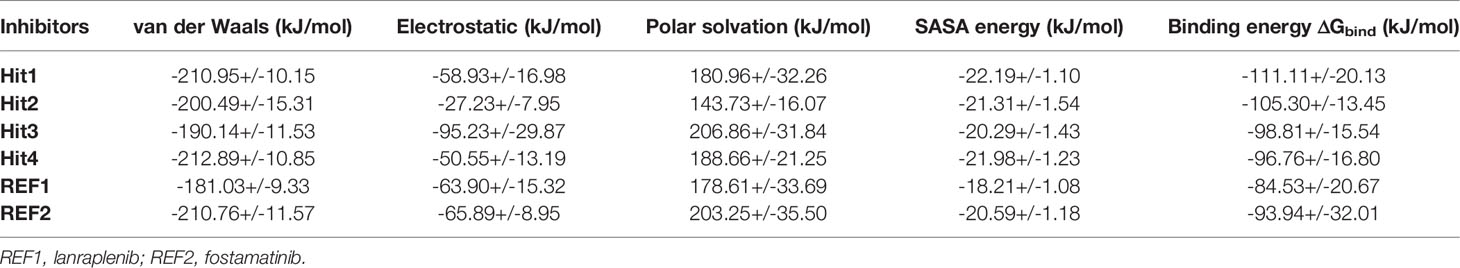
Table 3 The detailed distribution of the binding free energy factors calculated from MM-PBSA method for hit and REF compounds.
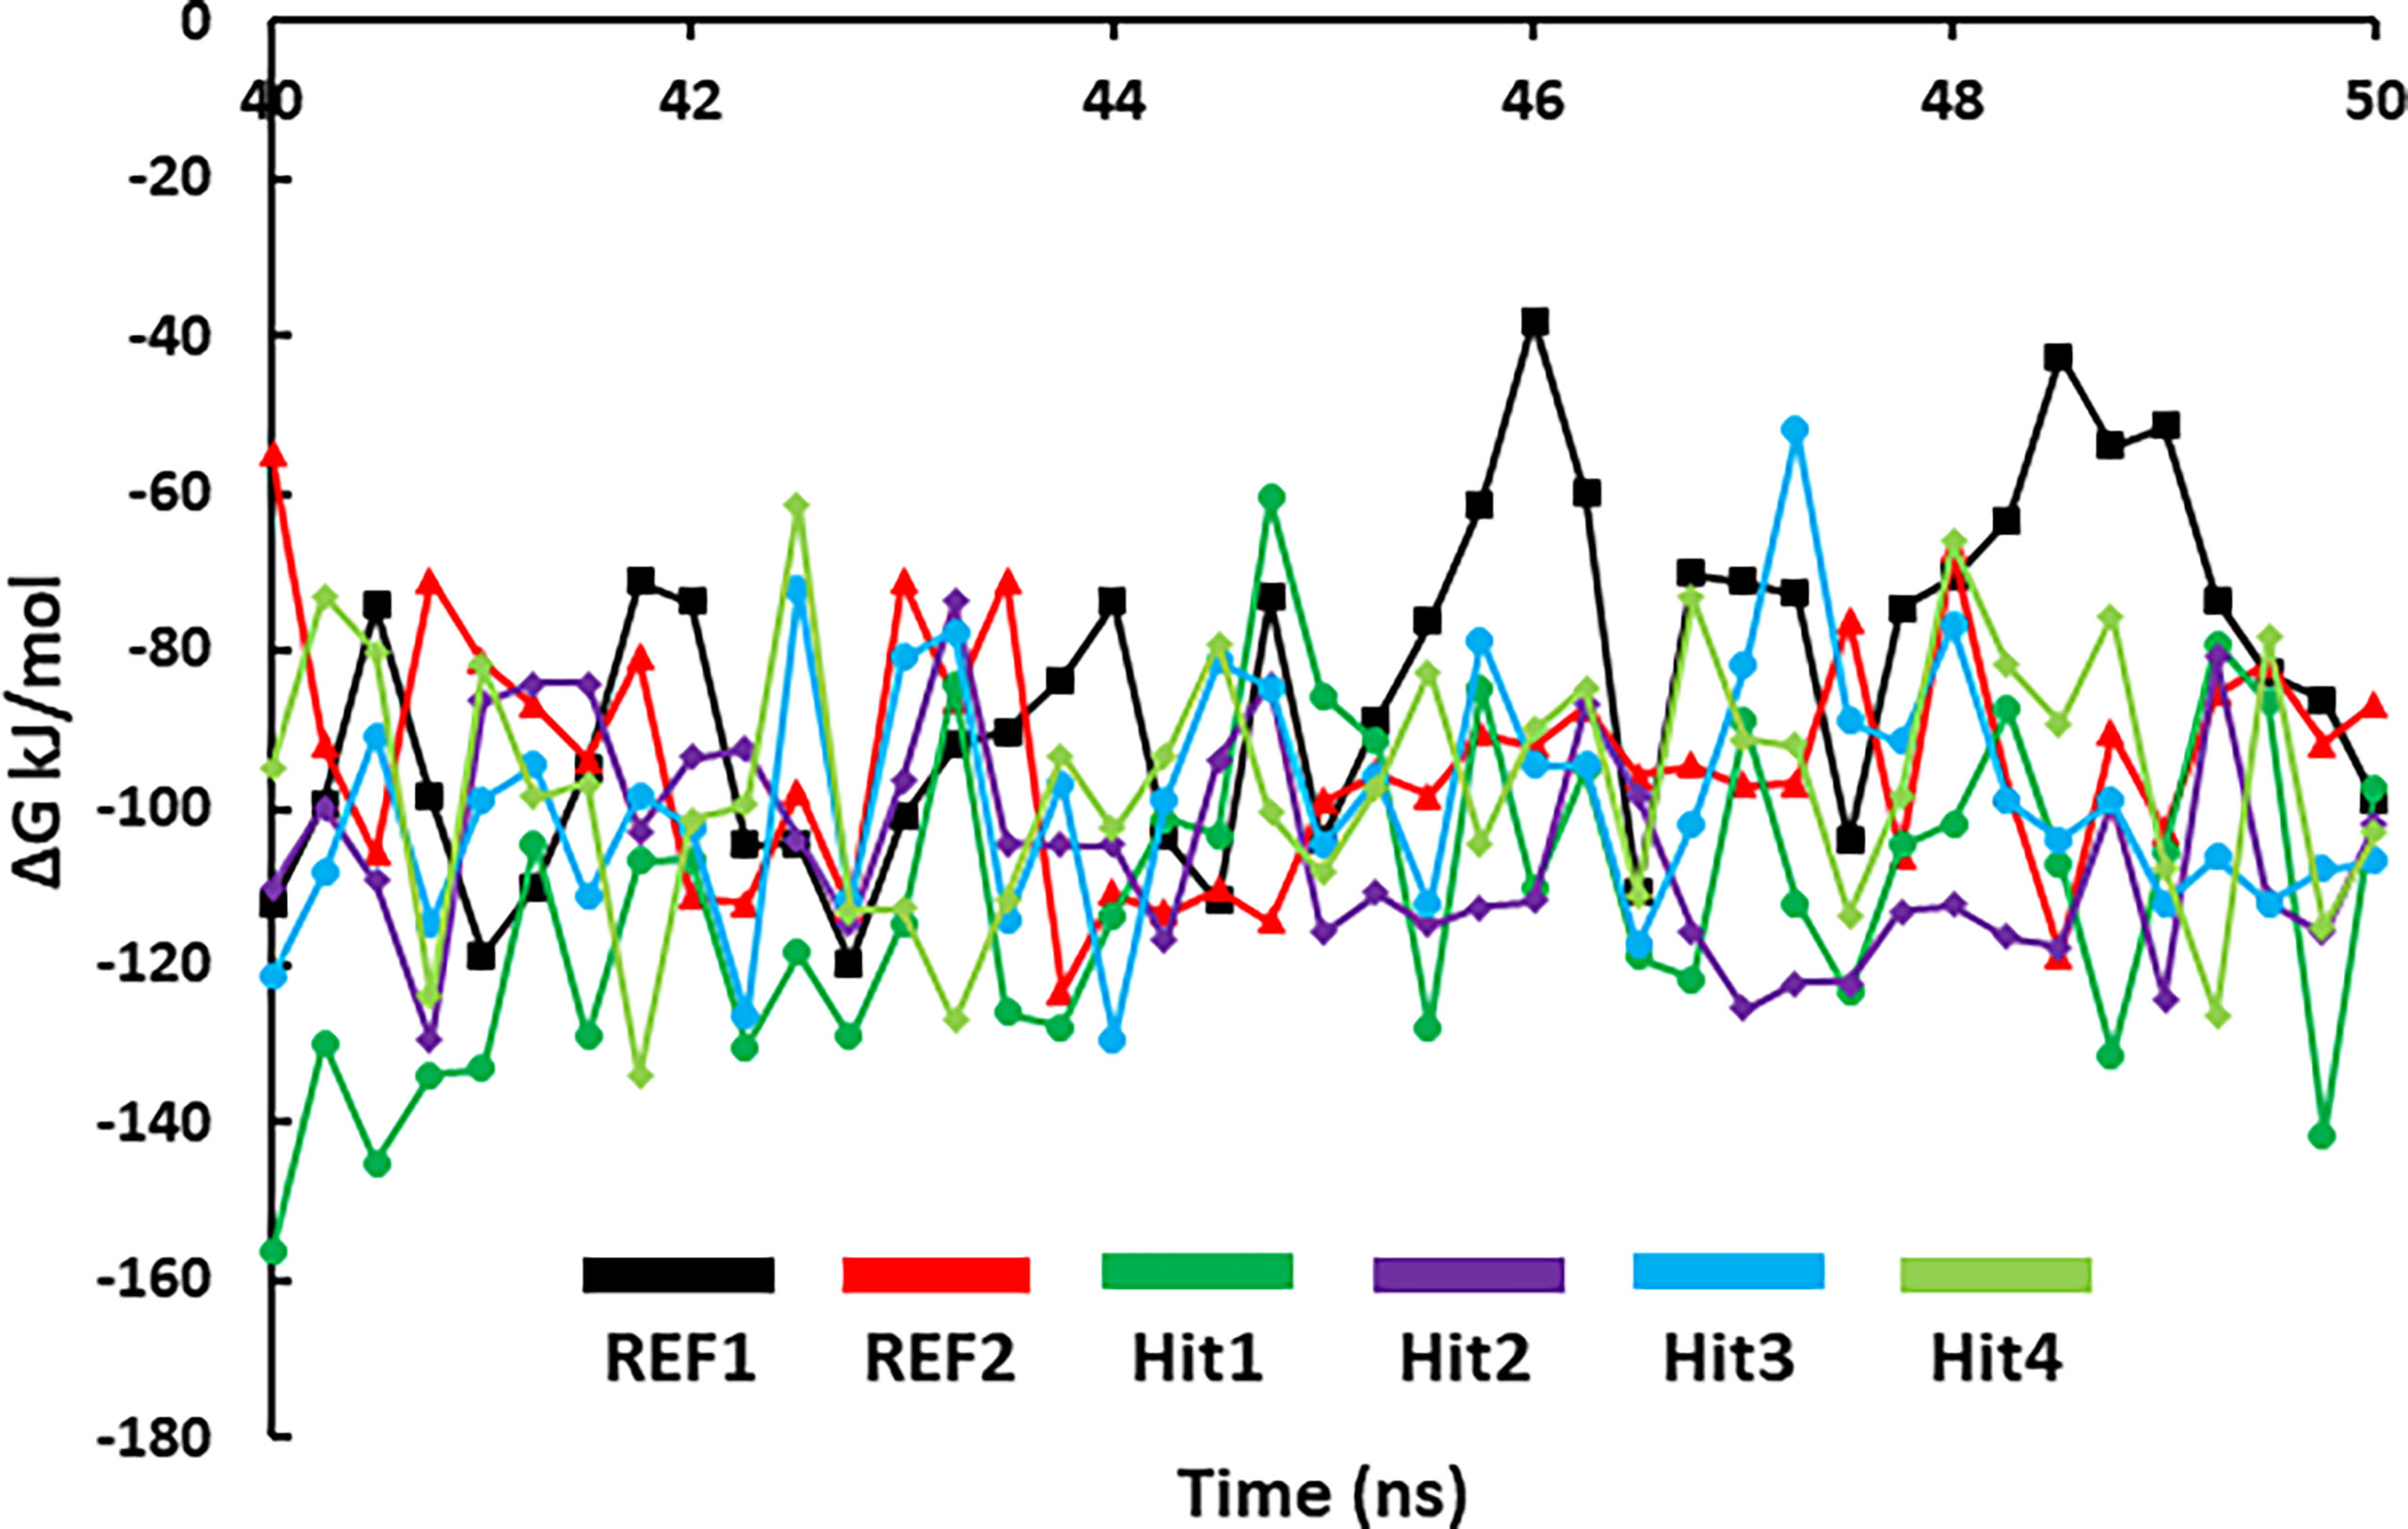
Figure 7 MM/PBSA predicted binding free energy of SYK-bound hit compounds and REF inhibitors. The stable trajectories from the last 10-ns MD simulations were utilized to estimate the energy values.
Identifying the molecular interaction of the potential inhibitors with the target protein is the key finding of the ligand and structure-based drug discovery reports. Lee et al. demonstrated that the SYK ATP-binding site can be divided into four subsites: the hinge region, the glycine-rich loop, the DFG motif, and the activation loop (Figure 3) (Lee et al., 2016). The average structures of complexes calculated from MD simulations were superimposed to study the binding mode. The superimposition of all individual complexes confirms that each inhibitor lodged in the ATP-binding site of SYK and obtained an analogous orientation to the co-crystal ligand (Figure S3). A literature survey revealed that gatekeeper Met448, hinge region Ala451 and Pro455, C-terminal Arg498, and DFG motif residue Asp512 are crucial for the interaction of inhibitors. Additionally, Pro455 is reported to provide selectivity for the inhibitors (Lucas et al., 2012; Lucas et al., 2014). The average structure of SYK bound with lanraplenib displayed two hydrogen bonds with Ala451 and Ser379 (Figure S4A). The binding mode of the lanraplenib-simulated SYK complex followed the X-ray structure of SYK bound with lanraplenib where a hydrogen bond with Ala451 was observed (Blomgren et al., 2020). Fostamatinib was noticed to show hydrogen bond interactions with Leu377, Glu376, and Ala451 (Figure S4B). The simulation studies were not reported in the past for fostamatinib with the SYK protein, but interestingly its prodrug R406 was studied under simulation conditions, and it was reported that it could form hydrogen bond interactions with Leu377 and Ala451, similar to our predicted binding mode (Marchetti et al., 2020). The molecular interactions of both the REF inhibitors were strengthened by multiple hydrophobic interactions with SYK active site residues (Figures S4C, S4D, and Table 4). The binding mode of the selected SYK inhibitors was observed to follow the REF inhibitors, especially the co-crystal drug lanraplenib. The binding mode of fostamatinib may be slightly different from other compounds. Interestingly Hit1, Hit2, and Hit3 are observed to have a quinazoline ring, and surprisingly Hit4 was observed to have a benzofuran ring (Table S4). Numerous reports suggest that both scaffolds have strong anticancer, antimicrobial, and antiviral effects; therefore, it can be hypothesized that these compounds may show good inhibitory potential in experimental studies (Nevagi et al., 2015; Bhat et al., 2021). The detailed molecular interactions of identified hit compounds are exposed in Figure 8. It can be perceived from Figure 8A that Hit1 forms hydrogen bond interactions with Arg498, Ser511, and DFG motif residue Asp512. Despite having similar scaffolds, Hit2 and Hit3 target different active site residues through hydrogen bonds. Hit2 forms a hydrogen bond interaction with Ala451 and Asn499 (Figure 8B). Hit3 forms hydrogen bonds with Ser379, Lys458, and Ala451 (Figure 8C). However, Hit4 obtained from different scaffold forms hydrogen bond interactions with Ser379, Lys375, Ala451, and Arg498 (Figures 8D). The quinazoline ring of Hit1, Hit2, and Hit3 was involved in multiple π–alkyl interactions, while this interaction was formed by the benzofuran ring in Hit4. Overall, it was observed that hit compounds similarly bind ATP-binding sites as REF inhibitors and target key active site residues. As inhibitors identified in the present study are of type I class, it is essential to compare the molecular interactions of hits with crucial residues of the ATP competitive site of SYK to achieve high selectivity over other kinases (Gagic et al.). Previous studies indicated that the sequence alignment of multiple kinases reveals residues Pro455 and Asn457 are the rare combination in the active site of SYK. Therefore, the inhibitor interaction with these residues may provide high selectivity to the compounds (Lucas et al., 2012; Huang et al., 2017). The detailed 2D molecular interaction maps of Hit1, Hit2, Hit3, and Hit4 showed that all form hydrophobic interactions with unique residue Pro455, and more interestingly, Hit4 also includes interactions with Asn457 (Figures S5A–D). Furthermore, a recent study pointed out that direct interactions with Asn499 may lead to a high selectivity for SYK inhibition (Lee et al., 2016). It is noteworthy that Hit2 forms a hydrogen bond with Asn499, whereas Hit1, Hit3, and Hit4 displayed a van der Waals interaction with Asn499. The detailed molecular interaction hydrogen bond distances of Hit1, Hit2, Hit3, Hit4, REF1, and REF2 are shown in Table 4, and Figures S4-S5.
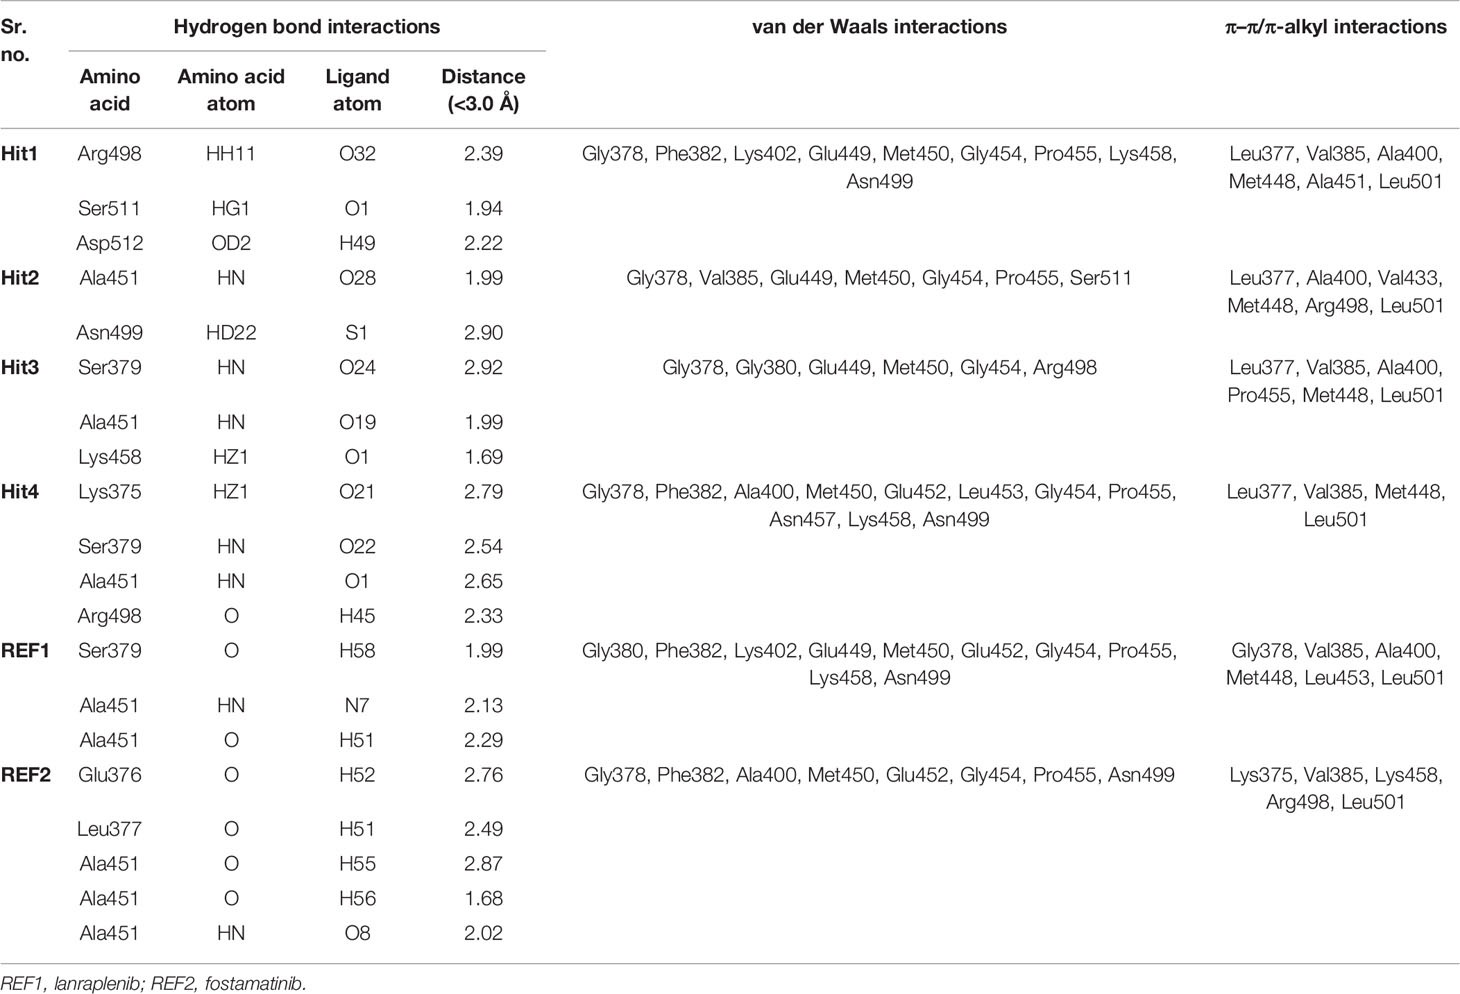
Table 4 The detailed molecular interactions of the potential SYK inhibitors and REF drugs with its active site residues.
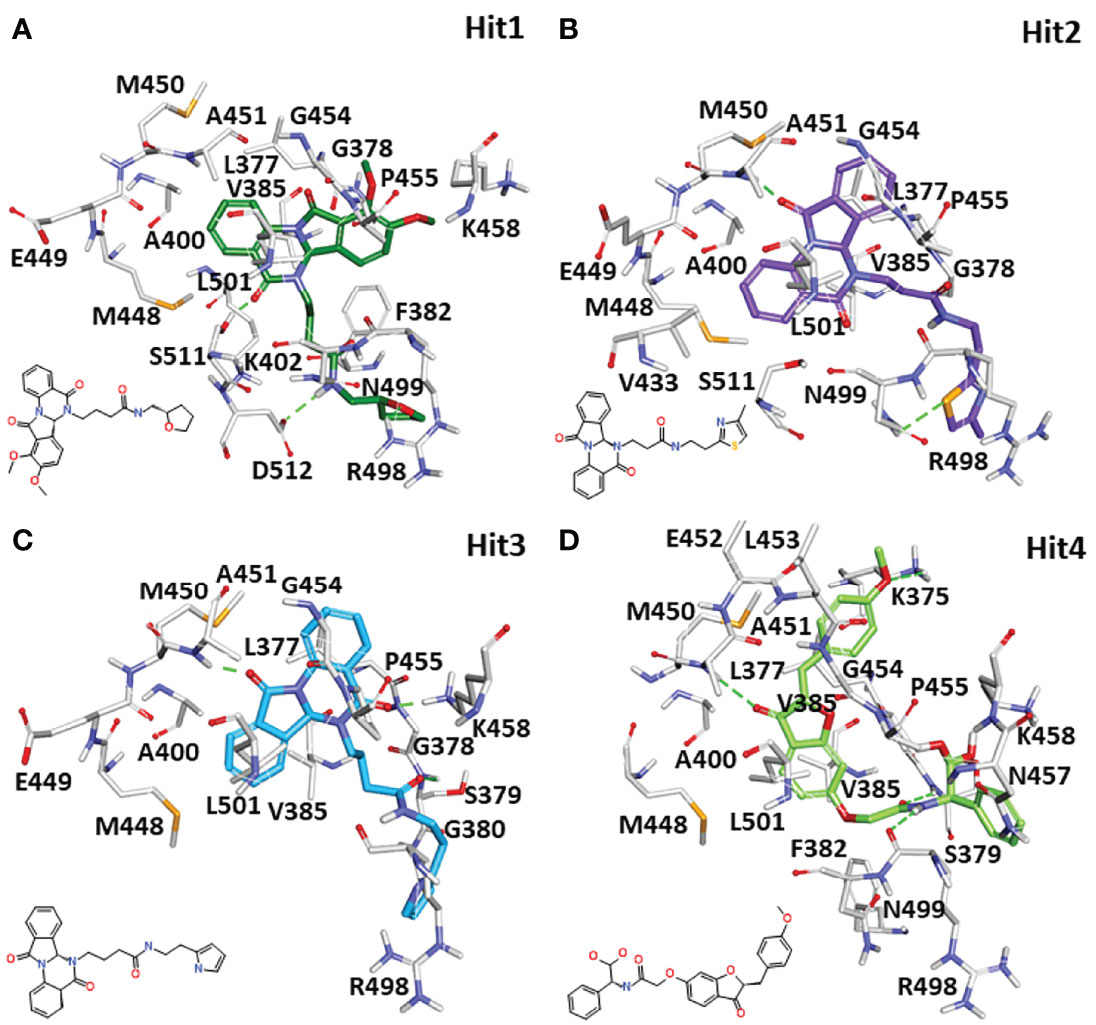
Figure 8 The 3D molecular interactions of the designated hit compounds inside the ATP competitive site of SYK. (A) Hit1, (B) Hit2, (C) Hit3, and (D) Hit4 are shown with the different color schemes in stick representation. The protein in the background is shown with a gray color line representation. The protein residues involved in polar and non-polar interactions were shown in gray stick representations. The hydrogen bonds were shown with green dashed lines. The 2D structure of each hit was shown on the left side of each 3D interaction image.
To get a detailed description of the contribution for each hotspot residue, the per-residue contribution was determined using the MM-PBSA method (Parate et al., 2021a). Figure 9 highlights the per-residue contribution where the top five residues involved in polar and non-polar interactions were shown. The active site residues Leu377, Phe382, Val385, Met488, Met450, Pro455, Arg498, and Leu501 significantly contributed to binding lanraplenib, fostamatinib, and hit compounds. Moreover, in the case of lanraplenib, residue Leu377 displayed the highest contribution for binding -8.62 kJ/mol, whereas, for fostamatinib, it was observed to be Leu501 (-10 kJ/mol). The highest contributing residue for binding of hit compounds was Phe382 (-10 kJ/mol) for Hit1, Leu501 (-10 kJ/mol) for Hit2, Leu377 (-8.51 kJ/mol) for Hit3, and Leu377 (-10 kJ/mol) for Hit4. Interestingly, the key residue Pro455 was reported to bind all the hit compounds, but a significant contribution was observed for Hit4 (-8.44 kJ/mol). The contribution by Pro455 for REF inhibitors was observed more significantly in fostamatinib (-9.76 kJ/mol) than lanraplenib (-4.5 kJ/mol). The residues Lys375, Ser379, Glu376, Lys402, Glu420, Glu449, Glu452, Lys458, Asp494, Arg498, Asp512, and Glu564 were reported to contribute positively; therefore, they may be responsible for polar interactions in REF inhibitors and hit compounds. From this analysis, it can be concluded that in non-polar interactions Pro455 and Leu501 were observed in both the REF inhibitors as well as all four selected hit compounds, indicating their significant role in inhibitor engagement; moreover, for polar interaction, Glu449 and Asp512 may be critical. This analysis provides essential information about the role of each active site residue in inhibitor binding and can thus be exploited in future structure-guided SYK inhibition studies.
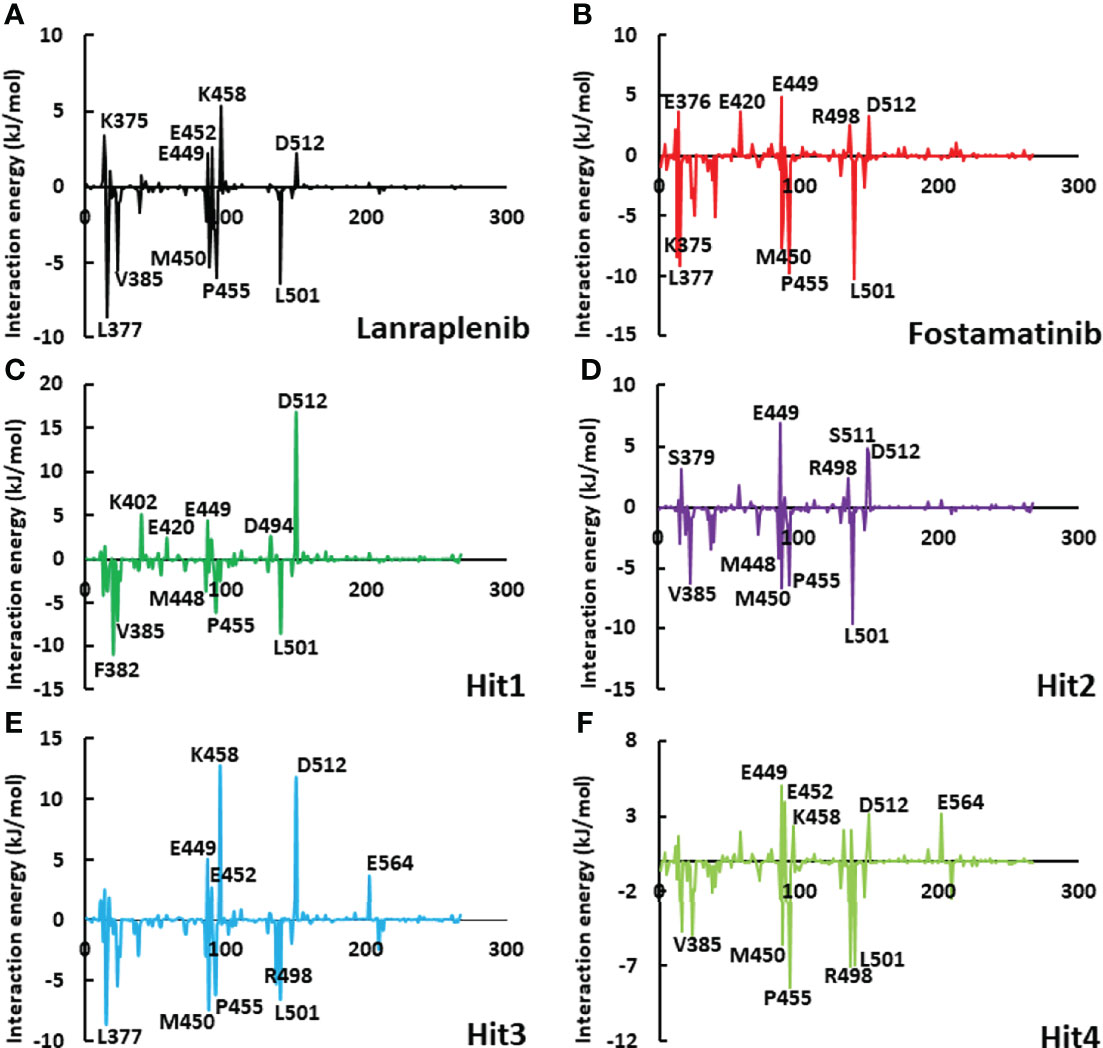
Figure 9 The graphical plot of the binding free energy decomposition on per residue for SYK-inhibitor complexes. The individual plots of (A) lanraplenib, (B) fostamatinib, (C) Hit1, (D) Hit2, (E) Hit3, and (F) Hit4 were shown with different color schemes. The residues shown on the graph’s upper side could contribute to electrostatic interactions, whereas residues on the lower side of the graph could contribute to hydrophobic interactions.
In the present report, we have produced a 3D-QSAR pharmacophore model for SYK utilizing the bioactivity knowledge of established inhibitors. The key features required for SYK inhibition were ensembled in a 3D model and further employed to screen a drug-like database to identify novel SYK inhibitor scaffolds. The affinity of the potential inhibitors toward SYK was studied using integrated molecular docking and molecular dynamics simulations. The two REF inhibitors, fostamatinib and lanraplenib, were used to select the final hit compounds based on key molecular interactions and lower binding free energy values. We propose four novel scaffolds which show desirable interactions with residues reported crucial for SYK inhibition as virtual candidates. These SYK inhibitor scaffolds with good drug-like properties may be utilized for SYK inhibition programs against various autoimmune and inflammatory diseases.
The original contributions presented in the study are included in the article/Supplementary Material. Further inquiries can be directed to the corresponding author.
VK and KL designed the study. VK and SP performed the experiments. VK compiled the manuscript. VK, SP, and KL analyzed the results. D and AZ did the formal analysis. All authors contributed to the article and approved the submitted version.
This work was supported by two National Research Foundation of Korea (NRF) grants funded by the Korean government (MSIT) (Grant Nos. NRF-2021R1F1A1059797 and NRF-2021R1A2B5B02002220).
The authors declare that the research was conducted in the absence of any commercial or financial relationships that could be construed as a potential conflict of interest.
All claims expressed in this article are solely those of the authors and do not necessarily represent those of their affiliated organizations, or those of the publisher, the editors and the reviewers. Any product that may be evaluated in this article, or claim that may be made by its manufacturer, is not guaranteed or endorsed by the publisher.
VK acknowledges the BK4 Program of Korean Government for providing the research scholarship.
The Supplementary Material for this article can be found online at: https://www.frontiersin.org/articles/10.3389/fcimb.2022.909111/full#supplementary-material
Bender, B. J., Gahbauer, S., Luttens, A., Lyu, J., Webb, C. M., Stein, R. M., et al. (2021). A Practical Guide to Large-Scale Docking. Nat. Protoc. 2021 1610 16, 4799–4832. doi: 10.1038/s41596-021-00597-z
Bhat, M., Belagali, S. L., Mamatha, S. V., Sagar, B. K., Sekhar, E. V. (2021). Importance of Quinazoline and Quinazolinone Derivatives in Medicinal Chemistry. Stud. Nat. Prod. Chem. 71, 185–219. doi: 10.1016/B978-0-323-91095-8.00005-2
Blomgren, P., Chandrasekhar, J., Di Paolo, J. A., Fung, W., Geng, G., Ip, C., et al. (2020). Discovery of Lanraplenib (GS-9876): A Once-Daily Spleen Tyrosine Kinase Inhibitor for Autoimmune Diseases. ACS Med. Chem. Lett. 11, 506–513. doi: 10.1021/ACSMEDCHEMLETT.9B00621/SUPPL_FILE/ML9B00621_SI_001.PDF
Cheng, A. M., Rowley, B., Pao, W., Hayday, A., Bolen, J. B., Pawson, T. (1995). Syk Tyrosine Kinase Required for Mouse Viability and B-Cell Development. Nature 378, 303–306. doi: 10.1038/378303A0
Currie, K. S., Kropf, J. E., Lee, T., Blomgren, P., Xu, J., Zhao, Z., et al. (2014). Discovery of GS-9973, a Selective and Orally Efficacious Inhibitor of Spleen Tyrosine Kinase. J. Med. Chem. 57, 3856–3873. doi: 10.1021/JM500228A/SUPPL_FILE/JM500228A_SI_001.PDF
Debnath, A. K. (2002). Pharmacophore Mapping of a Series of 2,4-Diamino-5-Deazapteridine Inhibitors of Mycobacterium Avium Complex Dihydrofolate Reductase. J. Med. Chem. 45, 41–53. doi: 10.1021/JM010360C
Duong-Ly, K. C., Peterson, J. R. (2013). The Human Kinome and Kinase Inhibition as a Therapeutic Strategy. Curr. Protoc. Pharmacol. 0 2. doi: 10.1002/0471141755.PH0209S60
Farmer, L. J., Bemis, G., Britt, S. D., Cochran, J., Connors, M., Harrington, E. M., et al. (2008). Discovery and SAR of Novel 4-Thiazolyl-2-Phenylaminopyrimidines as Potent Inhibitors of Spleen Tyrosine Kinase (SYK). Bioorg. Med. Chem. Lett. 18, 6231–6235. doi: 10.1016/J.BMCL.2008.09.106
Gagic, Z., Ruzic, D., Djokovic, N., Djikic, T., Nikolic, K.. (2020). In Silico Methods for Design of Kinase Inhibitors as Anticancer Drugs. Front. Chem. 7. doi: 10.3389/fchem.2019.00873
Genheden, S., Ryde, U. (2015). The MM/PBSA and MM/GBSA Methods to Estimate Ligand-Binding Affinities. Expert Opin. Drug Discovery 10, 449. doi: 10.1517/17460441.2015.1032936
Graves, J. D., Krebs, E. G. (1999). Protein Phosphorylation and Signal Transduction. Pharmacol. Ther. 82, 111–121. doi: 10.1016/S0163-7258(98)00056-4
Hirabayashi, A., Mukaiyama, H., Kobayashi, H., Shiohara, H., Nakayama, S., Ozawa, M., et al. (2008). Structure-Activity Relationship Studies of Imidazo[1,2-C]Pyrimidine Derivatives as Potent and Orally Effective Syk Family Kinases Inhibitors. Bioorg. Med. Chem. 16, 9247–9260. doi: 10.1016/J.BMC.2008.09.015
Hong, Y. H., Kim, J. H., Cho, J. Y. (2020). Ranunculus Bulumei Methanol Extract Exerts Anti-Inflammatory Activity by Targeting Src/Syk in NF-κb Signaling. Biomolecules 10. doi: 10.3390/BIOM10040546
Huang, Y., Zhang, Y., Fan, K., Dong, G., Li, B., Zhang, W., et al. (2017). Discovery of New Syk Inhibitors Through Structure-Based Virtual Screening. Bioorg. Med. Chem. Lett. 27, 1776–1779. doi: 10.1016/J.BMCL.2017.02.060
Humphrey, W., Dalke, A., Schulten, K. (1996). VMD: Visual Molecular Dynamics. J. Mol. Graph. 14, 33–38. doi: 10.1016/0263-7855(96)00018-5
John, S., Thangapandian, S., Arooj, M., Hong, J. C., Kim, K. D., Lee, K. W. (2011). Development, Evaluation and Application of 3D QSAR Pharmacophore Model in the Discovery of Potential Human Renin Inhibitors. BMC Bioinf. 12 Suppl 14. doi: 10.1186/1471-2105-12-S14-S4
Jones, G., Willett, P., Glen, R. C., Leach, A. R., Taylor, R. (1997). Development and Validation of a Genetic Algorithm for Flexible Docking. J. Mol. Biol. 267, 727–748. doi: 10.1006/JMBI.1996.0897
Karplus, M., McCammon, J. A. (2002). Molecular Dynamics Simulations of Biomolecules. Nat. Struct. Biol. 9, 646–652. doi: 10.1038/nsb0902-646
Kaserer, T., Beck, K. R., Akram, M., Odermatt, A., Schuster, D., Willett, P. (2015). Pharmacophore Models and Pharmacophore-Based Virtual Screening: Concepts and Applications Exemplified on Hydroxysteroid Dehydrogenases. Molecules 20, 22799. doi: 10.3390/MOLECULES201219880
Kaur, M., Singh, M., Silakari, O. (2013). Inhibitors of Switch Kinase “Spleen Tyrosine Kinase” in Inflammation and Immune-Mediated Disorders: A Review. Eur. J. Med. Chem. 67, 434–446. doi: 10.1016/J.EJMECH.2013.04.070
Kobayashi, T., Nakamura, S., Taniguchi, T., Yamamura, H. (1990). Purification and Characterization of a Cytosolic Protein-Tyrosine Kinase From Porcine Spleen. Eur. J. Biochem. 188, 535–540. doi: 10.1111/J.1432-1033.1990.TB15433.X
Kollman, P. A., Massova, I., Reyes, C., Kuhn, B., Huo, S., Chong, L., et al. (2000). Calculating Structures and Free Energies of Complex Molecules: Combining Molecular Mechanics and Continuum Models. Acc. Chem. Res. 33, 889–897. doi: 10.1021/AR000033J
Kumari, R., Kumar, R., Lynn, A. (2014). G-Mmpbsa -A GROMACS Tool for High-Throughput MM-PBSA Calculations. J. Chem. Inf. Model. 54, 1951–1962. doi: 10.1021/CI500020M/SUPPL_FILE/CI500020M_SI_001.PDF
Kumar, R., Kumar, V., Lee, K. W. (2021a). A Computational Drug Repurposing Approach in Identifying the Cephalosporin Antibiotic and Anti-Hepatitis C Drug Derivatives for COVID-19 Treatment. Comput. Biol. Med. 130, 104186. doi: 10.1016/J.COMPBIOMED.2020.104186
Kumar, V., Kumar, R., Parate, S., Yoon, S., Lee, G., Kim, D., et al. (2021b). Identification of ACK1 Inhibitors as Anticancer Agents by Using Computer-Aided Drug Designing. J. Mol. Struct. 1235, 130200. doi: 10.1016/J.MOLSTRUC.2021.130200
Kumar, V., Parate, S., Thakur, G., Lee, G., Ro, H. S., Kim, Y., et al. (2021c). Identification of CDK7 Inhibitors From Natural Sources Using Pharmacoinformatics and Molecular Dynamics Simulations. Biomed 9 1197. doi: 10.3390/BIOMEDICINES9091197
Kumar, V., Parate, S., Yoon, S., Lee, G., Lee, K. W. (2021d). Computational Simulations Identified Marine-Derived Natural Bioactive Compounds as Replication Inhibitors of SARS-CoV-2. Front. Microbiol. 12. doi: 10.3389/FMICB.2021.647295/BIBTEX
Kumar, R., Son, M., Bavi, R., Lee, Y., Park, C., Arulalapperumal, V., et al. (2015). Novel Chemical Scaffolds of the Tumor Marker AKR1B10 Inhibitors Discovered by 3D QSAR Pharmacophore Modeling. Acta Pharmacol. Sin. 36, 998–1012. doi: 10.1038/APS.2015.17
Lee, S. J., Choi, J. S., Han, B. G., Kim, H. S., Song, H. J., Lee, J., et al. (2016). Crystal Structures of Spleen Tyrosine Kinase in Complex With Novel Inhibitors: Structural Insights for Design of Anticancer Drugs. FEBS J. 283, 3613–3625. doi: 10.1111/FEBS.13831
Liddle, J., Atkinson, F. L., Barker, M. D., Carter, P. S., Curtis, N. R., Davis, R. P., et al. (2011). Discovery of GSK143, a Highly Potent, Selective and Orally Efficacious Spleen Tyrosine Kinase Inhibitor. Bioorg. Med. Chem. Lett. 21, 6188–6194. doi: 10.1016/J.BMCL.2011.07.082
Lipinski, C. A., Lombardo, F., Dominy, B. W., Feeney, P. J. (2001). Experimental and Computational Approaches to Estimate Solubility and Permeability in Drug Discovery and Development Settings. Adv. Drug Deliv. Rev. 46, 3–26. doi: 10.1016/S0169-409X(00)00129-0
Liu, D., Mamorska-Dyga, A. (2017). Syk Inhibitors in Clinical Development for Hematological Malignancies. J. Hematol. Oncol. 10, 1–7. doi: 10.1186/S13045-017-0512-1/TABLES/1
Lucas, M. C., Bhagirath, N., Chiao, E., Goldstein, D. M., Hermann, J. C., Hsu, P. Y., et al. (2014). Using Ovality to Predict Nonmutagenic, Orally Efficacious Pyridazine Amides as Cell Specific Spleen Tyrosine Kinase Inhibitors. J. Med. Chem. 57, 2683–2691. doi: 10.1021/JM401982J/SUPPL_FILE/JM401982J_SI_001.PDF
Lucas, M. C., Goldstein, D. M., Hermann, J. C., Kuglstatter, A., Liu, W., Luk, K. C., et al. (2012). Rational Design of Highly Selective Spleen Tyrosine Kinase Inhibitors. J. Med. Chem. 55, 10414–10423. doi: 10.1021/JM301367C/SUPPL_FILE/JM301367C_SI_001.PDF
Mali, S. N., Pandey, A. (2021). Molecular Modeling Studies on 2,4-Disubstituted Imidazopyridines as Anti-Malarials: Atom-Based 3d-QSAR, Molecular Docking, Virtual Screening, In-Silico ADMET and Theoretical Analysis. J. Comput. Biophys. Chem. 20, 267–282. doi: 10.1142/S2737416521500125
Mali, S. N., Pandey, A. (2022). Balanced QSAR and Molecular Modeling to Identify Structural Requirements of Imidazopyridine Analogues as Anti-Infective Agents Against Trypanosomiases. J. Comput. Biophys. Chem. 21, 83–114. doi: 10.1142/S2737416521410015
Marchetti, G., Dessì, A., Dallocchio, R., Tsamesidis, I., Pau, M. C., Turrini, F. M., et al. (2020). Syk Inhibitors: New Computational Insights Into Their Intraerythrocytic Action in Plasmodium Falciparum Malaria. Int. J. Mol. Sci. 21 7009. doi: 10.3390/IJMS21197009
Mócsai, A., Ruland, J., Tybulewicz, V. L. J. (2010). The SYK Tyrosine Kinase: A Crucial Player in Diverse Biological Functions. Nat. Rev. Immunol. 10, 387–402. doi: 10.1038/nri2765
Mullard, A. (2018). FDA Approves First-in-Class SYK Inhibitor. Nat. Rev. Drug Discovery 17, 385. doi: 10.1038/NRD.2018.96
Nam, S. T., Kim, H. W., Kim, H. S., Park, Y. H., Lee, D., Lee, M. B., et al. (2018). Furaltadone Suppresses IgE-Mediated Allergic Response Through the Inhibition of Lyn/Syk Pathway in Mast Cells. Eur. J. Pharmacol. 828, 119–125. doi: 10.1016/J.EJPHAR.2018.03.035
Nevagi, R. J., Dighe, S. N., Dighe, S. N. (2015). Biological and Medicinal Significance of Benzofuran. Eur. J. Med. Chem. 97, 561–581. doi: 10.1016/J.EJMECH.2014.10.085
Padilla, F., Bhagirath, N., Chen, S., Chiao, E., Goldstein, D. M., Hermann, J. C., et al. (2013). Pyrrolopyrazines as Selective Spleen Tyrosine Kinase Inhibitors. J. Med. Chem. 56, 1677–1692. doi: 10.1021/JM301720P/SUPPL_FILE/JM301720P_SI_001.PDF
Pamuk, O. N., Tsokos, G. C. (2010). Spleen Tyrosine Kinase Inhibition in the Treatment of Autoimmune, Allergic and Autoinflammatory Diseases. Arthritis Res. Ther. 12, 1–11. doi: 10.1186/AR3198/FIGURES/6
Parate, S., Kumar, V., Chan Hong, J., Lee, K. W. (2021a). Investigating Natural Compounds Against Oncogenic RET Tyrosine Kinase Using Pharmacoinformatic Approaches for Cancer Therapeutics. RSC Adv. 12, 1194–1207. doi: 10.1039/D1RA07328A
Parate, S., Kumar, V., Danishuddin, Hong, J. C., Lee, K. W. (2021b). Computational Investigation Identified Potential Chemical Scaffolds for Heparanase as Anticancer Therapeutics. Int. J. Mol. Sci. 22. doi: 10.3390/IJMS22105311
Parate, S., Kumar, V., Hong, J. C., Lee, K. W. (2021c). Investigation of Marine-Derived Natural Products as Raf Kinase Inhibitory Protein (RKIP)-Binding Ligands. Mar. Drugs 19, 581. doi: 10.3390/MD19100581
Pronk, S., Páll, S., Schulz, R., Larsson, P., Bjelkmar, P., Apostolov, R., et al. (2013). GROMACS 4.5: A High-Throughput and Highly Parallel Open Source Molecular Simulation Toolkit. Bioinformatics 29, 845–854. doi: 10.1093/BIOINFORMATICS/BTT055
Sakkiah, S., Lee, K. W. (2012). Pharmacophore-Based Virtual Screening and Density Functional Theory Approach to Identifying Novel Butyrylcholinesterase Inhibitors. Acta Pharmacol. Sin. 33, 964–978. doi: 10.1038/APS.2012.21
Sakkiah, S., Thangapandian, S., John, S., Kwon, Y. J., Lee, K. W. (2010). 3d QSAR Pharmacophore Based Virtual Screening and Molecular Docking for Identification of Potential HSP90 Inhibitors. Eur. J. Med. Chem. 45, 2132–2140. doi: 10.1016/J.EJMECH.2010.01.016
Sapay, N., Tieleman, D. P. (2011). Combination of the CHARMM27 Force Field With United-Atom Lipid Force Fields. J. Comput. Chem. 32, 1400–1410. doi: 10.1002/JCC.21726
Shao, Y., Zhang, S., Zhang, Y., Liu, Z. (2021). Recent Advance of Spleen Tyrosine Kinase in Diseases and Drugs. Int. Immunopharmacol. 90, 107168. doi: 10.1016/J.INTIMP.2020.107168
Siveen, K. S., Prabhu, K. S., Achkar, I. W., Kuttikrishnan, S., Shyam, S., Khan, A. Q., et al. (2018). Role of Non Receptor Tyrosine Kinases in Hematological Malignances and its Targeting by Natural Products. Mol. Cancer 17. doi: 10.1186/S12943-018-0788-Y
Sundarapandian, T., Shalini, J., Sugunadevi, S., Woo, L. K. (2010). Docking-Enabled Pharmacophore Model for Histone Deacetylase 8 Inhibitors and its Application in Anti-Cancer Drug Discovery. J. Mol. Graph. Model. 29, 382–395. doi: 10.1016/J.JMGM.2010.07.007
Taniguchis, ,. T., Kobayashiss, T., Kondon, J., Takahashill, K., Nakamurall, H., Suzukill, J., et al. (1991). THE JOURNAL OF BIOLOGICAL CHEMISTRY Molecular Cloning of a Porcine Gene Syk That Encodes a 72-kDa Protein-Tyrosine Kinase Showing High Susceptibility to Proteolysis*. J. Biol. Chem. 266, 15790–15796. doi: 10.1016/S0021-9258(18)98478-4
Thoma, G., Smith, A. B., Van Eis, M. J., Vangrevelinghe, E., Blanz, J., Aichholz, R., et al. (2015a). Discovery and Profiling of a Selective and Efficacious Syk Inhibitor. J. Med. Chem. 58, 1950–1963. doi: 10.1021/JM5018863
Thoma, ,. G., Veenstra, S., Strang, R., Blanz, J., Vangrevelinghe, E., Berghausen, J., et al. (2015b). Orally Bioavailable Syk Inhibitors With Activity in a Rat PK/PD Model. Bioorg. Med. Chem. Lett. 25, 4642–4647. doi: 10.1016/J.BMCL.2015.08.037
Turner, M., Mee, P. J., Costello, P. S., Williams, O., Price, A. A., Duddy, L. P., et al. (1995). Perinatal Lethality and Blocked B-Cell Development in Mice Lacking the Tyrosine Kinase Syk. Nature 378, 298–302. doi: 10.1038/378298A0
Van Der Spoel, D., Lindahl, E., Hess, B., Groenhof, G., Mark, A. E., Berendsen, H. J. C. (2005). GROMACS: Fast, Flexible, and Free. J. Comput. Chem. 26, 1701–1718. doi: 10.1002/JCC.20291
Veber, D. F., Johnson, S. R., Cheng, H. Y., Smith, B. R., Ward, K. W., Kopple, K. D. (2002). Molecular Properties That Influence the Oral Bioavailability of Drug Candidates. J. Med. Chem. 45, 2615–2623. doi: 10.1021/JM020017N/SUPPL_FILE/JM020017N_S.PDF
Wang, X., Guo, J., Ning, Z., Wu, X. (2018). Discovery of a Natural Syk Inhibitor From Chinese Medicine Through a Docking-Based Virtual Screening and Biological Assay Study. Molecules 23. doi: 10.3390/MOLECULES23123114
Keywords: SYK inhibitor, 3D QSAR, pharmacophore, autoimmune diseases, molecular docking, MD simulation
Citation: Kumar V, Parate S, D, Zeb A, Singh P, Lee G, Jung TS, Lee KW and Ha MW (2022) 3D-QSAR-Based Pharmacophore Modeling, Virtual Screening, and Molecular Dynamics Simulations for the Identification of Spleen Tyrosine Kinase Inhibitors. Front. Cell. Infect. Microbiol. 12:909111. doi: 10.3389/fcimb.2022.909111
Received: 31 March 2022; Accepted: 30 May 2022;
Published: 30 June 2022.
Edited by:
Luciana Scotti, Federal University of Paraíba, BrazilReviewed by:
Hao Zhang, University of Pennsylvania, United StatesCopyright © 2022 Kumar, Parate, Danishuddin, Zeb, Singh, Lee, Jung, Lee and Ha. This is an open-access article distributed under the terms of the Creative Commons Attribution License (CC BY). The use, distribution or reproduction in other forums is permitted, provided the original author(s) and the copyright owner(s) are credited and that the original publication in this journal is cited, in accordance with accepted academic practice. No use, distribution or reproduction is permitted which does not comply with these terms.
*Correspondence: Min Woo Ha, bWludWhhQGplanVudS5hYy5rcg==
†These authors have contributed equally to this work
Disclaimer: All claims expressed in this article are solely those of the authors and do not necessarily represent those of their affiliated organizations, or those of the publisher, the editors and the reviewers. Any product that may be evaluated in this article or claim that may be made by its manufacturer is not guaranteed or endorsed by the publisher.
Research integrity at Frontiers
Learn more about the work of our research integrity team to safeguard the quality of each article we publish.