- 1Institute of Medical Biology, Chinese Academy of Medical Sciences and Peking Union Medical College, Kunming, China
- 2Department of Laboratory Medicine, Yunnan Provincial Institute of Infectious Diseases, Kunming, China
- 3Department of Laboratory Medicine, First Affiliated Hospital of Kunming Medical University, Kunming, China
- 4Yunnan Key Laboratory of Laboratory Medicine, First Affiliated Hospital of Kunming Medical University, Kunming, China
- 5Yunnan Innovation Team of Clinical Laboratory and Diagnosis, First Affiliated Hospital of Kunming Medical University, Kunming, China
- 6Department of Gynecology, First Affiliated Hospital of Kunming Medical University, Kunming, China
- 7Department of Medical Records and Statistics, First Affiliated Hospital of Kunming Medical University, Kunming, China
- 8Department of Disease Control and Prevention, The First People’s Hospital of Yunnan Province, The Affiliated Hospital of Kunming University of Science and Technology, Kunming, China
- 9National Health Commission (NHC) Key Laboratory of Drug Addiction Medicine, First Affiliated Hospital of Kunming Medical University, Kunming Medical University, Kunming, China
- 10Scientific Research Laboratory Center, First Affiliated Hospital of Kunming Medical University, Kunming, China
Objective: To investigate trends in clinical monitoring indices in HIV/AIDS patients receiving antiretroviral therapy (ART) at baseline and after treatment in Yunnan Province, China and to provide the basis for guiding clinical treatment to obtain superior clinical outcomes.
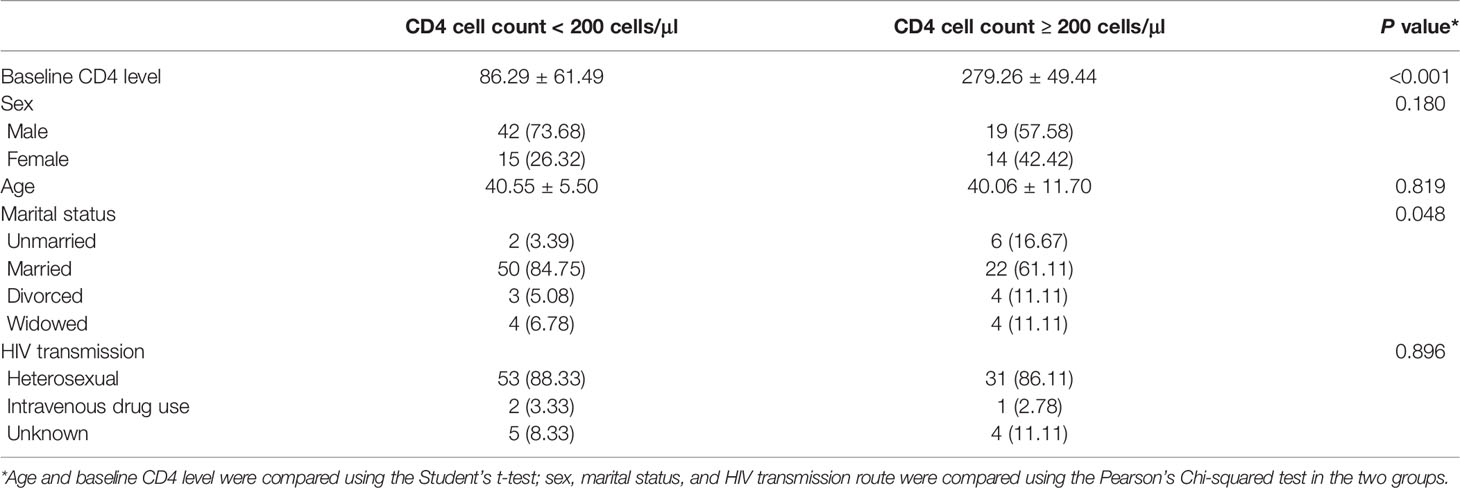
Methods: A total of 96 HIV/AIDS patients who had started and persisted in highly active ART treatment from September 2009 to September 2019 were selected. Of these, 54 had a CD4 cell count < 200 cells/μl while 42 had a CD4 cell count ≥ 200 cells/μl. Routine blood tests, liver and renal function, and lipid levels were measured before and 3, 6, 9, and 12 months after treatment. Lymphocyte subset counts and viral load were measured once per year, and recorded for analysis and evaluation. Three machine learning models (support vector machine [SVM], random forest [RF], and multi-layer perceptron [MLP]) were constructed that used the clinical indicators above as parameters. Baseline and follow-up results of routine blood and organ function tests were used to analyze and predict CD4+ T cell data after treatment during long-term follow-up. Predictions of the three models were preliminarily evaluated.
Results: There were no statistical differences in gender, age, or HIV transmission route in either patient group. Married individuals were substantially more likely to have <200 CD4+ cells/μl. There was a strong positive correlation between ALT and AST (r = 0.587) and a positive correlation between CD4 cell count and platelet count (r = 0.347). Platelet count was negatively correlated with ALT (r = -0.229), AST (r = -0.251), and positively correlated with WBCs (r = 0.280). Compared with the CD4 cell count < 200 cells/μl group, all three machine learning models exhibited a better predictive capability than for patients with a CD4 cell count ≥ 200 cells/μl. Of all indicators, the three models best predicted the CD4/CD8 ratio, with results that were highly consistent. In patients with a CD4 cell count < 200 cells/μl, the SVM model had the best performance for predicting the CD4/CD8 ratio, while the CD4/CD8 ratio was best predicted by the RF model in patients with a CD4 cell count ≥ 200 cells/μl.
Conclusion: By the incorporation of clinical indicators in SVM, RF, and MLP machine learning models, the immune function and recuperation of HIV/AIDS patients can be predicted and evaluated, thereby better guiding clinical treatment.
Introduction
AIDS remains a serious public health problem in China (Xu et al., 2014; Chen et al., 2015; Chen et al., 2018). Yunnan province is located on China’s southwestern border with Vietnam, Myanmar, and Laos and has a large cross-border population. Yunnan is also close to the Golden Triangle, China’s largest drug-producing region (Jia et al., 2008; Li et al., 2010; Li et al., 2016). In 1989, the first outbreak of human immunodeficiency virus type 1 (HIV-1) among injecting drug users occurred in Dehong Prefecture, Yunnan (Jia et al., 2011). Since then, Yunnan has become the center of an HIV-1 epidemic in China and the country’s worst-hit region for AIDS (Wang et al., 2015; Li et al., 2016; Zhu et al., 2018). Studies show that nearly 25% of new HIV cases in China come from Yunnan (Xiao et al., 2007; Duan et al., 2008; Chow et al., 2013), of which 92.6% are caused by unprotected sex (Su et al., 2016; Li et al., 2017; Zhu et al., 2018).
HIV is a retrovirus that primarily infects CD4+ T lymphocytes, leading to a progressive decline in their number, gradually weakening the host’s immune system leading to acquired immune deficiency syndrome (AIDS). In untreated infected patients, the numbers of CD4 cells decline progressively (Février et al., 2011), and so the CD4 cell count has become an important indicator for the selection of treatment plans and measurement of the effectiveness of antiretroviral therapy (ART) (Gazzard and Moyle, 1998; Carpenter et al., 2000; Dybul et al., 2002). In addition, the number of CD4+ T lymphocytes is an important indicator by which to judge the progression of the disease and evaluate patient prognosis. After receiving antiviral treatment, patients infected with HIV undergo a period of immune reconstruction of variable duration. Absolute T cell count is the most reliable indicator of disease progression (Abbass and Lichtman, 2008).
In recent years, multiple mathematical models have been established in which HIV infection is related to CD4+ T cell number (Hou and Ma, 2009; Wang and Song, 2009; Li and Ye, 2010). The results of these mathematical models provide theoretical guidance and suggestions for the prevention and treatment of AIDS. As early as 1999, the researcher Perelson et al. (Perelson and Nelson, 1999) introduced a model of HIV infection incorporating CD4+ T cell number. There have been many subsequent models based on CD4+ T cells as the principal variable. For example, Chen et al., (2007) used TLC(T lymphocyte,TLC) to predict CD4+ T cell count. Singh et al. (Singh and Mars, 2010) used a support vector machine with mined data to predict changes in CD4 cell count in HIV infected patients using genome sequencing, current viral load, and the number of weeks of follow-up as predictive indicators. Jingquan et al. (Wang et al., 2006) divided the CD4+ T lymphocyte counts of patients into three categories depending on the total lymphocyte count using a decision tree, predicting CD4+ T lymphocyte counts of less than 350/μL. Such estimates of CD4+ T cell number trajectory are essential for public health models as they predict the course of HIV epidemics (Eshun-Wilson et al., 2012; Rowley, 2014; Ren et al., 2017). However, the majority of such models include only routine blood data as parameters, with a follow-up time of less than three years. No studies have incorporated routine blood tests, lymphoid subgroup count, viral load, liver function, renal function, and blood lipids in addition to other indicators into the modeling, representing the innovative feature, and value, of the present study. The model will assist in the prompt prediction of immune response and timely adoption of adjuvant therapy to improve patient immune function. Machine learning models have widespread applications in medical research, almost any data type can be used to build predictive models. Since the inconsistent prediction accuracy in different models, the prediction results shared by multiple models are more accurate (Huang et al., 2018; Renganathan, 2019; Blanchet et al., 2020). This study used three machine learning methods to build the predictive model.
In Yunnan province, a relatively underdeveloped frontier province, it is not feasible to count CD4 or other lymphocyte subsets because these parameters depend on a flow cytometry platform. For confirmed HIV/AIDS patients and others during follow-up, indicators such as routine blood and liver function tests, etc. are more readily available, thus, the present study aims to construct three different models based on different baseline levels of CD4, CD8, the CD4/CD8 ratio and other follow-up results, among newly diagnosed HIV/AIDS patients with a CD4 cell count < 200 cells/μl and CD4 cell count ≥ 200 cells/μl. The model can predict changes in immune function and thereby calculate the prognosis of HIV/AIDS patients, allowing an appropriate selection of clinical antiviral drugs. The model has the potential for considerable cost savings for diagnosis and follow-up. The benefits to infected patients are clear.
Methods
Ethics Approval
The research protocol used in the present study has been reviewed by the Ethics Committee of the First Affiliated Hospital of Kunming Medical University. Informed consent was obtained from all participants included in the study prior to enrollment, and all information and data were confirmed for analysis.
Sample Collection
A retrospective study was conducted on HIV/AIDS diagnosis and follow-up patients from the First Affiliated Hospital of Kunming Medical University. Of the 96 patients, the longest follow-up time was 9.9 years while the shortest was 2.6 years, with a median duration of 5.9 years. All confirmed patients were screened and the presence of HIV antibody confirmed by standard methods, Western blot analysis, and nucleic acid testing as a measure of HIV viral load as a supplementary test, if necessary. All confirmed patients were diagnosed in accordance with the national technical specifications for HIV/AIDS Testing, 2020.Among 96 patients with HIV/AIDS, according to the Chinese AIDS diagnosis and treatment guidelines, the main treatment regimen was lamivudine + zidovudine + efavirenz (3TC+AZT+EFV) and lamivudine + Zidovudine + nevirapine (3TC+AZT+NVP), and the dosage was strictly in accordance with the guidelines,and in accordance with China’s AIDS diagnosis and treatment guidelines.
Of the 96 HIV/AIDS patients who began and adhered to highly active ART (HAART) during the 10 year period from September 2009 to September 2019, 54 had a CD4 cell count of < 200 cells/μl while 42 had a count of ≥200 cells/μl. In accordance with the requirements of the National information management standards for free antiviral therapy, routine blood tests, liver and kidney function, and blood lipid levels were followed up 3, 6, 9, and 12 months before and after treatment. Free lymphocyte subset counts and viral load tests were performed once per year. All test results were recorded for analysis and evaluation.
The treatment plan and medical inclusion criteria for patients were those stated in the “National Manual for Free HIV Antiviral Treatment (2nd edition)”. All patients signed the “Informed Consent for Free HIV antiviral treatment” document, allowing drugs to be provided free of charge by the state.
Laboratory Testing
A 2ml sample of venous blood was collected from each HIV/AIDS patient on an empty stomach at each time point. Blood cells were analyzed by flow cytometry (FACSCan II, BD Biosciences, San Jose, CA) using a combined CD3/CD4/CD8/CD45 Multitest reagent (BD Biosciences, San Jose, CA), allowing the absolute number of lymphocyte subsets to be measured and analyzed. All tests were completed less than 4 hours after venous blood collection. White blood cell (WBC) and platelet counts and hemoglobin (Hb) concentration were measured by routine blood testing using a Nisen Meikang automatic hematocyte counter (Japan). Total cholesterol (TC), total triglyceride (TG), alanine transaminase (ALT), aspartate aminotransferase (AST), and creatinine levels, aspects of blood lipids, and liver and renal function tests were performed using a Roche Cobas 8000 analyzer. Samples were prepared using a High Pure System Viral Acid kit, while a COBAS TaqMan 48 analyzer was used for automatic amplification and measurement. Samples were tested after routine daily indoor quality control testing.
Data Preprocessing
For each sample, we deleted records with missing CD4/CD8 ratio or anti-HIV treatment, all variables (including gender, age, marital status, route of infection, liver and kidney function, blood lipid levels, routine blood tests, lymphoid subsets, and HIV viral load data at diagnosis and at each follow-up) were first normalized then processed in accordance with the following formulae:
where vi indicates the tested value of a clinicopathological variable at day i, v0 represents a baseline measurement value, xi is a generated variable and yi is the corresponding score at day i. The generated matrix X and vector Y were then used for construction of the various machine learning models.
Support Vector Machine Model
A support vector machine (SVM) is a category of generalized linear classifier that performs binary classification on data by supervised learning, having as a decision boundary the maximum margin hyperplane that solves the learning samples (Huang et al., 2018). SVM uses a hinge loss function to calculate the empirical risk and adds a regularization term to the solution system to optimize the structural risk. The model operates as a robust classifier using sparse data. SVM can perform nonlinear classification through kernel methods and represents a common kernel learning method. Using such methods, the robustness and sparsity of an SVM reduces the computational and memory overhead of the kernel matrices while ensuring that a reliable solution is obtained. The present study used the “SVR” function in the “scikit-learn” Python package to build the model. The parameter settings are: kernel=‘rbf’, degree=3, gamma=‘scale’, and C=1.0.
Random Forest Model
A random forest (RF) refers to a classifier using multiple decision trees to train and predict samples. Output categories are determined by the mode of the output category of the individual trees (Blanchet et al., 2020). Random forests have the advantages of generating highly accurate classifiers while dealing with a large number of input variables and balancing errors. The present study used the “RandomForestRegressor” function in the “scikit-learn” Python package with all models constructed using the following parameters: n_estimators=100, criterion=‘squared_error’, min_samples_split=2, and min_samples_leaf=1.
Multi-Layer Perceptron Model
A multi-layer perceptron (MLP) is a class of feedforward artificial neural network. Neural networks are operational models that consist of interconnections between a large number of nodes (or neurons). Each node represents a specific output function, described as an excitation function. The connection between every two nodes represents a weighted value for the signal passing through the connection, known as the weight, equivalent to the memory of the artificial neural network (Renganathan, 2019). The output of the network varies according to the method by which the network is connected, the weight value, and the excitation function. The network itself is generally an approximation of a certain algorithm or function in nature, and may also be an expression of a logic strategy. An MLP consists of at least three layers of nodes: an input layer, a hidden layer, and an output layer. Except for the input nodes, each node represents a neuron using a nonlinear activation function. The present study used the “MLPRegressor” function in the “scikit-learn” Python package, with parameter settings: solver=‘lbfgs’, alpha=1e-5, hidden_layer_sizes= (Li et al., 2010; Chen et al., 2015), and random_state=1.
Statistical Analysis
Continuous variables (including age and baseline CD4 level) are presented as means ± standard deviation while the means of these variables in the 2 groups were compared using a student’s t-test. Categorical variables (sex, marital status, and HIV transmission route) are presented as numbers (or percentages of cases) while the prevalence of these variables was compared using a Pearson’s Chi-squared test. Due to the small sample sizes for a number of variables, comparisons were conducted using a Pearson’s Chi-squared test with Yates’ continuity correction. Pearson correlation analysis was used to calculate the pairwise correlation coefficients among all clinicopathological variables in the whole cohort. Pearson correlation analysis and univariate linear regression were used to explore the correlation between the original score and the predicted score generated by the three machine learning models. P-values < 0.05 were considered statistically significant. An independent sample t-test was used for statistical analysis of the biochemical indices and the viral load in each time group, for which 0.05 was the significance level.
Results
Population Characteristics
The population of patients was divided into two groups based on baseline CD4 concentrations (CD4 cell count < 200 cells/μl or ≥ 200 cells/μl). There were no differences in sex, age, or route of HIV transmission between the two groups. However, there was a significant difference in marital status between the two groups. The data indicated that the majority of patients with a CD4 cell count < 200 cells/μl were married, while a higher proportion of unmarried, divorced, and widowed patients were observed in the CD4 cell count ≥200 cells/μl (Table 1).
Comparison of Clinical Indicators and Viral Load in Each Group
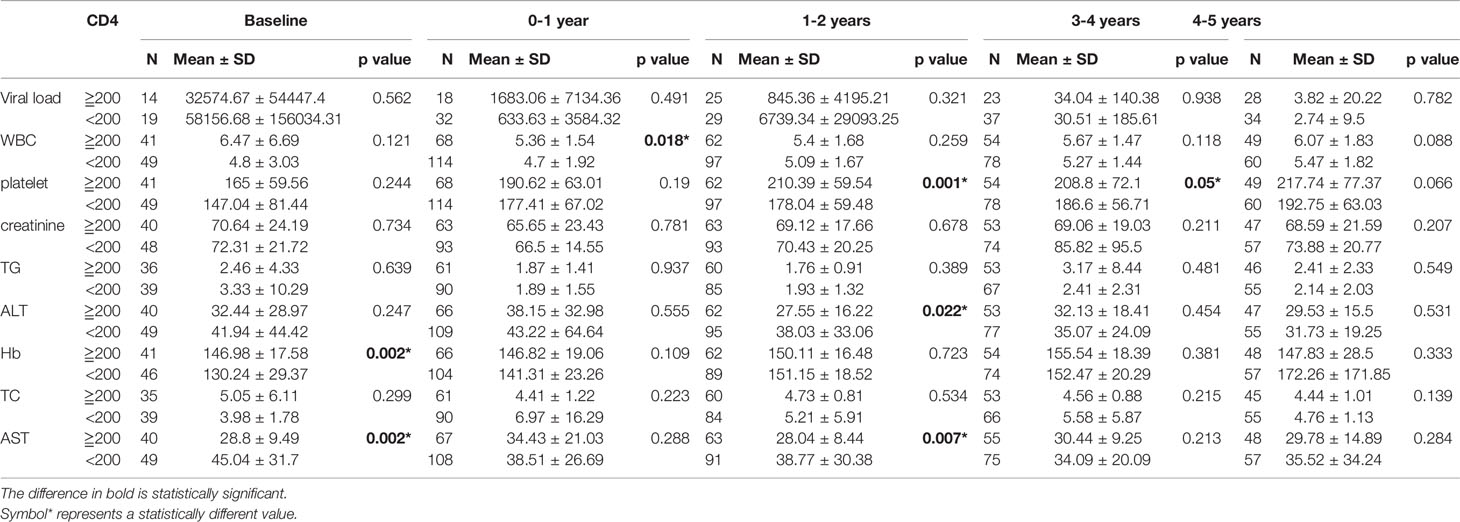
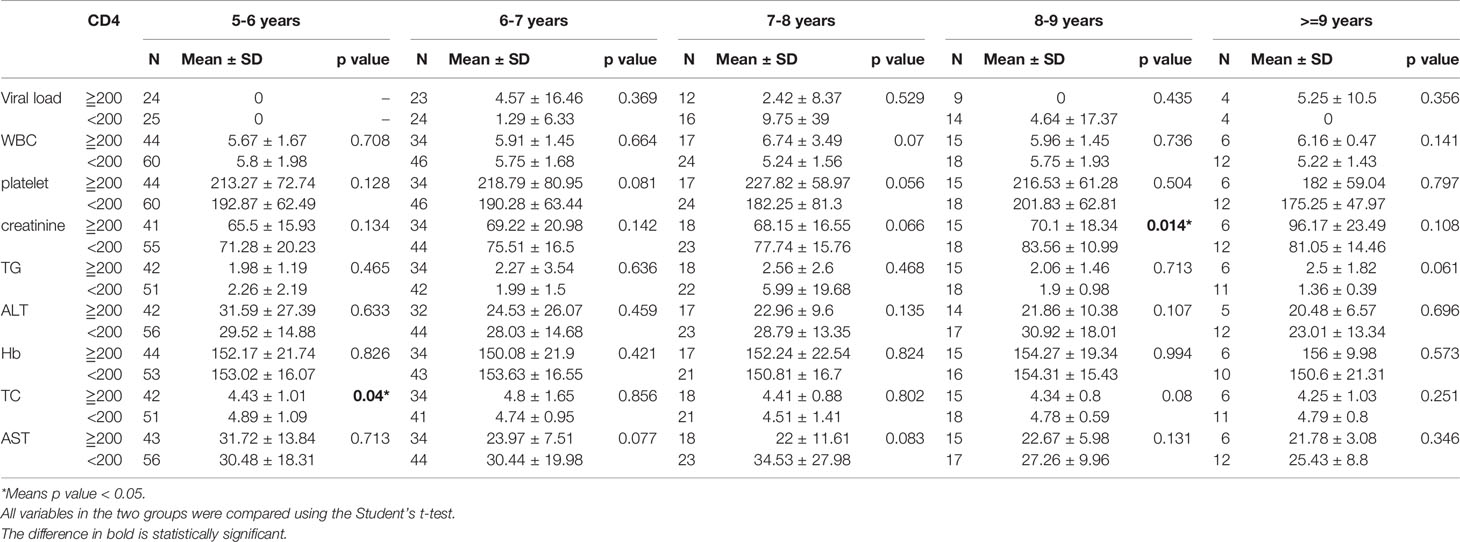
As described above, all patients were categorized into a baseline CD4 cell concentration greater than or equal to 200, or less than 200 μl/ml. Depending on the follow-up period (from 0 to 9.8 years), the data were divided into 10 follow-up period groups (including the baseline group). All test indicators were compared between the two CD4 cell count groups at intervals of one year. It was found that there were significant differences in WBCs (P = 0.018), platelets (P = 0.001), ALT (P = 0.022), AST (P = 0.002), and hemoglobin (P = 0.002) between the two groups for follow-up periods of up to 4 years. There were significant differences in hemoglobin (P = 0.002) and AST (P = 0.002) between the two groups in the first year after diagnosis. For the follow-up period of 5 years, there was a significant difference in TC (P = 0.04) between the two groups, and a significant difference in creatinine (P = 0.014) for the 8 year follow-up (Tables 2A, 2B).
Correlation of Clinical Indices
The results indicate that the ALT and AST levels demonstrated a strong positive correlation (r = 0.587) and the CD4 level was also strongly positively correlated with the CD4/CD8 ratio (r = 0.541), whereas the CD8 level was strongly negatively correlated with the CD4/CD8 ratio (r = -0.543, Figure 1). However, the CD4 level was only weakly positively correlated with the CD8 level (r = 0.166). Furthermore, CD4 was positively correlated with WBCs (r = 0.261) and platelets (r = 0.347) while CD8 was positively correlated with WBCs (r = 0.317). Platelets were negatively correlated with ALT (r = -0.229) and AST (r = -0.251), and positively correlated with WBCs (r = 0.280).
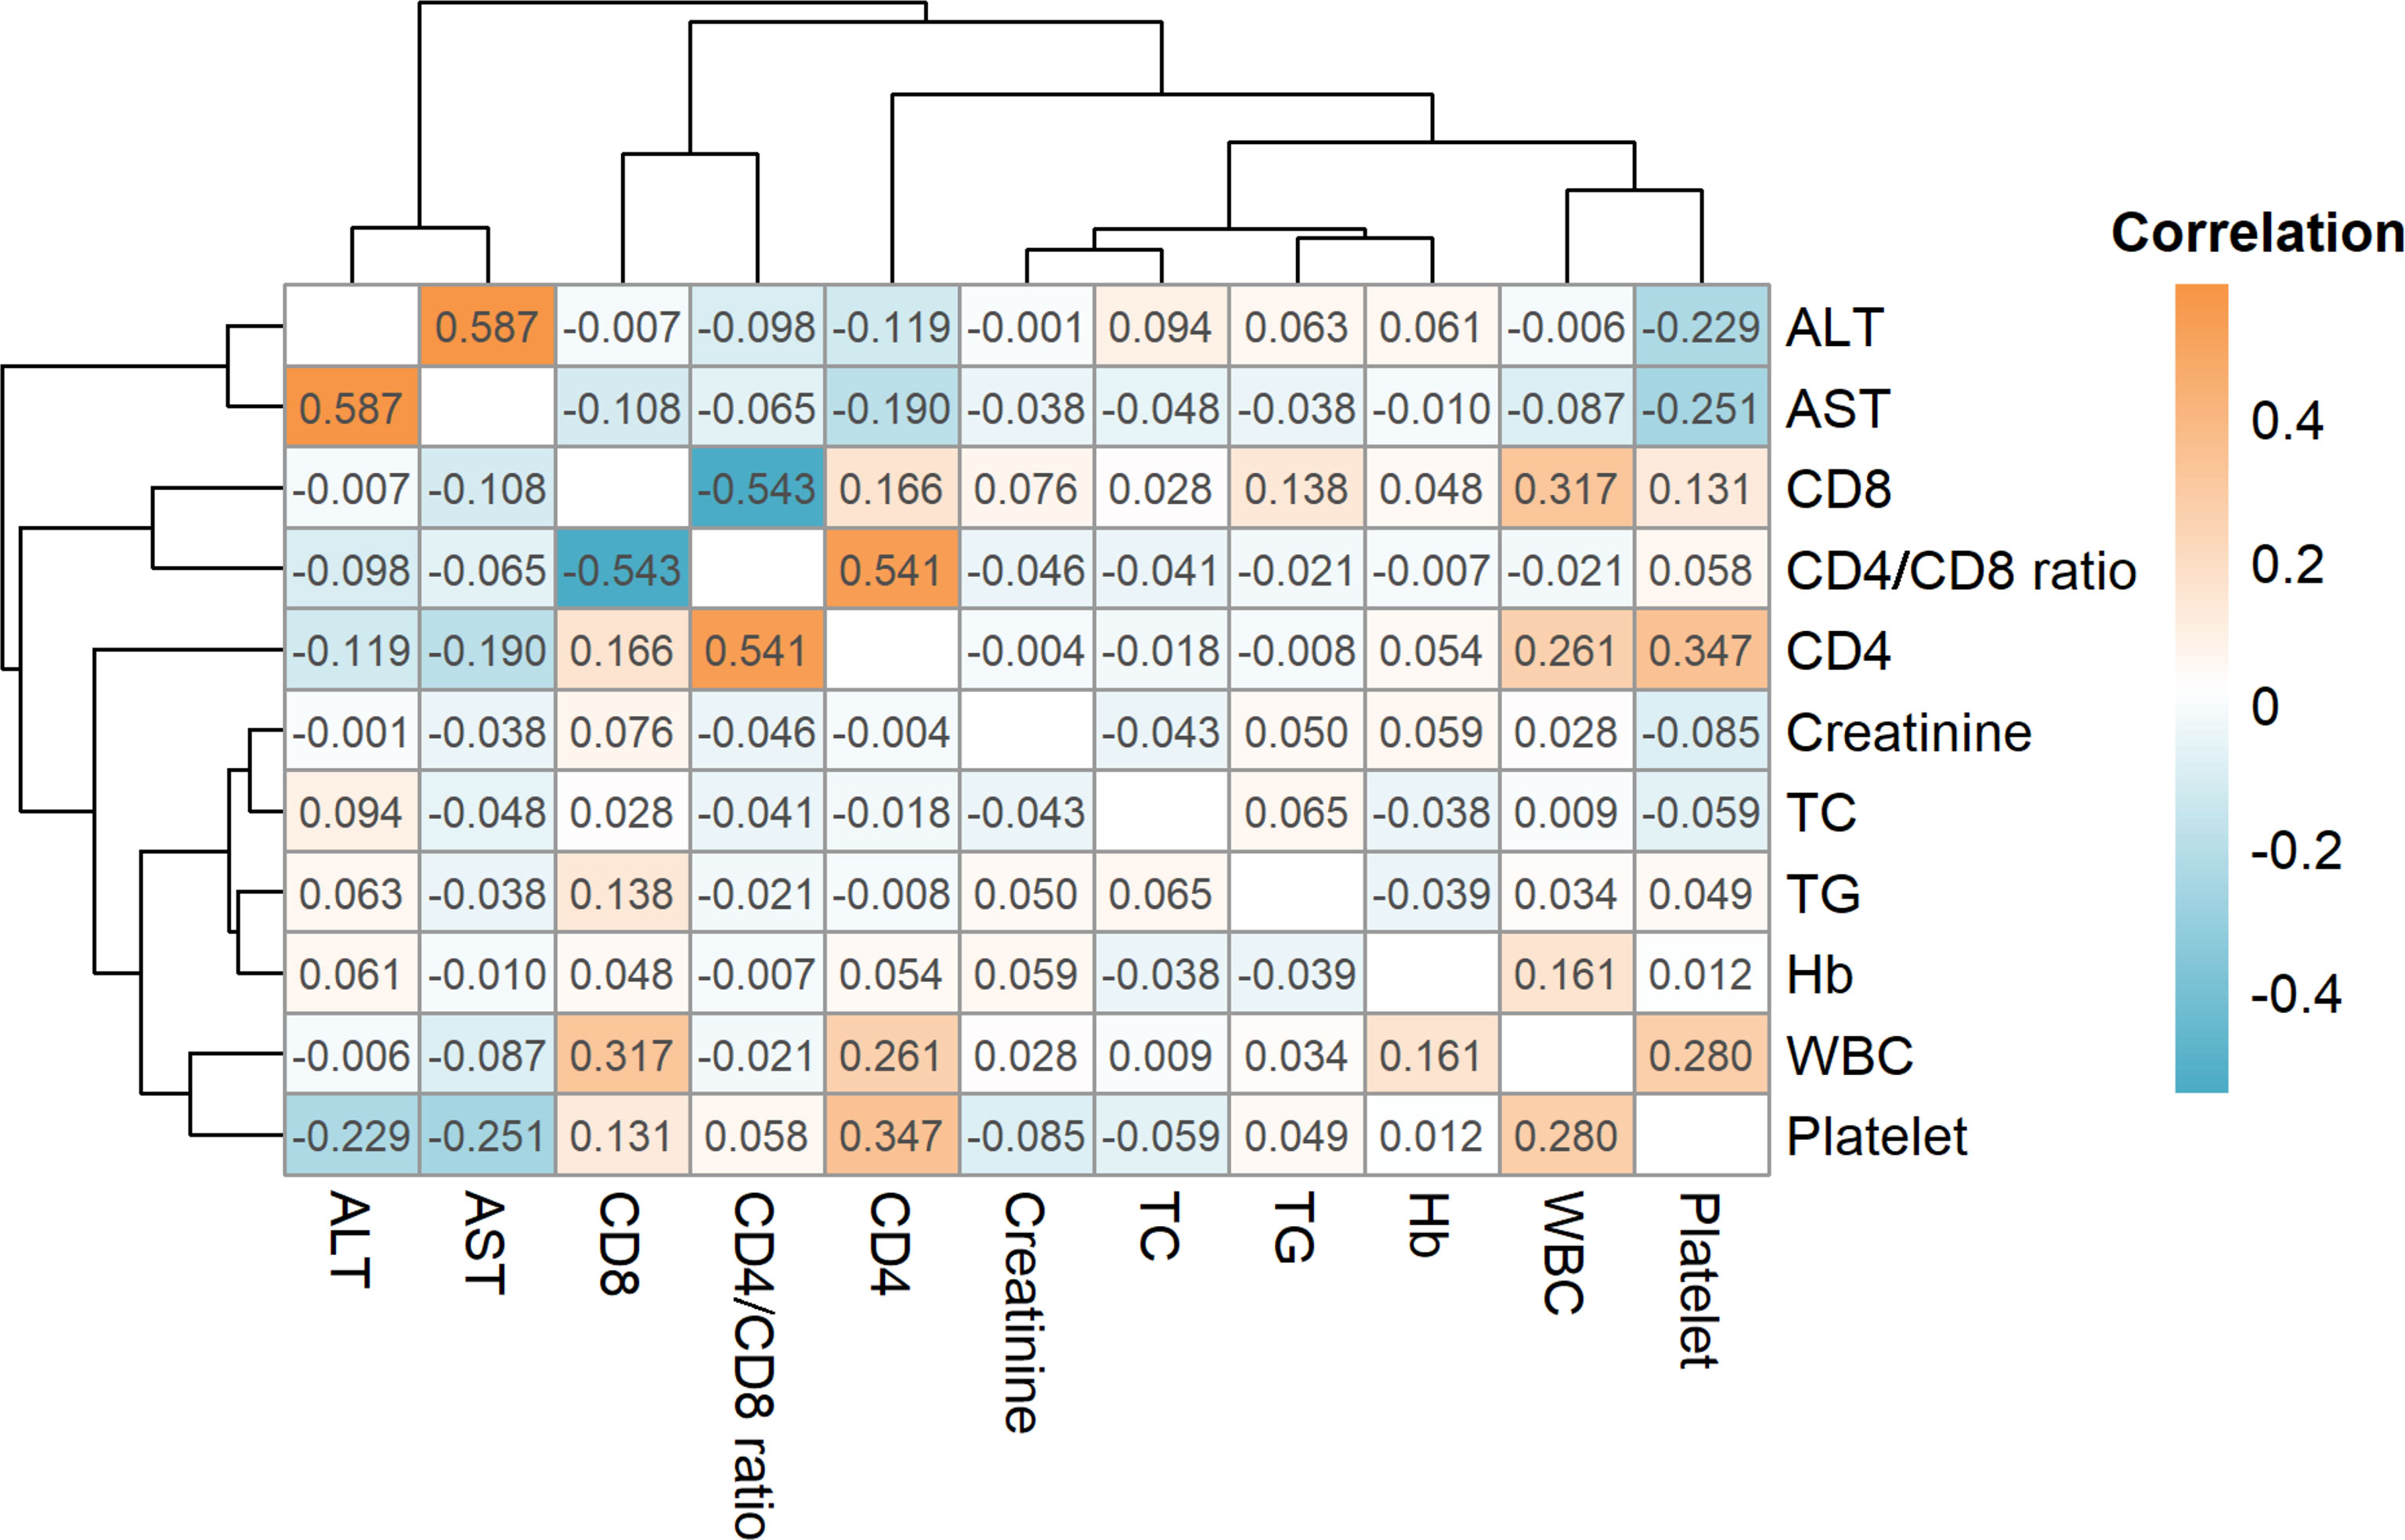
Figure 1 Correlations for all clinicopathological variables. The orange color indicates a positive correlation while cyan indicates a negative correlation. ALT, alanine aminotransferase; AST, aspartate aminotransferase; CD4, CD4+; T cell, CD8: CD8+ T cell; TC, total cholesterol; TG, total cholesterol; Hb, total cholesterol; WBC, white blood cell.
Predictive Performance of the Three Machine Learning Models
In patients with a CD4 cell count of < 200 cells/μl, there were significant correlations between the predicted results of the SVM model and the patient data for CD4 (r = 0.390, P = 0.045), CD4/CD8 ratio (r = 0.721, P < 0.001), platelets (r = 0.435, P = 0.022), TG (r = 0.614, P = 0.005), and AST (r = 0.569, P = 0.012). Additionally, the predicted results of the RF model were significantly correlated with the patient data for CD8 (r = 0.368, P = 0.028), CD4/CD8 ratio (r = 0.662, P = 0.002), platelets (r = 0.563, P = 0.013), and TG (r = 0.536, P = 0.008). Finally, the predicted results of the MLP model were significantly correlated with the patient data for CD8 (r = 0.412, P = 0.008), CD4/CD8 ratio (r = 0.554, P = 0.015), and platelets (r = 0.451, P = 0.016). For the CD4 cell count ≥ 200 cells/μl group, a significant correlation was observed for data predicted by the SVM model and the patient data for CD4 (r = 0.365, P = 0.036), CD4/CD8 ratio (r = 0.807, P < 0.001), WBCs (r = 0.577, P = 0.005), TC (r = 0.482, P = 0.011), and ALT (r = 0.362, P = 0.035). The results predicted by the RF model were significantly correlated with the patient data for CD4 (r = 0.513, P = 0.002), CD8 (r = 0.634, P = 0.003), CD4/CD8 ratio (r = 0.898, P < 0.001), WBCs (r = 0.452, P = 0.008), and platelets (r = 0.484, P = 0.004), while there were significant correlations for the MLP model for CD4 (r = 0.356, P = 0.028), CD8 (r = 0.315, P = 0.032), and CD4/CD8 ratio (r = 0.837, P < 0.001). The results above demonstrate that the three machine learning models exhibited a superior predictive performance in patients with a CD4 cell count ≥ 200 cells/μl than in those with a CD4 cell count < 200 cells/μl (Table 3).
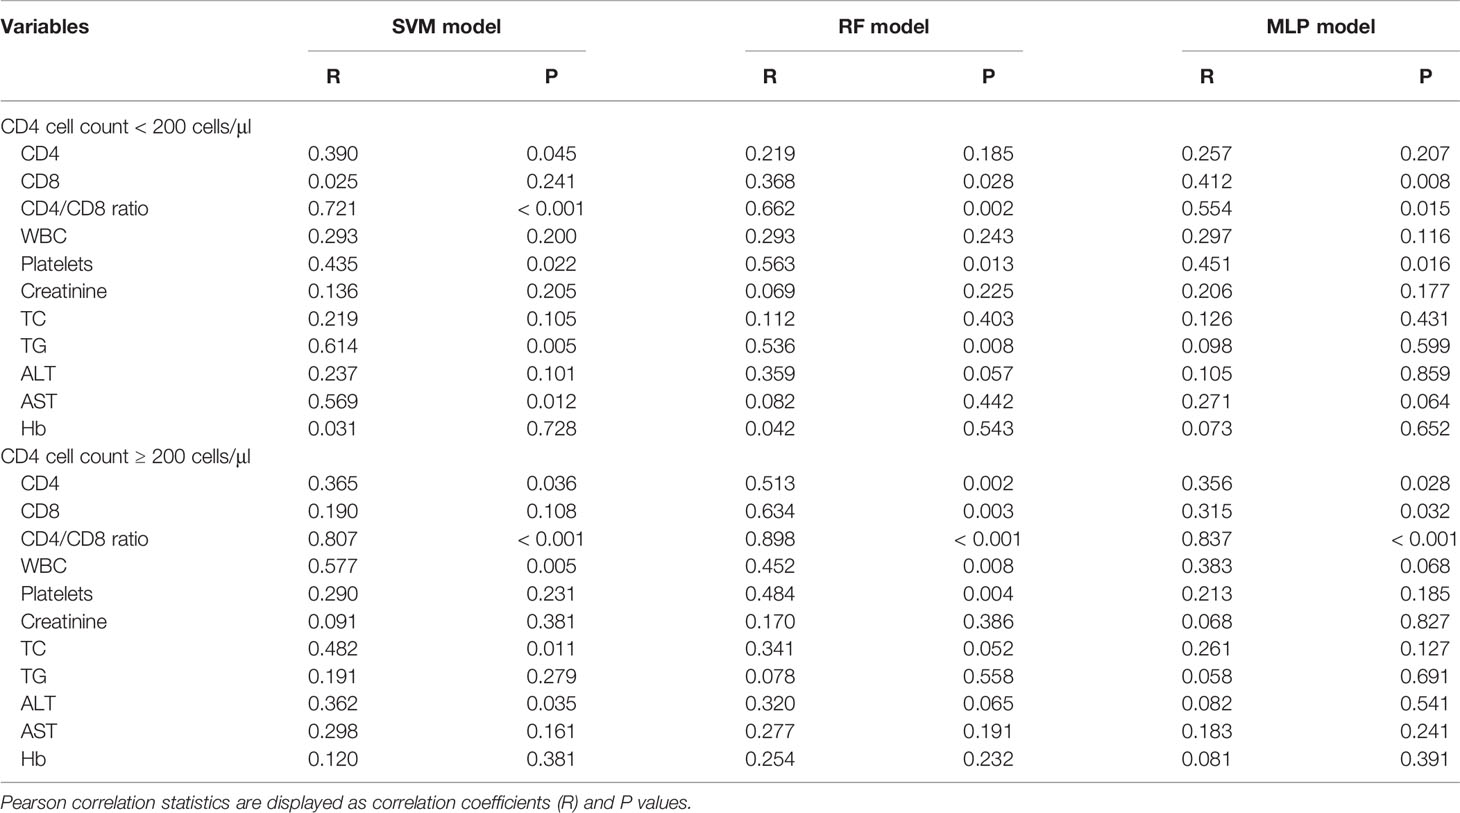
Table 3 Predictive performance of the three machine learning models for clinicopathological variables.
Predictions of the CD4/CD8 Ratio
Based on the results above, we found that the best predictive performance for CD4/CD8 ratio was achieved by the machine learning model. All three models demonstrated highly consistent predictions (Figure 2). In patients with a CD4 cell count of < 200 cells/μl, the SVM model displayed the best predictive performance (r2 = 0.519), followed by the RF model (r2 = 0.438), with the MLP model (r2 = 0.307) found to be worst. In patients with a CD4 cell count of ≥ 200 cells/μl, the RF model exhibited the best predictive performance (r2 = 0.806), followed by the MLP model (R2 = 0.700), with the SVM model found to be worst (r2 = 0.651). The results indicate that it may be appropriate to utilize the SVM model to predict the CD4/CD8 ratio for patients with a CD4 cell count < 200 cells/μl, and the RF model for those with a CD4 cell count of ≥ 200 cells/μl (Figure 3).
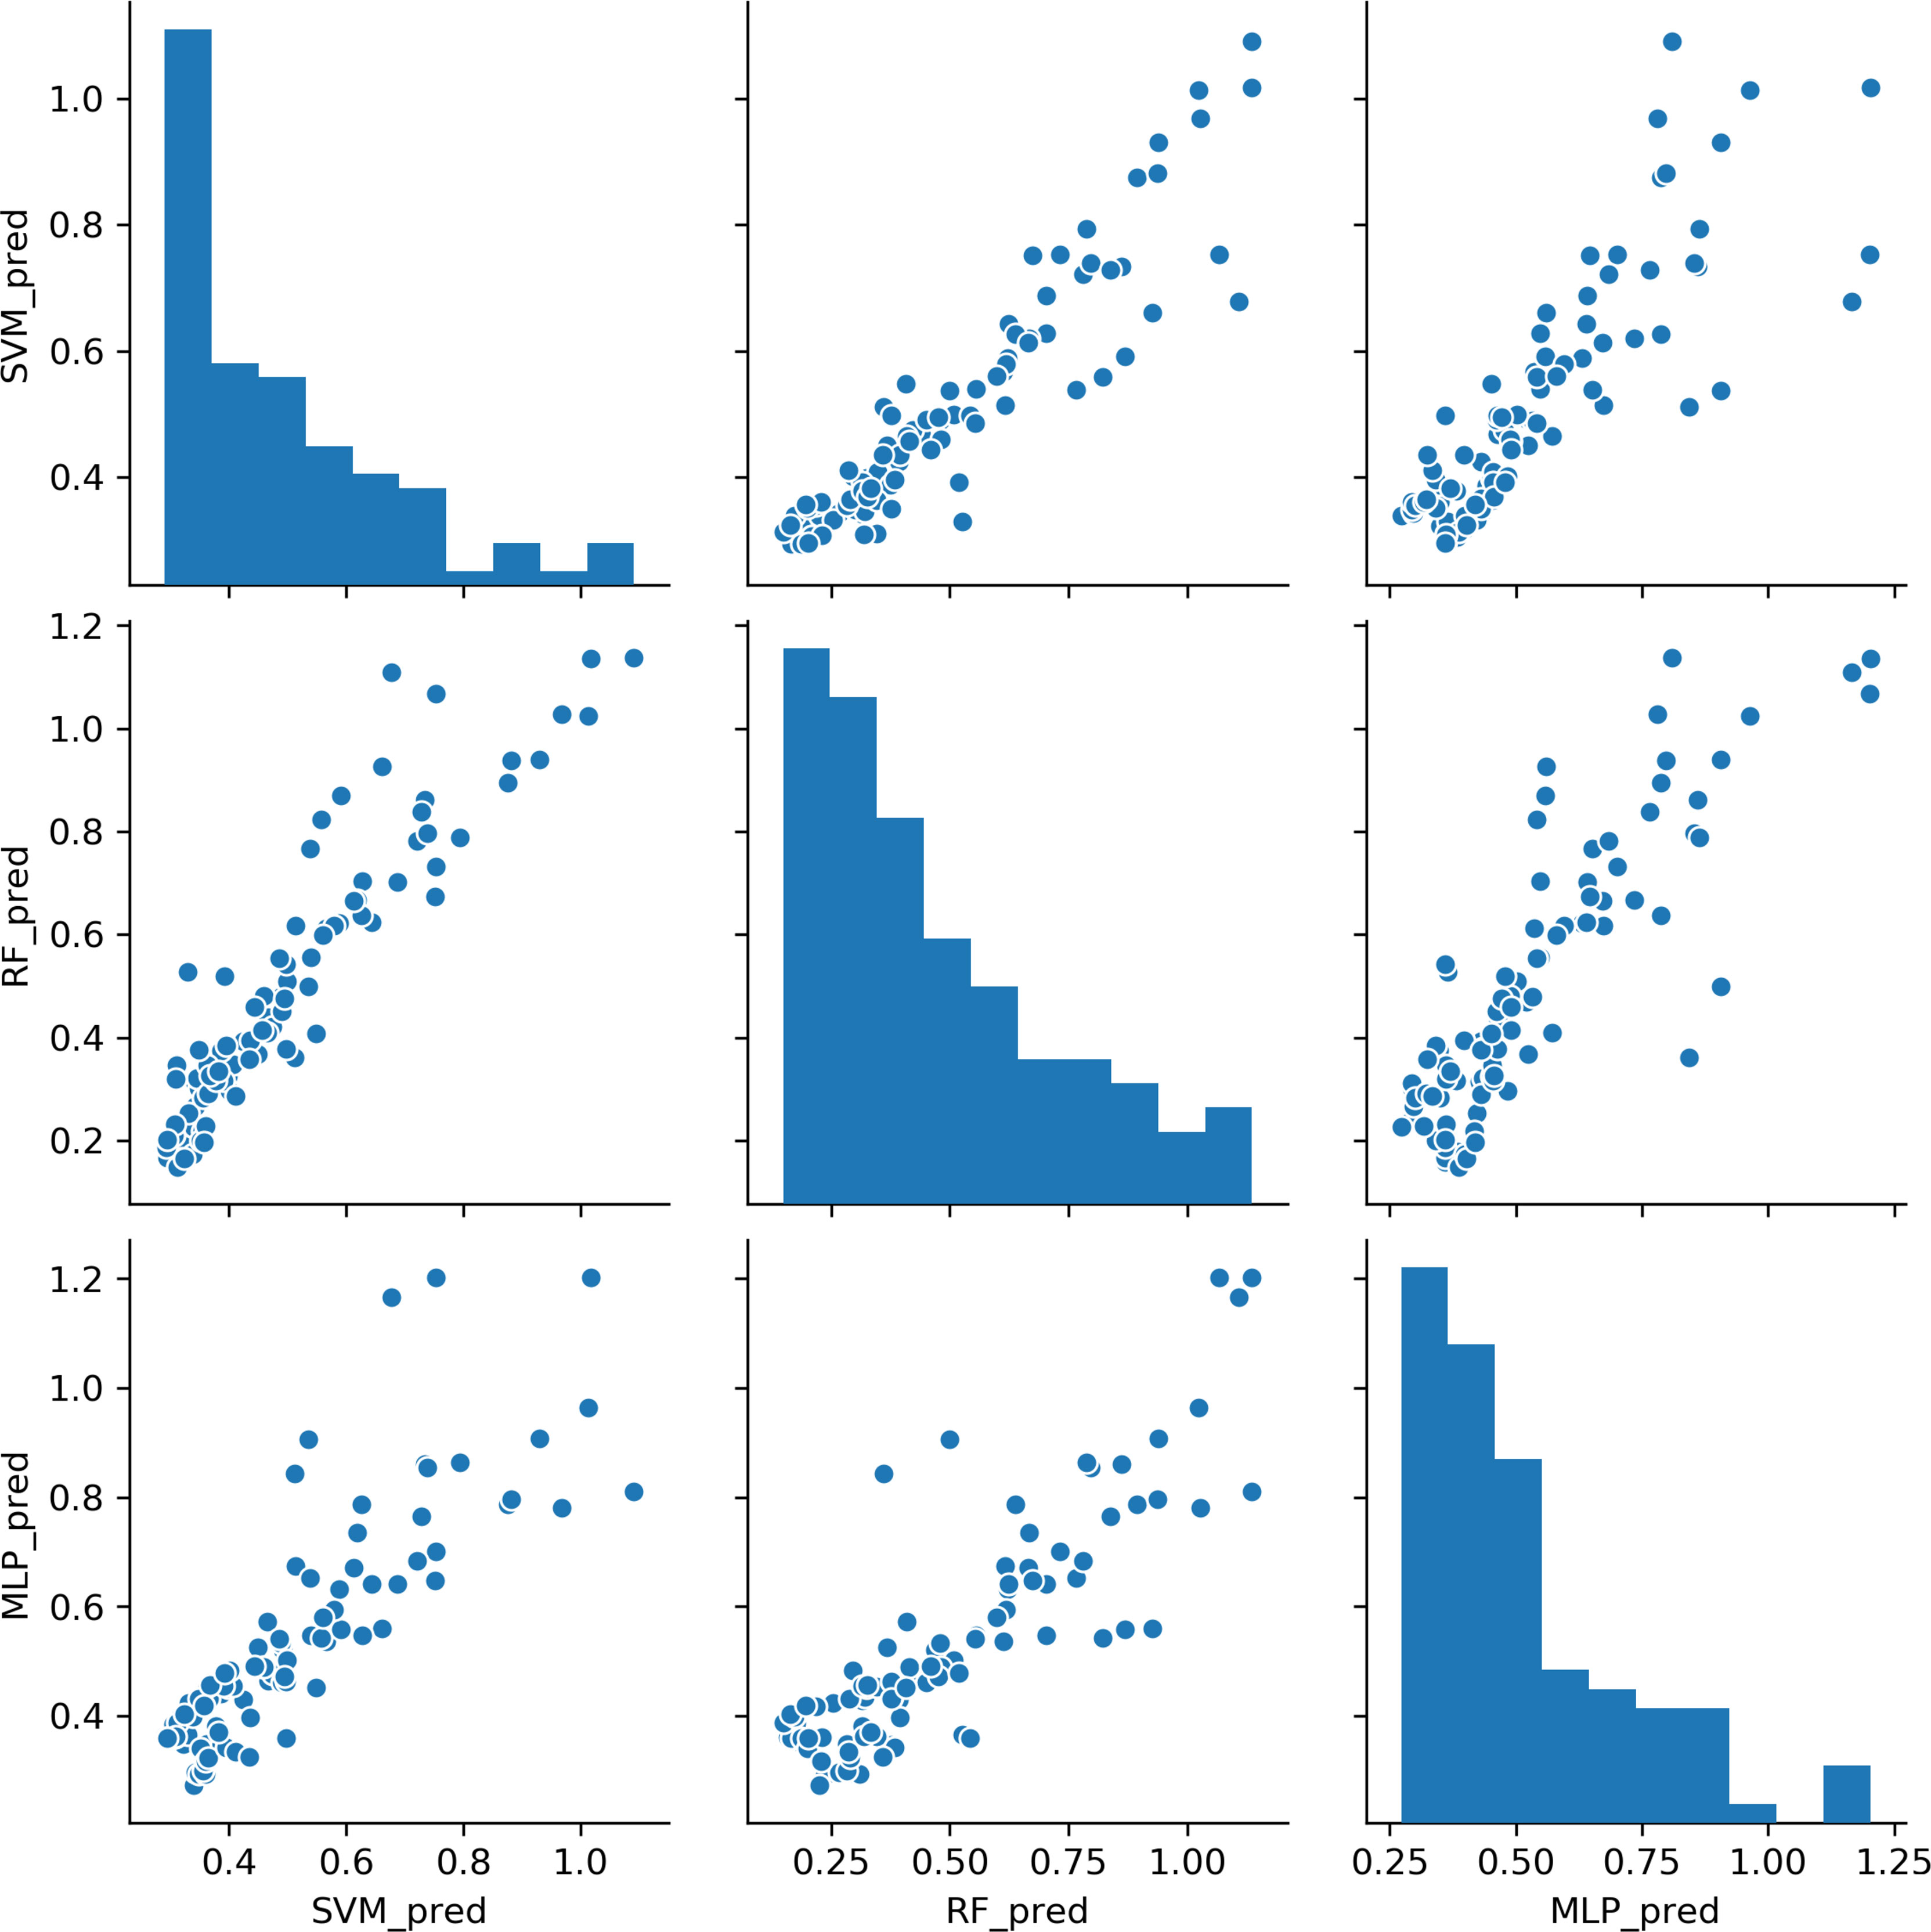
Figure 2 Comparisons of CD4/CD8 ratio predictions for the three machine learning models. Each point represents a sample. SVM, support vector machine; RF, random forest; MLP, multi-layer perceptron.
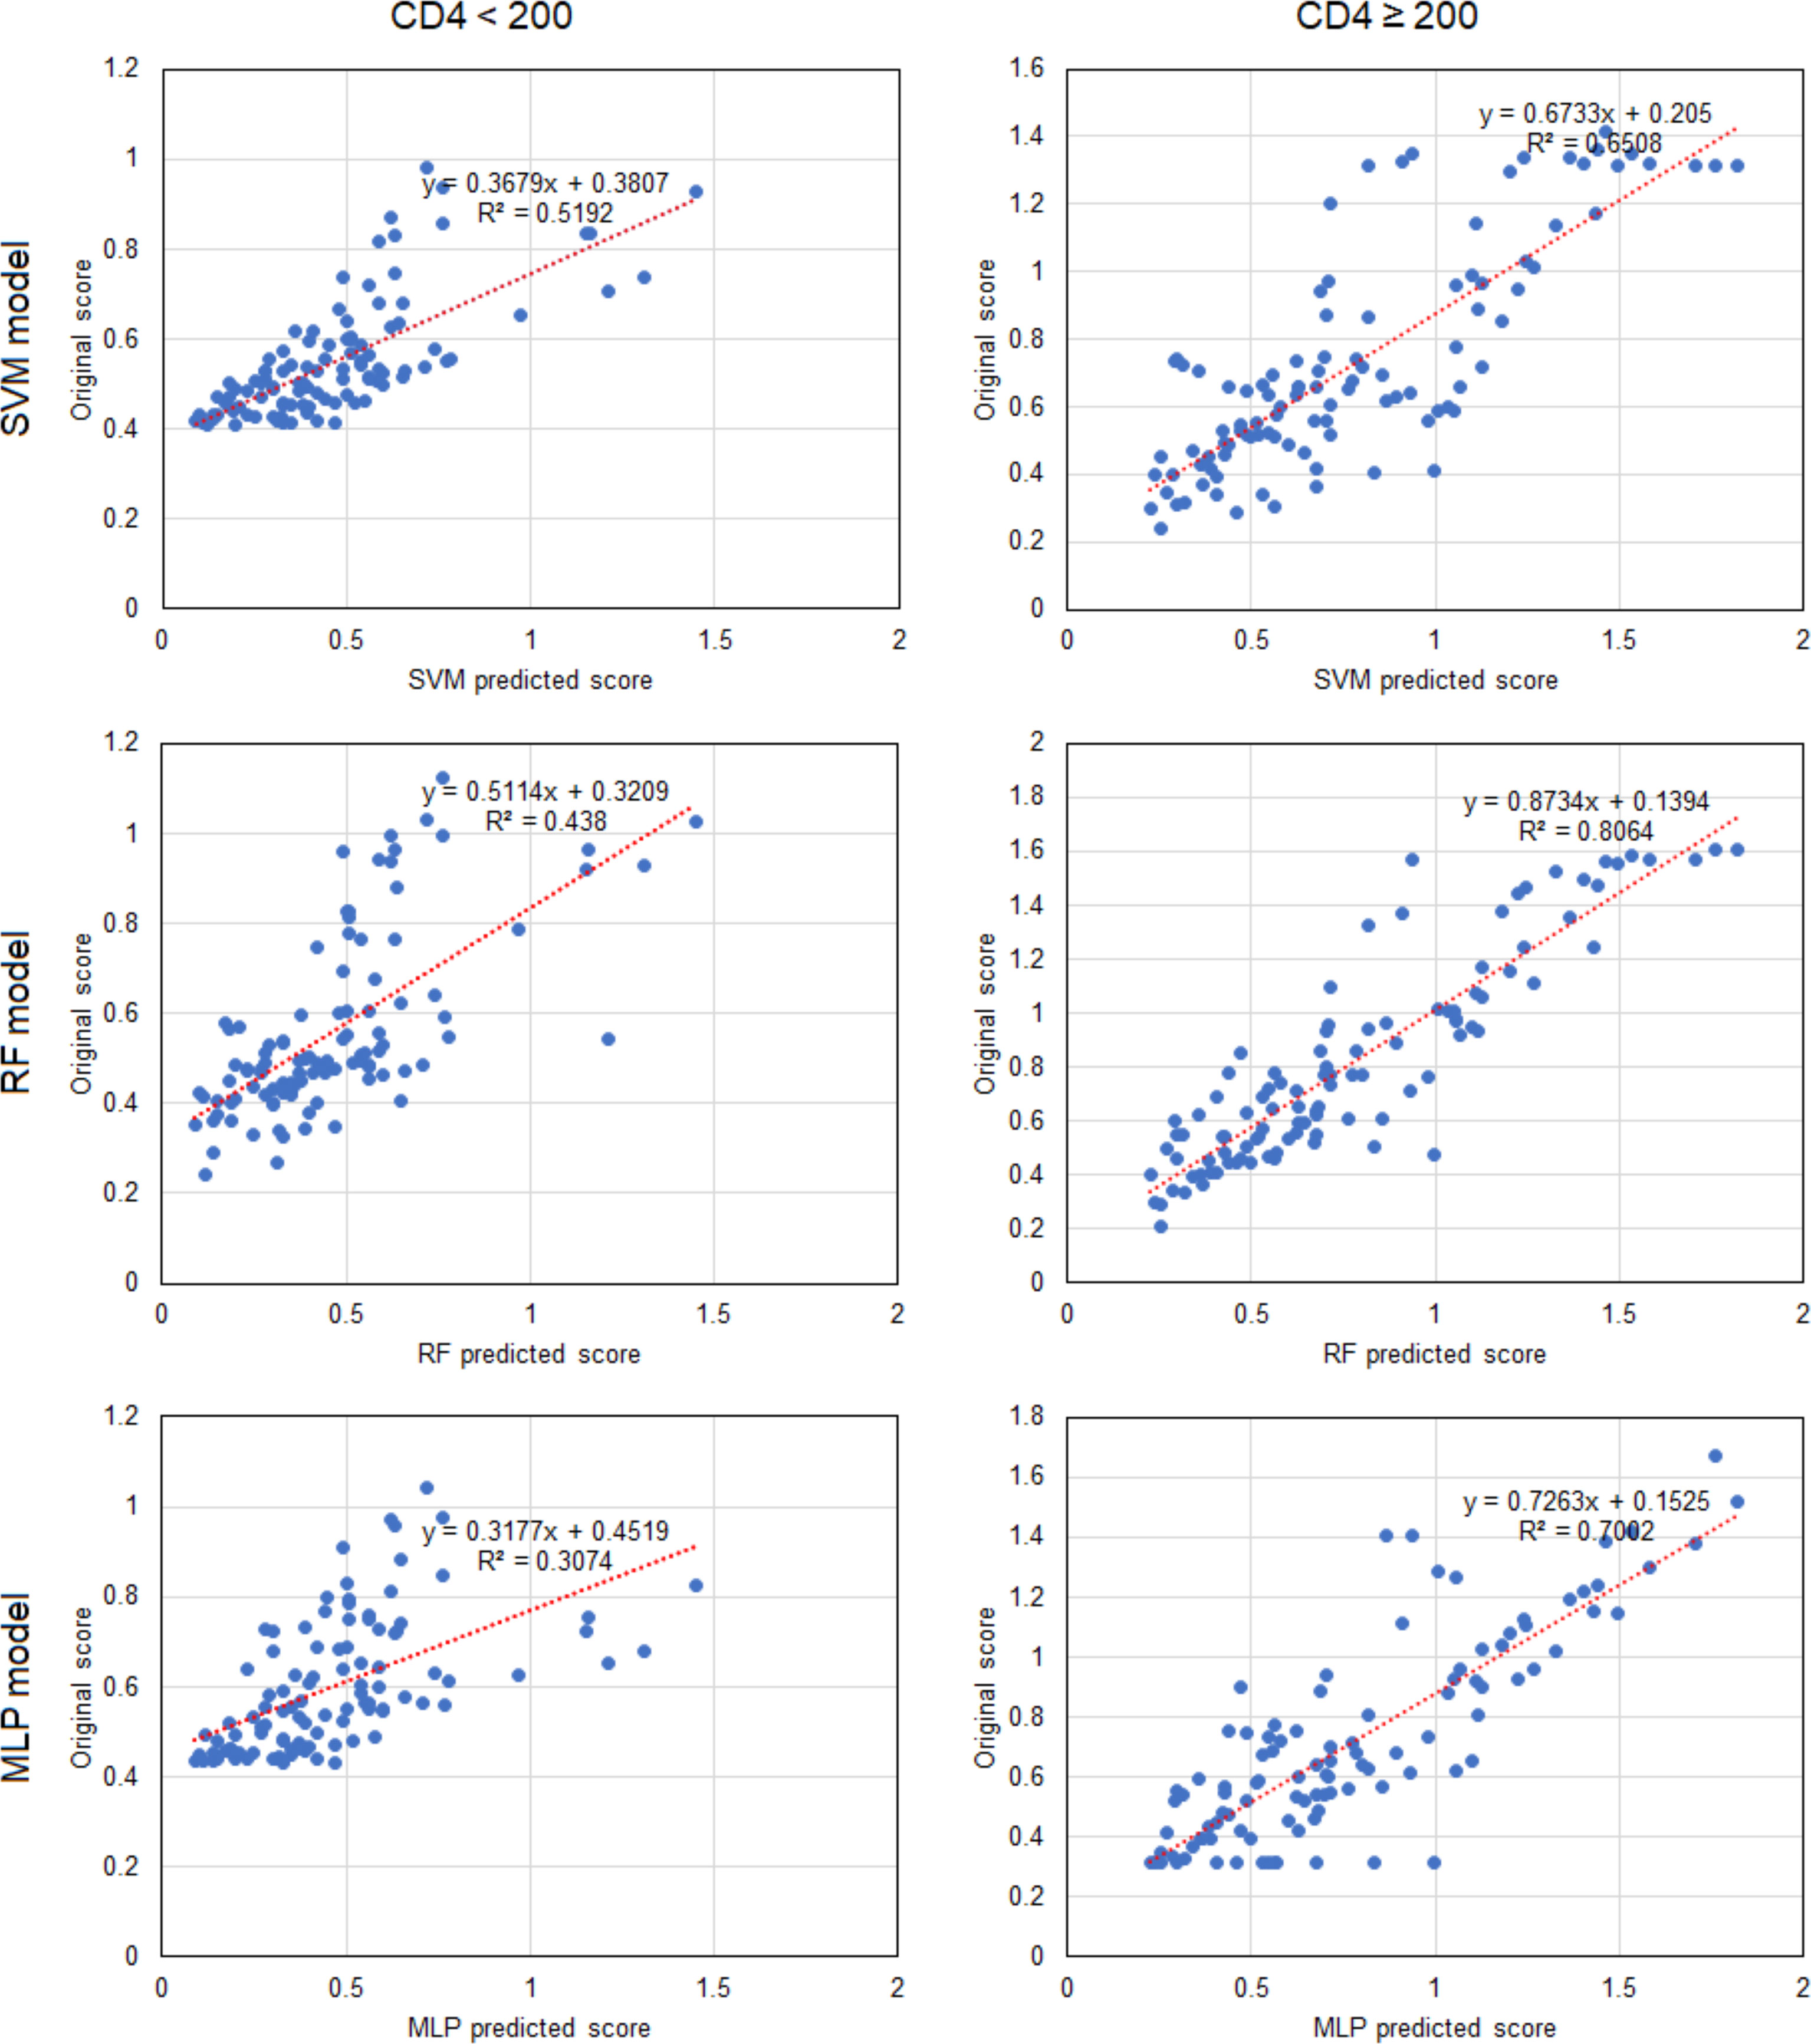
Figure 3 Linear correlations of predicted scores and patient data for CD4/CD8 ratio in the three machine learning models. Each point represents a sample. CD4, CD4+ T cell; SVM, support vector machine; RF, random forest; MLP, multi-layer perceptron.
Discussion
The number and function of lymphocytes are directly related to immune system function. The CD4 cell count is among the most critical indicators of immune function, lower counts indicating weaker immune system function (Frontiers in Cellular and Infection Microbiology, 2018). However, not all T-cell subsets become attenuated. CD4+ T cells are helper lymphocytes that secrete cytokines that activate other immune cells. CD8+ T lymphocytes, also known as cytotoxic T cells, directly destroy virus-infected and tumor cells. Following HIV infection, the synthesis of CD4+ T cells is reduced and their destruction increases causing their number to progressively decrease, although the number of CD8+ T cells increases significantly and they become functionally activated (Masiá et al., 2016). Therefore, while observing the destruction of immune function in patients following HIV infection, or its reconstruction, in addition to an intuitive index of plasma viral load, attention should also be paid to the number of CD4+ T cells, the absolute number of CD8+ T cells, the CD4/CD8 ratio, and other immune activation parameters (Cohen Stuart et al., 2000). The CD4/CD8 ratio is often described as a marker of immune status in the general population and is of interest in studies of HIV-infected individuals. There is increasing evidence that it can be used to identify HIV-infected individuals with persistent immune dysfunction who, despite having a normal CD4 count during treatment, have a higher risk of non-AIDS events and death. It has been confirmed that early administration of ART is related to a rapid increase in CD4+ count and the CD4/CD8 ratio (Rajasuriar et al., 2015), a direct indicator of immune function reconstruction. A decrease in the CD4/CD8 ratio is generally associated with an increase in morbidity and mortality in HIV-unrelated diseases (Mussini et al., 2015).
In the present study, correlation analysis of the clinical information of patients with CD4+ T cell number demonstrated that there was no statistical difference in gender, age, or route transmission of HIV (heterosexual transmission, intravenous drug use, or unknown) with baseline CD4 cell count while marital status was statistically correlated. A large number of HIV/AIDS patients in the married group had a CD4 cell count < 200 cells/μl, while the majority that were unmarried, divorced, or widowed had ≥ 200 cells/μl. A possible reason may be due to cultural factors and a sense of fear towards divulging their HIV/AIDS status, instead intentionally concealing it to prevent the other party knowing their infection status. Even when symptoms appear, a delay in seeking medical treatment would delay the diagnosis until the onset of impaired immune function.
Correlation analysis of the clinical characteristics demonstrated that ALT levels were positively correlated with AST levels (R = 0.587), while CD4 levels were positively correlated with the CD4/CD8 ratio (R = 0.541). In addition, CD4 was positively correlated with platelet count (R = 0.347). Platelet count was negatively correlated with ALT (r = -0.229) and AST (R = -0.251), and positively correlated with WBCs (r = 0.280). A number of previous studies (Chen et al., 2007; Gupta et al., 2007) have stated that the combination of total lymphocyte count, hemoglobin, and platelet count improves the accuracy of CD4 count prediction. In addition, clinical practice suggests that the number of CD4+ T lymphocytes may also be related to red blood cell and white blood cell count, similar to observations in the present study.
Since the HIV/AIDS patients were treated with ART following diagnosis, they experienced reconstruction of the immune system and gradual recovery of immune function over 3-4 years of follow-up. The duration of the reconstruction period was dependent on patient characteristics. Therefore, indicators of disease in the patients during the reconstruction period were not stable. Fluctuation caused clear differences between the two groups. However, after 4 years of follow-up, all aspects of the monitored indicators tended to stabilize in the patients who had achieved immune reestablishment, removing any significant difference between the two groups. Differences in total cholesterol and creatinine between the two groups in the late follow-up period may have been caused by side effects or complications of the drugs or damage to organ function caused by the antiviral drugs.
In the present study, the three machine learning models, namely SVM, RF and MLP, were constructed by simultaneously incorporating the clinical indicators of HIV/AIDS patients, such as routine blood tests, lymphoid subgroup count, viral load, liver and renal function, and blood lipids. Baseline values and follow-up monitoring indicators were used to analyze and predict the possible test results of these indicators during treatment and follow-up testing. In both groups of baseline CD4 cell counts, the CD4/CD8 ratio predicted by the three models was significantly correlated with the patient data. In patients with a CD4 cell count of < 200 cells/μl, only the predicted platelet count for the three models was correlated with the patient data. In conclusion, the predictive capability of the three machine learning models was superior in patients with a CD4 cell count of ≥200 cells/μl rather than < 200 cells/μl.
SVM is considered among the most accurate methods of all the well-known data mining algorithms. It is a novel small-sample learning method with a solid theoretical foundation. RF can process high dimensional data, the training speed is fast, and it easily obtains the extent of the importance of different features. MLP, as a neural network machine learning method, can achieve better predictive performance following a training and learning process. In general, machine learning models have different predictive performance regarding CD4 counts, as observed for the different machine learning models in the present study, with the CD4/CD8 ratio providing the best performance, for which all three models were highly consistent. Specifically in patients with a CD4 cell count of ≥200 cells/μl, the RF model demonstrated the best predictive performance (r2 = 0.806), including for predicting the CD4/CD8 ratio, whereas the SVM model should be used to predict the CD4/CD8 ratio in patients with a CD4 cell count of < 200 cells/μl. Of course, the RF model would theoretically demonstrate superior predictive performance if the sample size for machine learning was larger.
After treatment with ART, the slow increase in CD4+ cell count is likely to lead to immune reconstitution. The high baseline CD4/CD8 ratio was associated with successful immune reconstitution, in accordance with previous studies that have demonstrated the critical role of CD4/CD8 ratio normalization (Serrano-Villar et al., 2013; Mussini et al., 2015). Therefore, the number of CD4 cells and the CD4/CD8 ratio after treatment in HIV/AIDS patients are key factors for successful treatment.
The present study was influenced by cases of loss and, consequently, the sample size for long-term follow-up was relatively small. The predictive role of baseline CD4+ cell count and the CD4/CD8 ratio in immune reconstitution has become clearer as the sample size has continuously increased. The additional detection of CD4+ T cell subsets in enrolled cases in the future will yield more effective evidence, as there is increasing evidence that different subtypes of CD4+ cells influence immune reconstitution (Funderburg et al., 2013; Lu et al., 2016) and that a baseline percentage of naive CD4+ T cells is a good prognostic factor for immune reconstitution during long-term treatment (Guo et al., 2016). Furthermore, it is possible to optimize prediction through the integration of models. Therefore, we will further analyze the relationship between changes in the monitoring indicators included here and changes in CD4 count, thereby allowing prediction of changes in CD4 count through the use of data mining methods. These will be considered in additional research.
Conclusion
In the present study, three machine learning models, namely SVM, RF and MLP, were constructed by including clinical monitoring indicators such as routine blood examination, lymphocyte subset counts, viral load, liver and renal function, and blood lipid levels in HIV/AIDS patients at baseline and the follow-up period. Baseline and follow-up results were used to analyze and predict the outcome of these measures after treatment and follow-up testing. The results demonstrated that the predictive capability of the three models was better for the group with a CD4 cell count ≥200 cells/μl than for patients with < 200 cells/μl. For both groups, the three models yielded the best predictive performance for the CD4/CD8 ratio, for which the results were highly consistent. In patients with a CD4 cell count of < 200 cells/μl, the SVM model exhibited the best performance for predicting the CD4/CD8 ratio, while in patients with a CD4 cell count of ≥200 cells/μl, the RF model was best.
Data Availability Statement
The original contributions presented in the study are included in the article/supplementary material. Further inquiries can be directed to the corresponding authors.
Ethics Statement
The research protocol used in the present study has been reviewed by the Ethics Committee of the First Affiliated Hospital of Kunming Medical University. Informed consent was obtained from all participants included in the study prior to enrollment, and all information and data were confirmed for analysis.
Author Contributions
BL, MS, Y-QK, YL, and DL conceived and designed the study. BL, ML, Y-QK, XW, and RZ collected the reagents and study materials. BL, ML, YS, XL, XW, and RZ performed the laboratory experiments. BL, RZ, MS, YL, and DL analyzed the data. BL, ML, MS, YL, and DL wrote and revised the manuscript. All authors approved the final manuscript.
Funding
The study was supported by the Special Funds for Yunnan Province Medical academic leader (D-2018025), a Scientific Research Fund project of Yunnan Education Department (2020J0171), High-level Healthy Talents of Yunnan Province (D-2019022), Natural Science Foundation of Yunnan Province (202101AU070124), and open projects of Yunnan Key Laboratory of Laboratory Medicine (JYZDSYS202004 & JYZDSYS202101).
Conflict of Interest
The authors declare that the research was conducted in the absence of any commercial or financial relationships that could be construed as a potential conflict of interest.
Publisher’s Note
All claims expressed in this article are solely those of the authors and do not necessarily represent those of their affiliated organizations, or those of the publisher, the editors and the reviewers. Any product that may be evaluated in this article, or claim that may be made by its manufacturer, is not guaranteed or endorsed by the publisher.
Abbreviations
SVM, Support vector machine; RF, Random forest; MLP, Multi-layer perceptron.
References
Abbass, A. K., Lichtman, A. H. (2008). “Congenital and Acquired Immuno Deficiency”, in Basic Immunology. Data Status, 209–223.
(2018). HIV Monitoring. Available at: https://www.hiv-monitoring.nl/english/patients-and%20public/about-hiv/ (Accessed on October 12).
Blanchet, L., Vitale, R., van Vorstenbosch, R., Stavropoulos, G., Pender, J., Jonkers, D., et al. (2020). Constructing Bi-Plots for Random Forest: Tutorial. Anal. Chim. Acta 1131, 146–155. doi: 10.1016/j.aca.2020.06.043
Carpenter, C. C., Cooper, D. A., Fischl, M. A., Gatell, J. M, Gazzard, B. G, Hammer, S. M, et al. (2000). Antiretroviral Therapy in Adults: Updated Recommendations of the International AIDS Society-USA Panel[J]. JAMA 283 (3), 381–390. doi: 10.1001/jama.2020.17025.
Chen, M., Jia, M. H., Ma, Y. L., Luo, H. B., Chen, H. C., Yang, C. J., et al. (2018). The Changing HIV-1 Genetic Characteristics and Transmitted Drug Resistance Among Recently Infected Population in Yunnan, China. Epidemiol. Infect. 146 (6), 775–781. doi: 10.1017/S0950268818000389
Chen, M., Ma, Y., Chen, H., Luo, H., Dai, J., Song, L., et al. (2015). Multiple Introduction and Naturally Occuring Drug Resistance of HCV Among HIV-Infected Intravenous Frug Users in Yunnan: An Origin of China’s HIV/HCV Epidemics. PloS One 10 (11), e0142543. doi: 10.1371/journal.pone.0142543
Chen, R. Y., Westfall, A. O., Hardin, J. M., Miller-Hardwick, C., Stringer, J. S., Raper, J. L., et al. (2007). Complete Blood Cell Count as a Surrogate CD4 Cell Marker for HIV Monitoring in Resource-Limited Settings[J]. JAIDS 44 (5), 525–530. doi: 10.1097/QAI.0b013e318032385e
Chow, E. P., Gao, L., Koo, F. K., Chen, L., Fu, X., Jing, J., et al. (2013). Qualitative Exploration of HIV-Related Sexual Behaviours and Multiple Partnerships Among Chinese Men Who Have Sex With Men Living in a Rural Area of Yunnan Province, China. Sex. Health 10 (6), 533–540. doi: 10.1071/SH13097
Cohen Stuart, J. W., Hazebergh, M. D., Hamann, D., Otto, S. A, Borleffs, J. C, Miedema, F., et al. (2000). The Dominant Source of CD4+ and CD8+ T-Cell Activation in HIV Infection is Antigenic Stimulation. J. Acquir. Immune Defic. Syndr. 25, 203–211. doi: 10.1097/00126334-200011010-00001
Duan, S., Guo, H. Y., Pang, L., Yuan, J. H., Jia, M. H., Xiang, L. F., et al. (2008). Analysis of the Epidemiologic Patterns of HIV Transmission in Dehong Prefecture, Yunnan Province. Zhonghua. Yu. Fang. Yi. Xue. Za. Zhi. 42 (12), 866–869.
Dybul, M., Fauci, A. S., Bartlett, J. G., Kaplan, J. E, Pau, A. K. (2002). Guidelines for the USA of Antiretroviral Agents in HIV-Infected Adults and Adolescents:the Panel on Clinical Practices for the Treatment of HIV Infection[J]. Ann. Intern. Med. 137 (5_Part_2), 381–433. doi: 10.7326/0003-4819-137-5_Part_2-200209031-00001
Eshun-Wilson, I., Taljaard, J. J., Nachega, J. B. (2012). Sub-Optimal CD4 T-Lymphocyte Responses Among HIV Infected Patients Who Develop TB During the First Year of ART. J. AIDS Clin. Res. 3 (135), 1000135. doi: 10.4172/2155-6113.1000135
Février, M., Dorgham, K., Rebollo, A. (2011). CD+4T Cell Depletion in Human Immunodeficiency Virus (HIV) Infection:Role of Apoptosis[J]. Viruses 3 (5), 586–612. doi: 10.3390/v3050586
Funderburg, N. T., Andrade, A., Chan, E. S., Rosenkranz, S. L., Lu, D., Clagett, B., et al. (2013). Dynamics of Immune Reconstitution and Activation Markers in HIV+ Treatment-Naive Patients Treated With Raltegravir, Tenofovir Disoproxil Fumarate and Emtricitabine. PloS One 8 (12), e83514. doi: 10.1371/journal.pone.0083514
Gazzard, B., Moyle, G. (1998). 1998revision to the British HIV Association Guidelines for Antiretroviral Treatment of HIV Seropositive Individuals[J]. Lancet 352 (9124), 314–316. doi: 10.1016/s0140-6736(98)04084-7
Guo, F. P., Li, Y. J., Qiu, Z. F., Lv, W., Han, Y., Xie, J., et al. (2016). Baseline Naive CD4+ T-Cell Level Predicting Immune Reconstitution in Treated HIV-Infected Late Presenters. Chin. Med. J. 129 (22), 2683–2690. doi: 10.4103/0366-6999.193460
Gupta, A., Gupte, N., Bhosale, R., Kakrani, A., Kulkarni, V., Nayak, U., et al. (2007). Low Sensitivity of Total Lymphocyte Count as a Surrogate Marker to Identify Antepartum and Postpartum Indian Women Who Require Antiretroviral Therapy[J]. JAID5 46, 338–342. doi: 10.1097/QAI.0b013e318157684b
Hou, B., Ma, W. (2009). Stability of a Dynamic System Model of HIV Virus With Beddington-Deangelis Type Functional Response Function [J]. Math. Pract. Cogn. 39 (12), 71–79.
Huang, S., Cai, N., Pacheco, P. P., Narrandes, S., Wang, Y., Xu, W. (2018). Applications of Support Vector Machine (SVM) Learning in Cancer Genomics. Cancer Genomics Proteomics 15 (1), 41–51. doi: 10.21873/cgp.20063.
Jia, Y., Sun, J., Fan, L., Song, D., Tian, S., Yang, Y., et al. (2008). Estimates of HIV Prevalence in a Highly Endemic Area of China: Dehong Prefecture, Yunnan Province. Int. J. Epidemiol. 37 (6), 1287–1296. doi: 10.1093/ije/dyn196
Jia, Z., Wang, L., Chen, R. Y., Li, D., Wang, L., Qin, Q., et al. (2011). Tracking the Evolution of HIV/AIDS in China From 1989–2009 to Inform Future Prevention and Control Efforts. PloS One 6 (10), e25671. doi: 10.1371/journal.pone.0025671
Li, L., Chen, L., Yang, S., Liu, Y., Li, H., Bao, Z., et al. (2010). Near Full-Length Genomic Characterization of a Novel HIV Type 1 Subtype B/C Recombinant Strain From Yunnan, China. AIDS Res. Hum. Retroviruses 26 (6), 711–716. doi: 10.1089/aid.2010.0001
Li, Y. Y., Jin, Y. M., He, L. P., Bai, J. S., Liu, J., Yu, M., et al. (2016). Clinical Analysis of HIV/AIDS Patients With Drug Eruption in Yunnan, China. Sci. Rep. 6, 35938. doi: 10.1038/srep35938
Li, J., Li, L., Yang, S., Li, J., Zhang, M., Yang, C., et al. (2016). The Identification of a Novel HIV-1 CRF01_AE/B Recombinant Based on Near Full-Length Genomic Analysis in Yunnan Province, China. AIDS Res. Hum. Retroviruses 32 (5), 467–470. doi: 10.1089/AID.2015.0245
Li, Y., Miao, J., Miao, Z., Song, Y., Wen, M., Zhang, Y., et al. (2017). Identification of a Novel HIV Type 1 Circulating Recombinant Form (CRF86_BC) Among Heterosexuals in Yunnan, China. AIDS Res. Hum. Retroviruses 33 (3), 279–283. doi: 10.1089/AID.2016.0188
Li, M., Ye, H. (2010). A Fractional Differential Equation Model of CD4~+T Cells Infected With HIV With Cure Rate [J]. J. Donghua. Univ. (Nat. Sci. Ed.) 36 (01), 103–108+114.
Lu, X., Su, B., Xia, H., Zhang, X., Liu, Z., Ji, Y., et al. (2016). Low Double-Negative CD3+CD4-CD8- T Cells Are Associated With Incomplete Restoration of CD4+ T Cells and Higher Immune Activation in HIV-1 Immunological non-Responders. Front. Immunol. 7, 579. doi: 10.3389/fimmu.2016.00579
Masiá, M., Padilla, S., Barber, X., Sanchis, M., Terol, G., Lidón, F., et al. (2016). Comparative Impact of Suppressive Anti Retro - Viral Regimens on the CD4/CD8 T-Cell Ratio: A Cohort Study. Med. (Baltimore) 95 (11), e3108. doi: 10.1097/MD.0000000000003108
Mussini, C., Lorenzini, P., Cozzi-Lepri, A., Lapadula, G., Marchetti, G., Nicastri, E., et al. (2015). CD4/CD8 Ratio Normalisation and non-AIDS-Related Events in Individuals With HIV Who Achieve Viral Load Suppression With Antiretroviral Therapy: An Observational Cohort Study. Lancet HIV 2, e98–e106. doi: 10.1016/S2352-3018(15)00006-5
Perelson, A. S., Nelson, P. W. (1999). Mathematical Analysis of HIV-Idynamics In Vivo[J]. SIAM. Rev. 41 (1), 3–4. doi: 10.1137/S0036144598335107
Rajasuriar, R., Wright, E., Lewin, S. R. (2015). Impact of Antiretroviral Therapy (ART) Timing on Chronic Immune Activation/in - Flammation and End-Organ Damage. Curr. Opin. HIV AIDS. 10 (1), 35–42. doi: 10.1097/COH.0000000000000118
Renganathan, V. (2019). Overview of Artificial Neural Network Models in the Biomedical Domain. Bratisl. Lek.. Listy. 120 (7), 536–540. doi: 10.4149/BLL_2019_087
Ren, L., Li, J., Zhou, S., Xia, X., Xie, Z., Liu, P., et al. (2017). Prognosis of HIV Patients Receiving Antiretroviral Therapy According to CD4 Counts: A Long-Term Follow-Up Study in Yunnan, China. Sci. Rep. 7 (1), 9595. doi: 10.1038/s41598-017-10105-7.
Rowley, C. F. (2014). Developments in CD4 and Viral Load Monitoring in Resource-Limited Settings. Clin. Infect. Dis. 58 (3), 407–412. doi: 10.1093/cid/cit733
Serrano-Villar, S., Gutierrez, C., Vallejo, A., Hernandez-Novoa, B., Diaz, L., Abad Fernandez, M., et al. (2013). The CD4/CD8 Ratio in HIV-Infected Subjects is Independently Associated With T-Cell Activation Despite Long-Term Viral Suppression. J. Infection. 66 (1), 57–66. doi: 10.1016/j.jinf.2012.09.013
Singh, Y., Mars, M. (2010). Support Vector Machines to Forecast Changes in CD4 Count of HIV-1 Positive Patients[J]. Sci. Res. Essay. 5 (17), 2384–2390.
Su, Y., Ding, G., Reilly, K. H., Norris, J. L., Liu, H., Li, Z., et al. (2016). Loss to Follow-Up and HIV Incidence in Female Sex Workers in Kaiyuan, Yunnan Province China: A Nine Year Longitudinal Study. BMC Infect. Dis. 16 (1), 526. doi: 10.1186/s12879-016-1854-y
Wang, Y., Liang, Y., Feng, Y., Wang, B., Li, Y., Wu, Z., et al. (2015). HIV-1 Prevalence and Subtype/Recombinant Distribution Among Travelers Entering China From Vietnam at the HeKou Port in the Yunnan Province, China, Between 2003 and 2012. J. Med. Virol. 87 (9), 1500–1509. doi: 10.1002/jmv.24202
Wang, J., Shen, C., Guo, C., Liang, L., Wu, H. (2006). Relationship Between CD_4~+T Lymphocytes and Total Number of Lymphocytes in Adult HIV/AIDS Patients and its Significance [J]. Chin. J. Gen. Med. 22, 1859–1861.
Wang, X., Song, X. (2009). Characterization of a htLV-i Infection Model With Cure Rate and ATL Response [J]. J. Appl. Math. 22 (03), 589–595.
Xiao, Y., Kristensen, S., Sun, J., Lu, L., Vermund, S. H. (2007). Expansion of HIV/AIDS in China: Lessons From Yunnan Province. Soc. Sci. Med. 64 (3), 665–675. doi: 10.1016/j.socscimed.2006.09.019
Xu, Y., Fu, L. R., Jia, M., Dai, G., Wang, Q., Huang, P., et al. (2014). HIV Prevalence and Associated Factors Among Foreign Brides From Burma in Yunnan Province, China. PloS One 9 (12), e115599. doi: 10.1371/journal.pone.0115599
Keywords: HIV/AIDS, RF, MLP, SVM, machine learning model, CD4/CD8 ratio, prediction, ART
Citation: Li B, Li M, Song Y, Lu X, Liu D, He C, Zhang R, Wan X, Zhang R, Sun M, Kuang Y-Q and Li Y (2022) Construction of Machine Learning Models to Predict Changes in Immune Function Using Clinical Monitoring Indices in HIV/AIDS Patients After 9.9-Years of Antiretroviral Therapy in Yunnan, China. Front. Cell. Infect. Microbiol. 12:867737. doi: 10.3389/fcimb.2022.867737
Received: 01 February 2022; Accepted: 13 April 2022;
Published: 12 May 2022.
Edited by:
Yan-Mei Jiao, Fifth Medical Center of the PLA General Hospital, ChinaReviewed by:
Jinmin Ma, Beijing Genomics Institute (BGI), ChinaGuan Daogang, Southern Medical University, China
Copyright © 2022 Li, Li, Song, Lu, Liu, He, Zhang, Wan, Zhang, Sun, Kuang and Li. This is an open-access article distributed under the terms of the Creative Commons Attribution License (CC BY). The use, distribution or reproduction in other forums is permitted, provided the original author(s) and the copyright owner(s) are credited and that the original publication in this journal is cited, in accordance with accepted academic practice. No use, distribution or reproduction is permitted which does not comply with these terms.
*Correspondence: Ya Li, MTM3MDg3MTAwNjBAMTM5LmNvbQ==; Yi-Qun Kuang, eXE2MTA0MzNAaG90bWFpbC5jb20=; Ming Sun, c3VubWluZ0BpbWJjYW1zLmNvbS5jbg==
†These authors have contributed equally to this work
 Bingxiang Li1†
 Ruixian Zhang
 Ming Sun
 Yi-Qun Kuang
 Ya Li
Ya Li