
94% of researchers rate our articles as excellent or good
Learn more about the work of our research integrity team to safeguard the quality of each article we publish.
Find out more
ORIGINAL RESEARCH article
Front. Cell. Infect. Microbiol., 08 February 2022
Sec. Microbiome in Health and Disease
Volume 11 - 2021 | https://doi.org/10.3389/fcimb.2021.804733
This article is part of the Research TopicRole of Microbiome in Disease Diagnostics and TherapeuticsView all 25 articles
 Yuhui Du1,2,3
 Qiongli Neng2
 Yu Li1,3
 Yongbo Kang4*
 Liqiong Guo1
 Xinwei Huang1
 Minghui Chen1
 Fan Yang5
 Jingan Hong5
 Shuai Zhou6
 Jianhua Zhao6
 Fubing Yu7
 Heng Su2*
 Xiangyang Kong1*
Objective: The diabetic autonomic neuropathy is one of the most common complications in type 2 diabetes mellitus (T2DM), especially gastrointestinal autonomic neuropathy (GAN), which occurs in up to 75% of patients. The study aimed to investigate the gut microbiota composition, structure, and function in T2DM patients with GAN (T2DM_GAN) and set up a link between gut microbiota and clinical characteristics of patients.
Methods: DNA was extracted from fecal samples of three groups using the kit method: healthy volunteers (n = 19), the patients with T2DM (n = 76), and T2DM_GAN (n = 27). Sequencing of 16S ribosomal DNA was performed using the MiSeq platform.
Results: According to the clinical data, higher age, lower triglyceride, and lower body mass index were the main features of patients with T2DM_GAN. The gut microbiota analysis showed that Bacteroidetes, Firmicutes, and Proteobacteria constituted the three dominant phyla in healthy individuals. In addition, the gut microbiota structure and function of T2DM_GAN patients were clearly different from that of T2DM patients. T2DM patients were characterized by Fusobacteria, Fusobacteriia, Fusobacteriales, Fusobacteriaceae, Fusobacterium, Lachnoclostridium, and Fusobacterium_mortiferum. Those gut microbiota may be involved in carotenoid and flavonoid biosyntheses. Relatively, the Gammaproteobacteria, Enterobacteriales, Enterobacteriaceae, Escherichia-Shigella, Megasphaera, Escherichia_coli, and Megasphaera_elsdenii were characteristic in the T2DM_GAN patients. Those may be involved in bacterial invasion of epithelial cells and pathogenic Escherichia coli infection.
Conclusions: GAN exacerbated gut microbiota dysbiosis in adult patients with T2DM. The findings indicated that phyla Fusobacteria and class Gammaproteobacteria were closely related to the occurrence of T2DM. Especially the latter may promote T2DM_GAN.
With the increasing incidence of diabetes, diabetes complications have also increasingly become one of the most critical health problems in the world today (Cho et al., 2018; Meldgaard et al., 2018). Once diabetes occurs, it can cause various complications and a negative impact on the whole organism (Leustean et al., 2018). In general, the common complications of diabetes include macrovascular, peripheral vascular, and microvascular diseases (Leustean et al., 2018). One of the most common microvascular complications is neuropathy, including autonomic and peripheral neuropathy, which causes harmful changes in neurons’ structure and function (Meldgaard et al., 2018). Especially in neuropathy associated with alterations in the enteric nervous system has the highest symptom burden, since it affects a large proportion of patients with diabetes. A typical example is gastrointestinal autonomic neuropathy (GAN), which occurred in 75% of diabetic patients (Bytzer et al., 2001; Asgharnezhad et al., 2019). Those patients may experience a range of adverse gastrointestinal symptoms, such as postprandial fullness, nausea, vomiting, bloating, abdominal pain, diarrhea, and constipation (Bytzer et al., 2001; Asgharnezhad et al., 2019). A large cohort study has found that moderate to severe symptoms were associated with more inadequate glycemic control (Gatopoulou et al., 2012). Although heavily documented, GAN remains underrecognized and poorly treated in type 2 diabetes mellitus (T2DM) patients.
The pathophysiology of T2DM with GAN (T2DM_GAN) is complex and multifactorial. Although there is some clinical guidance on T2DM_GAN, there are still many knowledge gaps about the underlying specific pathogenesis and mechanism. There are multiple levels of regulation in the gastrointestinal tract: the central, autonomic, enteric nervous systems, the interstitial cells of Cajal (mainly “pacemaker cells”), and gut microbiota (Kempler et al., 2016). It is well known that there are significant changes in the composition of the microbiota in T2DM patients, and the altered microbiota likely contributes to T2DM pathogenesis (Gurung et al., 2020). Simultaneously, some gastrointestinal movement disorders, for example, diarrhea, have been attributed to change in the microbiota (Yarandi and Srinivasan, 2014). Therefore, the effect of gut microbiota on gastrointestinal motility has also attracted more and more attention. To date, there is little published information on gut microbiota of T2DM_GAN patients, and the exact role of altered microbiota in diabetes-induced gastrointestinal dysmotility has still not been investigated.
To investigate gut microbiota of T2DM_GAN, we collected stool samples from the healthy population, patients with T2DM, and T2DM_GAN and measured their gut microbiota by next-generation sequencing. Through comparing qualitative and quantitative changes in the intestinal flora of the three groups, we expected to screen flora and related functions contributed to the onset of T2DM_GAN.
The ethics review committee of The First People’s Hospital of Yunnan Province granted this study’s approval. Informed consent was obtained from all the subjects.
Participants in the trial were recruited from the Endocrinology department of the First People’s Hospital of Yunnan province in Kunming, China. All the eligible patients had an established diagnosis of T2DM, and the subjects included men and women. Inclusion criteria were the following: (1) age 20–75 years, (2) provision of written informed consent, and (3) meeting the 1999 World Health Organization (WHO) diagnostic criteria for T2DM. Exclusion criteria were (1) systemic antibiotics within 6 weeks before inclusion; (2) use of probiotics, prebiotics, and synbiotic within 3 months before inclusion; (3) daily alcohol consumption >30 g; (4) significant immunodeficiency; (5) serious kidney disease serious; (6) liver disease excluding fatty liver; (7) known cardiac valvular disease; and (8) breastfeeding or pregnancy. In addition, considering the influence of daily diet on gut microbiota, we make sure participants had relatively similar diet structure by questionnaires. Namely, nutritional habits will be assessed using a standardized 14-day recall questionnaire, which will be discussed with a dietician.
The demographic data for the patients with T2DM and T2DM_GAN are summarized in Table 1. The subjects were divided into three groups: T2DM group (n = 73), T2DM_GAN group (n = 27), and normal group (n = 19). Healthy controls included age- and sex-matched cohort with no known disease symptoms.
Height and body weight were measured, and body mass index (BMI) was calculated at the beginning of the study. Blood samples were also collected at recruitment and then detected serum biochemical and blood analysis. The fecal samples were collected and transported to the laboratory using an icebox, stored at −80°C, and extracted DNA for microbiota analysis. Fecal samples were collected from healthy volunteers, who had no abnormality as determined by medical examination.
Microbial DNA was extracted from each stool sample using the QIAamp DNA Stool Mini Kit (Qiagen, USA) as per the manufacturer’s instructions. DNA quality was assessed by agarose gel electrophoresis and NanoDrop™ One. The 16S rRNA gene V4 region was amplified using forward primer F-5′CCTACGGGRSGCAGCAG3′ and reverse primer R-5′GGACTACVVGGGTATCTAATC3′. Amplicon library was created for each sample and performed according to the Illumina MiSeq 16S metagenomic sequencing library preparation protocol. Paired-end sequencing of 16S ribosomal RNA was performed using the Illumina MiSeq platform.
A significant number of reads were generated by Illumina MiSeq high-throughput sequencer, which was called paired-end reads (raw data) and had a certain proportion of dirty data. The clean data and useful tags could be obtained through quality control and trimming subsequently. Then, the USEARCH method was used to cluster the tags into operational taxonomic units (OTUs) according to 97% similarity. The OTU species annotations were made using the SILVA database (https://www.arb-silva.de/) to obtain each sample’s community composition information.
According to the OTUs clustering results, on the one hand, species annotation was made for the representative sequence of each OTU to obtain the corresponding species information and species-based abundance distribution. Simultaneously, the OTUs were analyzed for abundance and alpha diversity calculation to get the species richness and evenness information in samples information between different groups. On the other hand, multiple sequence alignments could be performed on OTUs and constructed phylogenetic trees. The community structure differences of different samples and groups could be further obtained, displayed by principal coordinates analysis (PCoA) and other dimensionality reduction graphs and sample clustering trees. Finally, PICRUSt2 was used to predict the effect of community that we may better explore the function of intestinal bacteria and characterize better the potential role of the flora of different study populations. Statistics and visualization were obtained by Statistical Analysis of Metagenomic Profiles (STAMP).
All analyses were processed and plotted using QIIME version 1 (http://qiime.org/) and R (https://www.r-project.org/). p ≤ 0.05 was considered as the statistical significance and corrected using false discovery rate (FDR).
According to the WHO diagnostic criteria for T2DM, a total of 118 T2DM patients that cover 36 patients with T2DM_GAN and 19 normal people were recruited. All patients with T2DM_GAN were diagnosed with T2DM for more than 3 years, the longest even over 30 years. Finally, 73 patients with T2DM and 27 patients with T2DM_GAN completed the trial. Eighteen patients with diabetes did not meet the test due to incomplete clinical data including a lack of blood or stool samples.
The significantly different clinical data were calculated using the paired two-tailed Student’s t-test. Compared to the T2DM group, BMI, total bilirubin, unconjugated bilirubin, triglyceride, number of white and red blood cells, hemoglobin, and hematocrit were all strongly lower in the T2DM_GAN group (Table 1, p < 0.05). In addition, age and blood urea nitrogen were substantially higher.
To characterize the bacterial profiles present in these 119 subjects’ fecal microbiota, we performed next-generation sequencing of the V4 high-variable regions of the 16S rRNA gene with an Illumina MiSeq sequencing platform. The total number of paired-end reads obtained for 119 subjects were 10,535,570. After applying quality control and trimming, we received 8,637,657 high-quality sequences from diabetes patients (including T2DM and T2DM_GAN group) and 1,626,531 sequences from healthy controls, 97.42% of the total reads, and an average of 86,254 ± 7516 sequences per sample. Detailed information on the sequence results of each sample is presented in Supplementary Table 1.
Microbiota diversity analysis is valuable for quantifying the bacterial component and relative richness of a specific community. It includes alpha-diversity (intra-community), beta-diversity (inter-community), and gamma-diversity (total regional diversity) in the study of community ecology (Thukral et al., 2019). Alpha-diversity refers to species diversity within communities or within habitats, which can be measured by multiple indicators.
In our study, the index of chao1, observed species, ACE, and PD_whole_tree were dramatically decreased in the T2DM and T2DM_GAN group compared to the normal group (Figures 1A–D). Furthermore, they were significantly increased in the T2DM_GAN group than in the T2DM group. No significant difference in Shannon and Simpson index were observed among the three groups (Figures 1E, F). In addition, a clear distinction was observed among the microbiota communities of the three groups, as shown in the PCoA plot (Figure 2A).
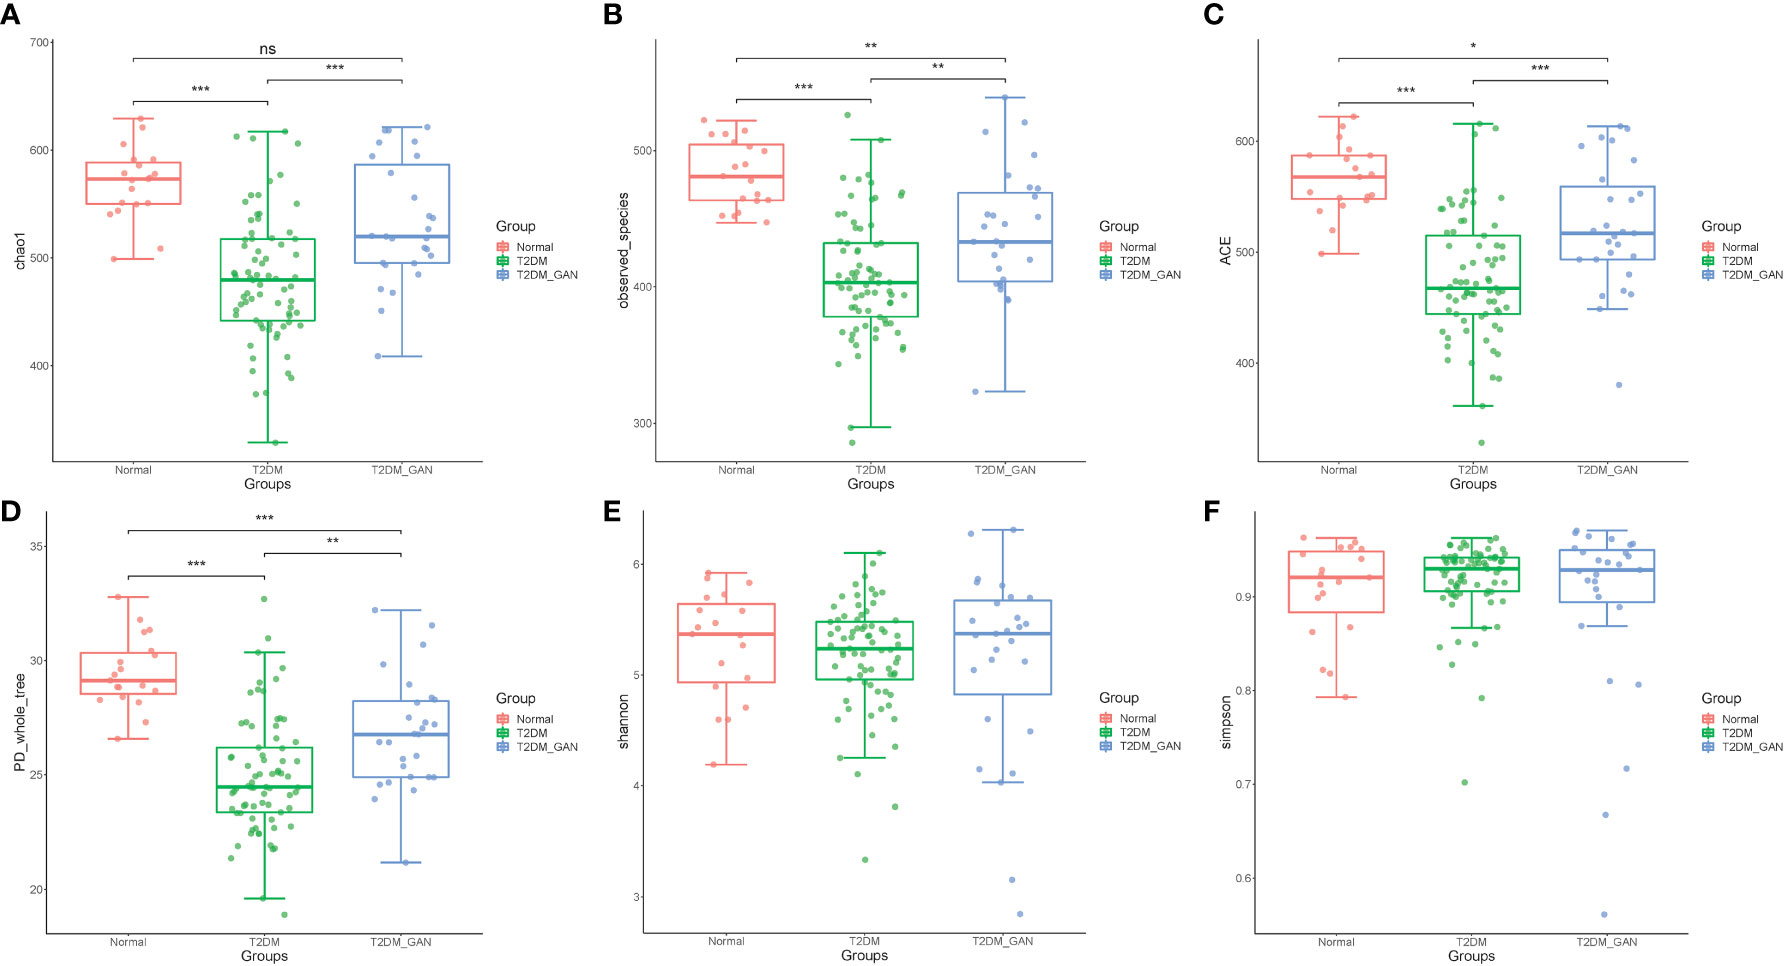
Figure 1 The alpha diversity of the gut microbiota among the subjects. (A) Chao1 index, (B) observed_species, (C) ACE index, (D) PD_whole_tree, (E) Shannon, and (F) Simpson. One-way ANOVA (normal vs. T2DM vs. T2DM_GAN group), multiple comparisons are performed using FDR correction: *p < 0.05, **p < 0.01, ***p < 0.001.
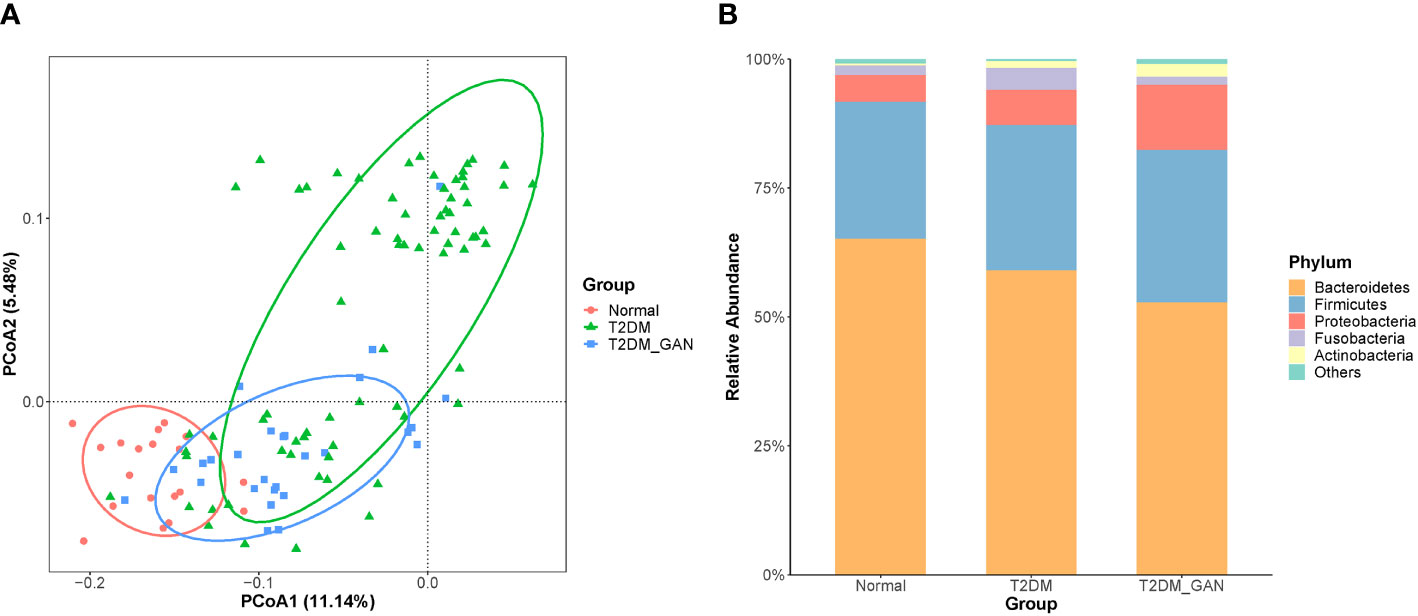
Figure 2 T2DM_GAN induce significant changes in the gut microbiota. (A) Unconstrained PCoA (for principal coordinates PCo1 and PCo2) with unweighted UniFrac distance shows that gut microbiota of 119 subjects formed three distinct clusters, which separate along the third coordinate axis (p = 0.001, mrpp). Ellipses cover 80% of the data for each group. (B) Distribution map of relative abundance of each group at the top 5 phyla.
To assess the impact of T2DM_GAN on gut microbiota composition, we analyzed the composition, abundance, and function of gut microbiota in fecal samples. Based on the clustering results, the vast majority (> 90%) of the sequences in all subjects of the study were found to belong to the three most abundant bacterial phyla, namely, Bacteroidetes, Firmicutes, and Proteobacteria (Figure 2B). In agreement with our results, previous investigations have also reported that those three phyla contribute to the majority of human gut microbiota (Larsen et al., 2010; De Filippo et al., 2010). Relevant differences were found in the proportions of three phyla: Bacteroidetes was more represented in normal than in T2DM and T2DM_GAN patients (65.19% versus 59.13% versus 52.56%, respectively), whereas Firmicutes and Proteobacteria were more abundant in T2DM and T2DM_GAN than in the normal group (26.61% versus 28.10% versus 29.59% and 5.2% versus 6.85% versus 12.61%, respectively). The remaining reads annotated to Fusobacteria, Actinobacteria, Tenericutes,Verrucomicrobia, and other taxonomic phyla (Figure 2B).
Kruskal–Wallis test was used to investigate the difference in gut microbiota composition among the three groups; multiple comparisons were performed using Wilcoxon signed-rank test and corrected using false discovery rate (FDR). A total of 60 marked different bacteria were identified at four levels, and their average relative abundance exceeded 0.1% (Figure 3 and Supplementary Table 2). At phylum level, the proportion of Bacteroidetes was gradually decreased from normal to T2DM and then to T2DM_GAN, but the opposite trend was observed in Actinobacteria. The abundance of Fusobacteria was significantly higher in T2DM group than in T2DM_GAN group (Supplementary Table 2, p = 0.011), but the abundance of Tenericutes were significantly lower (Supplementary Table 2, p = 0.0009).
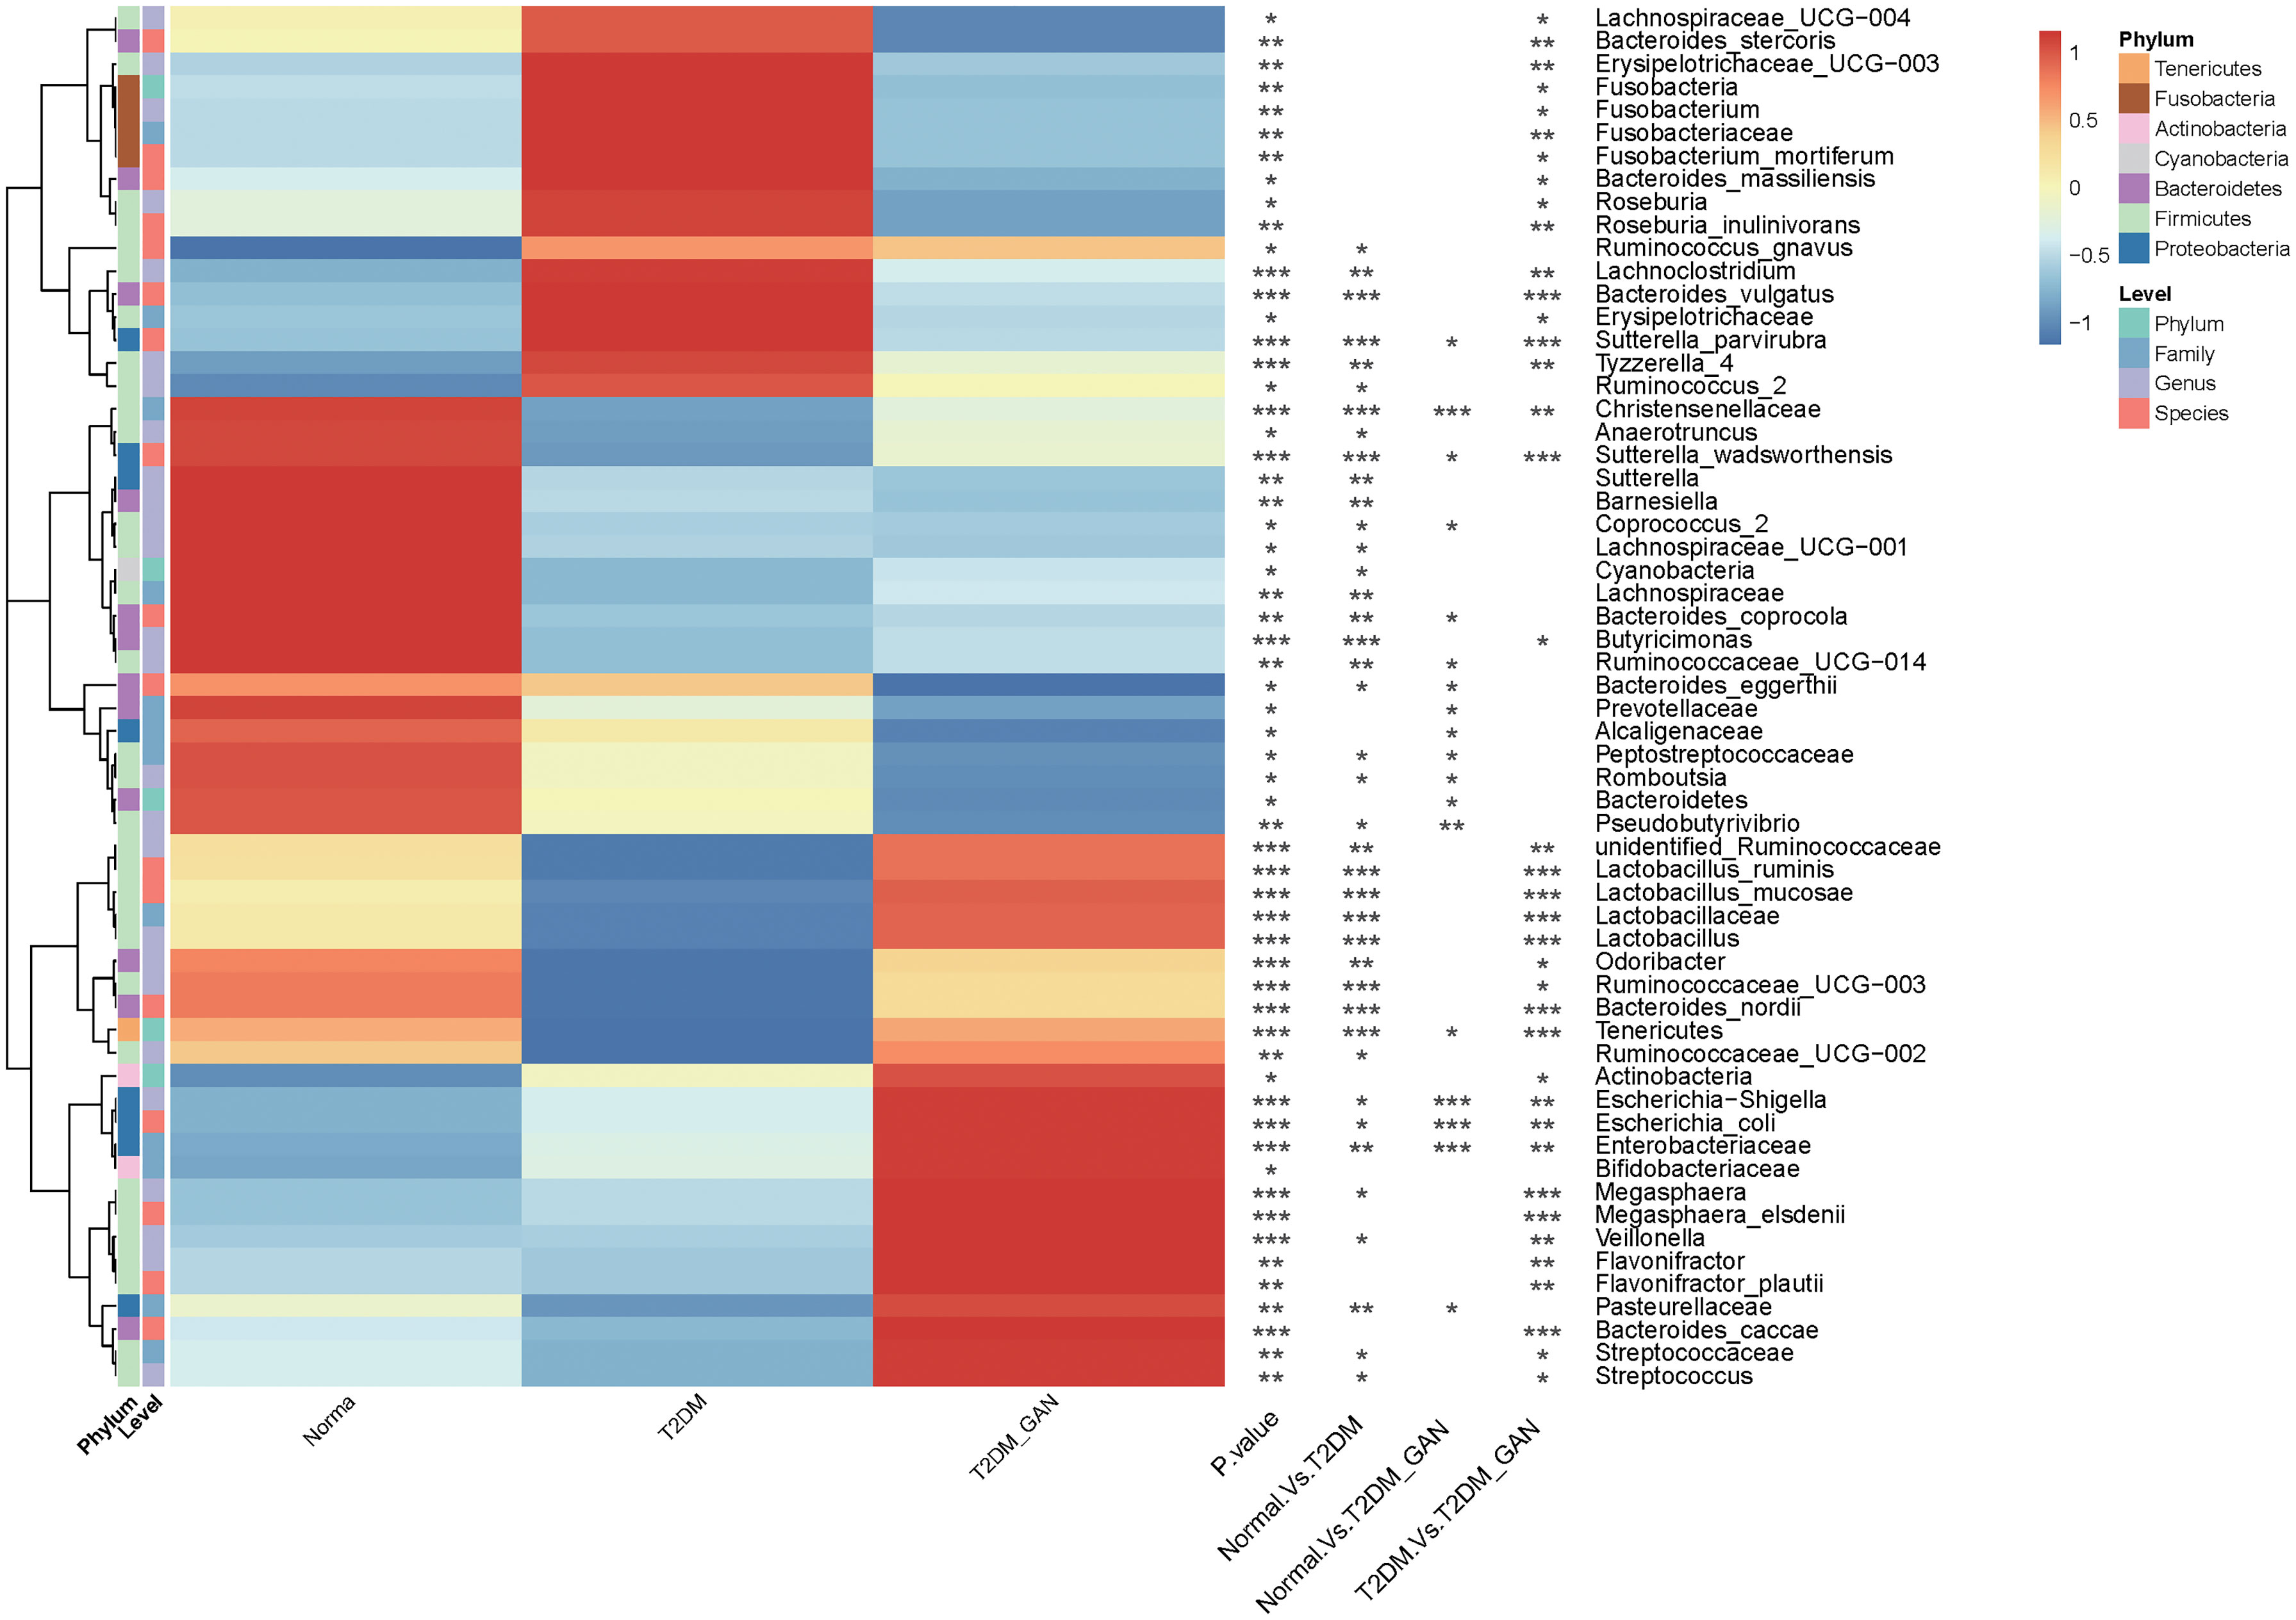
Figure 3 Gastrointestinal autonomic neuropathy exacerbates gut microbiota dysbiosis in adult patients with type 2 diabetes mellitus. Kruskal–Wallis test (normal vs. T2DM vs. T2DM_GAN group), multiple comparisons are performed using FDR correction: *p < 0.05, **p < 0.01, ***p < 0.001.
At the family level, 16 families were strongly different among the three groups. The abundance of Lactobacillaceae, Peptostreptococcaceae, and Alcaligenaceae were gradually decreased from normal to T2DM and then to T2DM_GAN of all. In addition, Lactobacillaceae, Enterobacteriaceae, Fusobacteriaceae, and Erysipelotrichaceae in the T2DM_GAN group were less abundant than that in the T2DM group, but the proportion of Christensenellaceae and Streptococcaceae were more abundant (Supplementary Table 2, p < 0.05).
At the genus level, there were 26 genera with significant difference among the three groups. Twenty-one genera in the normal group and 16 genera in the T2DM_GAN group were differentially abundant compared to the T2DM group, with 15 and 10 being upregulated, respectively (Figure 3 and Supplementary Table 2). Most of the dramatically changed genera belonged to the phyla Firmicutes, Bacteroidetes, and Proteobacteria. Specifically, the order Clostridiales within the phylum Firmicutes accounted for 15 of the 26 different genera in the three groups (Supplementary Table 2).
At the species level, 30 species had an average relative abundance of more than 0.1%. Seventeen species were markedly different among the species of the three groups (Figure 3 and Supplementary Table 2). In addition, 11 species in the normal group and 14 species in the T2DM_GAN group were differentially abundant as compared to the T2DM group (Figure 3 and Supplementary Table 2), with 6 and 8 being upregulated, respectively. Interestingly, the species Escherichia_coli which belonged to Enterobacteriaceae family, was the top 3 species on all samples, and its abundance was much higher in the T2DM_GAN than in the other groups. Additional information for the strongly changed species has been listed in Supplementary Table 2.
Biomarkers analysis using linear discriminant analysis effect size (LEfSe) indicated that T2DM patients were characterized by phylum Fusobacteria, class Fusobacteriia, order Fusobacteriales, family Fusobacteriaceae, genus Fusobacterium, genus Lachnoclostridium, and species Fusobacterium_mortiferum (Figure 4). In contrast, the class Gammaproteobacteria, order Enterobacteriales, family Enterobacteriaceae, genus Escherichia-Shigella, genus Megasphaera, species E. coli, species Megasphaera_elsdenii, and others were characteristic in the T2DM_GAN patients (Figure 4).
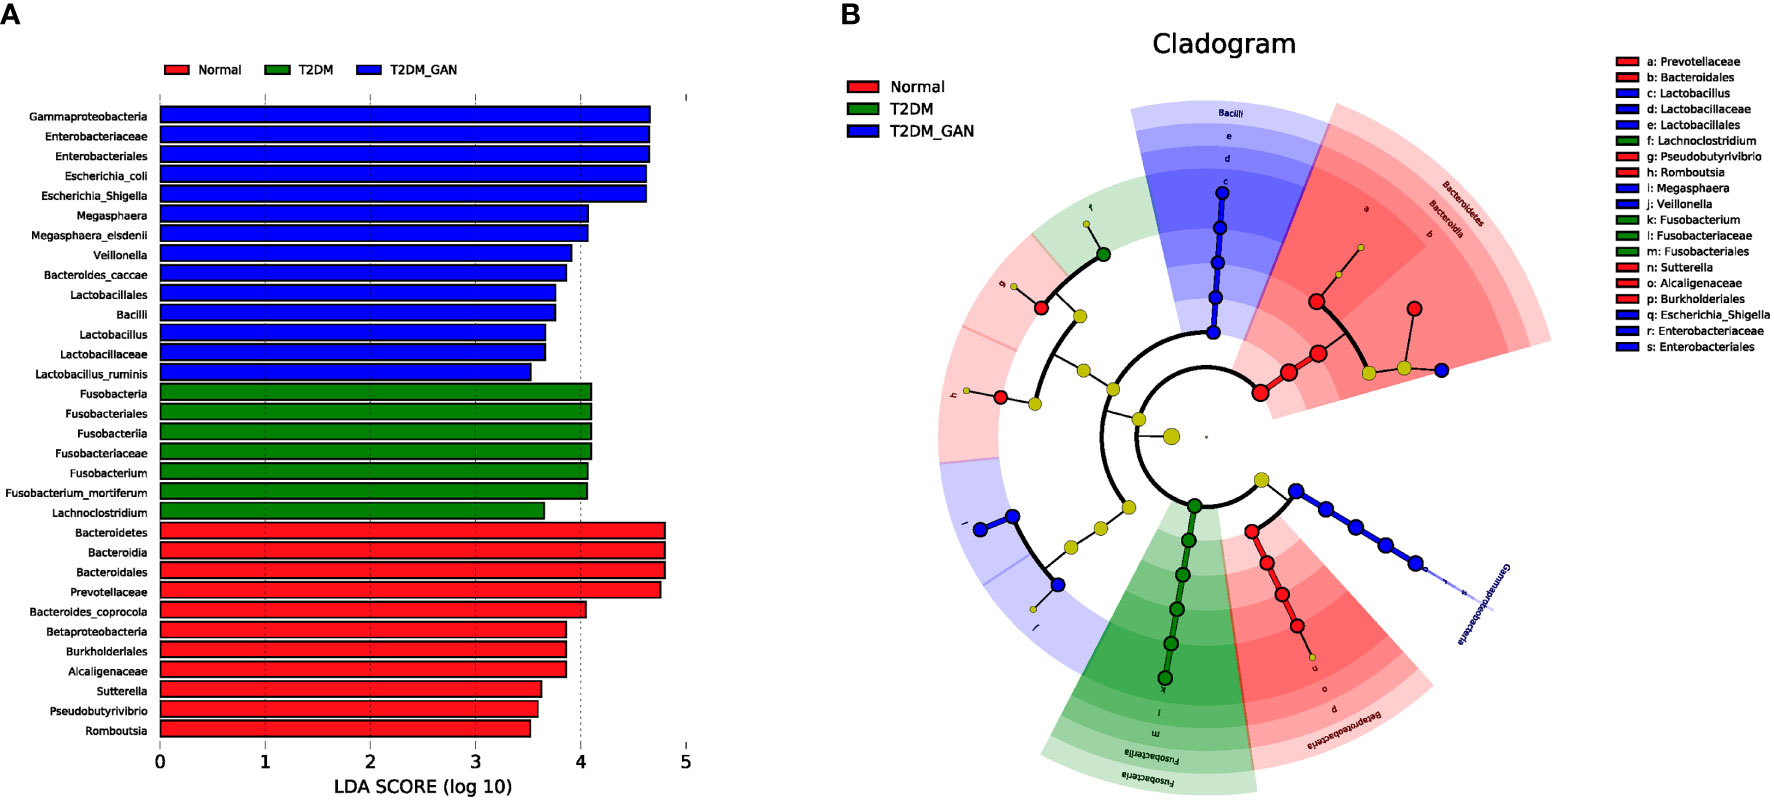
Figure 4 The biomarkers characteristic of the gut microbiota among the subjects. (A) Histogram of LDA scores: the height of the column represents the size of the LDA score, and the higher this value, the more significant the impact on the final classification (LDA > 3.5). (B) Cladogram showing differentially abundant taxonomic clades with an LDA score >3.5.
The above analysis have shown that there were differences in gut microbial diversity, complexity, and composition between the patients with T2DM and T2DM_GAN. Whereafter, we identified a few diverse species and taxonomic communities that may play a dominant role in their respective populations. To find the taxonomic bacteria, we performed the Spearman correlation between bacteria and clinical data and displayed as heat map that could examine the relationship between clinical factors and species in T2DM and T2DM_GAN patients (Figure 5). The results showed that Actinobacteria, Bacilli, Lactobacillales, Lactobacillaceae, Lactobacillus, Lactobacillus_ruminis, Lactobacillus_mucosae, Flavonifractor, F. plautii, Bacteroides_nordii, and Bacteroides_caccae were significantly negatively correlated with several clinical data including red blood cells, hemoglobin, and hematocrit, and opposite with age (Figure 5). It is worth noting that most of these bacteria belong to class Bacilli.
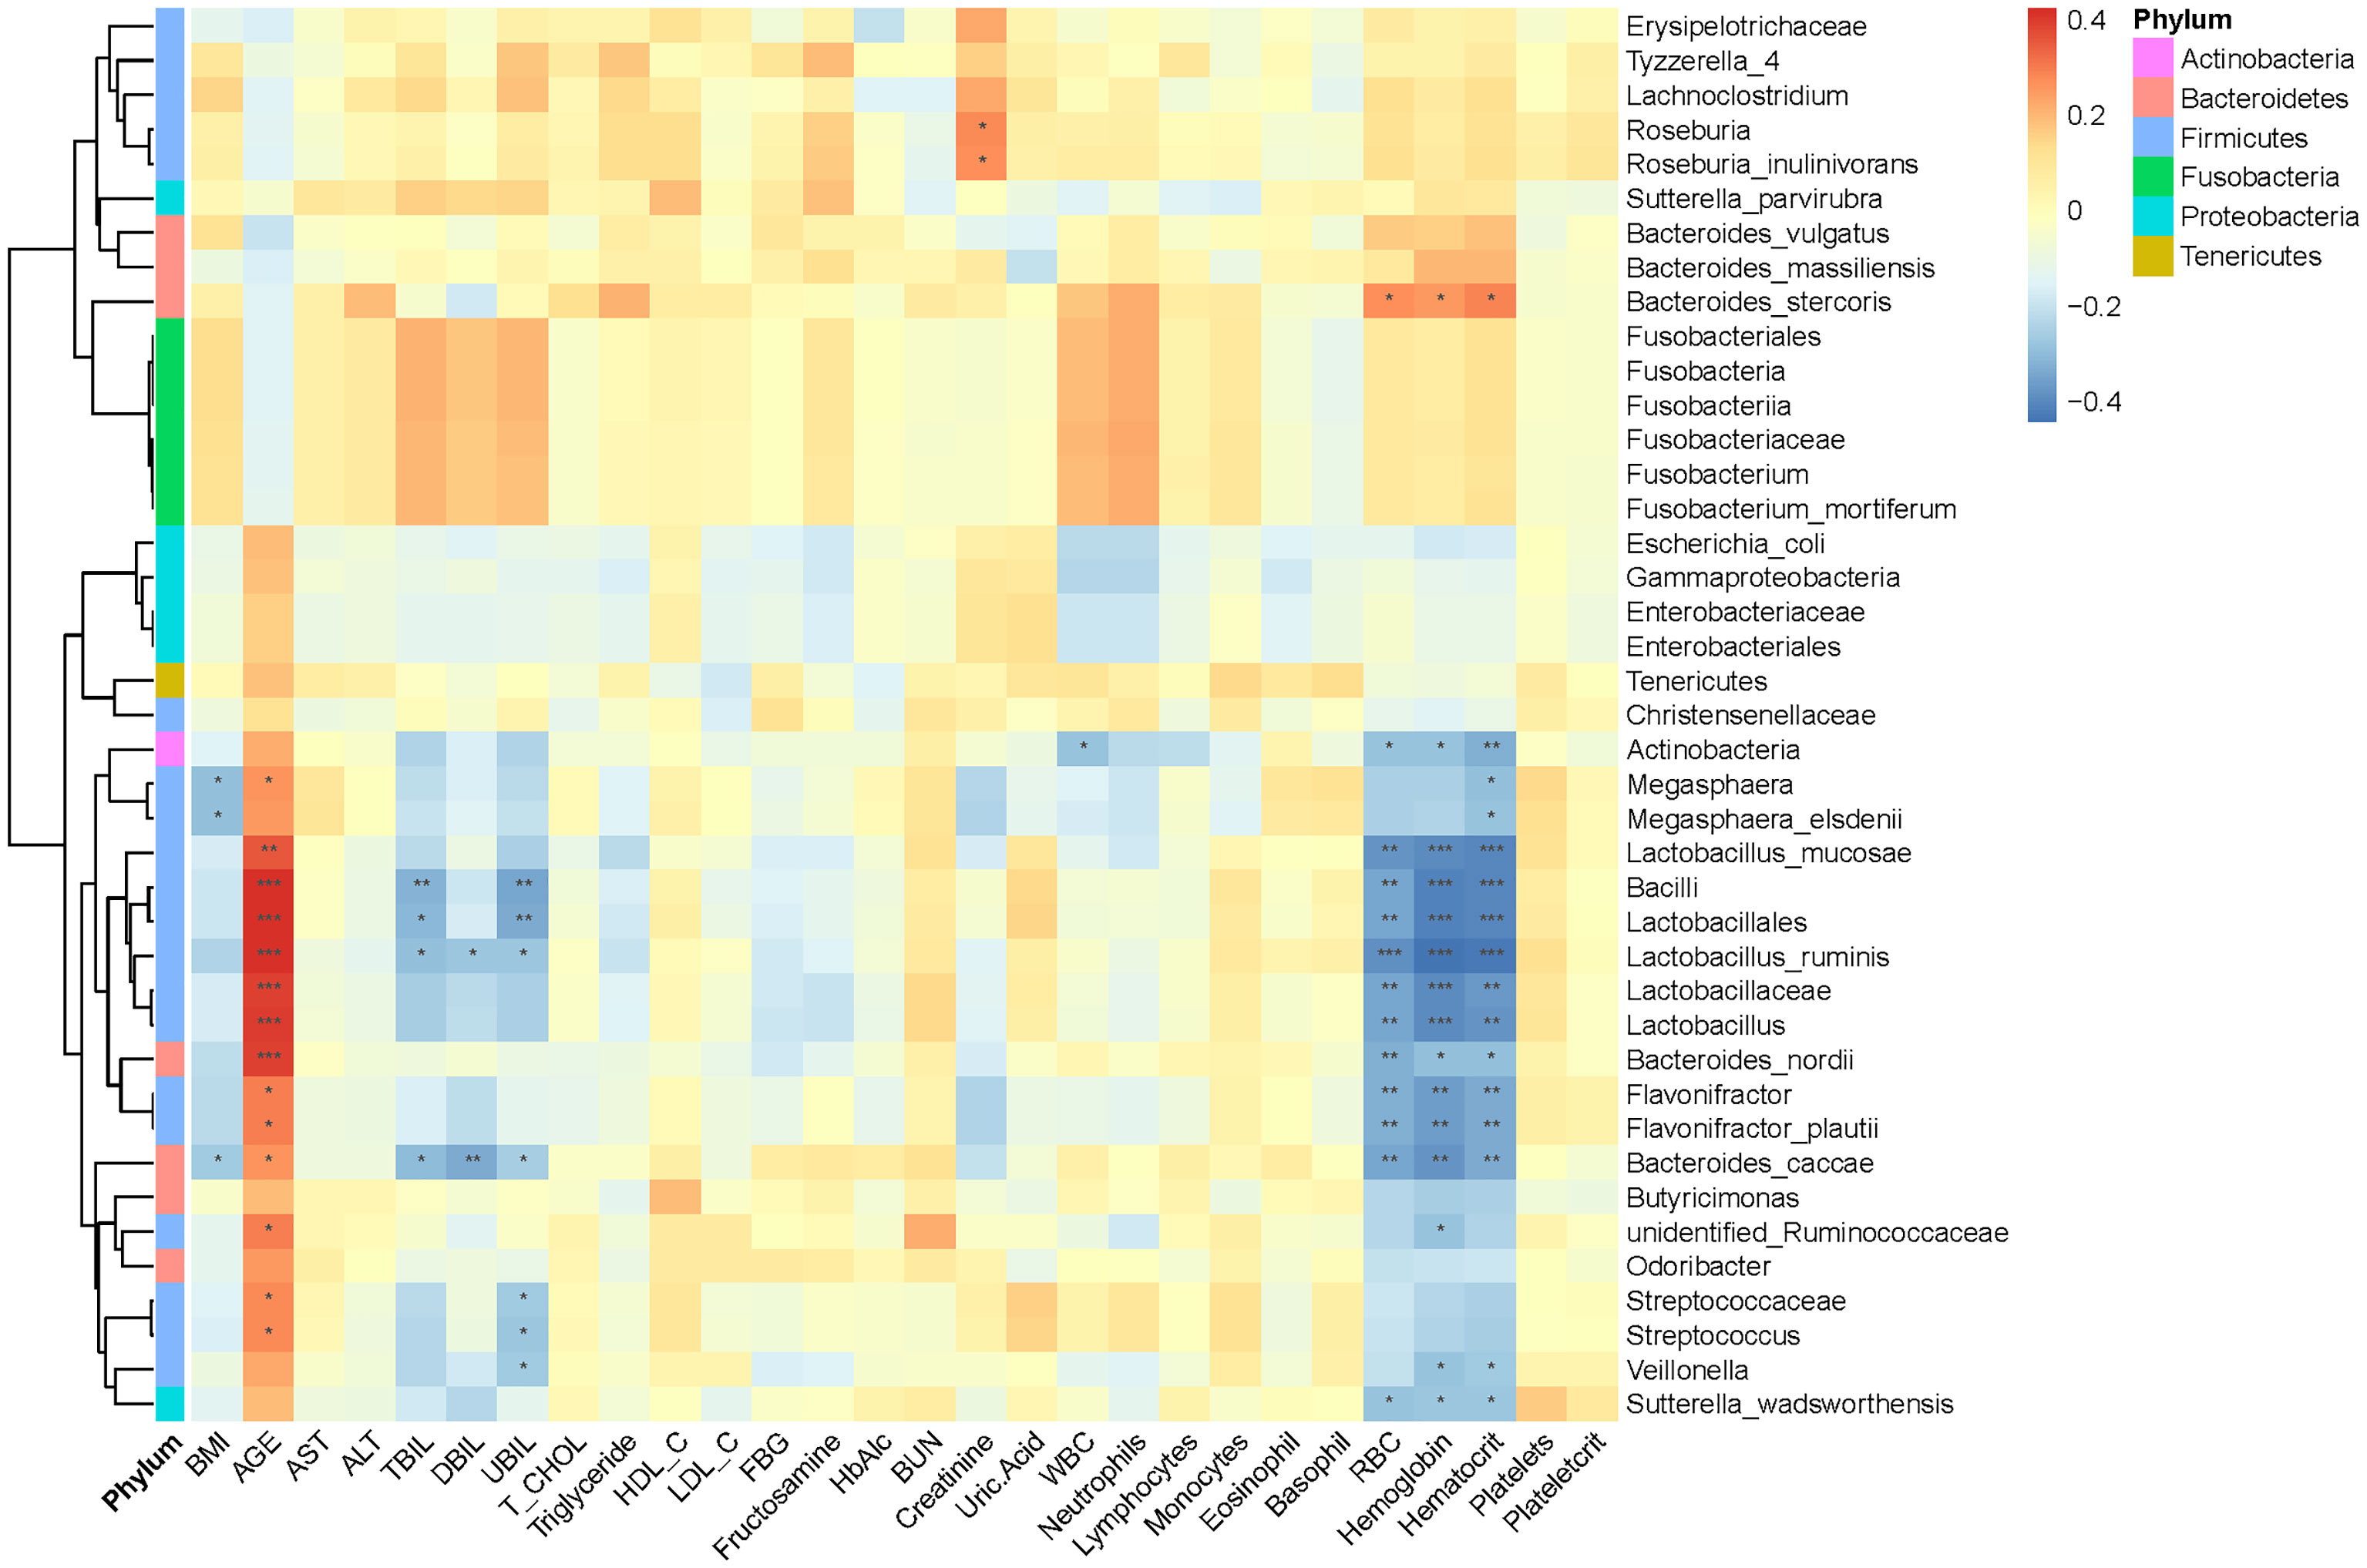
Figure 5 Association between clinical information and microbiota composition at the previously depicted differential bacteria. Notes: *p < 0.05, **p < 0.01, ***p < 0.001. BMI, body mass index; ALT, alanine aminotransferase; AST, aspartate aminotransferase; TBIL, total bilirubin; DBIL, direct bilirubin; UBIL, unconjugated bilirubin; T_CHOL, total cholesterol; HDL_C, high-density lipoprotein cholesterol; LDL_C, low-density lipoprotein cholesterol; FBG, fasting blood glucose; HbA1c, glycosylated hemoglobin; BUN, blood urea nitrogen; WBC, white blood cells; RBC, red blood cells.
The functional metagenomic analysis inferred using PICRUSt2 (Douglas et al., 2020) (phylogenetic investigation of communities by reconstruction of unobserved states 2) examined how the bacterial functional profiles differed among disease groups. As we know, PICRUSt2 is a software tool that predicts the functional profile of a microbial community based on 16S rRNA sequences (Douglas et al., 2020). It provides a starting point for understanding functions potentially represented within a microbial community.
In this study, PICRUSt2 predicted a total of 7,060 Kyoto Encyclopedia of Genes and Genomes (KEGG) ortholog (KO) genes from the entire data set and annotated 170 KEGG pathways. These pathways were mainly distributed in the metabolism (81.11%), Genetic Information Processing (12.97%), Cellular Processes (3.15%), Environmental Information Processing (2.02%), Organismal Systems (0.46%), and Human Diseases (0.30%) of the KEGG pathway at level 1 (Supplementary Figure 1). In addition, we used STAMP (Parks et al., 2014) software to depict the general metabolic pathways and compare microbiota functions among the three groups of subjects, highlighting the significant difference in the distribution of metabolic pathways (Figure 6; Supplementary Figures 2 and 3). In T2DM and T2DM_GAN patients, the predicted KEGG pathways that were significantly differently related to two metabolic pathways involved in amino acid metabolism (“alanine, aspartate and glutamate metabolism,” “valine, leucine and isoleucine degradation,” “lysine biosynthesis,” “taurine and hypotaurine metabolism,” “D-glutamine and D-glutamate metabolism”) and carbohydrate metabolism (pentose phosphate pathway, peptidoglycan biosynthesis, glycosphingolipid biosynthesis—lacto and neolacto series) (Figure 6). Overall, the microbial communities presented in the two groups could be distinguished based on their functions. A further discovery was that epithelial cell signaling in Helicobacter pylori infection was significantly reduced in T2DM_GAN patients (Figure 6). Additionally, gut microbiota biomarkers of T2DM patients may be involved in both carotenoid and flavonoid biosyntheses. The gut microbiota biomarkers of T2DM_GAN patients may be associated with both bacterial invasion of epithelial cells and pathogenic E. coli infection (Figure 7).
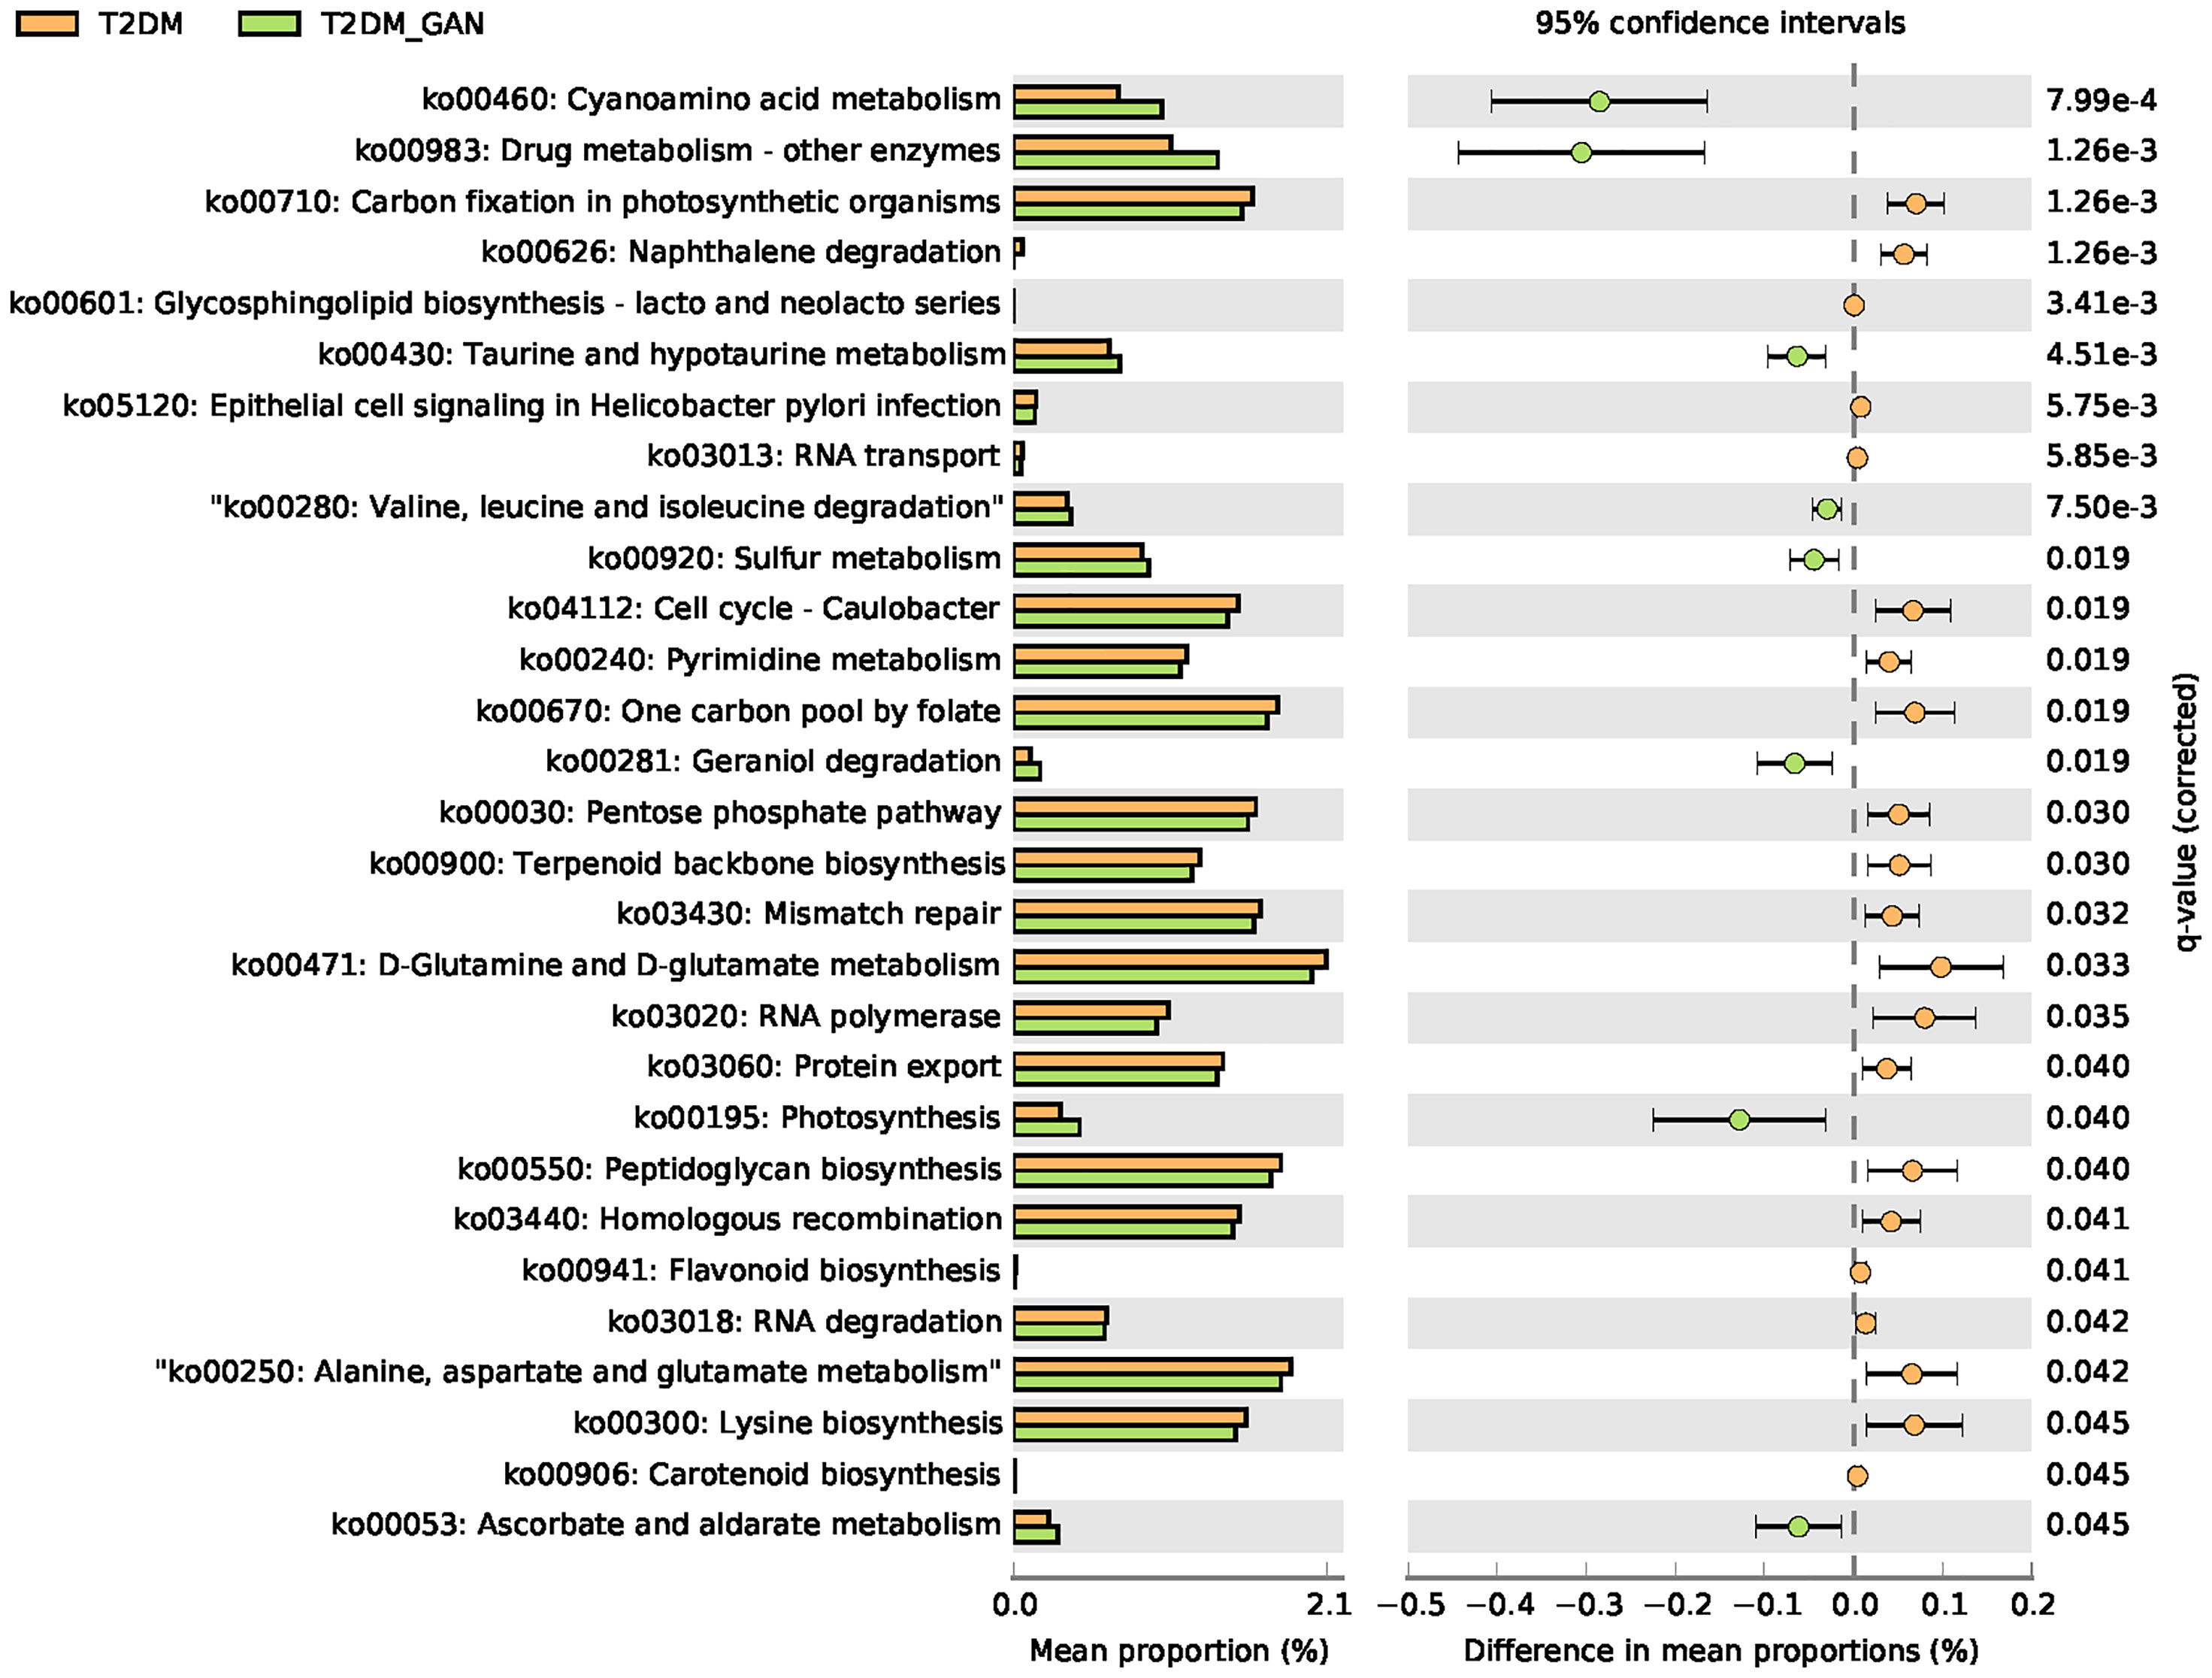
Figure 6 The significantly and differentially pathway between T2DM and T2DM_GAN patients. The left X-axis represents different groups, the Y-axis represents the average relative abundance of a species in different groups, and the right represents the confidence interval and p-value.
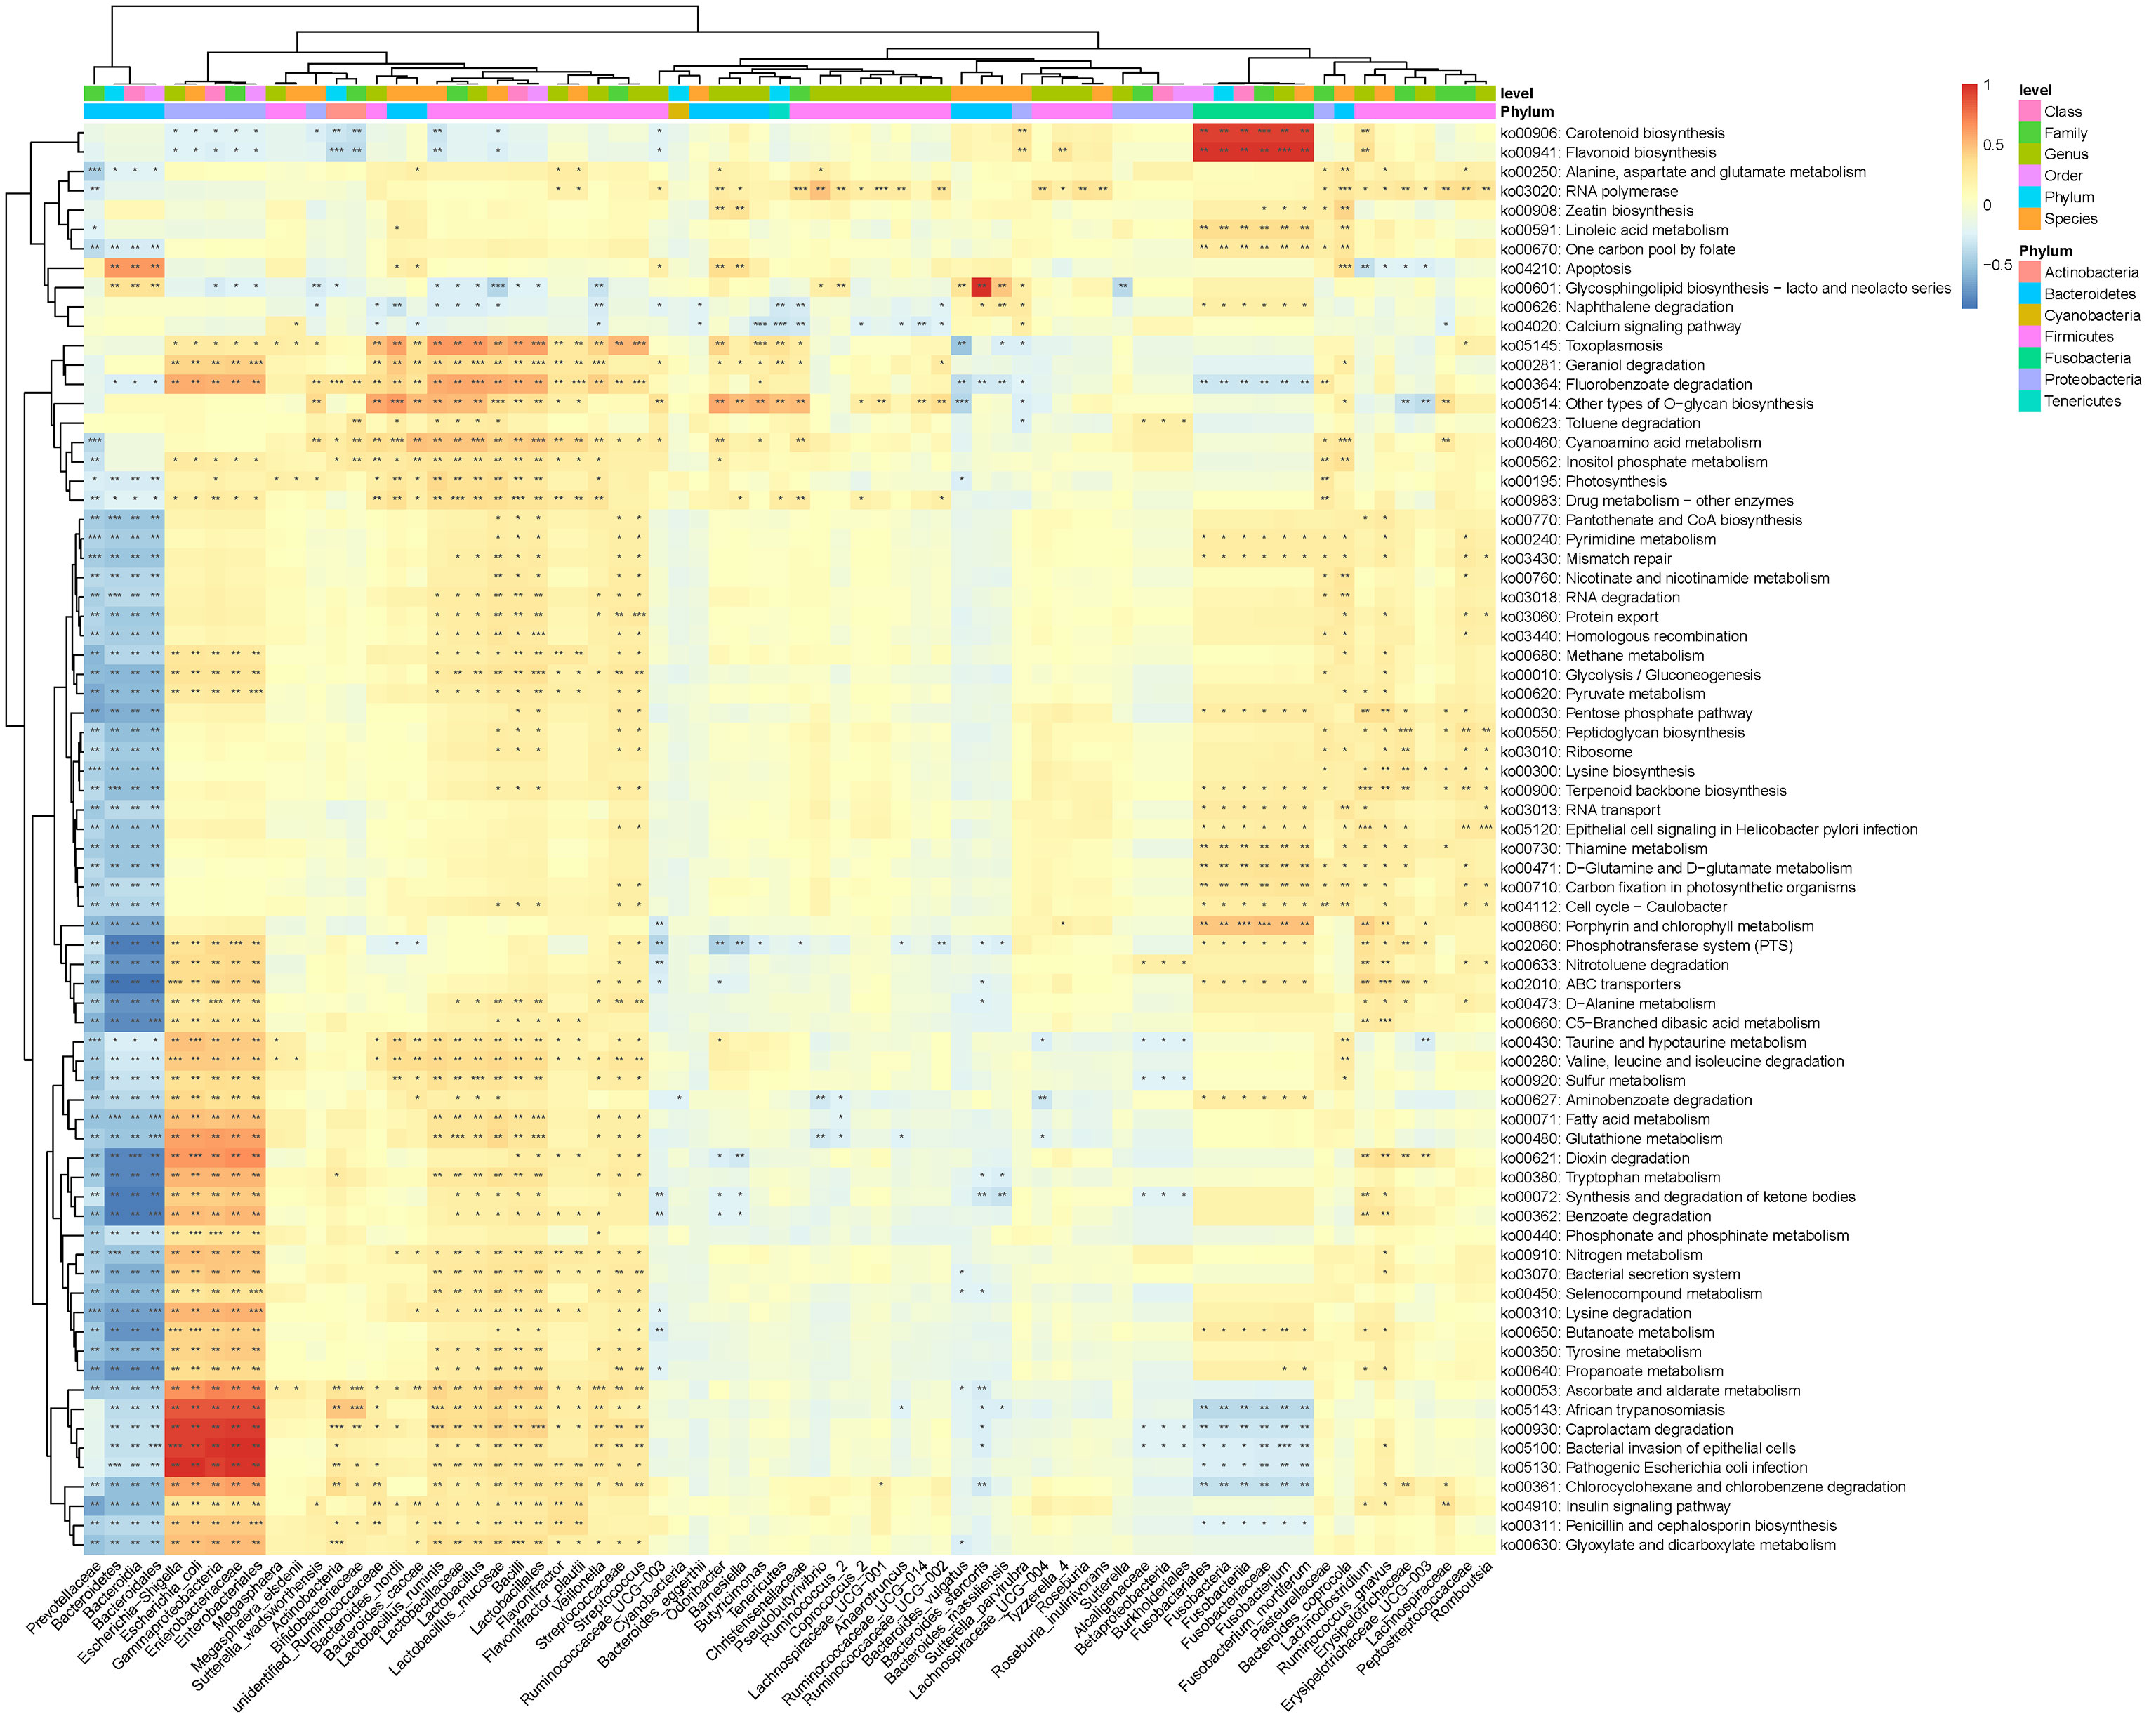
Figure 7 Association between differential KEGG pathways and microbiota composition at the previously depicted differential bacteria. Notes: *p < 0.05, **p < 0.01, ***p < 0.001.
The composition of the gut microbiota is thought to change during the development of diabetes. However, few reports have utilized sequencing techniques to investigate the dynamical changes in gut microbiota composition of patients with T2DM_GAN. In this study, we demonstrated that GAN exacerbates gut microbiota dysbiosis in adult patients with T2DM and suggested that the development of diabetes can be affected by the gut microbiota. The present study indicated that the intestinal flora could distinguish the normal group from the diabetes patients, including patients with T2DM and T2DM_GAN. Furthermore, our results showed that the diversity of diabetic patients is lower than that of the normal individuals. This finding was consistent with previous studies; low richness of gut microbiota had been reported in patients with inflammatory bowel disorder (Qin et al., 2010), elderly patients with inflammation (Claesson et al., 2012), and obese individuals (Le Chatelier et al., 2013), and increased risk of pre-diabetes, T2DM, and ischemic cardiovascular disorders (Le Chatelier et al., 2013).
Microbiological testing of stool samples indicated that there are qualitative and quantitative differences in the composition of the gut microbiota among the subjects. Despite considerable variation found in different individual’s microbiota, the predominant phyla of bacteria in subjects were Bacteroidetes and Firmicutes, which account for >90% of the total gut microbiota in normal people. The rest of the phyla were Proteobacteria, Fusobacteria, Actinobacteria (e.g., Gram-positive anaerobic bacilli Bifidobacterium), and Verrucomicrobia (e.g., Gram-negative anaerobic oval-shaped bacteria Akkermansia) (Salamon et al., 2018). These results corroborated the findings of a great deal of the previous work (Shen et al., 2013; Blandino et al., 2016; Salamon et al., 2018).
The dominant bacterial species largely determine the function of the gut microbiota community. Thus, understanding the species composition at different taxonomic levels can effectively interpret the formation and change of the community structure in T2DM_GAN patients. In the present study, we found that the most significant difference in intestinal microbiota between T2DM and T2DM_GAN patients mainly came from the phyla Fusobacteria and Proteobacteria (Figure 2B and Supplementary Table S2).
On the one hand, we first discussed the effect of Proteobacteria in detail. The T2DM_GAN patients were represented by enriched class Gammaproteobacteria, order Enterobacteriales, family Enterobacteriaceae, genus Escherichia-Shigella, genus Megasphaera, species E. coli, species M. elsdenii, and others (Figure 4). It is generally known that Proteobacteria blooms in the intestine, reflecting an unstable microbial community structure and a host disease state. The members of Proteobacteria, a rich source of lipopolysaccharides (LPS) (Round and Mazmanian, 2009), lead to diabetes through playing a vital role in increasing the level of proinflammatory cytokines and impairing pancreatic beta-cell function (Han et al., 2018). Several reports have shown increased Proteobacteria and its members associated with inflammatory bowel disease (IBD), irritable bowel syndrome (IBS), and ileal Crohn’s disease (CD) (Morgan et al., 2012; Gevers et al., 2014; Lane et al., 2017; Salem et al., 2018). For example, there was an increase in Enterobacteriaceae, Pasteurellacaea, Veillonellaceae, and Fusobacteriaceae in pediatric CD patients (Gevers et al., 2014). Moreover, there was an increased abundance of pathogenic anaerobic organisms including Enterobacteriaceae, Fusobacteriaceae, Escherichia_coli, and Fusobacterium in IBS patients (Gevers et al., 2014; Lane et al., 2017). Meanwhile, Salem et al. (2018) summarized the evident differences in gut microbiota between IBS patients and normal volunteers in that Enterobacteriaceae, Proteobacteria, Veillonella, and Firmicutes aerobes increased and aerobic bacteria decreased. In conclusion, species belonging to the phyla Proteobacteria would be associated with gastrointestinal symptoms. It is interesting to note that the correlation of this study also found that the dominant bacteria in T2DM_GAN patients, Proteobacteria phylum and its members, were likely to be involved in bacterial invasion of epithelial cells and pathogenic E. coli infection.
On the other hand, we will gain insight into Fusobacteria and the related effects. The phylum Fusobacteria, class Fusobacteriia, order Fusobacteriales, family Fusobacteriaceae, genus Fusobacterium, genus Lachnoclostridium, and species F. mortiferum were characteristics in the T2DM patients (Figure 4). Moreover, prior studies have noted the importance of Fusobacteria phylum and its members in other diseases. For instance, the research of Ahmad et al. also detected an abundance of phyla Fusobacteria in the obese-T2DM samples (Ahmad et al., 2019). Tahara et al. have revealed that Fusobacterium is a clinicopathological feature for UC patients in Japan (Tahara et al., 2015). The invasive ability of Fusobacteria was positively correlated with IBD severity of the host (Weingarden and Vaughn, 2017; Ma et al., 2018). Studies have shown that the class Fusobacteria is a kind of adherent and invasive bacteria (Yang et al., 2020) and plays a crucial role in energy production, mounting adhesiveness to host epithelial cells, and inflammation responses. Its high abundance was contributing significantly to T2DM and other diseases (Ahmad et al., 2019). Further analysis found that those microbiota, represented by phylum Fusobacteria in T2DM patients, may be involved in carotenoid biosynthesis and flavonoid biosynthesis. Carotenoids are one of the lipids that are bioactive and well recognized for their antioxidant activities and regulation of cellular growth and immune response (Al-Ishaq et al., 2020). Flavonoids, natural phenolic compounds found abundantly in fruits and vegetables, were reported to have potentially anti-neurodegenerative, anti-inflammatory, anti-cardiovascular activities and anticancer abilities (Al-Ishaq et al., 2021). In addition, several studies have shown that Fusobacterium_nucleatum is an emerging pathogen, which has been implicated as a causal microbe in several diseases of the gastrointestinal tract, including CD and colorectal cancer (Cochrane et al., 2020). Therefore, according to these data, we boldly inferred that Fusobacteria and its members might influence occurrence and progression of GAN in T2DM patients. Although we know that this microbe can cause illness, how it does this remains enigmatic. Further investigations are needed to identify the detailed mechanism.
Subsequently, we found that pathways mainly related to amino acid metabolism and carbohydrate metabolism were significantly different between the T2DM and T2M_GAN patients. Several previous studies have shown that essential amino acids metabolic pathways seem to be associated with obesity and insulin resistance (Ridaura et al., 2013; Sanmiguel et al., 2015). In addition, because the intestine is the main site for nutrient absorption, when the bacteria in the intestine are significantly increased, they often cause gastrointestinal symptoms, affect the absorption of carbohydrates and fats, and worsen intestinal inflammation (Yao et al., 2016). In reviewing the literature, amino acids could affect immune responses either directly or indirectly through their metabolites (Li et al., 2007). Therefore, changes in these amino acid metabolism pathways could be a result of the body’s antiviral response. Although the microbiota functional differences among the normal, T2DM, and T2DM_GAN groups were not experimentally confirmed in our study, the predicted metagenomic pathways had significant differences, which could provide meaningful information for the microbial role of relating gastrointestinal symptoms.
Notably, although this study was the first to compare the gut microbiota between the patients with T2DM and T2DM_GAN, it still has certain limitations. First, the sample distribution of the subjects was uneven, and there were big differences in age and BMI among patients. However, this difference was mainly due to the clinicopathological characteristics of T2DM and T2DM_GAN patients. T2DM_GAN is an intestinal complication of T2DM, and the long-term disease state is one of its causes. In addition, patients with T2DM_GAN may experience a variety of burdensome symptoms, including dysphagia, indigestion, pain, abdominal distension, diarrhea, constipation, fecal incontinence, vomiting, and weight loss, all of which can adversely affect the quality of life. Studies have reported that 70 years old was considered the threshold age for defining an individual as elderly because the gut microbiota may undergo major changes at this time (Odamaki et al., 2016). Second, another limitation was a lack of clinical data for the normal people in the study. Unfortunately, the blood samples of normal individuals could not be collected during the study period. Therefore, we only performed a correlation analysis for fecal samples and clinical data between T2DM and T2DM_GAN. The microbial community’s composition depends on its colonization location and is affected by other several factors, such as the genetic, living environment (continent, climate), age, and diet (Vallianou et al., 2018). A limitation of our study is the lack of detailed nutritional data for participants. However, based on the same hospital participators, we could assume that their nutrition was no different. Therefore, to further determine the sequential changes in gut microbiota in T2DM_GAN patients, larger, more comprehensive, and complete experiments are needed.
Despite these limitations, our data still provided a novel better understanding of gut microbiota’s role in developing T2DM and its complication. The gut microbiota may be related to the pathological state or severity of diabetes, and microflora interventions; for example, probiotics, prebiotic treatments, and stool transplantation was of great significance for treating and preventing complications of T2DM. Especially in the stage of T2DM, targeting related bacteria may better prevent the occurrence and development of complications.
Gastrointestinal autonomic neuropathy exacerbates gut microbiota dysbiosis in adult patients with T2DM, and the most significant difference between them mainly came from the phyla Fusobacteria and Proteobacteria. The former is a kind of Gram-negative bacteria, which was the most abundant in the T2DM population. The latter is an LPS-producing bacteria phylum, which was dramatically more in the T2DM_GAN group than in other groups. To be specific, T2DM patients were characterized by phylum Fusobacteria, class Fusobacteriia, order Fusobacteriales, family Fusobacteriaceae, genus Fusobacterium, genus Lachnoclostridium, and species F. mortiferum. In contrast, the class Gammaproteobacteria, order Enterobacteriales, family Enterobacteriaceae, genus Escherichia-Shigella, genus Megasphaera, species E. coli, species M. elsdenii, and others were characteristic in the T2DM_GAN patients (Figure 3). Furthermore, there were significant changes in pathways mainly related to amino acid metabolism and carbohydrate metabolism in T2DM and T2M_GAN patients. A characteristic of gut microbiota in T2DM patients is that they may be involved in carotenoid and flavonoid biosynthesis and that of T2DM_GAN patients may be involved in bacterial invasion of epithelial cells and pathogenic E. coli infection.
The data presented in the study are deposited in the github: https://github.com/duyuhui/Gut-microbiota-of-T2DM_GAN
XK, HS, and YK conceived the research project; YD, QN, YL, YK, LG, XH, MC, FY, JH, SZ, JZ and FY performed the experiments; YD analyzed the data, and wrote the draft; YK revised the manuscript; XK, HS, and YK supervised the work; All authors read and approved the final manuscript.
XK, HS, and YK conceived the research project; YD, QN, YL, YK, LG, XH, MC, FY, JH, SZ, JZ and FY performed the experiments; YD analyzed the data, and wrote the draft; YK revised the manuscript; XK, HS, and YK supervised the work; All authors read and approved the final manuscript.
The authors declare that the research was conducted in the absence of any commercial or financial relationships that could be construed as a potential conflict of interest.
All claims expressed in this article are solely those of the authors and do not necessarily represent those of their affiliated organizations, or those of the publisher, the editors and the reviewers. Any product that may be evaluated in this article, or claim that may be made by its manufacturer, is not guaranteed or endorsed by the publisher.
We sincerely thank the volunteers for their participation and thank the endeavor of the staffs in the First People’s Hospital of Yunnan province to collect stool specimens and investigate clinical information.
The Supplementary Material for this article can be found online at: https://www.frontiersin.org/articles/10.3389/fcimb.2021.804733/full#supplementary-material
Supplementary Figure 1 | Pie chart shows the distribution of KEGG metabolic pathways of level 1.
Supplementary Figure 2 | The significantly and differentially pathway between Normal people and T2DM patients. The left X-axis represents different groups, the Y-axis represents the average relative abundance of a species in different groups, and the right represents the confidence interval and p-value.
Supplementary Figure 3 | The significantly and differentially pathway between Normal people and T2DM_GAN patients. The left X-axis represents different groups, the Y-axis represents the average relative abundance of a species in different groups, and the right represents the confidence interval and p-value.
Supplementary Table 1 | Illumina sequencing summary.
Supplementary Table 2 | GAN exacerbates gut microbiota dysbiosis in adult patients with T2DM. Notes: Kruskal-Wallis Test is used to compare the three groups (Normal vs T2DM vs T2DM_GAN group, kruskal pvalue). And multiple comparisons are performed using Wilcoxon Signed Rank Test and corrected using FDR.
Ahmad, A., Yang, W. W., Chen, G. F., Shafiq, F., Javed, M., Ali Zaidi, S., et al. (2019). Analysis of Gut Microbiota of Obese Individuals With Type 2 Diabetes and Healthy Individuals. PloS One 14 (12), e0226372. doi: 10.1371/journal.pone.0226372
Al-Ishaq, R. K., Liskova, A., Kubatka, P., Büsselberg, D. (2021). Enzymatic Metabolism of Flavonoids by Gut Microbiota and Its Impact on Gastrointestinal Cancer. Cancers (Basel) 13 (16), 3934. doi: 10.3390/cancers13163934
Al-Ishaq, R. K., Overy, A. J., Büsselberg, D. (2020). Phytochemicals and Gastrointestinal Cancer: Cellular Mechanisms and Effects to Change Cancer Progression. Biomolecules 10 (1), 105. doi: 10.3390/biom10010105
Asgharnezhad, M., Joukar, F., Fathalipour, M., Khosousi, M., Hassanipour, S., Pourshams, A., et al. (2019). Gastrointestinal Symptoms in Patients With Diabetes Mellitus and Non-Diabetic: A Cross-Sectional Study in North of Iran. Diabetes Metab. Syndr. 13 (3), 2236–2240. doi: 10.1016/j.dsx.2019.05.028
Blandino, G., Inturri, R., Lazzara, F., Di Rosa, M., Malaguarnera, L. (2016). Impact of Gut Microbiota on Diabetes Mellitus. Diabetes Metab. 42 (5), 303–315. doi: 10.1016/j.diabet.2016.04.004
Bytzer, P., Talley, N. J., Leemon, M., Young, L. J, Jones, M. P., Horowitz, M. (2001). Prevalence of Gastrointestinal Symptoms Associated With Diabetes Mellitus: A Population-Based Survey of 15000 Adults. Arch. Intern. Med. 161 (16), 1989–1996. doi: 10.1001/archinte.161.16.1989
Cho, N. H., Shaw, J. E., Karuranga, S., Huang, Y., Fernandes, J. D., Ohlrogge, A. W., et al. (2018). IDF Diabetes Atlas: Global Estimates of Diabetes Prevalence for 2017 and Projections for 2045. Diabetes Res. Clin. Pract. 138, 271–281. doi: 10.1016/j.diabres.2018.02.023
Claesson, M. J., Jeffery, I. B., Conde, S., Power, S. E., O'Connor, E. M., Cusack, S., et al. (2012). Gut Microbiota Composition Correlates With Diet and Health in the Elderly. Nature 488 (7410), 178–184. doi: 10.1038/nature11319
Cochrane, K., Robinson, A. V., Holt, R. A., Allen-Vercoe, E. (2020). A Survey of Fusobacterium Nucleatum Genes Modulated by Host Cell Infection. Microb. Genom. 6 (2), e000300. doi: 10.1099/mgen.0.000300
De Filippo, C., Cavalieri, D., Di Paola, M., Ramazzotti, M., Poullet, J. B., Massart, S., et al. (2010). Impact of Diet in Shaping Gut Microbiota Revealed by a Comparative Study in Children From Europe and Rural Africa. Proc. Natl. Acad. Sci. U. S. A. 107 (33), 14691–14696. doi: 10.1073/pnas.1005963107
Douglas, G. M., Maffei, V. J., Zaneveld, J. R., Yurgel, S. N., Brown, J. R., Taylor, C. M., et al. (2020). PICRUSt2 for Prediction of Metagenome Functions. Nat. Biotechnol. 38 (6), 685–688. doi: 10.1038/s41587-020-0548-6
Gatopoulou, A., Papanas, N., Maltezos, E. (2012). Diabetic Gastrointestinal Autonomic Neuropathy: Current Status and New Achievements for Everyday Clinical Practice. Eur. J. Intern. Med. 23 (6), 499–505. doi: 10.1016/j.ejim.2012.03.001
Gevers, D., Kugathasan, S., Denson, L. A., Vazquez-Baeza, Y., Van Treuren, W., Ren, B. Y., et al. (2014). The Treatment-Naive Microbiome in New-Onset Crohn's Disease. Cell Host Microbe 15 (3), 382–392. doi: 10.1016/j.chom.2014.02.005
Gurung, M., Li, Z., You, H., Rodrigues, R., Jump, D. B., Morgun, A., et al. (2020). Role of Gut Microbiota in Type 2 Diabetes Pathophysiology. EBioMedicine 51, 102590. doi: 10.1016/j.ebiom.2019.11.051
Han, H., Li, Y. Y., Fang, J., Liu, G., Yin, J., Li, J., et al. (2018). Gut Microbiota and Type 1 Diabetes. Int. J. Mol. Sci. 19 (4), 995. doi: 10.3390/ijms19040995
Kempler, P., Varkonyi, T., Korei, A. E., Horvath, V. J.. (2016). Gastrointestinal Autonomic Neuropathy in Diabetes: The Unattended Borderline Between Diabetology and Gastroenterology. Diabetologia 59 (3), 401–203. doi: 10.1007/s00125-015-3826-y
Lane, E. R., Zisman, T. L., Suskind, D. L. (2017). The Microbiota in Inflammatory Bowel Disease: Current and Therapeutic Insights. J. Inflamm. Res. 10, 63–73. doi: 10.2147/JIR.S116088
Larsen, N., Vogensen, F. K., Van den Berg, F. W. J., Nielsen, D. S., Andreasen, A. S., Pedersen, B. K., et al. (2010). Gut Microbiota in Human Adults With Type 2 Diabetes Differs From Non-Diabetic Adults. PloS One 5 (2), e9085. doi: 10.1371/journal.pone.0009085
Le Chatelier, E., Nielsen, T., Qin, J. J., Prifti, E., Hildebrand, F., Falony, G., et al. (2013). Richness of Human Gut Microbiome Correlates With Metabolic Markers. Nature 500 (7464), 541–546. doi: 10.1038/nature12506
Leustean, A. M., Ciocoiu, M., Sava, A., Costea, C. F., Floria, M., Tarniceriu, C C., et al. (2018). Implications of the Intestinal Microbiota in Diagnosing the Progression of Diabetes and the Presence of Cardiovascular Complications. J. Diabetes Res. 2018, 5205126. doi: 10.1155/2018/5205126
Li, P., Yin, Y. L., Li, D., Kim, S. W., Wu, G. Y. (2007). Amino Acids and Immune Function. Br. J. Nutr. 98 (2), 237–252. doi: 10.1017/S000711450769936X
Ma, H. Q., Yu, T. T., Zhao, X. J., Zhang, Y., Zhang, H. J. (2018). Fecal Microbial Dysbiosis in Chinese Patients With Inflammatory Bowel Disease. World J. Gastroenterol. 24 (13), 1464–1477. doi: 10.3748/wjg.v24.i13.1464
Meldgaard, T., Olesen, S. S., Farmer, A. D., Krogh, K., Wendel, A. A., Brock, B., et al. (2018). Diabetic Enteropathy: From Molecule to Mechanism-Based Treatment. J. Diabetes Res. 2018, 3827301. doi: 10.1155/2018/3827301
Morgan, X. C., Tickle, T. L., Sokol, H., Gevers, D., Devaney, K. L., Ward, D. V., et al. (2012). Dysfunction of the Intestinal Microbiome in Inflammatory Bowel Disease and Treatment. Genome Biol. 13 (9), R79. doi: 10.1186/gb-2012-13-9-r79
Odamaki, T., Kato, K., Sugahara, H., Hashikura, N., Takahashi, S., Xiao, J. Z., et al. (2016). Age-Related Changes in Gut Microbiota Composition From Newborn to Centenarian: A Cross-Sectional Study. BMC Microbiol. 16, 90. doi: 10.1186/s12866-016-0708-5
Parks, D. H., Tyson, G. W., Hugenholtz, P., Beiko, R. G. (2014). STAMP: Statistical Analysis of Taxonomic and Functional Profiles. Bioinformatics 30 (21), 3123–3124. doi: 10.1093/bioinformatics/btu494
Qin, J., Li, R., Raes, J., Arumugam, M., Burgdorf, K., Manichanh, S., et al. (2010). A Human Gut Microbial Gene Catalogue Established by Metagenomic Sequencing. Nature 464 (7285), 59–65. doi: 10.1038/nature08821
Ridaura, V. K., Faith, J. J., Rey, F. E., Cheng, J. Y., Duncan, A. E., Kau, A. L., et al. (2013). Gut Microbiota From Twins Discordant for Obesity Modulate Metabolism in Mice. Science 341 (6150), 1241214. doi: 10.1126/science.1241214
Round, J. L., Mazmanian, S. K. (2009). The Gut Microbiota Shapes Intestinal Immune Responses During Health and Disease. Nat. Rev. Immunol. 9 (5), 313–323. doi: 10.1038/nri2515
Salamon, D., Sroka-Oleksiak, A., Kapusta, P., Szopa, M., Mrozinska, S., Ludwig-Slomczynska, A. H., et al. (2018). Characteristics of Gut Microbiota in Adult Patients With Type 1 and Type 2 Diabetes Based on Nextgeneration Sequencing of the 16S rRNA Gene Fragment. Pol. Arch. Intern. Med. 128 (6), 336–343. doi: 10.20452/pamw.4246
Salem, A. E., Singh, R., Ayoub, Y. K., Khairy, A. M., Mullin, G. E. (2018). The Gut Microbiome and Irritable Bowel Syndrome: State of Art Review. Arab J. Gastroenterol. 19 (3), 136–141. doi: 10.1016/j.ajg.2018.02.008
Sanmiguel, C., Gupta, A., Mayer, E. A. (2015). Gut Microbiome and Obesity: A Plausible Explanation for Obesity. Curr. Obes. Rep. 4 (2), 250–261. doi: 10.1007/s13679-015-0152-0
Shen, J., Obin, M. S., Zhao, L. P. (2013). The Gut Microbiota, Obesity and Insulin Resistance. Mol. Aspects Med. 34 (1), 39–58. doi: 10.1016/j.mam.2012.11.001
Tahara, T., Shibata, T., Kawamura, T., Okubo, M., Ichikawa, Y., Sumi, K., et al. (2015). Fusobacterium Detected in Colonic Biopsy and Clinicopathological Features of Ulcerative Colitis in Japan. Dig. Dis. Sci. 60 (1), 205–210. doi: 10.1007/s10620-014-3316-y
Thukral, A. K., Bhardwaj, R., Kumar, V., Sharma, A. (2019). New Indices Regarding the Dominance and Diversity of Communities, Derived From Sample Variance and Standard Deviation. Heliyon 5 (10), e02606. doi: 10.1016/j.heliyon.2019.e02606
Vallianou, N. G., Stratigou, T., Tsagarakis, S. (2018) Microbiome and Diabetes: Where Are We Now? Diabetes Res. Clin. Pract. 146, 111–118. doi: 10.1016/j.diabres.2018.10.008
Weingarden, A. R., Vaughn, B. P. (2017). Intestinal Microbiota, Fecal Microbiota Transplantation, and Inflammatory Bowel Disease. Gut Microbes 8 (3), 238–252. doi: 10.1080/19490976.2017.1290757
Yang, H. J., Gan, D., Li, Y., Wang, X. S., Jin, L., Qin, K., et al. (2020). Quyushengxin Formula Causes Differences in Bacterial and Phage Composition in Ulcerative Colitis Patients. Evid. Based. Complement. Alternat. Med. 2020, 5859023. doi: 10.1155/2020/5859023
Yao, J., Chang, L., Yuan, L. L., Duan, Z. P. (2016). Nutrition Status and Small Intestinal Bacterial Overgrowth in Patients With Virus-Related Cirrhosis. Asia Pac. J. Clin. Nutr. 25 (2), 283–291. doi: 10.6133/apjcn.2016.25.2.06
Keywords: gut microbiota, type 2 diabetes mellitus, gastrointestinal autonomic neuropathy, gastrointestinal symptoms, diagnosis
Citation: Du Y, Neng Q, Li Y, Kang Y, Guo L, Huang X, Chen M, Yang F, Hong J, Zhou S, Zhao J, Yu F, Su H and Kong X (2022) Gastrointestinal Autonomic Neuropathy Exacerbates Gut Microbiota Dysbiosis in Adult Patients With Type 2 Diabetes Mellitus. Front. Cell. Infect. Microbiol. 11:804733. doi: 10.3389/fcimb.2021.804733
Received: 29 October 2021; Accepted: 17 December 2021;
Published: 08 February 2022.
Edited by:
Nar Singh Chauhan, Maharshi Dayanand University, IndiaReviewed by:
Rajesh Pandey, CSIR-Institute of Genomics and Integrative Biology (CSIR-IGIB), IndiaCopyright © 2022 Du, Neng, Li, Kang, Guo, Huang, Chen, Yang, Hong, Zhou, Zhao, Yu, Su and Kong. This is an open-access article distributed under the terms of the Creative Commons Attribution License (CC BY). The use, distribution or reproduction in other forums is permitted, provided the original author(s) and the copyright owner(s) are credited and that the original publication in this journal is cited, in accordance with accepted academic practice. No use, distribution or reproduction is permitted which does not comply with these terms.
*Correspondence: Xiangyang Kong, MTc0NTk4MjYxNUBxcS5jb20=; Heng Su, c3VfaGVuQGhvdG1haWwuY29t; Yongbo Kang, NjU3MTUxMjc2QHFxLmNvbQ==
Disclaimer: All claims expressed in this article are solely those of the authors and do not necessarily represent those of their affiliated organizations, or those of the publisher, the editors and the reviewers. Any product that may be evaluated in this article or claim that may be made by its manufacturer is not guaranteed or endorsed by the publisher.
Research integrity at Frontiers

Learn more about the work of our research integrity team to safeguard the quality of each article we publish.