
95% of researchers rate our articles as excellent or good
Learn more about the work of our research integrity team to safeguard the quality of each article we publish.
Find out more
ORIGINAL RESEARCH article
Front. Cell. Infect. Microbiol. , 06 September 2021
Sec. Parasite and Host
Volume 11 - 2021 | https://doi.org/10.3389/fcimb.2021.722984
This article is part of the Research Topic Novel Insights Into the Immune Mechanisms Associated With the Pathogenesis of Chagas Disease View all 22 articles
 Inmaculada Gómez1
 M. Carmen Thomas1*
 Génesis Palacios2
 Adriana Egui1
 Bartolomé Carrilero3Marina Simón3
 Basilio Valladares2,4Manuel Segovia3
 Emma Carmelo2,4
 Manuel Carlos López1*
Infection by the Trypanosoma cruzi parasite causes Chagas disease and triggers multiple immune mechanisms in the host to combat the pathogen. Chagas disease has a variable clinical presentation and progression, producing in the chronic phase a fragile balance between the host immune response and parasite replication that keeps patients in a clinically silent asymptomatic stage for years. Since the parasite is intracellular and replicates within cells, the cell-mediated response of the host adaptive immunity plays a critical role. This function is mainly orchestrated by T lymphocytes, which recognize parasite antigens and promote specific functions to control the infection. However, little is known about the immunological markers associated with this asymptomatic stage of the disease. In this large-scale analysis, the differential expression of 106 immune system-related genes has been analyzed using high-throughput qPCR in T. cruzi antigen-stimulated PBMC from chronic Chagas disease patients with indeterminate form (IND) and healthy donors (HD) from endemic and non-endemic areas of Chagas disease. This analysis revealed that there were no differences in the expression level of most genes under study between healthy donors from endemic and non-endemic areas determined by PCA and differential gene expression analysis. Instead, PCA revealed the existence of different expression profiles between IND patients and HD (p < 0.0001), dependent on the 32 genes included in PC1. Differential gene expression analysis also revealed 23 upregulated genes (expression fold change > 2) and 11 downregulated genes (expression fold change < 0.5) in IND patients versus HD. Enrichment analysis showed that several upregulated genes in IND patients participate in relevant immunological pathways such as antigen-dependent B cell activation, stress induction of HSP regulation, NO2-dependent IL12 pathway in NK cells, and cytokine-inflammatory response. The antigen-specific differential gene expression profile detected in these patients and the relevant immunological pathways that seem to be activated could represent potential biomarkers of the asymptomatic form of Chagas disease, helpful to diagnosis and infection control.
Chagas disease, also known as American trypanosomiasis, is caused by the protozoan parasite Trypanosoma cruzi and is considered one of the most prevalent neglected tropical diseases. It affects around 6–7 million people worldwide, causing approximately 20,000 deaths annually (World Health Organization, 2020). Although it is endemic in Latin America, the migratory movements have changed the epidemiological profile of this infection, representing a serious global health problem today (Schmunis and Yadon, 2010; World Health Organization, 2020).
The clinical course of Chagas disease is characterized by an acute and a chronic phase of infection. The acute phase usually subsides spontaneously after which, if left untreated, the patient will still be chronically infected (Pérez-Molina and Molina, 2018). The reason for this fact is that the parasite spreads from the blood to the tissue that remains hidden, which makes them less accessible for the immune response (Tarleton, 2001). In the chronic phase, most patients are asymptomatic, without developing any clinical symptoms or signs. This is possible due to the existence of a fragile balance between parasite replication and host immune response, which may cause patients to remain clinically silent for a period of 10 to 25 years (Dos Santos Virgilio et al., 2014). This is known as the indeterminate phase of Chagas disease, characterized by seropositivity for T. cruzi and absence of cardiac or digestive symptoms with normal electrocardiography and radiography of the chest, esophagus, and colon, all responsible for a good prognosis of the disease in these patients (Pinto Dias, 1989; World Health Organization, 2020). The imbalance between the immune system response and parasite replication is crucial for the disease progression. Thus, 30%–40% of chronic patients eventually develop a symptomatic phase (Rassi et al., 2010). About 30% of them show cardiac alterations, and up to 10% show digestive megasyndromes and/or neurological disorders (Rassi et al., 2010). The most severe cases of cardiac alterations lead to chronic chagasic cardiomyopathy, associated with high mortality rates in Chagas disease patients (Morris et al., 1990; Rocha et al., 2003).
The diagnosis of Chagas disease is well defined. Specifically, in the chronic phase, serological techniques such as indirect immunofluorescence (IFA), indirect hemagglutination (HAI), and enzyme-linked immunosorbent assay (ELISA) are applied for the detection of antibodies against the parasite (Fife and Muschel, 1959; Camargo, 1966; Camargo et al., 1971; Voller et al., 1975). However, at present, the development of biomarkers of pathology or disease progression remains a necessity, which would represent a major achievement toward improving the clinical management of patients with Chagas disease (Balouz et al., 2017).
The pathogenesis of chronic Chagas disease is currently considered to be multifactorial. In the course of this phase, in addition to other factors, such as the virulence of the T. cruzi strain and tissue tropism, inflammation is the main determinant of the disease progression (Machado et al., 2012; Dutra et al., 2014; Poveda et al., 2014).
The host’s defense reaction against the parasite involves mechanical effectors of the innate and adaptive immune response (Tarleton, 2007), which is mainly characterized by processes of cell proliferation, production of cytokines, and induction of cell death mechanisms (De Meis et al., 2009). During the evolution of Chagas disease, cellular responses are crucial. Thus, it has been demonstrated that chronic patients (both indeterminate and cardiac individuals) present in their bloodstream high frequencies of activated T cells (Dutra et al., 1994). While in the chronic cardiac form an inflammatory environment predominates with the production of cytokines such as TNFα, IFNγ, and other cytotoxic molecules involving CD8+ T cells, in the chronic indeterminate form, a regulatory immune response, characterized by interleukin 10 and interleukin 17 production, predominates (Pérez-Molina and Molina, 2018). Nevertheless, elevated levels of TNFα and IFNγ have also been detected in IND patients compared to healthy subjects (Ferreira et al., 2003; Requena-Méndez et al., 2013). However, there is controversy and other authors have described an opposite correlation between the expression of IFNγ and cardiac disease (Laucella et al., 2004). Besides, in asymptomatic patients, T. cruzi antigen-specific co-production of TNFα, IFNγ, and IL2 cytokines by CD8+ T cells has been found in high proportion which decreases as the disease progresses toward cardiac forms (Mateus et al., 2015). On the other hand, it has been shown that circulating activated T cells in asymptomatic and symptomatic subjects express both inflammatory and anti-inflammatory cytokines, which is consistent with active immunoregulation in the chronic phase (Dutra et al., 1997; Cunha-Neto et al., 2005).
Given that the loss of balance between the immune system response and parasite replication existing in asymptomatic patients is crucial for the disease progression, to know the immune mechanisms that lead to the control of the establishment of the infection and its progression is a priority.
The aim of this work was to elucidate the gene expression patterns that are involved in chronic Chagas disease patients with indeterminate form (IND) of the infection. For this purpose, a high-throughput qPCR was used to analyze, at the same time, the expression level of 106 immune system-related genes in human peripheral blood mononuclear cell (PBMC) samples from IND patients and compared to that from healthy donors coming from non-endemic (HDc) and endemic areas (HDe) of the disease. The results have provided a large collection of differential gene expression data in IND patients versus healthy donors. Comparative analyses of the differentially expressed genes among IND, HDc, and HDe subjects have allowed us to the identification in chronic indeterminate patients of antigen-specific differential gene expression patterns that involve a large set of immune-related genes which participate in several relevant immunological pathways. Study of the differential expression of these genes and the immune routes in which they are involved will improve our knowledge in the establishment of the T. cruzi infection and could also represent new potential biomarkers of the asymptomatic stage in Chagas disease patients.
The protocols used in this study were approved by the Ethics Committees of the Consejo Superior de Investigaciones Científicas (Spain—Reference: 094/2016) and of the Hospital Virgen de la Arrixaca (Murcia, Spain—Reference: MTR-05/2016). The participation of all patients and healthy donors included in this study was completely voluntary, and furthermore, a signed informed consent form was obtained from each of them before their inclusion.
The adult chronic Chagas disease patients originally from endemic areas and residents of Spain included in this study were recruited, diagnosed, and clinically evaluated in the Hospital Virgen de la Arrixaca from Murcia (Spain). These patients, who had not received antiparasitic treatment, were diagnosed out according to the WHO criteria based on two conventional serological tests (Chagas ELISA, Ortho Clinical Diagnostics, and Inmunofluor Chagas, Biocientífica, Argentina) and characterized as indeterminate (IND) patients due to the absence of cardiac (G0 following Kuschnir classification) or digestive manifestations (Supplementary Table 1). In addition, healthy donors from endemic (n = 14) and non-endemic areas (n = 20) were included in this study. The data referring to the age, sex distribution, and country of origin of each of the subjects included in this study are detailed in Table 1.
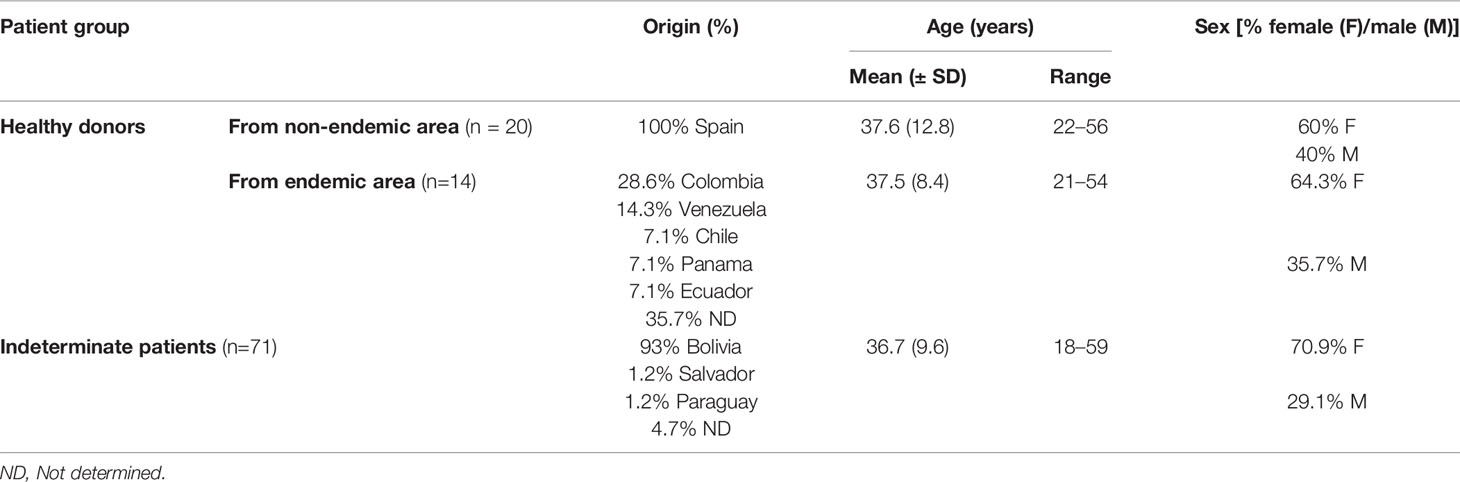
Table 1 Epidemiological and demographic data of the study cohort.
In this study, a total of 39 samples from 71 IND patients and 30 samples from 34 healthy donors were included. Due to the quantity of RNA required to carry out the cDNA synthesis for high-throughput RT-qPCR and the limited number of cells isolated from the blood sample of particular patients, in some cases it was necessary to mix cells from some patients. The collection of new blood samples was not possible in any case since the patients with Chagas disease were treated immediately after being diagnosed. Thus, into the cohort of IND patients, 15 samples corresponded to individual samples (38.5%), 16 to a mixture of 2 patients (41%), and 8 to a mixture of 3 patients (20.5%). In the case of healthy donors, 20 samples from subjects from non-endemic areas were tested (all of them individual samples) together to 10 samples of donors from endemic areas, 6 of which corresponded to individual samples (60%) and 4 to a mixture of 2 subjects (40%).
Thirty milliliters of peripheral blood from subjects was aseptically collected through venipuncture into EDTA-coated tubes. Peripheral blood mononuclear cells (PBMCs) were isolated 16–18 h after blood collection by density gradient centrifugation using Lymphoprep™ (Axis Shield) following the previously described protocol (Marañón et al., 2011). The purified PBMCs were suspended in heat-inactivated fetal bovine serum (iFBS) with 10% DMSO and cryopreserved in liquid nitrogen until use.
T. cruzi (SOL strain) soluble antigens (TcSA), employed to perform in vitro stimulation of PBMCs from patients and healthy donors, were extracted as previously described (Egui et al., 2017). Briefly, mycoplasma-free rhesus monkey kidney epithelial cells (LLC-MK2 line; CCL-7, Manassas, VA, USA) were cultured at a concentration of 4×10⁴ cells/cm2 in T-75-cm2 tissue culture flasks (Falcon) with RPMI-1640 medium (Gibco, Life Technologies), supplemented with 2 mM L-glutamine (Gibco), 10% iFBS, and 50 µg/ml gentamicin (Thermo Fisher Scientific) at 37°C in a humidified atmosphere containing 5% CO2. The semi-confluent monolayer of cultured cells was infected with highly infective trypomastigote forms of the T. cruzi SOL strain (MHOM/ES/2008/SOL; DTU V) isolated from T. cruzi-infected mice, at a parasite:cell ratio of 4:1 for 12 h. After 96–120 h of infection, collection of the trypomastigote and amastigote forms present in the infected LLCMK-2 cell culture supernatants began. The recovered trypomastigote and amastigote forms were collected at 1,258 rcf and washed twice with phosphate-buffered saline (PBS 1×), Subsequently, these parasites were resuspended, at a ratio of 1:1 (trypomastigote: amastigote) and a density of 1×10⁶ parasites/μl in lysis buffer (50 mM Tris–HCl at pH 7.4, 0.05% Nonidet P-40, 50 mM NaCl, 1 mM phenylmethylsulfonyl fluoride (PMSF), 1 μg/ml leupeptin), and sonicated three times with pulses of 50–62 kHz for 40 s with time intervals of 20 s. Finally, the soluble total protein extracts were obtained after centrifugation at 6,700 rcf for 20 min at 4°C.
The protein concentration of the extract was determined using a micro bicinchoninic acid (BCA) protein assay kit (Thermo Scientific, Waltham, MA, USA), and the protein profile was analyzed by SDS-PAGE after Coomassie blue staining. The antigenic and immunogenic capacities of TcSA were tested by ELISA and in lymphoproliferation assays using frozen splenocytes from T. cruzi chronically infected mice.
Cryopreserved PBMCs were thawed in a water bath at 37°C; transferred to a 15-ml Falcon tube containing 10 ml of RPMI-1640 with 2 mM L-glutamine, 10% iFBS, and 50 µg/ml of gentamicin; and centrifuged at 453 rcf for 10 min. After centrifugation, the PBMCs were again suspended in 2 ml of supplemented RPMI-1640 medium and the cell number was determined by manual counting using Trypan blue exclusion assay. Subsequently, all PBMC samples were plated in 12-well plates at concentrations of 7.5–8.5×10⁶ cells/ml in a maximum volume of 3.5 ml/well and cultured for 4 h in an incubator at 37°C in 5% CO2 to allow equilibration of basal gene expression under in vitro growth conditions. Finally, the PBMCs from IND and HD were stimulated with TcSA (10 μg/ml) and cultured for 14–14.5 h at 37°C in 5% CO2.
Total RNA isolation from stimulated PBMCs was performed using the RNeasy Plus Mini Kit (Qiagen), eliminating the genomic DNA and obtaining mRNA enrichment samples following the manufacturer’s instructions. The extracted RNA was quantified by spectrophotometry (NanoDrop 1000, Thermo Fisher Scientific) and confirmed by fluorometry (Qubit, Invitrogen). The quality of the RNA was determined by analyzing its integrity by microfluidic chip electrophoresis (2100 Bioanalyzer, Agilent Technologies). All samples showed to have an RIN (RNA integrity number) between 8 and 10. The samples were stored at -80°C until use.
Two micrograms of total RNA of each patient sample was used for cDNA synthesis by reverse transcription using the High-Capacity cDNA Reverse Transcription Kit (Applied Biosystems) following the manufacturer’s instructions. The resulting cDNA samples were stored at -20°C until use. High-throughput RT-qPCR was performed using QuantStudio™ 12K Flex Real-Time PCR System (Thermo Fisher Scientific) according to the manufacturer’s protocol, as indicated in Hernandez-Santana et al. (2016). Custom TaqMan OpenArray Real-Time PCR Plates included 112 Gene Expression Assays organized in 48 sub-arrays. All primers and probes were commercially available by Thermo Fisher Scientific. The complete list of genes and the corresponding probes mapping in each gene are shown in Supplementary Table 2. All reactions were performed in triplicate. Cq values produced by this platform are already corrected for the efficiency of the amplification (Hernandez-Santana et al., 2016).
The arithmetic average quantitative cycle (Cq) was used for data analysis. The Cq values for each qPCR run were exported from QuantStudio™ 12K Flex Real-Time PCR System, as Excel files, and imported into GenEx software (v.6, MultiD). The expression stability of the candidate reference genes (RGs) was evaluated using RefFinder (Xie et al., 2012) (heartcure.com.au), which integrates the algorithms GeNorm (Vandesompele et al., 2002), NormFinder (Andersen et al., 2004), and BestKeeper (Pfaffl et al., 2004), as well as the comparative ΔCt method (Silver et al., 2006). Three genes showed the most stable expression (STAT3, IL10RA, and IFNAR) (all with GeNorm M-value < 0.5) and were used for normalization to obtain normalized relative quantities (NRQ).
The GraphPad Prism statistical package version 8 (GraphPad Software Inc., San Diego, CA, USA) and SPSS software (SPSS Inc., Chicago, IL, USA) were used to perform statistical analyses. Kolmogorov–Smirnov and Shapiro–Wilk tests (α=0.05) were used to check data normality, and statistical significance was determined by a two-tailed Mann–Whitney test or a two-tailed unpaired t-test, as appropriate, considering p < 0.05 as statistically significant.
Differentially expressed genes between healthy donors from endemic (HDe) and non-endemic areas (HDc) of Chagas disease, as well as between chronic Chagas disease patients with indeterminate form (IND) and healthy donors (HD), were identified using two parameters: the fold change of gene expression (FC) and the statistical significance (p-value). FC was calculated as the ratio between biological groups (HDc and HDe, IND and HD, or individual samples from IND patients and HD) and expressed as log2. To display changes, volcano plots were made by plotting the –log10 p-value (determined by a two-tailed unpaired t-test) on the y-axis, and log2 of FC on the x-axis. Genes passing both biological significance threshold (log2 of FC > 1 or < −1, corresponding to FC > 2 or < 0.5) and statistical significance threshold (–log10 p > 1.3, corresponding to p = 0.05 and (–log10 p > 3, corresponding to p = 0.001) were marked in red and blue, attending to their upregulation and downregulation, respectively. Those genes were considered biologically relevant and used for further biological interpretation. An interaction network between differentially expressed genes in IND versus HD was generated using the Retrieval of Interacting Genes Database (STRING) v.11 (Szklarczyk et al., 2019) available at https://string-db.org/. Active interactions sources, including experiments, databases, co-occurrence, gene fusion, neighborhood, and co-expression as well as species limited to “Homo sapiens,” and an interaction score > 0.9 were applied to construct PPI networks.
Principal component analysis (PCA) was applied for multivariate analysis on NRQ values to determine the structure of the dataset. Differences in scores of plotted principal components between the groups were confirmed by a two-tailed Mann–Whitney test or a two-tailed unpaired t-test, depending on data that had not or had a normal distribution, respectively, using SPSS 25 (SPSS Inc., Chicago, IL, USA).
To further investigate on the potential biological processes and pathways involved in chronic Chagas disease indeterminate form (IND), gene set enrichment analysis was performed using the GSEA 4.1.0 computational method (Mootha et al., 2003; Subramanian et al., 2005). Canonical pathway gene sets derived from the BioCarta pathway database included in C2: curated gene sets collection in Molecular Signatures Database (MSigDB) were used for the analysis (Subramanian et al., 2005; Liberzon et al., 2011) [parameters set for GSEA were as follows: permutations = 100,000, permutation type: phenotype (sample n > 7), enrichment statistic: weighted, metric for ranking genes: t-test, max size: 500, min size: 3].
To improve the knowledge of the specific immune response generated during infection in Chagas disease patients, the gene expression pattern of particular genes involved in the immune response elicited after T. cruzi infection has been analyzed in these patients. Thus, expressions of 106 immune system-related genes in response to T. cruzi proteins have been determined in human PBMCs from Chagas disease patients at the indeterminate phase of the disease (n = 39) together to those from healthy donors from endemic (n = 10) and non-endemic (n = 20) areas of Chagas disease. Total RNA isolated from T. cruzi soluble antigen-stimulated PBMCs from IND and HD subjects was used for cDNA synthesis followed by high-throughput RT-qPCR of triplicates, to obtain an arithmetic average quantitative cycle (Cq) useful for comparative analyses between patients and healthy donors. The expression stability of all the included genes was also evaluated. Since the STAT3, IL10RA, and IFNAR genes showed the most stable expression values (with GeNorm M-values < 0.5), they were used as reference genes (RGs) for normalization of the data set to obtain normalized relative quantities (NRQ).
To determine whether there were differences in gene expression level among the healthy donors (HD) related to their origin, the NRQ values obtained for the 106 analyzed genes in subjects from endemic (HDe) and non-endemic areas (HDc) of Chagas disease were analyzed and compared employing GenEx software. As observed in the heatmap plot shown in Supplementary Figure 1, no differences were observed in the gene expression values between subjects from endemic and non-endemic countries since the different clusters generated by the software included HDe and HDc subjects indistinctly.
The NRQ values from 106 genes of HDe and HDc subjects were also employed to determine the structure of the dataset by principal component analysis (PCA). The obtained results plotted in Figure 1A indicated that principal component 1 (PC1) and principal component 2 (PC2) accounted for 22% and 13.7% of the variance among the individuals, respectively. As observed, HDe and HDc did not exhibit differences on gene expression values of the genes under study (Figure 1A) as they presented a very similar distribution and were not separated by the principal components. These results were confirmed by a two-tailed Mann–Whitney test or a two-tailed unpaired t-test, as appropriate, showing that there were no statistically significant differences between the scores obtained in the two groups for each component (PC1 p = 0.65, PC2 p = 0.23).
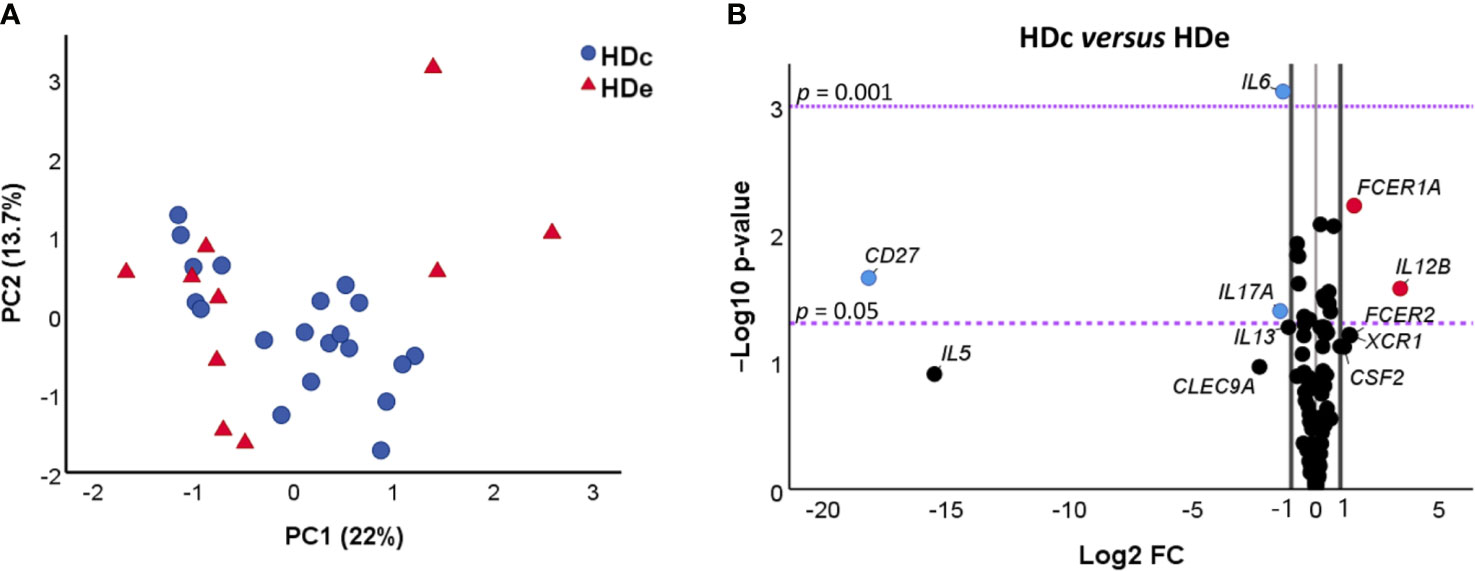
Figure 1 Comparative analysis of gene expression of 106 genes in healthy donors from non-endemic (HDc, n = 20) and endemic (HDe, n = 10) areas of Chagas disease. (A) Principal component analysis (PCA) of NRQ (normalized relative quantities) values of gene expression of 106 analyzed genes in HDc (blue circles) and HDe (red triangles). Principal components 1 (PC1) and 2 (PC2) are plotted on the x and y axes, respectively, and the proportion of variance captured for both components is given as a percentage. (B) Volcano plot of the differential expression level of the 106 analyzed genes between samples of HDc and HDe subjects. The x-axis represents log2 of the expression fold change between HDc and HDe (Log2 FC), where FC is calculated as the ratio between two groups (HDc/HDe). The y-axis corresponds to the statistical significance, expressed as the negative logarithm of the p-value (-Log10 p-value). The purple horizontal lines indicate the cutoffs for the statistical significance values p = 0.05 and p = 0.001. The black vertical lines represent the log2 of FC of −1 and 1 (corresponding to FC of 0.5 and 2, respectively) which were used as biological thresholds to identify differentially expressed genes. The negative values correspond to downregulated genes (blue dots) and the positive values to the upregulated genes (red dots). Black dots comprising between the established thresholds represent non-differentially expressed genes between HDc and HDe.
A third differential gene expression analysis based on the fold change of gene expression (FC) and its statistical significance was further carried out to elucidate whether there were any differences in the gene expression level of particular genes between the healthy donors coming from endemic areas and those from non-endemic regions. The obtained results, represented in a volcano plot (Figure 1B) to illustrate both significance and magnitude of the changes, showed that 5 out of the 106 studied genes were differentially expressed in the HDe versus HDc group (log2 fold change (FC) > 1 or < -1) with statistical significance (p < 0.05). Two genes (FCER1A and IL12B) were found to be upregulated in HDc when compared with the HDe subjects (log2 FC > 1, corresponding with a greater than two-fold change). On the contrary, three genes (CD27, IL6, and IL17A) were downregulated in HDc versus HDe subjects (log2 FC < -1, corresponding with a less than half fold change).
Altogether, these results indicate that there were no significant differences in the expression level of 95.3% of the genes under study between healthy donors coming from endemic areas and those living in non-endemic regions, suggesting that they could be considered as a single group of healthy donors (HD). Despite that, the five genes differentially expressed in HDc and HDe were also analyzed considering HDe and HDc as independent groups of subjects.
Next, we compared the expression levels of the 106 genes in IND and HD patients. As a first approach, gene set enrichment analysis (GSEA) was performed using the GSEA 4.1.0 computational method (Mootha et al., 2003; Subramanian et al., 2005) using the NRQ of genes from IND and HD. Figure 2 shows a heat map from the top 100 genes in IND and HD groups and it reveals a clear difference in the pattern of gene expression between the groups. Thus, more than half of the genes (at least 49 of the genes) were overexpressed in most IND patients (Figure 2). Furthermore, the expression level of 11 genes was significantly reduced in the majority of IND patients and other 11 genes showed to be downregulated in many IND patients (Figure 2). Specifically, the expression levels of the IL18, CD86, and FCER1A genes were extremely decreased in practically all IND patients compared to healthy people. The expression of the CLEC9A and CCR5 genes was not detected in almost any individual included in the study.
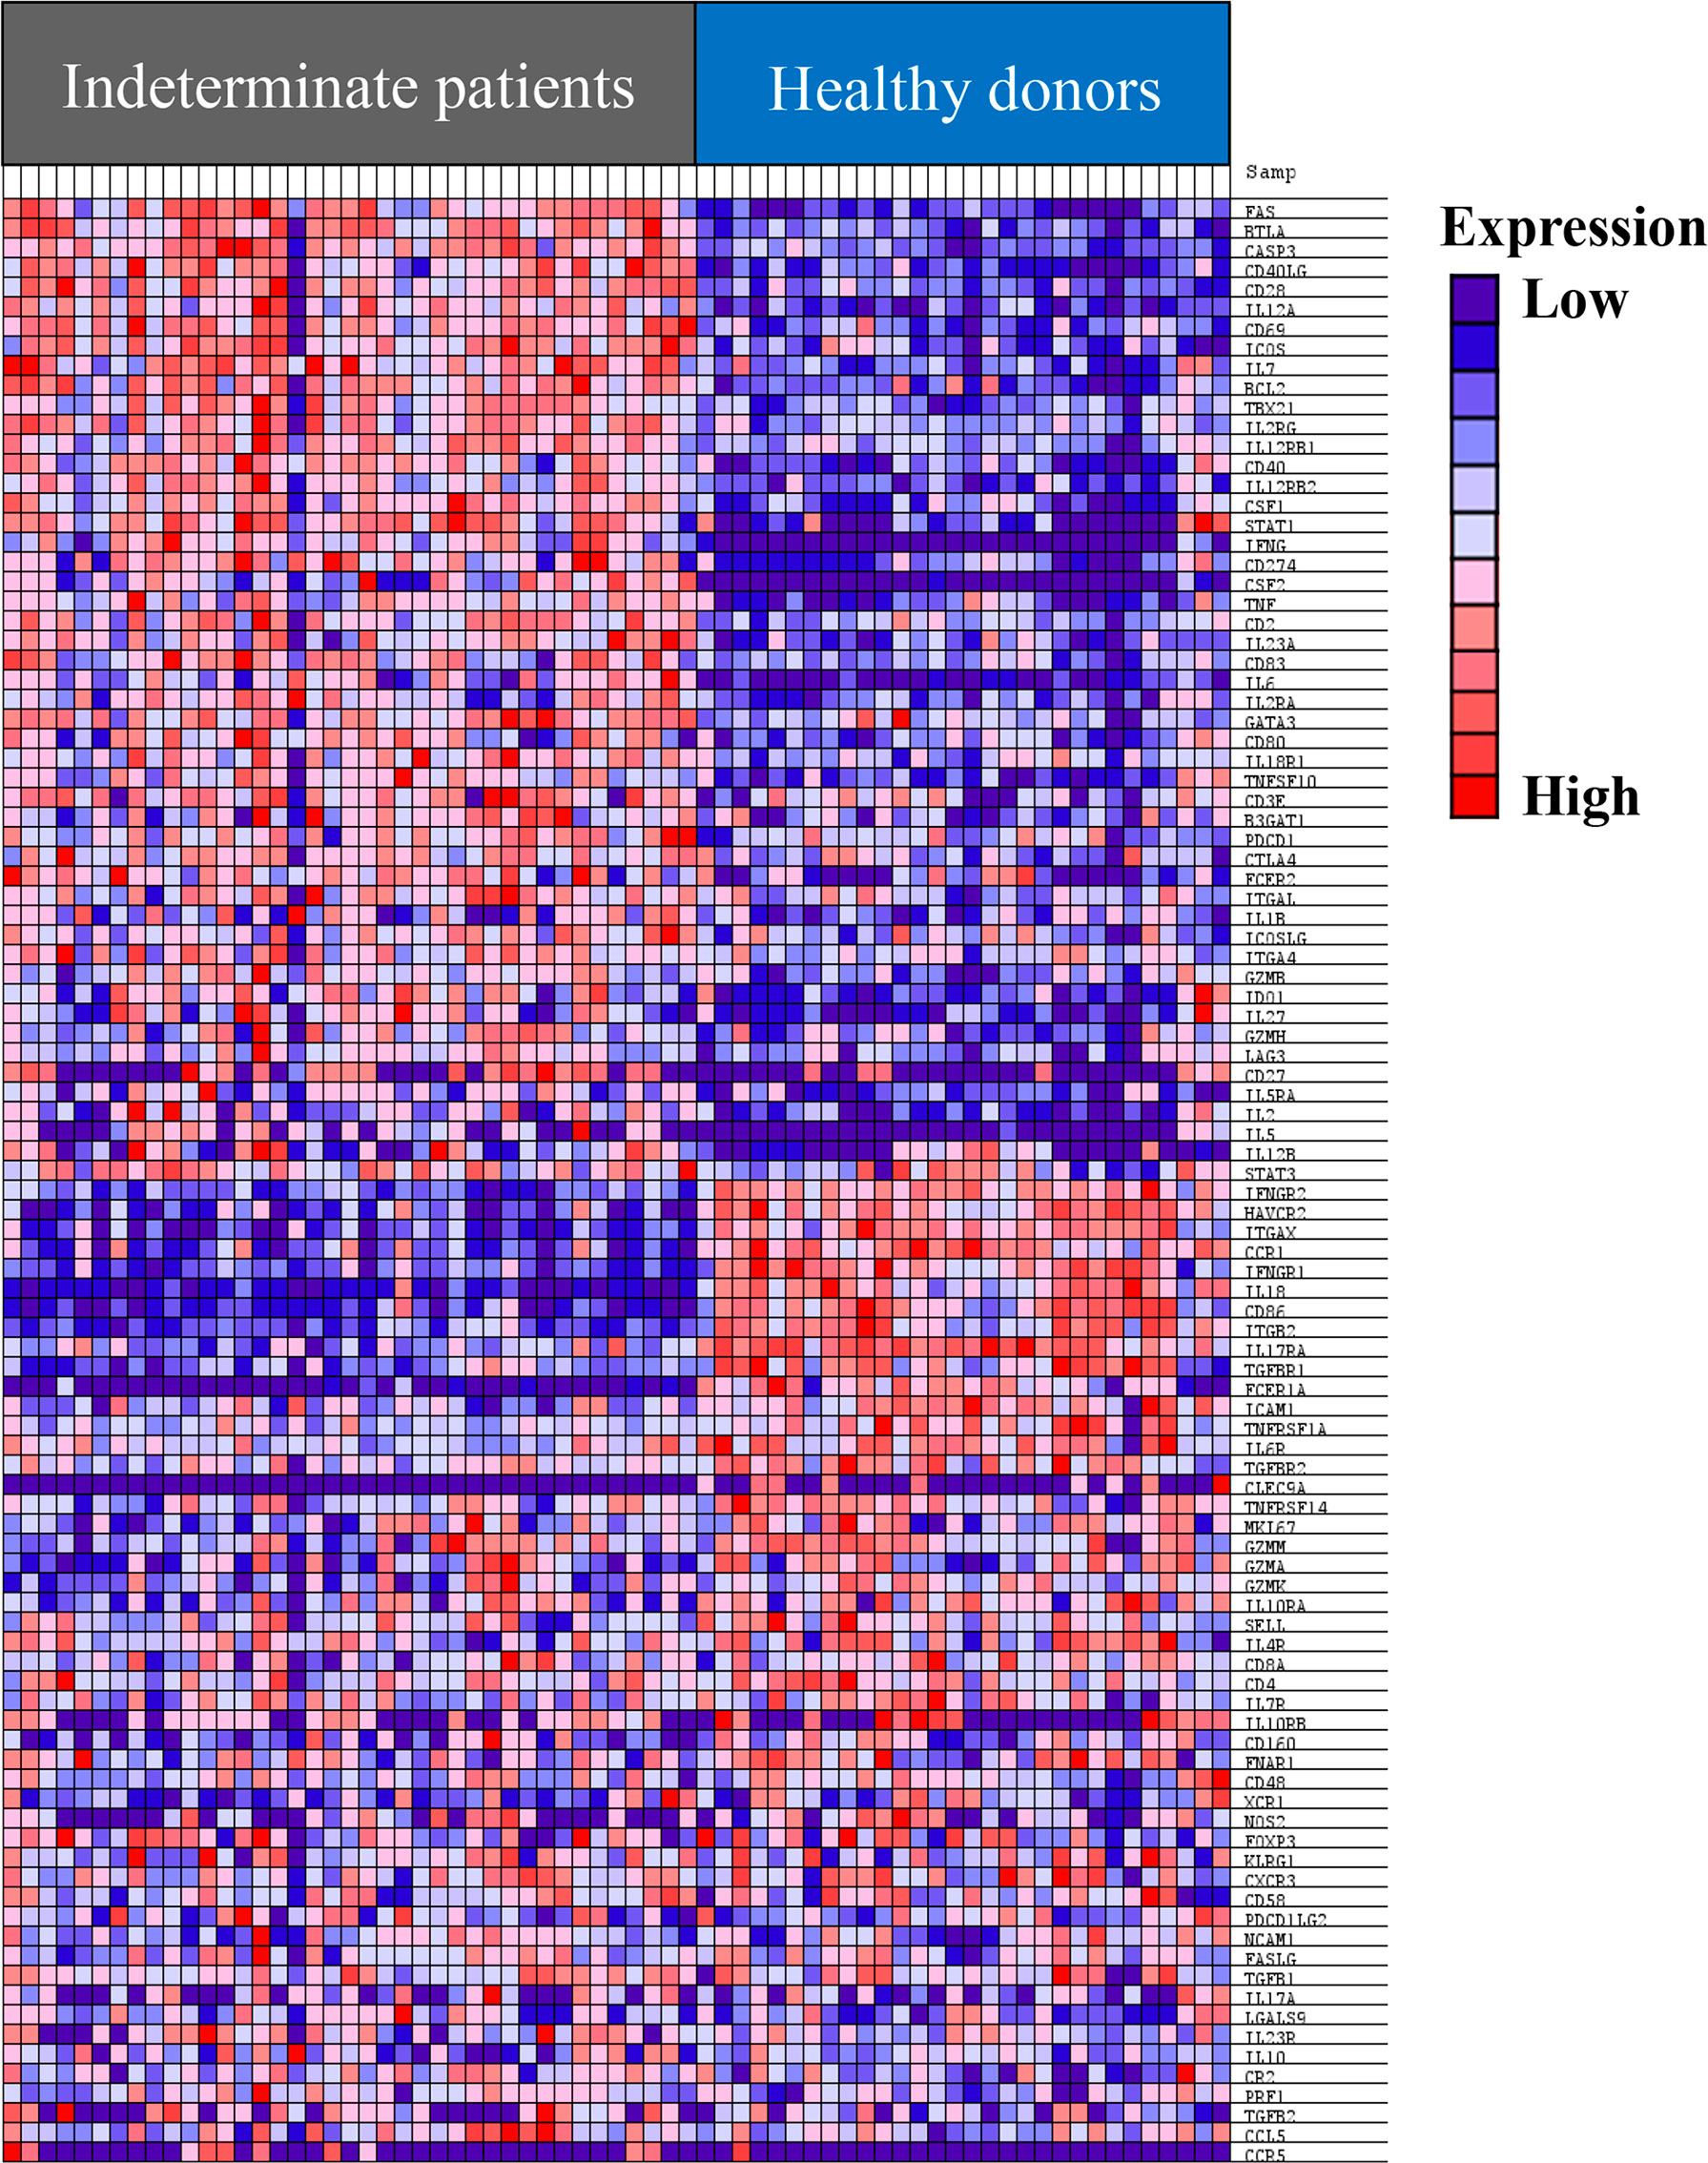
Figure 2 Heat map of the top 100 genes determined by GSEA analysis in IND and HD subjects. The values of the gene expression level of each gene are represented as colors, ranging from dark red to dark blue, based on the highest and lowest normalized relative quantities (NRQ) values of each gene, respectively. The genes represented in vertical order from the top to the bottom are FAS, BTLA, CASP3, CD40LG, CD28, IL12A, CD69, ICOS, IL7, BCL2, TBX21, IL2RG, IL12RB1, CD40, IL12RB2, CSF1, STAT1, IFNG, CD274, CSF2, TNF, CD2, IL23A, CD83, IL6, IL2RA, GATA3, CD80, IL18R1, TNFSF10, CD3E, B3GAT1, PDCD1, CTLA4, FCER2, ITGAL, IL1B, ICOSLG, ITGA4, GZMB, IDO1, IL27, GZMH, LAG3, CD27, IL5RA, IL2, IL5, IL12B, STAT3, IFNGR2, HAVCR2, ITGAX, CCR1, IFNGR1, IL18, CD86, ITGB2, IL17RA, TGFBR1, FCER1A, ICAM1, TNFRSF1A, IL6R, TGFBR2, CLEC9A, TNFRSF14, MKI67, GZMM, GZMA, GZMK, IL10RA, SELL, IL4R, CD8A, CD4, IL7R, IL10RB, CD160, FNAR1, CD48, XCR1, NOS2, FOXP3, KLRG1, CXCR3, CD58, PDCD1LG2, NCAM1, FASLG, TGFB1, IL17A, LGALS9, IL23R, IL10, CR2, PRF1, TGFB2, CCL5, and CCR5.
To determine the structure of the data set and examine the variation between the IND and HD subjects, the principal component analysis (PCA) was then performed following the multivariate analysis of the NRQ values. As shown in Figure 3A, principal component 1 (PC1) and principal component 2 (PC2) accumulate the largest percentage of the total variance reaching 25.3% and 13.3%, respectively. In addition, principal component 3 (PC3) explains 7.8% of variance, plotted with PC1 in Figure 3B. These results together with the 3D graphical representation shown in Figure 3C indicate that the level of expression of the genes under study are clearly different between IND and HD subjects which are located on separate groups, mainly based on PC1. The observed differences in PC1 scores between both groups of individuals were confirmed by a two-tailed unpaired t-test which highlighted the existence of a statistically significant different expression profile in IND versus HD (p < 0.0001). In turn, a two-tail unpaired t-test was applied to the scores obtained for PC2 and PC3, confirming that principal components 2 and 3 did not importantly participate in the differences observed between the two groups of subjects (PC2 p = 0.134, PC3 p = 0.061).
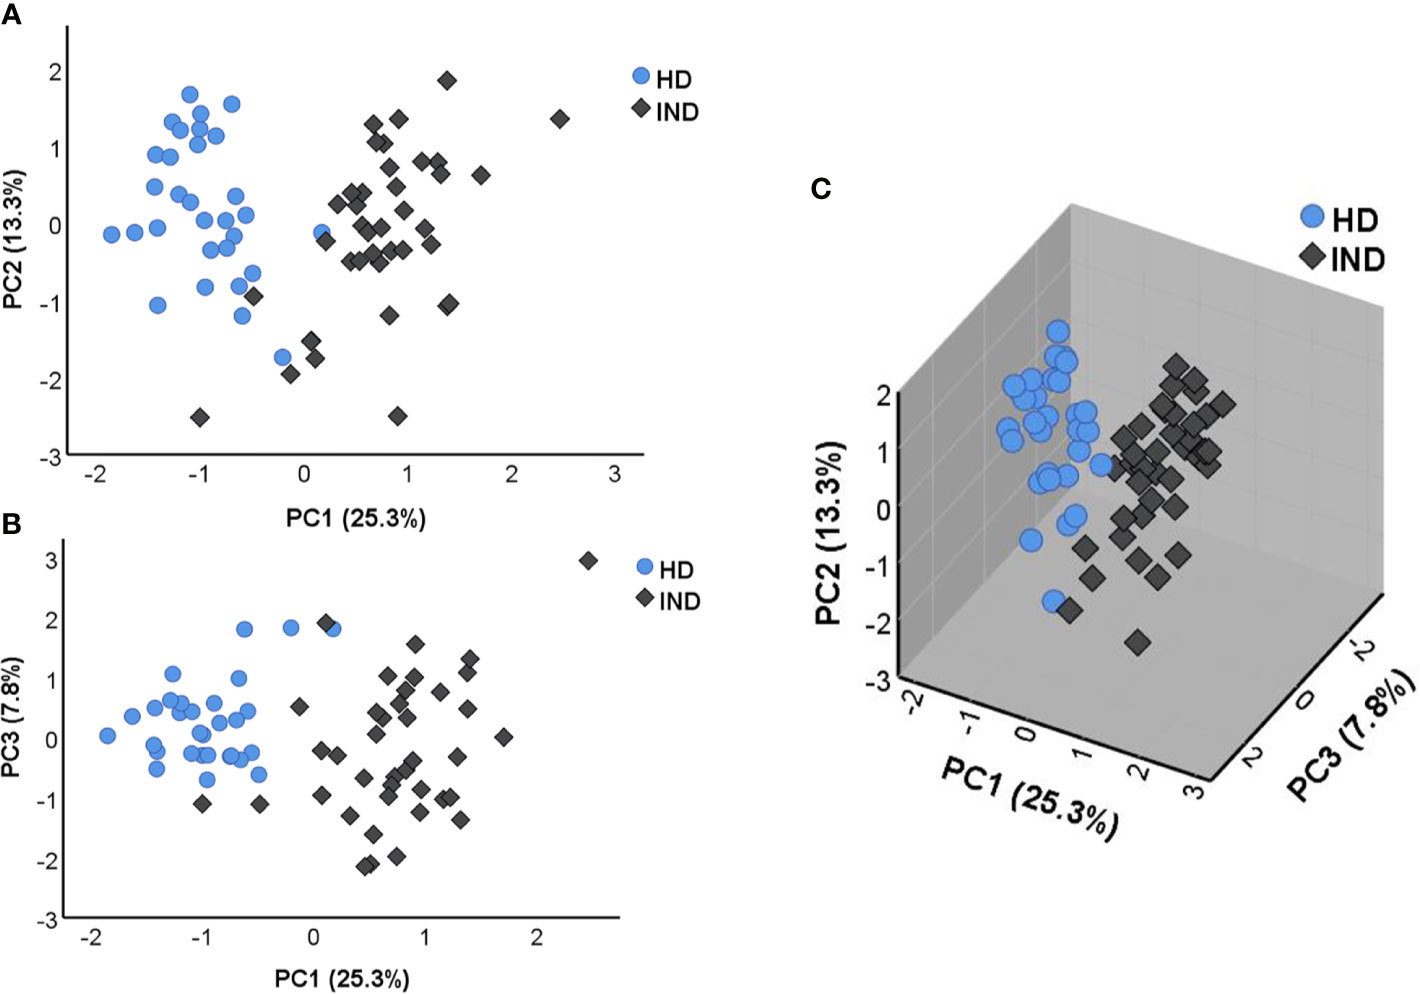
Figure 3 Principal component analysis (PCA) applied on NRQ values of 106 analyzed genes from IND patients (IND, dark rhombus) and healthy donors (HD, blue circles). (A) PCA score plot of principal components 1 (PC1) and 2 (PC2) on the x and y axes, respectively. (B) PCA score plot of principal components 1 (PC1) and 3 (PC3) on the x and y axes, respectively. (C) 3D graphic representing the three principal components 1, 2, and 3 (PC1, PC2, and PC3). The proportion of variance captured for principal components is given as a percentage and indicated on the axis next to the corresponding principal component.
As shown in Table 2, PC1 depends on the expression of 32 genes with the highest factor loadings. Specifically, 23 genes showed a positive correlation with PC1: FAS, IL12RB1, BTLA, TBX21, BCL2, CD40LG, IL2RG, IL12A, CD2, IL12RB2, CD69, CASP3, IL7, STAT1, CSF1, ICOS, CD28, CD40, TNF, IL18R1, GATA3, IFNG, and CD83), whereas nine genes showed a negative correlation with PC1: ITGB2, CCR1, IL18, HAVCR2, CD86, IFNGR1, IL17RA, IFNGR2, and ITGAX.
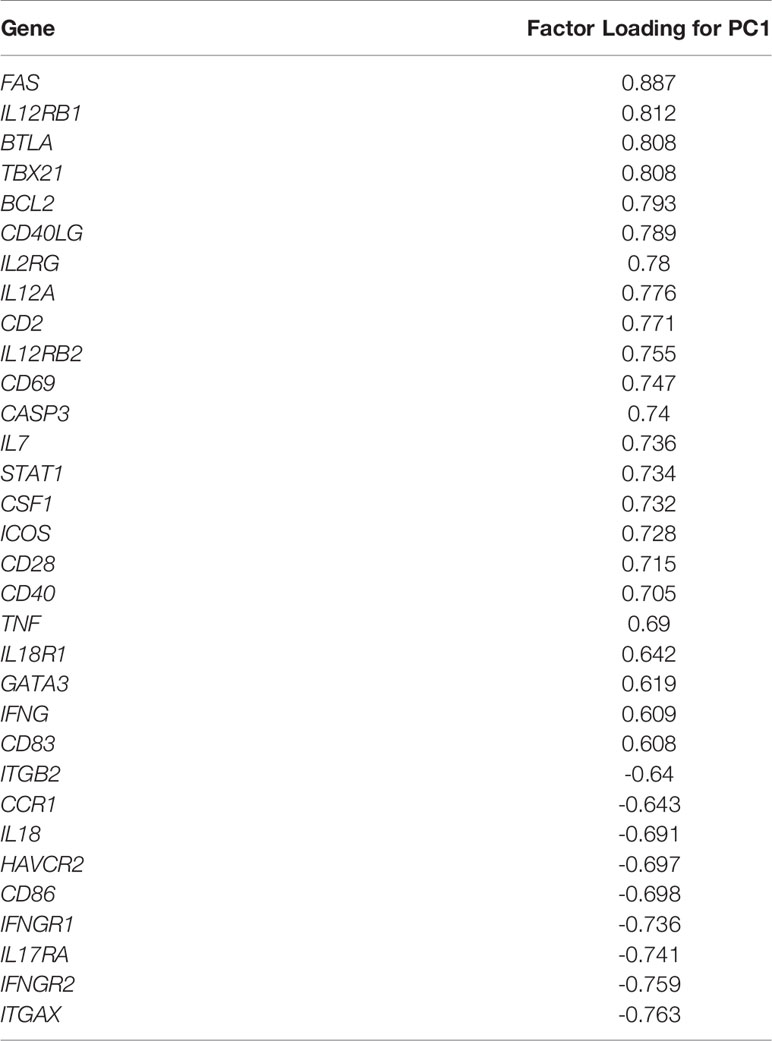
Table 2 Genes with factor loading of principal component 1 (PC1) higher than 0.6 or lower than -0.6 obtained in the principal component analysis (PCA) including IND and HD subjects.
In spite of the levels of expression of the genes under study being clearly different between the IND and HD groups of subjects, the no influence of pooling samples of some IND patients was analyzed. For this purpose, PCA analyses were also carried out considering samples from IND patients which came from independent subjects from those which had been mixed as two independent groups. The results, shown in Supplementary Figure 2A, revealed that all IND samples maintained the same distribution independently if they came from individual patients (38.5% of the samples) if they had been mixed. The existence of no differences in the gene expression level between the IND patients was also supported by statistical analysis applied to the scores obtained in the two groups for each principal component (Supplementary Figure 2). As expected, when these data were compared to those from HD (Supplementary Figure 2B), the level of expression of the genes under study showed to be clearly different between IND and HD, as it was previously observed in Figure 3. The differential gene expression level in IND versus HD of the genes under study was quantified using the fold change of gene expression (FC) as described in Material and Methods and FC data and statistical significance represented in a volcano plot. The comparative analysis shown in Figure 4 indicated that 34 out of 106 genes under study were differentially expressed in IND and HD subjects with statistical significance (-log10 p-value > 1.3, equivalent to p-value < 0.05). Twenty-three of these genes (BCL2, BTLA, CD27, CD274, CD40, CD40LG, CSF1, CSF2, FAS, IDO1, IFNG, IL12A, IL12B, IL12RB2, IL2, IL27, IL5, IL5RA, IL6, IL7, STAT1, TBX21, and TNF) were significantly upregulated in IND versus HD subjects, exhibiting an expression greater than a two-fold change (log2 FC > 1, red dots). These differences were statistically significant for all genes, with p < 0.001 for 22 out of 23 genes and p < 0.05 for the IL12B gene. On the contrary, 11 genes (CCR1, CD86, CLEC9A, FCER1A, HAVCR2, IFNGR1, IFNGR2, IL18, ITGAX, ITGB2, XCR1) showed to be significantly downregulated in IND patients when compared to HD [log2 FC < -1, corresponding with less than a half-fold change (blue dots)] with statistical significance in all cases (p < 0.05 for CLEC9A and XCR1 genes and p < 0.001 for the other nine genes listed in Figure 4).
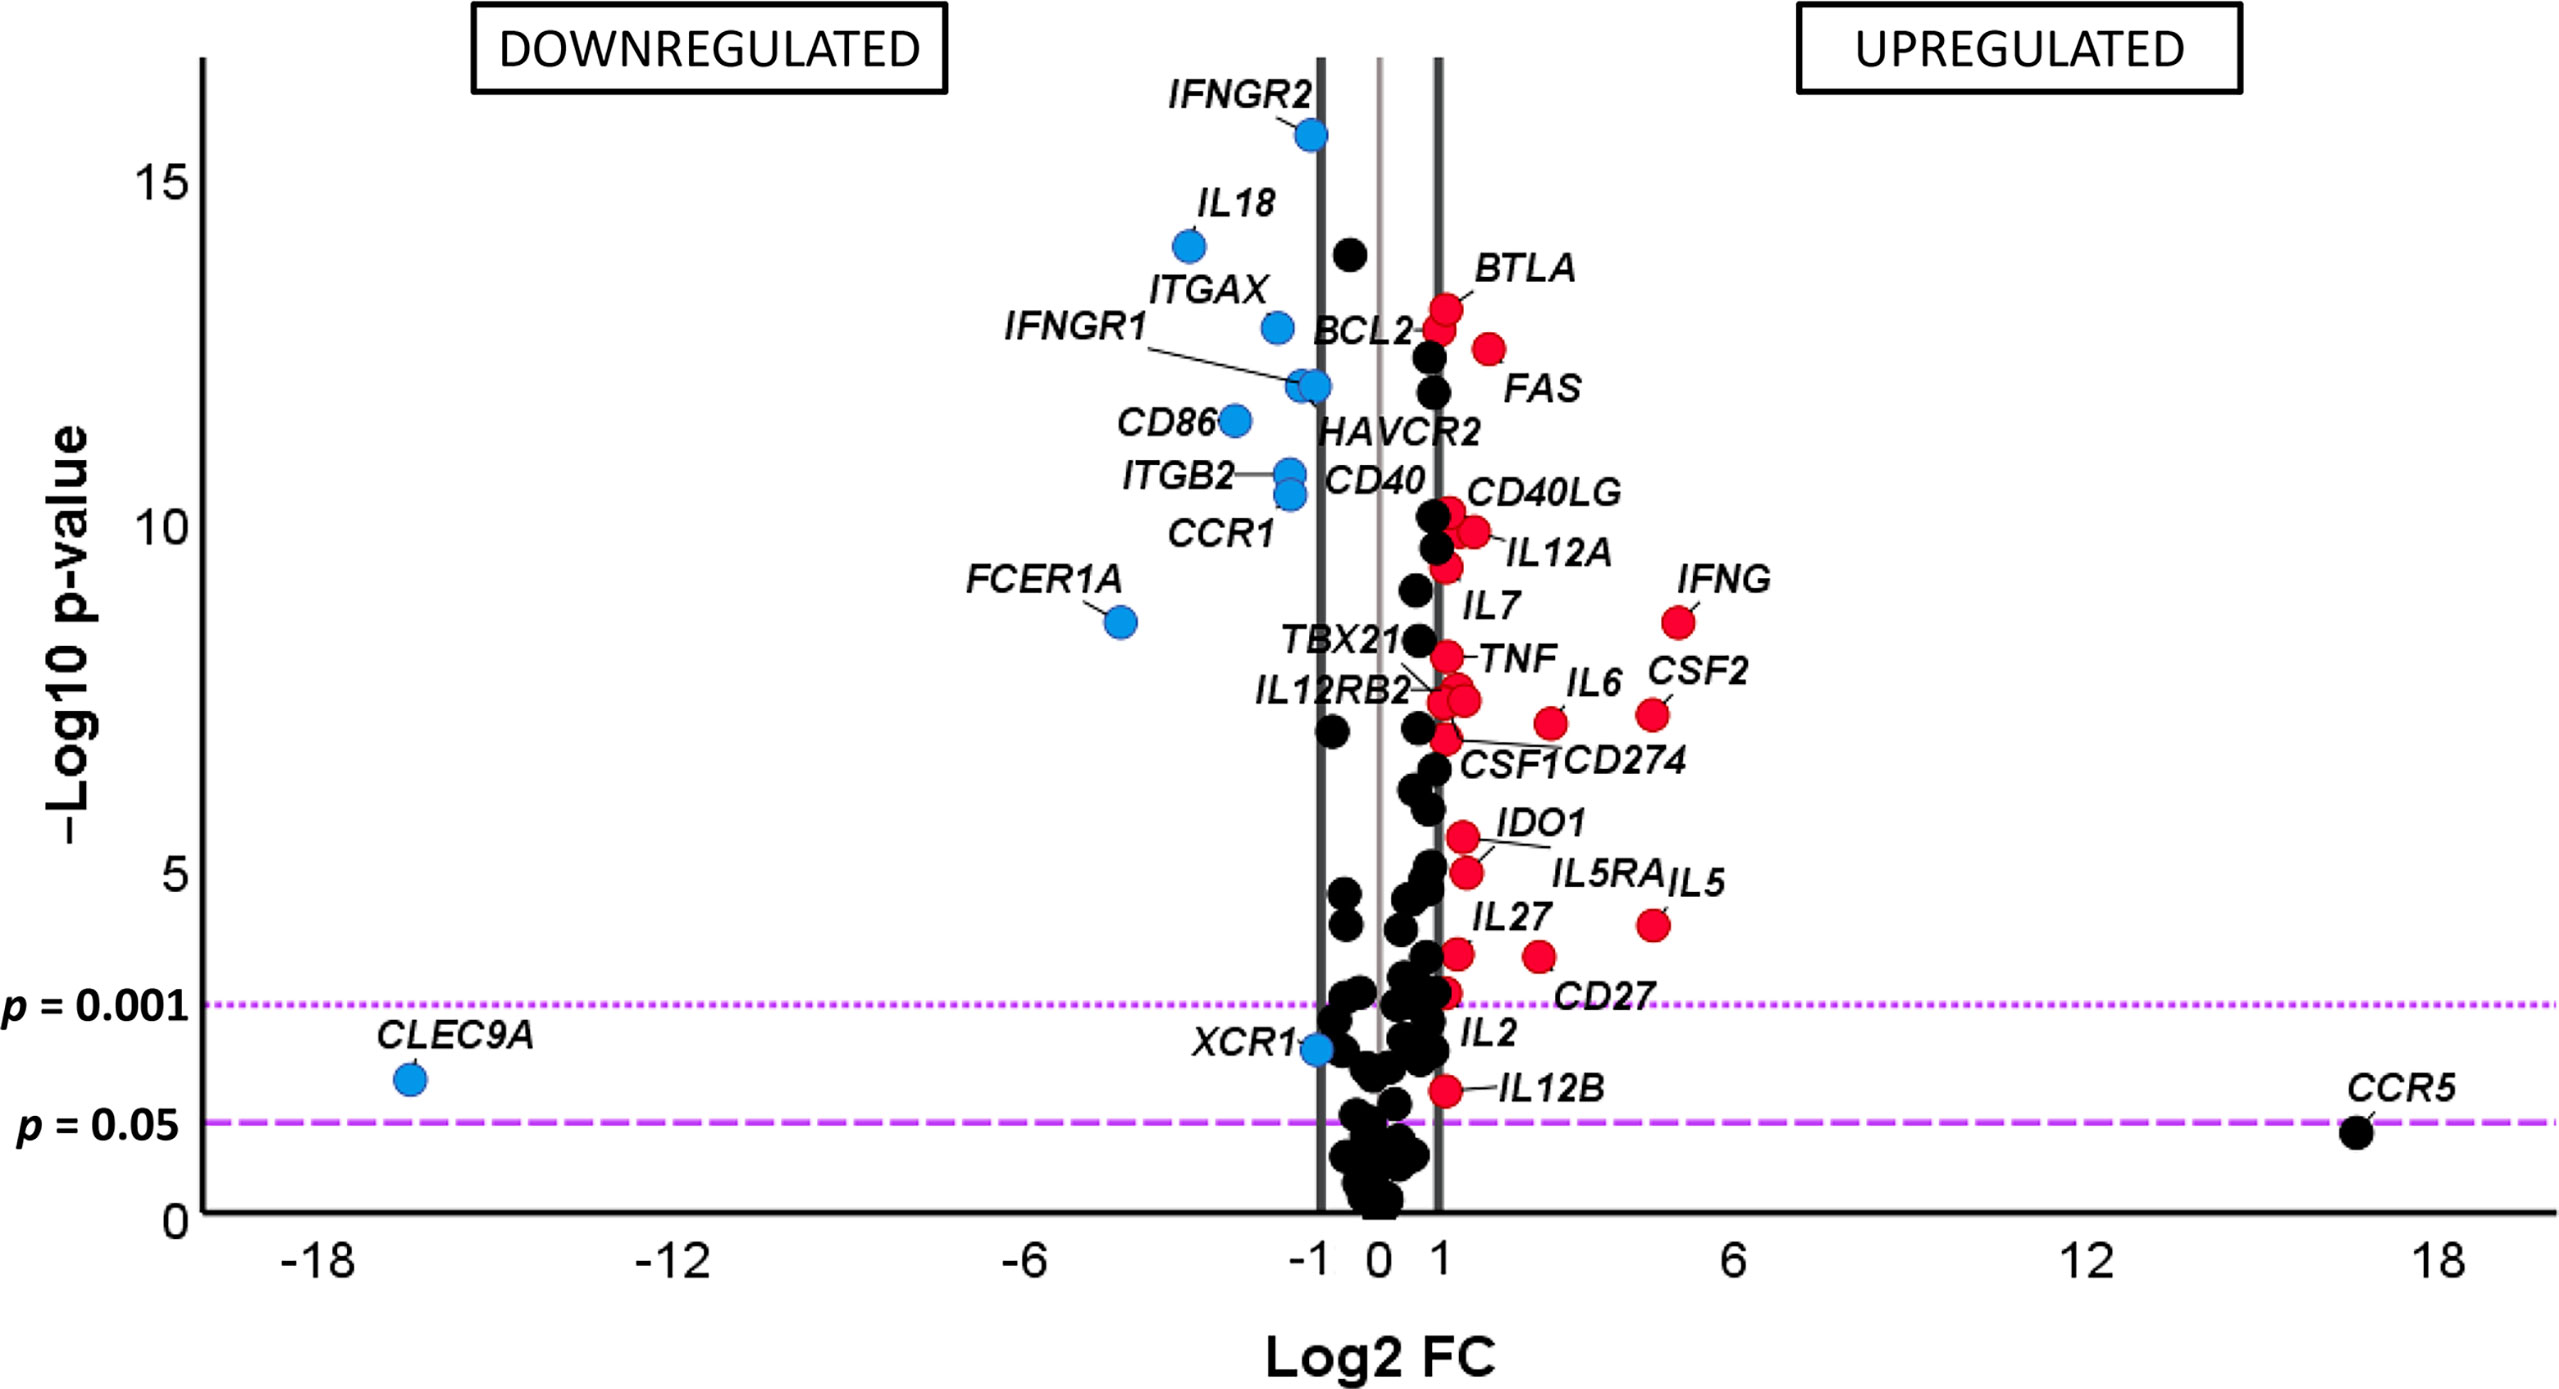
Figure 4 (Comparative) analysis of the differential gene expression level of the 106 analyzed genes in chronic Chagas disease patients with the indeterminate form of the disease (IND) (n = 39) and healthy donors (HD) (n = 30). The x-axis represents log2 of the expression fold change between IND and HD (Log2 FC), where FC is calculated as the ratio between two groups (IND/HD). The y-axis corresponds to the statistical significance, expressed as the negative logarithm of the p-value (-Log10 p-value). The purple horizontal lines indicate the cutoffs for the statistical significance (corresponding to p = 0.05 and p = 0.001). The black vertical lines represent the log2 FC of −1 and 1 (corresponding to FC of 0.5 and 2, respectively) used as biological thresholds established to identify differentially expressed genes. The negative values correspond to downregulated genes (blue dots) and the positive values to the upregulated genes (red dots) in IND patients compared to HD. Black dots represent non-differentially expressed genes.
Quantification of the differences observed in the gene expression of the 34 differentially expressed genes in IND versus HD was further analyzed considering the log2 of fold change values. As shown in the bar plot representation shown in Supplementary Figure 3, 34 genes were upregulated at least twice (red bar) or downregulated by half (blue bar) in IND versus HD. The CD27, CSF2, IFNG, IL5, and IL6 genes showed the highest differential expression levels as they were overexpressed more than four times (FC > 4) in IND versus HD (log2 FC values > 2). In addition, the FAS and IL12A genes showed to be at least three times (FC > 3) upregulated in IND than in HD (log2 FC values > 1.5). On the other hand, the expression levels of the CCR1, ITGAX, and ITGB2 genes were approximately one-third lower (log2 FC values < -1.5, corresponding to FC < 0.35, which means -1/FC = -2.86) in IND compared to HD and the expressions of the CD86, CLEC9A, FCER1A, and IL18 genes were one-fourth decreased (log2 FC < -2, assuming an FC lower than 0.25) in IND patients when compared to the healthy subjects (Supplementary Figure 3).
Since statistically significant differences in the expression level of five genes (FCER1A, IL12B, IL6, IL17A, and CD27) were detected between HDc and HDe subjects, we were interested in analyzing in detail how the expression level of these genes in IND patients was and in determining if there was any relationship with that observed in healthy subjects. Thus, comparative analyses of the gene expression levels were carried out for each particular gene among IND, HDc, and HDe subjects. As observed in Figure 5, the results showed statistically significant differences in the expression level of these genes among the groups of subjects. Thus, the high expression level of the FCER1A gene detected in the HDc subjects (mean NRQ = 13.3) was reduced in the HDe group (NRQ= 4.5) with p < 0.01 and particularly diminished in IND patients (NRQ = 0.5) with p < 0.0001 when compared to any of the HDc and HDe subjects. The expression of IL12B was upregulated in HDc (NRQ = 0.8) versus HDe (NRQ = 0.1) with p < 0.05 and overexpressed in IND (NRQ = 1.2) with statistical significance when compared to HDe healthy individuals (p < 0.0001). Important statistically significant differences (p < 0.0001) were also seen in the expression level of the IL6 gene which was overexpressed in IND patients (NRQ = 1.3) when compared to HDc (NRQ = 0.1) and HDe (NRQ = 0.3). Differences in the expression level of the IL17A gene between IND (NRQ = 0.5) and HDc (NRQ = 0.4) or between IND and HDe (NRQ = 1.1) had no statistical significance. Since no expression of the CD27 gene was detected in HDc, the CD27 level of expression in HDe (NRQ = 0.3) and particularly its overexpression in IND patients (NRQ = 0.7) led to the difference in the level of expression in IND with respect to the HDc that had statistical significance (p < 0.001) (Figure 5). Altogether, these results suggest that only differences in the gene expression level of the FCER1A and IL6 genes were detected in IND versus both HDc and HDe.
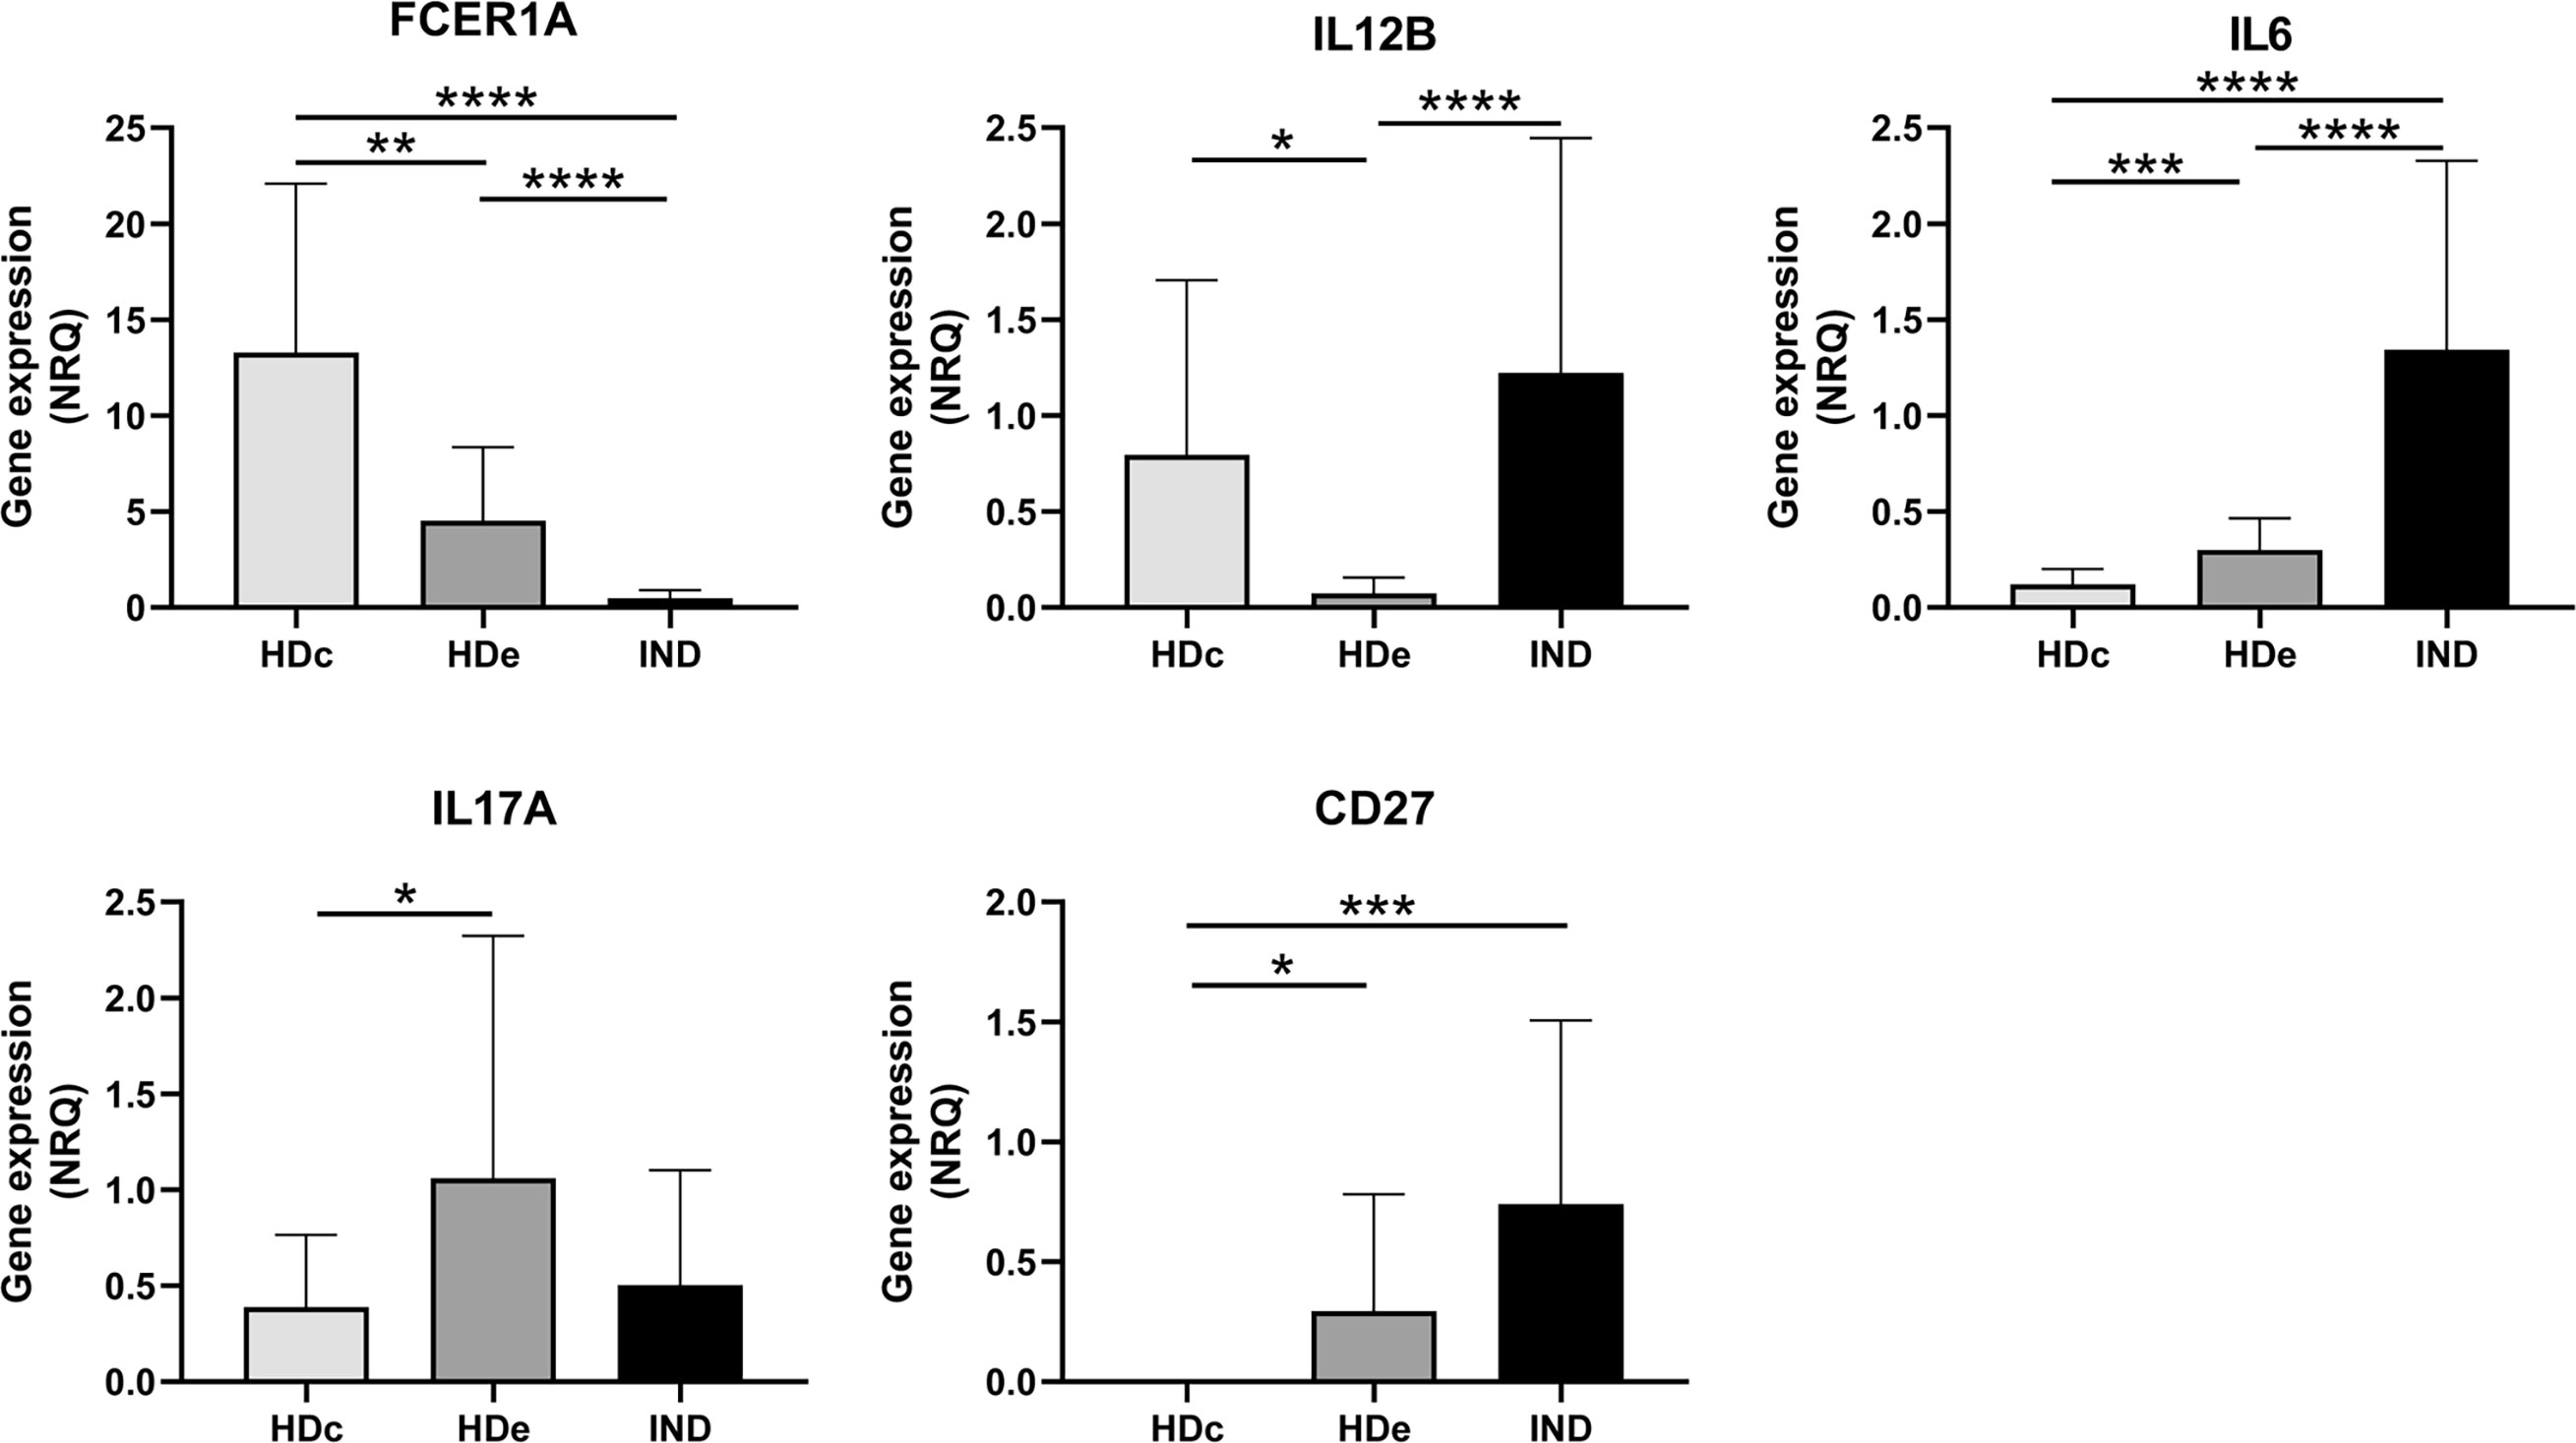
Figure 5 Comparative analysis of the expression levels of FCER1A, IL12B, IL6, IL17A, and CD27 genes measured as mean normalized relative quantities (NRQ) in patients with chronic Chagas disease with indeterminate form of the disease (IND) and healthy donors from endemic (HDe) and non-endemic (HDc) areas of Chagas disease. Statistically significant differences determined by the two-tailed Mann–Whitney test or two-tailed unpaired t-test, as appropriate, are indicated (*p < 0.05, **p < 0.01, ***p < 0.001, and ****p < 0.0001).
To search for immunological routes implicated in the T. cruzi chronic infection in Chagas disease patients, the known interactions that take place between the protein-coding genes that showed to be upregulated and downregulated in IND patients when compared to healthy donors were subsequently analyzed. The genes fulfilling both statistical and biological significance thresholds (p-value < 0.05 and log2 FC > 1 or > -1, respectively) were considered biologically relevant and were used for further biological interpretation. Consequently, a protein–protein interaction (PPI) network was constructed using the STRING platform, requiring the highest confidence in the predicted interactions. The obtained results, plotted in Supplementary Figure 4, showed that 34 proteins encoded by the set of differentially expressed genes in IND versus HD subjects had a high degree of interaction reaching up to 29 interactions (edges) (from the three expected edges), with a PPI enrichment p-value < 1.0e-16. Moreover, some of these proteins were grouped according to the most relevant biological pathways in which they are involved based on the pathways belonging to the KEGG and Reactome databases. As summarized in Table 3, the results of STRING showed that 6 of these proteins participate in Interleukin-2 family signaling (HSA-451927) with a false discovery rate (FDR) of 5.37e-09; 10 proteins in Th1 and Th2 cell differentiation (HSA-04658, FDR 1.3e-14); 6 proteins in Interleukin-12 family signaling (HSA-447115, FDR 2.2e-08); 14 proteins in Jak-STAT signaling pathway (HSA-04630, FDR 4.77e-19); 7 proteins in Th17 cell differentiation (HSA-04659, FDR 3.02e-09); and 7 proteins in natural killer cell-mediated cytotoxicity (HSA-04650, FDR 9.75e-09).
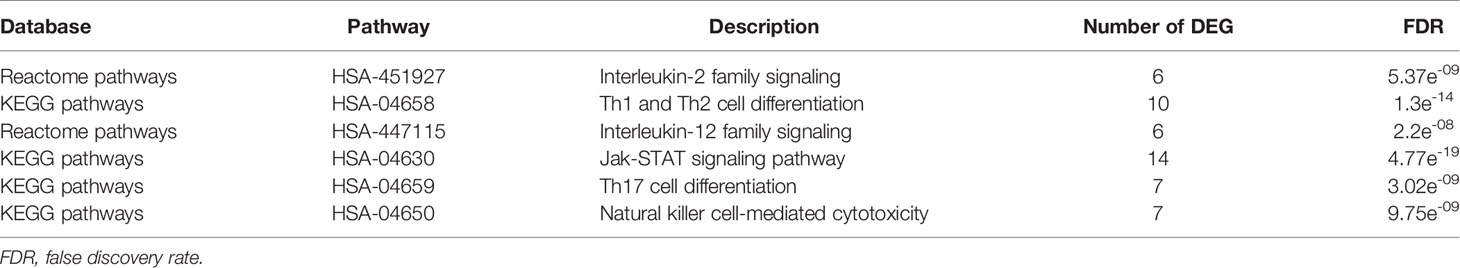
Table 3 Main biological pathways involved in the STRING protein network of differential expressed genes (DEG) between IND and HD subjects.
A graphical representation, shown in Figure 6, including the aforementioned pathways was obtained in STRING as subnetworks for subsequently highlighting the upregulated and downregulated protein-coding genes in IND patients. As shown in Figure 6A, the CSF2, HAVCR2, IL2, IL5, IL5RA, and STAT1 proteins were involved in the IL2 family signaling (Figure 6A, brown nodes); IFNG, IL12A, IL12B, IL12RB2, IL27, and STAT1 in the IL12 family signaling pathway (Figure 6A, green nodes); IFNG, IFNGR1, IFNGR2, IL12A, IL12B, IL12RB2, IL2, IL5, STAT1, and TBX21 in the Th1 and Th2 cell differentiation route (Figure 6B, blue nodes); BCL2, CSF2, IFNG, IFNGR1, IFNGR2, IL12A, IL12B, IL12RB2, IL2, IL5, IL5RA, IL6, IL7, and STAT1 proteins in the Jak-STAT signaling pathway network (Figure 6B, red nodes); IFNG, IFNGR1, IFNGR2, IL2, IL6, STAT1, and TBX21 in the Th17 cell differentiation pathway (Figure 6B, yellow nodes); and CSF2, FAS, IFNG, IFNGR1, IFNGR2, ITGB2 and TNF proteins included in natural killer cell-mediated cytotoxicity (Figure 6B, purple nodes). In all cases, the genes encoding the referred proteins were overexpressed in the IND versus HD subjects, with exception of the ITGB2, HAVCR2, IFNGR1, and IFNGR2 genes which were downregulated.
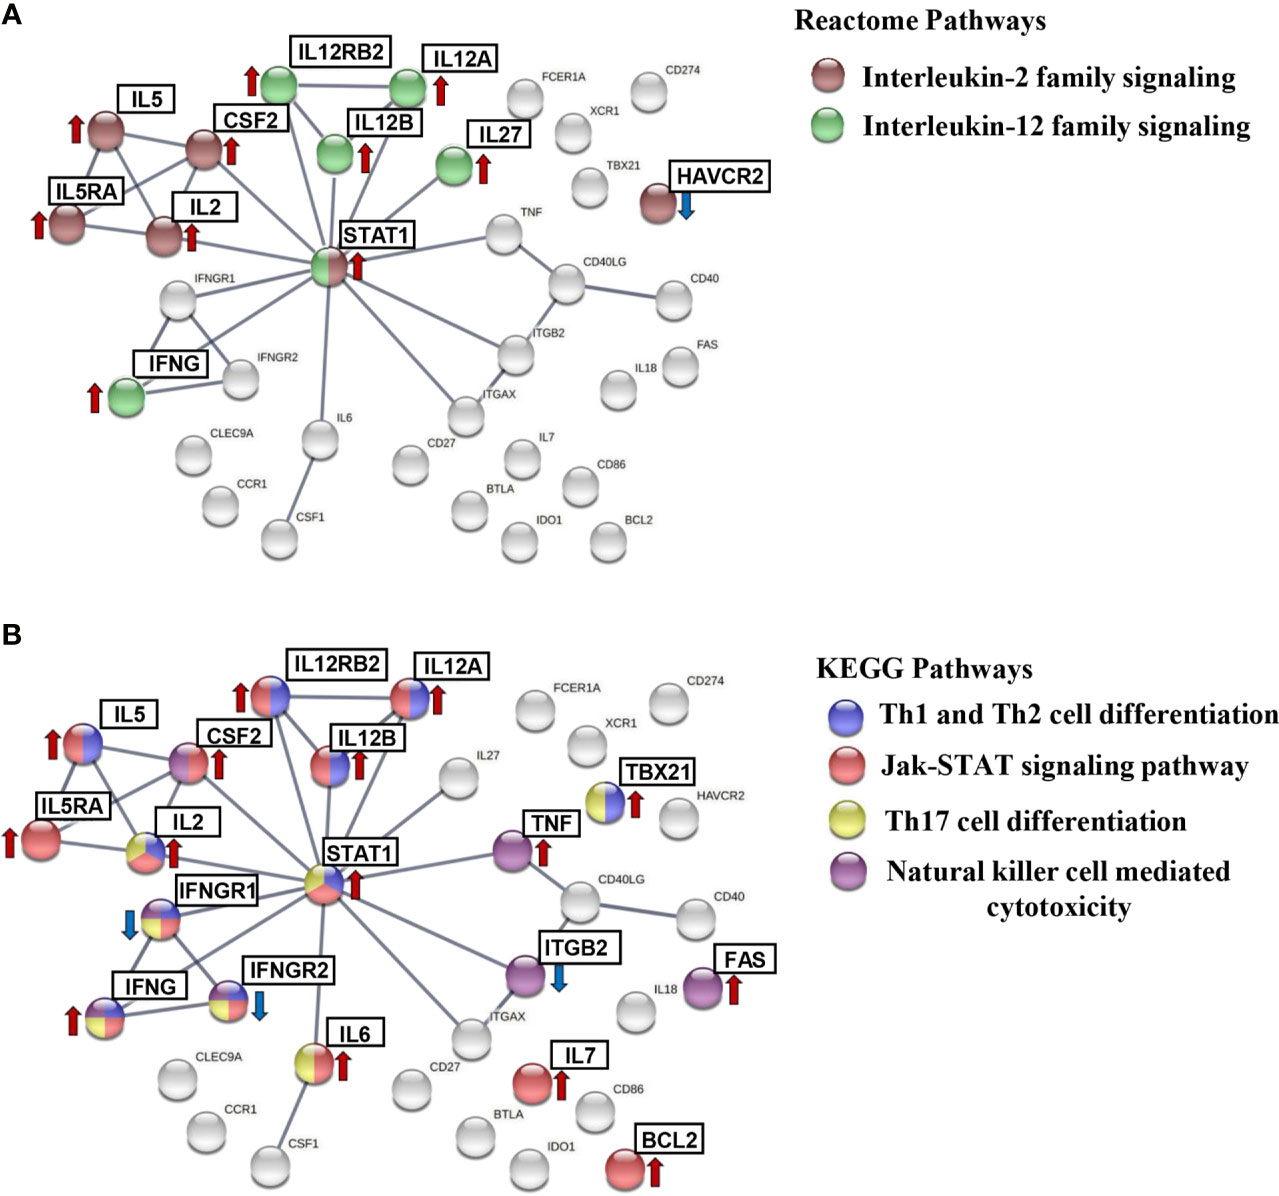
Figure 6 STRING protein–protein interaction (PPI) subnetworks. Representation of the proteins encoded by differentially expressed genes in IND and HD, which are described to be involved in specific pathways. PPI networks were constructed setting the confidence score threshold at the highest level (0.9) and active interaction sources, including data from published experiments, databases, co-occurrence, gene fusion, neighborhood, and co-expression, species limited to “Homo sapiens.” The colored nodes correspond to proteins involved in each biological pathway: (A) interleukin-2 family signaling (HSA-451927) (brown) and interleukin-12 family signaling (HSA-447115) (green) from the Reactome Pathways Database and (B) Th1 and Th2 cell differentiation (HSA-04658) (blue), Jak-STAT signaling pathway (HSA-04630) (red), Th17 cell differentiation (HSA-04659) (yellow), and natural killer cell-mediated cytotoxicity (HSA-04650) (purple) from the KEGG Pathways Database. The arrows indicate whether the genes encoding these proteins were found to be upregulated (red) or downregulated (blue) in the IND versus HD group.
To dissect the immunological pathways associated with the differentially expressed genes in IND versus HD, a gene set enrichment analysis (GSEA) was employed using the NRQ values and the Molecular Signatures Database (MSigDB) BioCarta gene set collection (Subramanian et al., 2005; Liberzon et al., 2011). Enrichment plots were obtained from selected pathways to illustrate the positive or negative correlation between the specific gene set upregulated or downregulated in IND and HD for each pathway. As shown in Figure 7, GSEA showed a positive correlation in the IND phenotype for several immunological pathways since many genes involved in these routes were overexpressed in IND patients versus HD. Thus, the differentially enriched routes in IND showed to be the antigen-dependent B cell activation (BIOCARTA_ASBCELL_PATHWAY, Figure 7A), stress induction of HSP regulation (BIOCARTA_HSP27_PATHWAY, Figure 7B), NO2-dependent IL12 pathway in NK cells (BIOCARTA_NO2IL12_PATHWAY, Figure 7C), and cytokine and inflammatory response (BIOCARTA_INFLAM_PATHWAY, Figure 7D) gene sets, with normalized enrichment scores (NES) of 1.53, 1.58, 1.36, and 1.23 plus FDR q-values of 0.21, 0.22, 0.34, and 0.63, respectively.
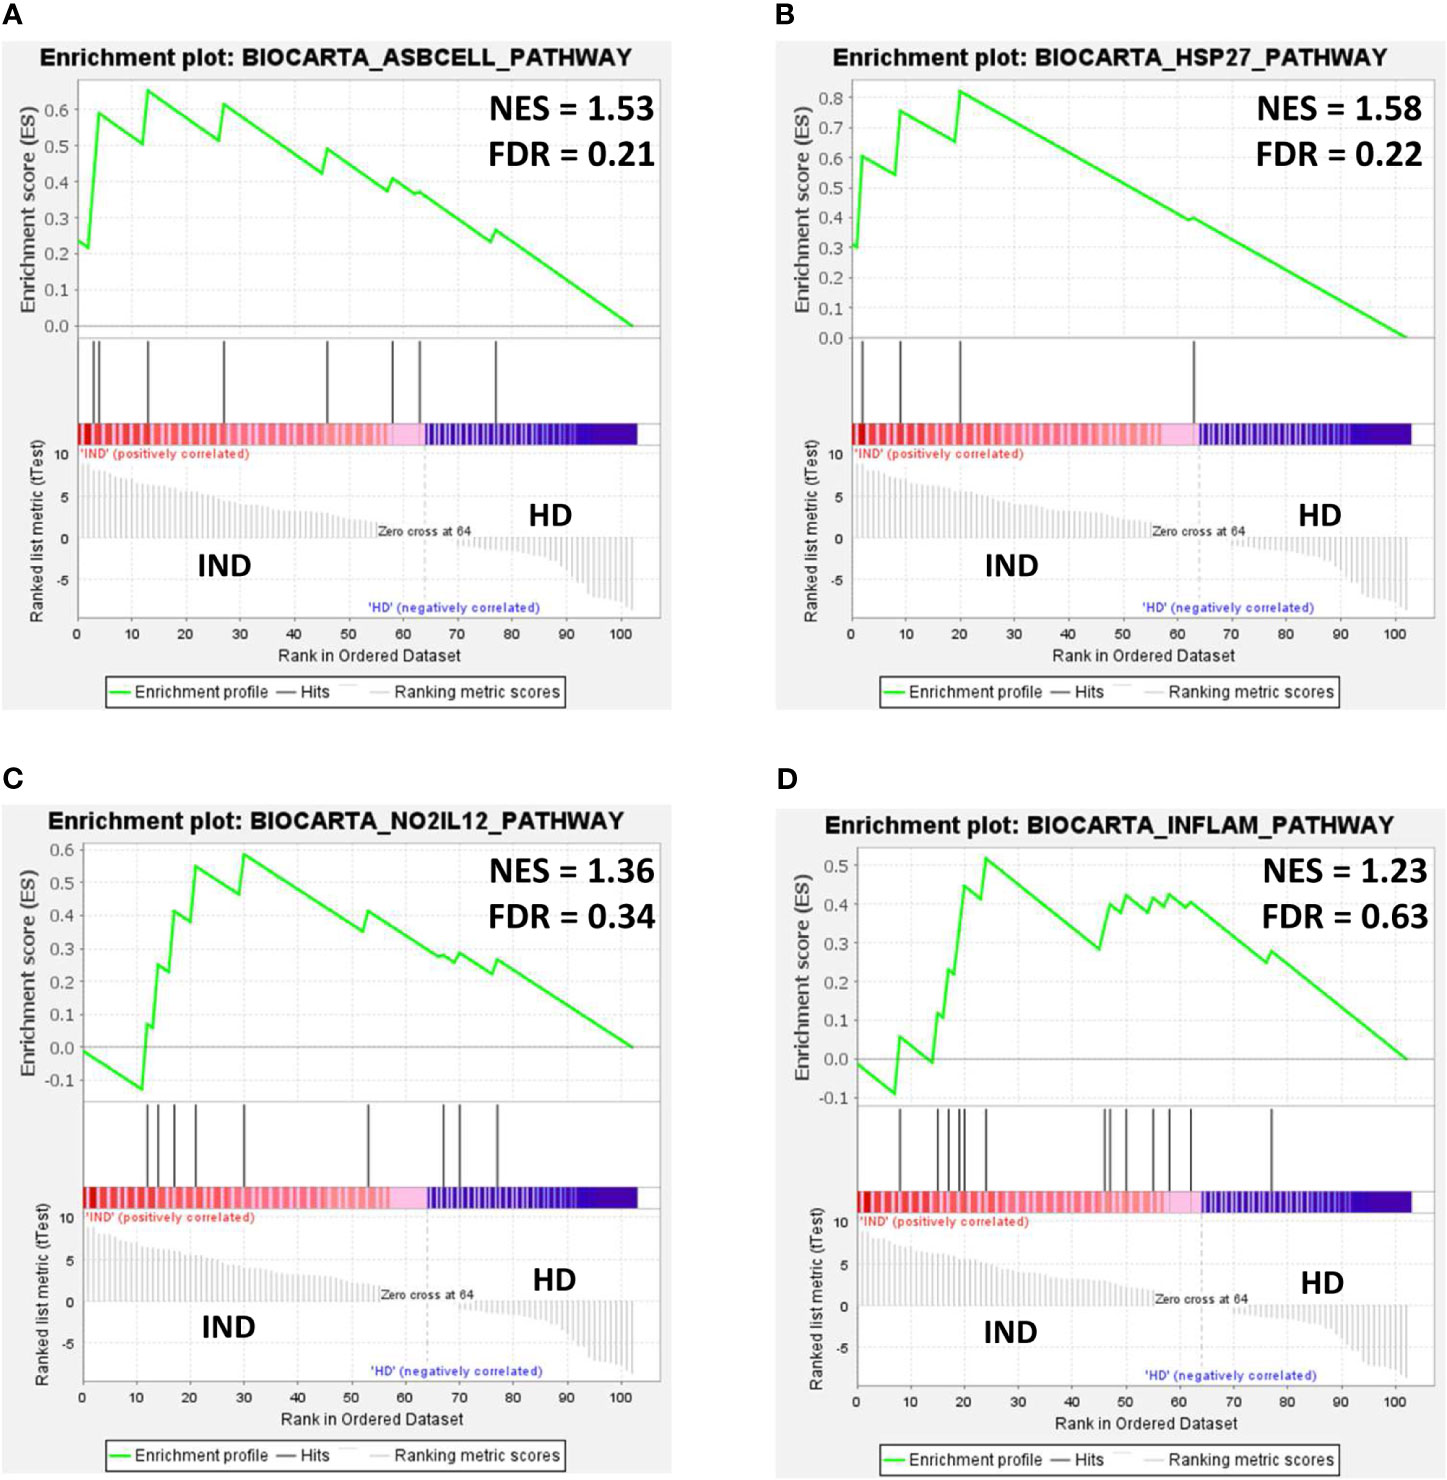
Figure 7 Gene set enrichment analysis (GSEA) plots of representative gene sets from (A) antigen-dependent B cell activation pathway (BIOCARTA_ASBCELL_PATHWAY), (B) stress induction of HSP regulation (BIOCARTA_HSP27_PATHWAY, (C) NO2-dependent IL12 pathway in NK cells (BIOCARTA_NO2IL12_PATHWAY), and (D) cytokines and inflammatory response (BIOCARTA_INFLAM_PATHWAY) signature in IND and HD subjects. The green curve denotes the enrichment score (ES) curve. Parameters set for GSEA were as follows: Molecular Signatures Database (MSigDB) BioCarta gene set collection, permutations = 100,000, permutation type: phenotype, enrichment statistic: weighted, metric for ranking genes: t-test, max size: 500, min size: 3. NES, normalized enrichment score; FDR, false discovery rate q-value.
The number of genes that showed to be upregulated in IND patients was next analyzed, taking into account the proportion of upregulated genes from the total number of genes in the GSEA pathways. To extend the analysis, it was also taken into consideration the identity of the overexpressed genes that showed to have a log2 FC higher than 1 and those which participated in principal component 1. As it is observed, Table 4 integrates the results obtained in GSEA and in PCA and the genes differentially expressed in IND patients versus HD for each one of the four BioCarta pathways (with factor loading of PC1 > 0.6 or log2 FC > 1). Specifically, 10 out of 15 genes included in the “Antigen dependent B cell activation” BioCarta pathway were analyzed in this study. Five of them (CD28, CD40, CD40LG, FAS, and IL2) were upregulated in the IND phenotype when compared to HD. From a total of 14 genes that are integrated in the “Stress induction of HSP regulation” BioCarta pathway, we found that four genes (FAS, CASP3, BCL2, and TNF) out of five included in the array were overexpressed in IND versus HD. Regarding the “Cytokines and inflammatory response” BioCarta pathway, an increased expression of 8 (IL2, TNF, CSF1, CSF2, IFNG, IL5, IL6, and IL7) out of the 14 genes included in the array from a total 29 genes that are integrated in this route was also detected. In addition, four genes (IFNG, CD2, IL12RB1, and IL12RB2) out of nine genes analyzed in the array from the 15 genes included in the “N02-dependent IL-12 pathway in NK cells” pathway were found to be upregulated in IND patients versus HD subjects. Of the total of 17 genes that were overexpressed in IND versus HD in one or more than one selected pathways, four of them (CSF2, IL2, IL5, and IL6) reached a log2 of FC > 1 and p < 0.05; in the IND versus HD subjects, four genes (CASP3, CD2, CD28 and IL12RB1) had factor loading with PC1 > 0.6 (the principal component responsible for the differences between both groups), and nine genes (BCL2, CD40, CD40LG, CSF1, FAS, IFNG, IL12RB2, IL7, and TNF) fulfilled the criteria for both tests. As expected, the overexpression of these 17 genes in IND versus HD was also stated when the same analysis was carried out considering only the samples from IND which came from independent subjects (Supplementary Table 3).
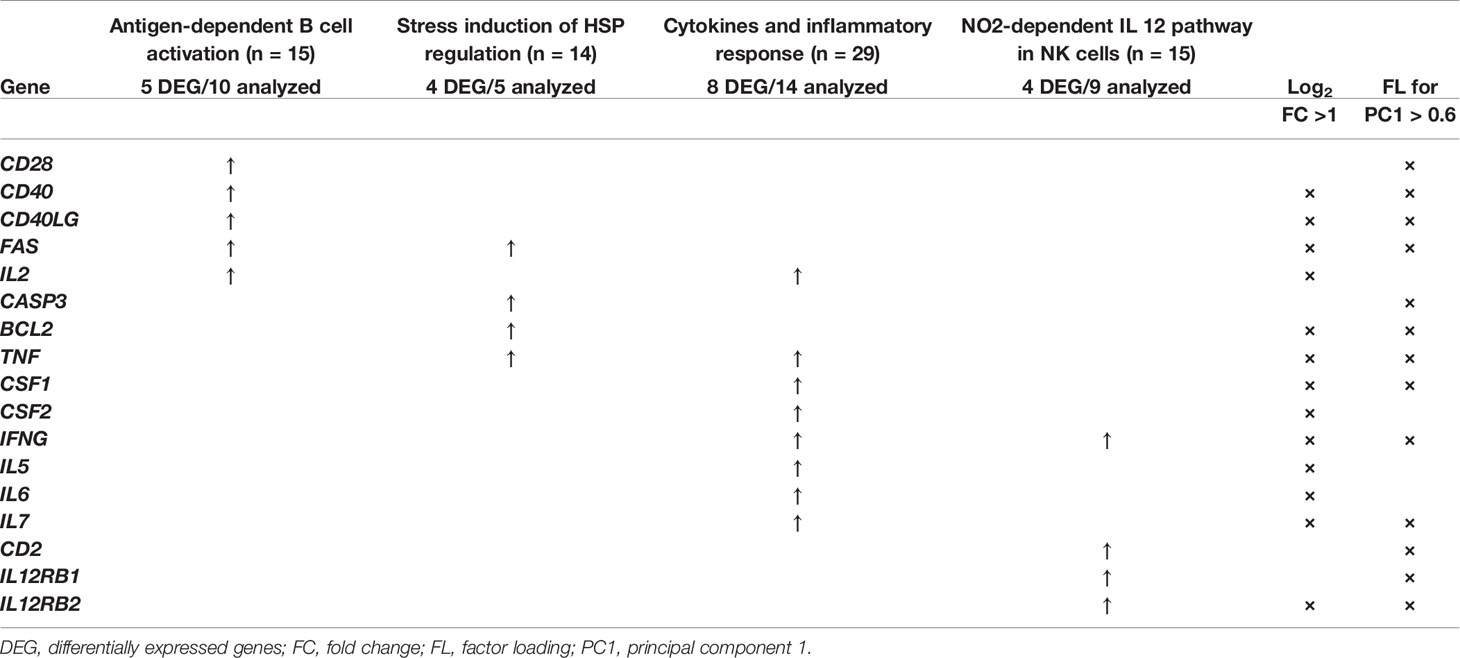
Table 4 List of genes differentially expressed in IND and HD subjects which have shown to be involved in the BioCarta pathways antigen-dependent B cell activation (BIOCARTA_ASBCELL_PATHWAY), stress induction of HSP regulation (BIOCARTA_HSP27_PATHWAY), cytokines and inflammatory response (BIOCARTA_INFLAM_PATHWAY), and NO2-dependent IL 12 pathway in NK cells (BIOCARTA_NO2IL12_PATHWAY) enriched in IND phenotype according to GSEA analysis.
Infection by the T. cruzi parasite triggers multiple immune mechanisms in the host to combat the pathogen which can be sustained for decades maintaining the subject in an indeterminate stage of the disease. Along this time, there exists a fragile balance between the replication of the parasite and the host immune response (Dos Santos Virgilio et al., 2014) that, when broken, leads to the progression of the disease. Understanding the molecular mechanisms of pathogenesis and characterizing how the immune system responds to infection result to be essential toward disease control.
In this study, an extensive real-time quantitative PCR (qPCR) analysis has been performed to identify global changes in gene expression profiles of 106 immune system-related genes in IND patients in response to parasite-specific proteins. For comparative analyses, healthy subjects were included in the study taking into consideration the influence of the donor origin, from either endemic or non-endemic areas of Chagas disease. The genes were selected based on their relevance as part of immunological processes which have been described as associated with the control of infection caused by intracellular pathogens. Thus, several genes were selected and analyzed, based on their nature and involvement in biological or immunological functions such as cytokines, chemokines, and their receptors; adhesion molecules; phenotype markers; transcription factors; cytotoxic molecules; inhibitory receptors and their ligands; dendritic cell markers; molecules involved in apoptosis and senescence; costimulatory molecules; and other molecules with immunological involvement.
The first approach was focused on the analysis of the expression profile of the 106 immune-related genes among the healthy donors in response to TcSA stimulation. The expression pattern represented as a heat map together with the principal component analysis failed to differentiate the immune response observed in healthy individuals coming from endemic areas from those of non-endemic regions of Chagas disease. Furthermore, the statistical analyses confirmed that there were no statistically significant differences between the scores of the principal components represented between both groups of subjects (PC1 p = 0.65, PC2 p = 0.23). On the other hand, differential gene expression analysis revealed that only 4.7% of the genes analyzed (5 out of 106) were differentially expressed between both groups of healthy subjects with statistical significance. These genes were interleukins IL6, IL12B, and IL17A and the phenotype markers FCER1A and CD27. These findings indicate that there are no differences in the gene expression level of most of the genes under study among healthy donors of different geographical origin. Therefore, all healthy subjects were considered as a single group of subjects in subsequent comparative analyses.
When the gene expression level of 106 immune system-related genes from IND patients was compared to that from healthy subjects, remarkable differences were detected. The NRQ expression values represented in a heat map revealed clear differences in a large group of genes accounting for more than half of the genes under study, with the majority being overexpressed in IND versus HD.
The structure of the dataset was determined by PCA analysis, which can be interpreted as a measure of differential gene expression between IND and HD subjects. PCA analysis showed differential gene expression between IND and HD subjects, depending on PC1-correlated genes. The 23 genes positively correlated with PC1 (with factor loading (FL) > 0.6) correspond to cytokines/interleukins and receptors (CSF1, IFNG, IL12A, IL12RB1, IL12RB2, IL18R1, IL2RG, IL7, and TNF), costimulatory molecules (CD2, CD40, CD40LG, CD69, ICOS), transcription factors (GATA3, STAT1, TBX21), molecules involved in apoptosis (BCL2, CASP3, FAS), one phenotype marker (CD28), one inhibitory receptor (BTLA), and one dendritic cell marker (CD83). Only nine genes showed a negative correlation with PC1 (FL < -0.6) and were cytokines/interleukins and receptors (IFNGR1, IFNGR2, IL17RA, IL18), adhesion molecules (ITGAX, ITGB2), one inhibitory receptor (HAVCR2), one dendritic cell marker (CCR1), and one costimulatory molecule (CD86).
Differential analysis of gene expression revealed that the expression level of a large number of genes varied between infected and non-infected subjects. Specifically, 32% of the genes were expressed more than twice or less than half (log2 FC > 1 or < -1) with statistical significance (p < 0.05) in IND versus HD. For 91% of the genes, very significant differences were detected (p < 0.001). The majority of the differentially expressed genes were upregulated in IND (67.6%) particularly cytokines/interleukins and receptors (CSF1, CSF2, IFNG, IL12A, IL12B, IL12RB2, IL2, IL27, IL5, IL5RA, IL6, IL7, and TNF), costimulatory molecules (CD40, CD40LG), transcription factors (STAT1, TBX21), molecules involved in apoptosis (BCL2, FAS), inhibitory receptor (BTLA, CD274), phenotype marker (CD27), and enzymes (IDO1). The downregulated genes in IND were classified as cytokines/interleukins and receptors (IFNGR1, IFNGR2, IL18), adhesion molecules (ITGAX, ITGB2), inhibitory receptors (HAVCR2), dendritic cell markers (CCR1, CLEC9A, XCR1), phenotype markers (FCER1A), and costimulatory molecules (CD86).
When the differences observed in gene expression level between IND and HD were quantified, the greatest differences (greater than four times more or less expression in IND versus HD) were found for nine genes. Four of these genes showed to be downregulated in IND patients (CD86, CLEC9A, FCER1A, and IL18). The expression of the CLEC9A gene was not detected in any IND while the FCER1A, IL18, and CD86 mRNA levels were 5.5, 22, and 9 times lower in IND than in HD, respectively. The remaining five genes (CD27, CSF2, IFNG, IL5, and IL6) were upregulated in IND exhibiting the greatest differences (6.5 to 32 times more). It should be noted that the expression of the IFNG gene (IFNγ) suffered the greatest variation between IND and HD showing an FC value greater than 5, which corresponds to a 32-fold time higher expression in IND patients than in HD. IFNγ is important for orchestrating the development of adaptive immunity, contributing to the differentiation of CD4+ Th1 and CD8+ T cells required for controlling the parasite proliferation that occurs during acute infection (Cerbán et al., 2020). Thus, the control of T. cruzi infection is related to IFNγ activation leading to intracellular clearance of parasites (Kulkarni et al., 2015). The expression of the TNF gene was also found to be upregulated in IND patients versus healthy donors, which is consistent with previous studies that report the detection of high levels of IFNγ and TNF in IND patients (Ferreira et al., 2003; Requena-Méndez et al., 2013), suggesting a relevant role of these molecules in the control of T. cruzi infection. In addition to IFNγ and TNF, the control of T. cruzi infection has been associated with the cytokine profile produced by Th1 cells (Petray et al., 1993; Rodrigues et al., 1999; Tarleton et al., 2000; Kumar and Tarleton, 2001; Hoft and Eickhoff, 2005).
Regarding the five genes differentially expressed in subjects coming from endemic and non-endemic areas, three of them (IL12B, IL6, and CD27) were upregulated and one (FCER1A) downregulated with statistical significance in IND versus HD when they were analyzed as a single group. Although IL17A mRNA was overproduced in healthy donors from endemic areas, the observed differences were not significant when its expression level by IND was compared to that from healthy donors, both as a single group (HD) and as separate groups of individuals (HDc and HDe).
To gain insights into immunological processes to which the differential gene expression profiles observed between IND and HD were associated, a protein–protein interaction (PPI) network was built using the 34 differentially expressed genes using the STRING website. Analysis of the PPI network showed that the differentially expressed genes between IND versus HD subjects encode proteins that have a high degree of interaction (PPI enrichment p-value < 1.0e-16). The most significant biological processes and pathways in which the differentially expressed genes take part were associated with immune response including inflammatory responses, interleukin-2 family signaling, Th1 and Th2 cell differentiation, interleukin-12 family signaling, JAK-STAT signaling pathway, and Th17 cell differentiation and natural killer cell-mediated cytotoxicity pathways. According to STRING analysis, 20 out of 34 differentially expressed genes (59%) were involved in one or more of these six immune system-related pathways with very low false discovery rate (FDR) values (ranging from 4.77e-19 to 2.2e-08), an indication of the reliability of the predictions.
STAT1 played a central role in five of the highly enriched pathways. The observed STAT1 upregulation in IND patients supports previous studies that report the activation of STAT1 signaling pathway in host cells after infection with T. cruzi leading to a significantly elevated STAT1 expression (De Avalos et al., 2002). It has been described that STAT1 plays a major role in the first line of defense against invasion of T. cruzi trypomastigotes (Stahl et al., 2014). Moreover, it has been reported that STAT1 is a key mediator of IFNγ intracellular signaling and knockout of this protein leads to susceptibility to several intracellular microbes (Kulkarni et al., 2015). The protective effect of IFNγ against both the entry of trypomastigotes into host cells and the intracellular multiplication of amastigotes was based on the activation of STAT1 by tyrosine phosphorylation (Stahl et al., 2014). These results are consistent with the upregulation of both STAT1 and IFNG observed in the present work in IND patients, suggesting the relevant role of these molecules to control T. cruzi infection at this stage. Furthermore, upregulation of IL12A, IL12B, and IL12RB2 genes has been detected in IND patients, which participate in “Interleukin-12 family signaling,” “Th1 and Th2 cell differentiation,” and “JAK-STAT signaling” according to STRING. IL12 acts on activated T lymphocytes, driving its differentiation to the Th1 subclass. This cytokine is characterized as a potent inducer of IFNG production by NK cells and different subsets of T cells (Gately et al., 1994), which is consistent with the differential expression of IFNG that we detected in the IND patients. Besides, anti-IL12 antibodies increase susceptibility to infection, highlighting its important role in the control of parasitemia (Aliberti et al., 1996). The results shown here also suggest the possible activation of the “Interleukin-2 family signaling” pathway, detecting an upregulation of this cytokine in IND patients. As it has been reported, T. cruzi antigen-specific co-production of IFNγ, IL2, and TNFα by CD8+ T cells has been found in a greater proportion in asymptomatic patients, their proportion being decreased according to the progression of the severity of the heart Chagas disease (Lasso et al., 2015; Mateus et al., 2015).
Notably, the differentially expressed genes in IND were also involved in the “Th17 cell differentiation,” as obtained from STRING. Th17 cells correspond to a subset of CD4+ T cells known to play a central role in the pathogenesis of many autoimmune diseases, as well as in the defense against some extracellular bacteria and fungi (Ishigame et al., 2009; Lin et al., 2009; Milner et al., 2010; Zielinski et al., 2012). However, their role in intracellular infections has been questioned (Cai et al., 2016). In contrast to this paradigm, the protective role of Th17 cells in the control of parasitemia and survival of T. cruzi-infected mice has been reported (Miyazaki et al., 2010; Cai et al., 2016). Moreover, the Th17 profile has been considered a protective factor in preventing myocardial damage in human Chagas disease (Magalhães et al., 2013; Sousa et al., 2017). Our results support this finding and suggest that this pathway may be activated in order to control parasitemia and prevent disease progression in IND patients.
Several gene sets were found to be enriched in IND subjects according to their gene expression levels: “antigen-dependent B cell activation,” “stress induction of HSP regulation,” “NO2-dependent IL12 pathway in NK cells,” and “Cytokines and inflammatory response.” The enrichment was related to the upregulation observed in a number of genes, which were also found either correlated with PC1 (therefore driving the separation of IND and healthy subjects in the PCA analysis) or showing a statistically significant differential gene expression in the volcano plot (FC > 1 and p < 0.05). Seventeen genes were included in this classification, of which 52.9% fulfilled both criteria.
Regarding the enriched routes, the activation in these patients of antigen-dependent B cells was a consequence of the upregulation of CD28, CD40, CD40LG, FAS, and IL2 genes. CD40 interaction with CD40L and CD28 interaction with CD80 provide positive costimulatory signals that stimulate B cell activation, proliferation, and differentiation to memory cells (BioCarta—http://www.gsea-msigdb.org/gsea/msigdb/cards/BIOCARTA_ASBCELL_PATHWAY). Inflammation as a protective response to infection is also observed with the enrichment in the “cytokines and inflammatory response” pathway as a result of IL2, TNF, CSF1, CSF2, INFG, IL5, IL6, and IL7 gene upregulation.
The finding that “NO2-dependent IL12 Pathway in NK cells” is enriched in IND patients, who remain asymptomatic and therefore control disease progression, suggests that activation of this pathway may be essential to fight the parasite. A previous study reported that the resistance against T. cruzi is based on the release of IL12 by infected macrophages, which induces IFNγ production from T and NK cells (Cerbán et al., 2020). In macrophages, IFNγ functions by activating inducible nitric oxide synthase (iNOS) and NADPH oxidase for the production of nitric oxide (NO), reactive oxygen species (ROS), and reactive nitrogen intermediates (RNI) as peroxynitrite (ONOO-), which are critical for the trypanocidal activity (Gazzinelli et al., 1992; Vespa et al., 1994; Guiñazú et al., 2007).
GSEA analysis also revealed an enrichment in IND patients of the “stress induction of HSP regulation” pathway gene set as a consequence of upregulation of the FAS, BCL2, CASP3, and TNF genes included in this route. The activation of these genes, all four involved in apoptosis processes, was expected in Chagas disease patients, given intracellular infection with T. cruzi. However, the activation of the “Stress induction of HSP regulation” pathway (BIOCARTA_HSP27_PATHWAY) further suggests that the expression of these genes could be activating heat shock proteins. Heat shock proteins, and particularly Hsp27, have shown to have a strong protective effect on cells, mainly due to its vital function at apoptosis regulation (Garrido et al., 2003; Wang et al., 2014). Interestingly, Hsp27 has shown to have the ability to decrease ROS levels, allowing cells to increase their resistance to oxidative stress (Garrido et al., 1997; Rogalla et al., 1999; Arrigo et al., 2005), so this pathway could also be acting as a mechanism for controlling the presence of ROS in the cell of these patients. This fact seems to result to be essential since it has been shown that when these cytotoxic species are produced in excess or for sustained periods of time or when there is an inadequate antioxidant response, they can accumulate and may contribute to the pathogenesis of Chagas disease (Zacks et al., 2005).
The results shown here indicate that infection with T. cruzi induces changes in the expression profile of several genes that seem to be implicated in relevant immunological pathways. These protein-coding genes may result to be useful biomarkers of the indeterminate form of Chagas disease and may act as new therapeutic targets in hosts useful in preventing the progression to the chronic symptomatic phase. The results indicate that the innovative strategy employed here can be applied for future gene expression analyses of more genes involved in the identified pathways and in the identification of new pathways. All this will undoubtedly elucidate the immune response produced in Chagas disease patients and the immunological pathways activated in asymptomatic and symptomatic Chagas disease patients.
The original contributions presented in the study are included in the article/Supplementary Material. Further inquiries can be directed to the corresponding authors.
The studies involving human participants were reviewed and approved by the Ethics Committees of the Consejo Superior de Investigaciones Científicas (Spain—Reference: 094/2016) and of the Hospital Virgen de la Arrixaca (Murcia, Spain—Reference: MTR-05/2016). The patients/participants provided their written informed consent to participate in this study.
Conceptualization: ML, EC, and MT. Formal analysis: IG, GP, AE, EC, ML, and MT. Funding acquisition: BV, EC, MSe, ML, and MT. Methodology: IG, AE, GP, BC, MSi, EC, ML, and MT. Writing—first draft: IG. Writing—review and editing: IG, GP, AE, EC, ML, and MT. All authors contributed to the article and approved the submitted version.
This work was supported by grant PID2019-109090RB-I00 from the Programa Estatal I+D+I, Spanish Ministry of Science and Innovation (MICIIN), and the Network of Tropical Diseases Research—RICET (RD16/0027/0005, RD16/0027/0001, and RD16/0027/0016).
The authors declare that the research was conducted in the absence of any commercial or financial relationships that could be construed as a potential conflict of interest.
All claims expressed in this article are solely those of the authors and do not necessarily represent those of their affiliated organizations, or those of the publisher, the editors and the reviewers. Any product that may be evaluated in this article, or claim that may be made by its manufacturer, is not guaranteed or endorsed by the publisher.
We appreciate the participation of patients and healthy volunteers that allowed the realization of this study. We thank A. López-Barajas and Celia Benítez from IPBLN-CSIC for their relevant technical assistance. This publication is part of the PhD thesis of Inmaculada Gómez at the IPBLN-CSIC and University of Granada in the Biochemistry and Molecular Biology Program.
The Supplementary Material for this article can be found online at: https://www.frontiersin.org/articles/10.3389/fcimb.2021.722984/full#supplementary-material
Aliberti, J. C. S., Cardoso, M. A. G., Martins, G. A., Gazzinelli, R. T., Vieira, L. Q., Silva, J. S. (1996). Interleukin-12 Mediates Resistance to Trypanosoma Cruzi in Mice and is Produced by Murine Macrophages in Response to Live Trypomastigotes. Infect. Immun. 64, 1961–1967. doi: 10.1128/iai.64.6.1961-1967.1996
Andersen, C. L., Jensen, J. L., Ørntoft, T. F. (2004). Normalization of Real-Time Quantitative Reverse Transcription-PCR Data: A Model-Based Variance Estimation Approach to Identify Genes Suited for Normalization, Applied to Bladder and Colon Cancer Data Sets. Cancer Res. 64, 5245–5250. doi: 10.1158/0008-5472.CAN-04-0496
Arrigo, A. P., Virot, S., Chaufour, S., Firdaus, W., Kretz-Remy, C., Diaz-Latoud, C. (2005). Hsp27 Consolidates Intracellular Redox Homeostasis by Upholding Glutathione in its Reduced Form and by Decreasing Iron Intracellular Levels. Antioxid. Redox Signal. 7, 414–424. doi: 10.1089/ars.2005.7.414
Balouz, V., Agüero, F., Buscaglia, C. A. (2017). Chagas Disease Diagnostic Applications: Present Knowledge and Future Steps. Adv. Parasitol. 97, 1–45. doi: 10.1016/bs.apar.2016.10.001
Cai, C. W., Blase, J. R., Zhang, X., Eickhoff, C. S., Hoft, D. F. (2016). Th17 Cells Are More Protective Than Th1 Cells Against the Intracellular Parasite Trypanosoma Cruzi. PloS Pathog. 12, e1005902. doi: 10.1371/journal.ppat.1005902
Camargo, M. E. (1966). Fluorescent Antibody Test for the Serodiagnosis of American Trypanosomiasis. Technical Modification Employing Preserved Culture Forms of Trypanosoma Cruzi in a Slide Test. Rev. Inst. Med. Trop. Sao. Paulo. 8, 227–235.
Camargo, M. E., Hoshino, S., Corrêa, N. S., Peres, B. A. (1971). Hemagglutination Test for Chagas’ Disease With Chromium Chloride, Formalin-Treated Erythocytes, Sensitized With Trypanosoma Cruzi Extracts. Rev. Inst. Med. Trop. Sao. Paulo. 13, 45–50.
Cerbán, F. M., Stempin, C. C., Volpini, X., Carrera Silva, E. A., Gea, S., Motran, C. C. (2020). Signaling Pathways That Regulate Trypanosoma Cruzi Infection and Immune Response. Biochim. Biophys. Acta - Mol. Basis. Dis. 1866:165707. doi: 10.1016/j.bbadis.2020.165707
Cunha-Neto, E., Dzau, V. J., Allen, P. D., Stamatiou, D., Benvenutti, L., Higuchi, M. L., et al. (2005). Cardiac Gene Expression Profiling Provides Evidence for Cytokinopathy as a Molecular Mechanism in Chagas’ Disease Cardiomyopathy. Am. J. Pathol. 167, 305–313. doi: 10.1016/S0002-9440(10)62976-8
De Avalos, S. V., Blader, I. J., Fisher, M., Boothroyd, J. C., Burleigh, B. A. (2002). Immediate/early Response to Trypanosoma Cruzi Infection Involves Minimal Modulation of Host Cell Transcription. J. Biol. Chem. 277, 639–644. doi: 10.1074/jbc.M109037200
De Meis, J., Morrot, A., Farias-de-Oliveira, D. A., Villa-Verde, D. M. S., Savino, W. (2009). Differential Regional Immune Response in Chagas Disease. PloS Negl. Trop. Dis. 3, e417. doi: 10.1371/journal.pntd.0000417
Dos Santos Virgilio, F., Pontes, C., Dominguez, M. R., Ersching, J., Rodrigues, M. M., Vasconcelos, J. R. (2014). CD8+ T Cell-Mediated Immunity During Trypanosoma Cruzi Infection: A Path for Vaccine Development? Mediators Inflamm. 2014, 1–12. doi: 10.1155/2014/243786
Dutra, W. O., Gollob, K. J., Pinto-Dias, J. C., Gazzinelli, G., Correa-Oliveira, R., Coffman, R. L., et al. (1997). Cytokine mRNA Profile of Peripheral Blood Mononuclear Cells Isolated From Individuals With Trypanosoma Cruzi Chronic Infection. Scand. J. Immunol. 45, 74–80. doi: 10.1046/j.1365-3083.1997.d01-362.x
Dutra, W. O., Martins-filho, O. A., Caņado, J. R., Pinto-dias, J. C., Brener, Z., Freeman, G. L., et al. (1994). Activated T and B Lymphocytes in Peripheral Blood of Patients With Chagas’ Disease. Int. Immunol. 6, 499–506. doi: 10.1093/intimm/6.4.499
Dutra, W. O., Menezes, C. A. S., Magalhães, L. M. D., Gollob, K. J. (2014). Immunoregulatory Networks in Human Chagas Disease. Parasite. Immunol. 36, 377–387. doi: 10.1111/pim.12107
Egui, A., Lasso, P., Thomas, M. C., Carrilero, B., González, J. M., Cuéllar, A., et al. (2017). Expression of Inhibitory Receptors and Polyfunctional Responses of T Cells are Linked to the Risk of Congenital Transmission of T. Cruzi. PloS Negl. Trop. Dis. 11, e0005627. doi: 10.1371/journal.pntd.0005627
Ferreira, R. C., Ianni, B. M., Abel, L. C. J., Buck, P., Mady, C., Kalil, J., et al. (2003). Increased Plasma Levels of Tumor Necrosis Factor-α in Asymptomatic/"Indeterminate" and Chagas Disease Cardiomyopathy Patients. Mem. Inst. Oswaldo. Cruz. 98, 407–411. doi: 10.1590/s0074-02762003000300021
Fife, E. H., Muschel, L. H. (1959). Fluorescent-Antibody Technic for Serodiagnosis of Trypanosoma Cruzi Infection. Proc. Soc Exp. Biol. Med. 101, 540–543. doi: 10.3181/00379727-101-25009
Garrido, C., Ottavi, P., Fromentin, A., Hammann, A., Arrigo, A. P., Chauffert, B., et al. (1997). HSP27 as a Mediator of Confluence-Dependent Resistance to Cell Death Induced by Anticancer Drugs. Cancer Res. 57, 2661–2667.
Garrido, C., Schmitt, E., Candé, C., Vahsen, N., Parcellier, A., Kroemer, G. (2003). HSP27 and HSP70: Potentially Oncogenic Apoptosis Inhibitors. Cell Cycle 2, 578–583. doi: 10.4161/cc.2.6.521
Gately, M. K., Warrier, R. R., Honasoge, S., Carvajal, D. M., Faherty, D. A., Connaughton, S. E., et al. (1994). Administration of Recombinant IL-12 to Normal Mice Enhances Cytolytic Lymphocyte Activity and Induces Production of IFN-γ In Vivo. Int. Immunol. 6, 157–167. doi: 10.1093/intimm/6.1.157
Gazzinelli, R. T., Oswald, I. P., Hieny, S., James, S. L., Sher, A. (1992). The Microbicidal Activity of Interferon-γ-Treated Macrophages Against Trypanosoma Cruzi Involves an L-Arginine-Dependent, Nitrogen Oxide-Mediated Mechanism Inhibitable by Interleukin-10 and Transforming Growth Factor-β. Eur. J. Immunol. 22, 2501–2506. doi: 10.1002/eji.1830221006
Guiñazú, N., Pellegrini, A., Carrera-Silva, E. A., Aoki, M. P., Cabanillas, A. M., Gìronés, N., et al. (2007). Immunisation With a Major Trypanosoma Cruzi Antigen Promotes Pro-Inflammatory Cytokines, Nitric Oxide Production and Increases TLR2 Expression. Int. J. Parasitol. 37, 1243–1254. doi: 10.1016/j.ijpara.2007.03.010
Hernandez-Santana, Y. E., Ontoria, E., Gonzalez-García, A. C., Quispe-Ricalde, M. A., Larraga, V., Valladares, B., et al. (2016). The Challenge of Stability in High-Throughput Gene Expression Analysis: Comprehensive Selection and Evaluation of Reference Genes for BALB/c Mice Spleen Samples in the Leishmania Infantum Infection Model. PloS One 11, 1–16. doi: 10.1371/journal.pone.0163219
Hoft, D. F., Eickhoff, C. S. (2005). Type 1 Immunity Provides Both Optimal Mucosal and Systemic Protection Against a Mucosally Invasive, Intracellular Pathogen. Infect. Immun. 73, 4934–4940. doi: 10.1128/IAI.73.8.4934-4940.2005
Ishigame, H., Kakuta, S., Nagai, T., Kadoki, M., Nambu, A., Komiyama, Y., et al. (2009). Differential Roles of Interleukin-17A and -17F in Host Defense Against Mucoepithelial Bacterial Infection and Allergic Responses. Immunity 30, 108–119. doi: 10.1016/j.immuni.2008.11.009
Kulkarni, M. M., Varikuti, S., Terrazas, C., Kimble, J. L., Satoskar, A. R., Mcgwire, B. S. (2015). Signal Transducer and Activator of Transcription 1 (STAT-1) Plays a Critical Role in Control of Trypanosoma Cruzi Infection. Immunology 145, 225–231. doi: 10.1111/imm.12438
Kumar, S., Tarleton, R. L. (2001). Antigen-Specific Th1 But Not Th2 Cells Provide Protection From Lethal Trypanosoma Cruzi Infection in Mice. J. Immunol. 166, 4596–4603. doi: 10.4049/jimmunol.166.7.4596
Lasso, P., Mateus, J., Pavía, P., Rosas, F., Roa, N., Thomas, M. C., et al. (2015). Inhibitory Receptor Expression on CD8 + T Cells Is Linked to Functional Responses Against Trypanosoma Cruzi Antigens in Chronic Chagasic Patients. J. Immunol. 195, 3748–3758. doi: 10.4049/jimmunol.1500459
Laucella, S. A., Postan, M., Martin, D., Fralish, B. H., Albareda, M. C., Alvarez, M. G., et al. (2004). Frequency of Interferon-γ-Producing T Cells Specific for Trypanosoma Cruzi Inversely Correlates With Disease Severity in Chronic Human Chagas Disease. J. Infect. Dis. 189, 909–918. doi: 10.1086/381682
Liberzon, A., Subramanian, A., Pinchback, R., Thorvaldsdottir, H., Tamayo, P., Mesirov, J. P. (2011). Molecular Signatures Database (MSigDB) 3.0. Bioinformatics 27, 1739–1740. doi: 10.1093/bioinformatics/btr260
Lin, L., Ibrahim, A. S., Xu, X., Farber, J. M., Avanesian, V., Baquir, B., et al. (2009). Th1-Th17 Cells Mediate Protective Adaptive Immunity Against Staphylococcus Aureus and Candida Albicans Infection in Mice. PloS Pathog. 5, e1000703. doi: 10.1371/journal.ppat.1000703
Machado, F. S., Dutra, W. O., Esper, L., Gollob, K. J., Teixeira, M. M., Factor, S. M., et al. (2012). Current Understanding of Immunity to Trypanosoma Cruzi Infection and Pathogenesis of Chagas Disease. Semin. Immunopathol. 34, 753–770. doi: 10.1007/s00281-012-0351-7
Magalhães, L. M. D., Villani, F. N. A., Nunes, M., do, C. P., Gollob, K. J., Rocha, M. O. C., et al. (2013). High Interleukin 17 Expression is Correlated With Better Cardiac Function in Human Chagas Disease. J. Infect. Dis. 207, 661–665. doi: 10.1093/infdis/jis724
Marañón, C., Egui, A., Carrilero, B., Thomas, M. C., Pinazo, M. J., Gascón, J., et al. (2011). Identification of HLA-A*02:01-Restricted CTL Epitopes in Trypanosoma Cruzi Heat Shock Protein-70 Recognized by Chagas Disease Patients. Microbes Infect. 13, 1025–1032. doi: 10.1016/j.micinf.2011.05.010
Mateus, J., Lasso, P., Pavia, P., Rosas, F., Roa, N., Valencia-Hernández, C. A., et al. (2015). Low Frequency of Circulating CD8+ T Stem Cell Memory Cells in Chronic Chagasic Patients With Severe Forms of the Disease. PloS Negl. Trop. Dis. 9, e3432. doi: 10.1371/journal.pntd.0003432
Milner, J. D., Sandler, N. G., Douek, D. C. (2010). Th17 Cells, Job’s Syndrome and HIV: Opportunities for Bacterial and Fungal Infections. Curr. Opin. HIV AIDS 5, 179–183. doi: 10.1097/COH.0b013e328335ed3e
Miyazaki, Y., Hamano, S., Wang, S., Shimanoe, Y., Iwakura, Y., Yoshida, H. (2010). IL-17 Is Necessary for Host Protection Against Acute-Phase Trypanosoma Cruzi Infection. J. Immunol. 185, 1150–1157. doi: 10.4049/jimmunol.0900047
Mootha, V. K., Lindgren, C. M., Eriksson, K. F., Subramanian, A., Sihag, S., Lehar, J., et al. (2003). PGC-1α-Responsive Genes Involved in Oxidative Phosphorylation are Coordinately Downregulated in Human Diabetes. Nat. Genet. 34, 267–273. doi: 10.1038/ng1180
Morris, S. A., Tanowitz, H. B., Wittner, M., Bilezikian, J. P. (1990). Pathophysiological Insights Into the Cardiomyopathy of Chagas’ Disease. Circulation 82, 1900–1909. doi: 10.1161/01.CIR.82.6.1900
Pérez-Molina, J. A., Molina, I. (2018). Chagas Disease. Lancet 391, 82–94. doi: 10.1016/S0140-6736(17)31612-4
Petray, P. B., Rottenberg, M. E., Bertot, G., Corral, R. S., Diaz, A., Örn, A., et al. (1993). Effect of Anti-γ-Interferon and Anti-Interleukin-4 Administration on the Resistance of Mice Against Infection With Reticulotropic and Myotropic Strains of Trypanosoma Cruzi. Immunol. Lett. 35, 77–80. doi: 10.1016/0165-2478(93)90151-Q
Pfaffl, M. W., Tichopad, A., Prgomet, C., Neuvians, T. P. (2004). Determination of Stable Housekeeping Genes, Differentially Regulated Target Genes and Sample Integrity: BestKeeper - Excel-Based Tool Using Pair-Wise Correlations. Biotechnol. Lett. 26, 509–515. doi: 10.1023/B:BILE.0000019559.84305.47
Pinto Dias, J. C. (1989). The Indeterminate Form of Human Chronic Chagas’ Disease. A Clinical Epidemiological Review. Rev. Soc Bras. Med. Trop. 22, 147–156. doi: 10.1590/s0037-86821989000300007
Poveda, C., Fresno, M., Gironès, N., Martins-Filho, O. A., Ramírez, J. D., Santi-Rocca, J., et al. (2014). Cytokine Profiling in Chagas Disease: Towards Understanding the Association With Infecting Trypanosoma Cruzi Discrete Typing Units (A BENEFIT TRIAL Sub-Study). PloS One 9, e91154. doi: 10.1371/journal.pone.0091154
Rassi, A., Rassi, A., Marin-Neto, J. A. (2010). Chagas Disease. Lancet 375, 1388–1402. doi: 10.1016/S0140-6736(10)60061-X
Requena-Méndez, A., López, M. C., Angheben, A., Izquierdo, L., Ribeiro, I., Pinazo, M. J., et al. (2013). Evaluating Chagas Disease Progression and Cure Through Blood-Derived Biomarkers: A Systematic Review. Expert Rev. Anti Infect. Ther. 11, 957–976. doi: 10.1586/14787210.2013.824718
Rocha, M. O. C., Ribeiro, A. L. P., Teixeira, M. M. (2003). Clinical Management of Chronic Chagas Cardiomyopathy. Front. Biosci. 8, 44–54. doi: 10.2741/926
Rodrigues, M. M., Ribeirão, M., Pereira-Chioccola, V., Renia, L., Costa, F. (1999). Predominance of CD4 Th1 and CD8 Tc1 Cells Revealed by Characterization of the Cellular Immune Response Generated by Immunization With a DNA Vaccine Containing a Trypanosoma Cruzi Gene. Infect. Immun. 67, 3855–3863. doi: 10.1128/iai.67.8.3855-3863.1999
Rogalla, T., Ehrnsperger, M., Preville, X., Kotlyarov, A., Lutsch, G., Ducasse, C., et al. (1999). Regulation of Hsp27 Oligomerization, Chaperone Function, and Protective Activity Against Oxidative Stress/Tumor Necrosis Factor by Phosphorylation. J. Biol. Chem. 274, 18947–18956. doi: 10.1074/jbc.274.27.18947
Schmunis, G. A., Yadon, Z. E. (2010). Chagas Disease: A Latin American Health Problem Becoming a World Health Problem. Acta Trop. 115, 14–21. doi: 10.1016/j.actatropica.2009.11.003
Silver, N., Best, S., Jiang, J., Thein, S. L. (2006). Selection of Housekeeping Genes for Gene Expression Studies in Human Reticulocytes Using Real-Time PCR. BMC Mol. Biol. 7:33. doi: 10.1186/1471-2199-7-33
Sousa, G. R., Gomes, J. A. S., Damasio, M. P. S., Nunes, M. C. P., Costa, H. S., Medeiros, N. I., et al. (2017). The Role of Interleukin 17-Mediated Immune Response in Chagas Disease: High Level is Correlated With Better Left Ventricular Function. PloS One 12, e0172833. doi: 10.1371/journal.pone.0172833
Stahl, P., Ruppert, V., Schwarz, R. T., Meyer, T. (2014). Trypanosoma Cruzi Evades the Protective Role of Interferon-Gamma-Signaling in Parasite-Infected Cells. PloS One 9, e110512. doi: 10.1371/journal.pone.0110512
Subramanian, A., Tamayo, P., Mootha, V. K., Mukherjee, S., Ebert, B. L., Gillette, M. A., et al. (2005). Gene Set Enrichment Analysis: A Knowledge-Based Approach for Interpreting Genome-Wide Expression Profiles. Proc. Natl. Acad. Sci. 102, 15545–15550. doi: 10.1073/PNAS.0506580102
Szklarczyk, D., Gable, A. L., Lyon, D., Junge, A., Wyder, S., Huerta-Cepas, J., et al. (2019). STRING V11: Protein-Protein Association Networks With Increased Coverage, Supporting Functional Discovery in Genome-Wide Experimental Datasets. Nucleic Acids Res. 47, D607–D613. doi: 10.1093/nar/gky1131
Tarleton, R. L. (2001). Parasite Persistence in the Aetiology of Chagas Disease. Int. J. Parasitol. 31, 550–554. doi: 10.1016/S0020-7519(01)00158-8
Tarleton, R. L. (2007). Immune System Recognition of Trypanosoma Cruzi. Curr. Opin. Immunol. 19, 430–434. doi: 10.1016/j.coi.2007.06.003
Tarleton, R. L., Grusby, M. J., Zhang, L. (2000). Increased Susceptibility of Stat4-Deficient and Enhanced Resistance in Stat6-Deficient Mice to Infection With Trypanosoma Cruzi. J. Immunol. 165, 1520–1525. doi: 10.4049/jimmunol.165.3.1520
Vandesompele, J., De Preter, K., Pattyn, F., Poppe, B., Van Roy, N., De Paepe, A., et al. (2002). Accurate Normalization of Real-Time Quantitative RT-PCR Data by Geometric Averaging of Multiple Internal Control Genes. Genome Biol. 3, research0034.1. doi: 10.1186/gb-2002-3-7-research0034
Vespa, G. N. R., Cunha, F. Q., Silva, J. S. (1994). Nitric Oxide Is Involved in Control of Trypanosoma Cruzi-Induced Parasitemia and Directly Kills the Parasite In Vitro. Infect. Immun. 62, 5177–5182. doi: 10.1128/iai.62.11.5177-5182.1994
Voller, A., Draper, C., Bidwell, D. E., Bartlett, A. (1975). Microplate Enzyme-Linked Immunosorbent Assay for Chagas’ Disease. Lancet 305, 426–428. doi: 10.1016/S0140-6736(75)91492-0
Wang, X., Chen, M., Zhou, J., Zhang, X. (2014). HSP27, 70 and 90, Anti-Apoptotic Proteins, in Clinical Cancer Therapy (Review). Int. J. Oncol. 45, 18–30. doi: 10.3892/ijo.2014.2399
World Health Organization (2020). Chagas Disease (Also Known as American Trypanosomiasis) (Geneva, Switzerland: WHO Media Cent). Available at: https://www.who.int/en/news-room/fact-sheets/detail/chagas-disease-(american-trypanosomiasis).
Xie, F., Xiao, P., Chen, D., Xu, L., Zhang, B. (2012). Mirdeepfinder: A miRNA Analysis Tool for Deep Sequencing of Plant Small RNAs. Plant Mol. Biol. 80, 75–84. doi: 10.1007/s11103-012-9885-2
Zacks, M. A., Wen, J. J., Vyatkina, G., Bhatia, V., Garg, N. (2005). An Overview of Chagasic Cardiomyopathy: Pathogenic Importance of Oxidative Stress. An. Acad. Bras. Cienc. 77, 695–715. doi: 10.1590/S0001-37652005000400009
Keywords: chronic Chagas disease, Trypanosoma cruzi, transcriptional profiling, high-throughput RT-qPCR, immunological pathway, biomarkers, indeterminate form
Citation: Gómez I, Thomas MC, Palacios G, Egui A, Carrilero B, Simón M, Valladares B, Segovia M, Carmelo E and López MC (2021) Differential Expression of Immune Response Genes in Asymptomatic Chronic Chagas Disease Patients Versus Healthy Subjects. Front. Cell. Infect. Microbiol. 11:722984. doi: 10.3389/fcimb.2021.722984
Received: 09 June 2021; Accepted: 12 August 2021;
Published: 06 September 2021.
Edited by:
Christophe Chevillard, INSERM U1090 Technologies Avancées pour le Génome et la Clinique, FranceReviewed by:
Ludmila Rodrigues Pinto Ferreira, Federal University of Minas Gerais, BrazilCopyright © 2021 Gómez, Thomas, Palacios, Egui, Carrilero, Simón, Valladares, Segovia, Carmelo and López. This is an open-access article distributed under the terms of the Creative Commons Attribution License (CC BY). The use, distribution or reproduction in other forums is permitted, provided the original author(s) and the copyright owner(s) are credited and that the original publication in this journal is cited, in accordance with accepted academic practice. No use, distribution or reproduction is permitted which does not comply with these terms.
*Correspondence: M. Carmen Thomas, bWN0aG9tYXNAaXBiLmNzaWMuZXM=; Manuel Carlos López, bWNsb3BlekBpcGIuY3NpYy5lcw==
Disclaimer: All claims expressed in this article are solely those of the authors and do not necessarily represent those of their affiliated organizations, or those of the publisher, the editors and the reviewers. Any product that may be evaluated in this article or claim that may be made by its manufacturer is not guaranteed or endorsed by the publisher.
Research integrity at Frontiers
Learn more about the work of our research integrity team to safeguard the quality of each article we publish.