 Renyu Ruan
 Xiangmin Deng
 Xiaoyan Dong
 Qi Wang
 Xiaoling Lv
 Caijuan Si4*
- 1College of Undergradute, Jiangsu Food & Pharmaceutical Science College, Huaian, China
- 2College of Pharmacy and Traditional Chinese Medicine, Jiangsu College of Nursing, Huaian, China
- 3College of Pharmacy, Harbin Medical University–Daqing, Da Qing, China
- 4Department of Nutrition, Zhejiang Hospital, Hangzhou, China
Although many studies have reported that microbiota emergencies are deeply involved in the occurrence and subsequent progression of lung diseases, the present diagnosis of lung disease depends on microbiota markers, which is still poorly understood. Therefore, a meta-analysis was performed to confirm lung microbiota markers for the diagnosis of lung diseases. Literature databases were searched following the inclusion and exclusion criteria. There are 6 studies including 1347 patients and 26 comparisons to be enrolled, and then the diagnostic effect was evaluated using Stata 14.0 and Meta-disc 1.4 software. The pooled sensitivity (SEN), specificity (SPE), diagnostic likelihood ratio positive (DLR+), diagnostic likelihood ratio negative (DLR−), and diagnostic OR (DOR), as well as area under the curve (AUC) of microbiota markers in the diagnosis of lung diseases were 0.90 (95% CI: 0.83-0.94), 0.89 (95% CI: 0.76-0.95), 7.86 (95% CI: 3.39-18.21), 0.12 (95% CI: 0.06-0.21), 22.254 (95% CI: 12.83-39.59.14), and 0.95 (95% CI: 0.93-0.97), respectively. Subgroup analysis revealed that research based on Caucasian, adult, BAL fluid, PCR, pneumonia obtained higher AUC values. The microbiota markers have shown potential diagnosis value for lung diseases. But further large-scale clinical studies are still needed to verify and replicate the diagnostic value of lung microbiota markers.
Introduction
The human microbiota exists both inside and outside the human body, which is an ecosystem of microorganisms consisting of bacteria, archaea, and eukarya (Wolff et al., 2018). The bacterial microbiota had been widely studied because of its multiple of functions. In the meantime, the microbiome, the genetic content of microbiota, also had been widely investigated following the development of next-generation sequencing (Wolff et al., 2018). Microbiota composition often plays a key emerging factor to affect the immune responses of patients as well as healthy individuals. However, the lung microbiota had been less noticed compared with other organs in that healthy lungs were long thought to be sterile. And now, more and more studies reported that there existed multiple kinds of bacteria in healthy lungs (Huffnagle et al., 2017). Dysbiosis of respiratory system microbiota can lead to the occurrence or deterioration of lung diseases (Liu et al., 2021). In detail, the local immune system could be affected by the dysbiosis of lung microbiota, which determines the balance of inflammation (Kramer & Genco, 2017). Moreover, different microorganisms cause different host immune responses. However, the microbiome not only acts on the organism by immunity responses, inflammation response, or metabolism mechanism, but also on the colonized organs locally (Ran et al., 2020). For instance, fungal colonization and bacterial flora colonization were interacted with each other, which promoted the mycelial growth of fungi through colonized bacteria secreting antifungal substances and easily causing impaired lung infection (Oever & Netea, 2014). Moreover, the colonized bacteria reduced the release of the macrophages and the aggregation of neutrophils, which in turn affected the colonization of fungi. For example, A. fumigates has been found to be related to the impaired lung function in severe asthmatics (Agbetile et al., 2012; Man et al., 2019). In addition, impairment in host immune systems in immunocompetent and immunocompromised patients, including those with chronic obstructive pulmonary disease (COPD) and asthma, also increased the susceptibility to fungal infections (Man et al., 2019).
16S rRNA gene sequencing was the first application tool in the Human Microbiome Project (HMP) initiated in 2007 by the U.S. National Institutes of Health. The insight gained thus far into the lung microbiome in diseased states has led to considerable interest in the potential development of biomarkers, improved diagnostics, and therapies (Moffatt & Cookson, 2017). However, 16S rRNA did not provide closely related species, such as streptococcal species. Therefore, a recent study provided some species-level data by using quantitative PCR to confirm the potentially pathogenic OTUs (Man et al., 2019). A majority of preliminary investigations studied the relationship of bacteria in the respiratory system and lung diseases as well as its potential diagnostic value. For example, in increasing abundance of Moraxella and Haemophilus influenza directly reduced the occurrence and exacerbation of COPD (Ahearn et al., 2017; Mayhew et al., 2018), which showed their potential clinical diagnostic value. Jinho Yang et al. also found that S. aureus, A. baumannii, E. cloacae, and P. aeruginosa predominantly affected the progress of COPD and asthma diseases, which were the most abundant organisms at the genetic expression level. In addition, there were diagnostic values of 0.73 and 0.78 of AUC in asthma and COPD, independently (Yang et al., 2020). The microbial community of the human respiratory tract can exist in the mouth, the nose, the upper respiratory tract, and the lungs. Pulmonary microenvironment often changes following the breathing movement, which causes the lungs to have direct communication with the outside environment, thus, in turn, the microbial community of the whole respiratory system was also changed (Budden et al., 2019). Previous investigation found that lower respiratory tract infection caused an acute exacerbation in 82% of COPD patients (Choi et al., 2013). The infections’ progress was approximately caused by bacteria such as Haemophilusinfluenzae, Moraxella catarrhalis, Streptococcus pneumoniae, Pseudomonasaeruginosa, and so on. Meanwhile, a virus caused aggravation of the lung disease, such as primarily human Rhinovirus (HRV), Influenza virus, Coronavirus, and respiratory syncytial virus (RSV) (Bouquet et al., 2020). Also many investigations reported that bacteria caused secondary bacterial lung infection (Lu et al., 2017), which included Haemolyticus, Streptococcus pneumoniae, nonliquefaciens, Haemophilus, Filifactor, Megasphaera, and so on. All of these showed a significant difference in abundance between the H7N9 and HC groups, with diagnostic AUC values of >0.70.
Traditionally, diagnostics for the detection of potentially pathogenic viruses and bacteria cover only some pathobionts and discriminate poorly between patients and healthy subjects, or are time consuming, for example, pneumonia and respiratory tract infections. If a microbiota-based diagnostic or classification tool could improve accuracy and timely diagnosis for diseases, it would have major implications for clinical treatment. There are numerous studies on microbiota biomarkers related to lung diseases, and the diagnostic value of potential microbial markers in lung diseases has also been analyzed (Agbetile et al., 2012; Bafadhel et al., 2014; May et al., 2015; Lu et al., 2017; Man et al., 2019; Yang et al., 2020). However, the small sample size in the included studies limited the interpretation of diagnostic value of these microbiota biomarkers. In order to systematically describe the potential diagnostic value of microbial markers in lung diseases, we systematically searched the literature database and performed the present meta-analysis. Studies were included following the inclusion and exclusion criteria. Then we extracted data from these studies. Diagnostic indicators including SEN, SPE, DLR+, DLR-, and AUC were calculated, which followed by sensitivity analyses and publication bias assessment.
Materials and Methods
The present meta-analysis was guided by the Preferred Reporting Items for Systematic Reviews and Meta-Analysis (PRISMA) guidelines (Moher et al., 2009).
Search Strategy
Two authors independently conducted the literature search in PubMed, Web of Science, EMbase, PMC, Google Scholar, Cochrane Library, the Chinese National Knowledge Infrastructure (CNKI), and the Chinese Biomedical Literature Database (CBM). The literature was limited to studies in English or Chinese published before March 3, 2021. The following key terms were used for the search: “lung microbiota”, “lung microbiome”, “respiratory microbiome”, “bacteria”, “COPD”, “asthma”, “respiratory infection diseases”, “diagnosis”, “diagnostic value”, “sensitivity”, “specificity”, “AUC”, and “ROC”. Articles in the references were also searched to avoid missing the relevant studies.
Inclusion and Exclusion Criteria
Searched articles were included if they met the following criteria: (1) included all types of respiratory infectious diseases, or COPD, or asthma; (2) the diagnosis of these diseases was clinically confirmed according to the diseases guidelines; (3) the study included healthy individuals as a control group; (4) lung microbiota or lung microbiome for the diagnosis of lung diseases were evaluated; (5) case group size, control group size, and sensitivity and specificity were provided; (6) the language was limited to Chinese or English. Studies were excluded with the following characteristics: (1) case reports, comments, review articles; (2) repeated studies; (3) insufficient data to calculate the sensitivity and specificity; and (4) studies not related to the topics.
Data Extraction and Quality Assessment
The following data was retrieved by two authors from the included studies: first author, publication year, country, sample characteristic, sample source, detection content and microbiome detection method, the case and control size, and the true-positive (TP), false-positive (FP), true-negative (TN), and false-negative (FN) value. If the included studies did not provide detailed data, TP, FP, TN, and FN would be calculated based on the sensitivity, specificity, and the sample’s size. If there was any inconsistency, the third researcher checked and resolved.
The Quality Assessment of Diagnostic Accuracy Studies 2 (QUADAS-2) tool was used to assess the quality of the included studies in RevMan 5.3 software (Whiting et al., 2011). The QUADAS-2 included patient selection, index test, reference standard, and flow and timing, including 14 questions about the risk of bias of the included article. The quality of the literature was also independently assessed by two authors.
Statistical Analysis
The present meta-analysis was conducted by using Stata 12.0 (Stata Corporation, College Station, TX), RevMan 5.3 (https://community.cochrane.org/help/tools-and-software/revman-5) and Meta-DiSc 1.4 (XI Cochrane Colloquium, Barcelona, Spain) software. Diagnostic indicators, including the pooled SEN, SPE, and its related DLR+, DLR-, and DOR were calculated using a random effect model (Reitsma et al., 2005). The summary receiver operator characteristic (SROCs) curves and the pooled area under the curve (AUC) values with the related corresponding 95% confidence intervals (CIs) were also calculated (Hamza et al., 2009). In addition, the Higgin’s I2 and Cochran’s Q tests were also performed during this analysis (Higgins et al., 2003). Deeks’ funnel plot was used to determine publication bias. Fagan’s nomogram was generated to evaluate the post-test probability. It was considered significantly different when P value was <0.05.
Results
Characteristics and Quality of the Included Studies
After the literature search, 334 articles were obtained from the online databases. Then, 169 articles were removed because of duplication. Then, 132 articles were excluded because they did not meet the inclusion criteria. After reading the full text, we removed another 27 articles that lacked detailed data to calculate TP, FP, TN, or FN values. Finally, 6 articles were included in this meta-analysis. The detailed literature selection procedure is shown in Figure 1.
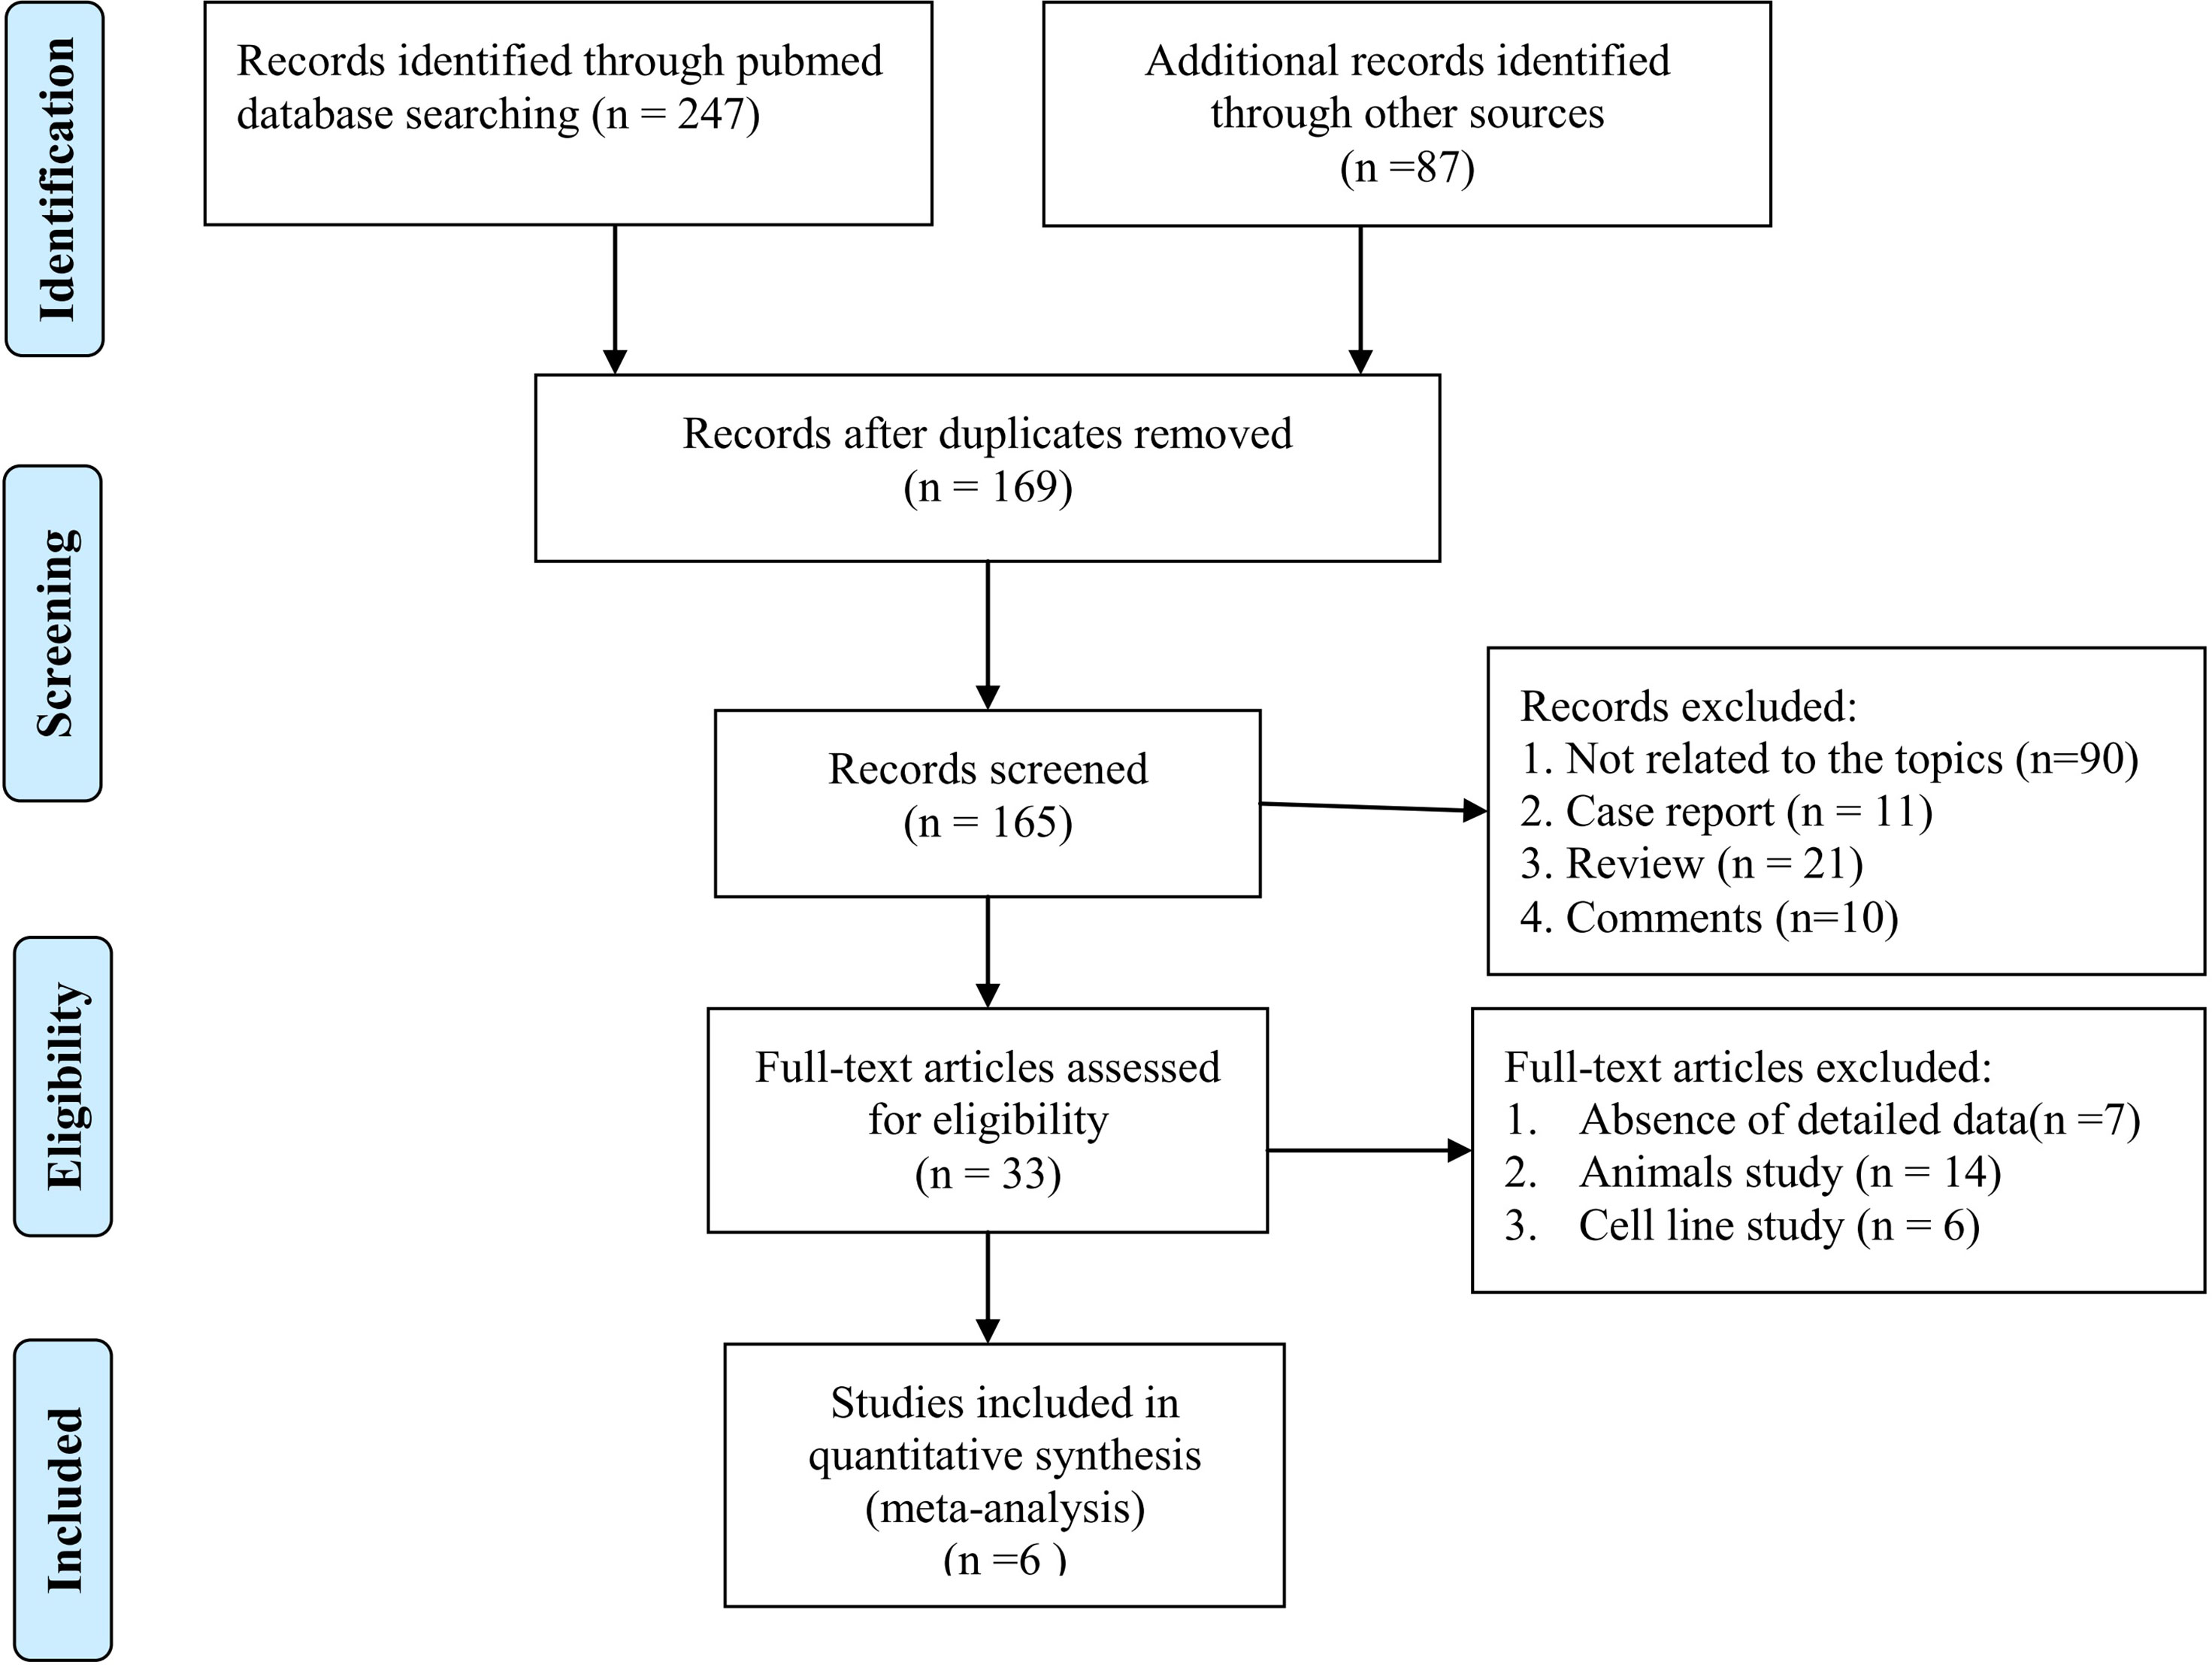
Figure 1 Flowchart of studies for selecting process from databases.
The characteristics of the patients and health subjects as well as the included studies are shown in Table 1. This meta-analysis collected 1347 individuals (873 patients and 474 healthy individuals) involving a total of 26 comparisons. The publication year of the included studies ranged from 2012 to 2020, and were conducted in U.K., U.S., Korea, Netherlands, and China. The lung microbiome sources included nasopharyngeal swab, oropharyngeal swab, sputum, BAL fluid, and serum samples. DNA was extracted from the microbiome and quantitative reverse transcription polymerase chain reaction (qRT-PCR) was used to detect the content of each microbiome. The number of case and control group of each study ranged from 10 to 306, and the respiratory diseases included ventilator-associated pneumonia, asthma, COPD, lower respiratory tract infections, and secondary bacterial lung infection. In addition, Addison et al. showed seven kinds of bacteria in lung microbiota (May et al., 2015). Lu et al., (2017) showed 13 kinds of bacteria in lung microbiota. Yang et al. and others reported five kinds of bacteria (A. fumigatus, S. aureus, A. baumannii, E. cloacae, P. aeruginosa) in the diagnosis of COPD and asthma (Agbetile et al., 2012; Yang et al., 2020). Man et al. found that Haemolyticus, Streptococcus pneumoniae, and Nonliquefaciens showed potential diagnostic value in lower respiratory tract infections (Man et al., 2019).
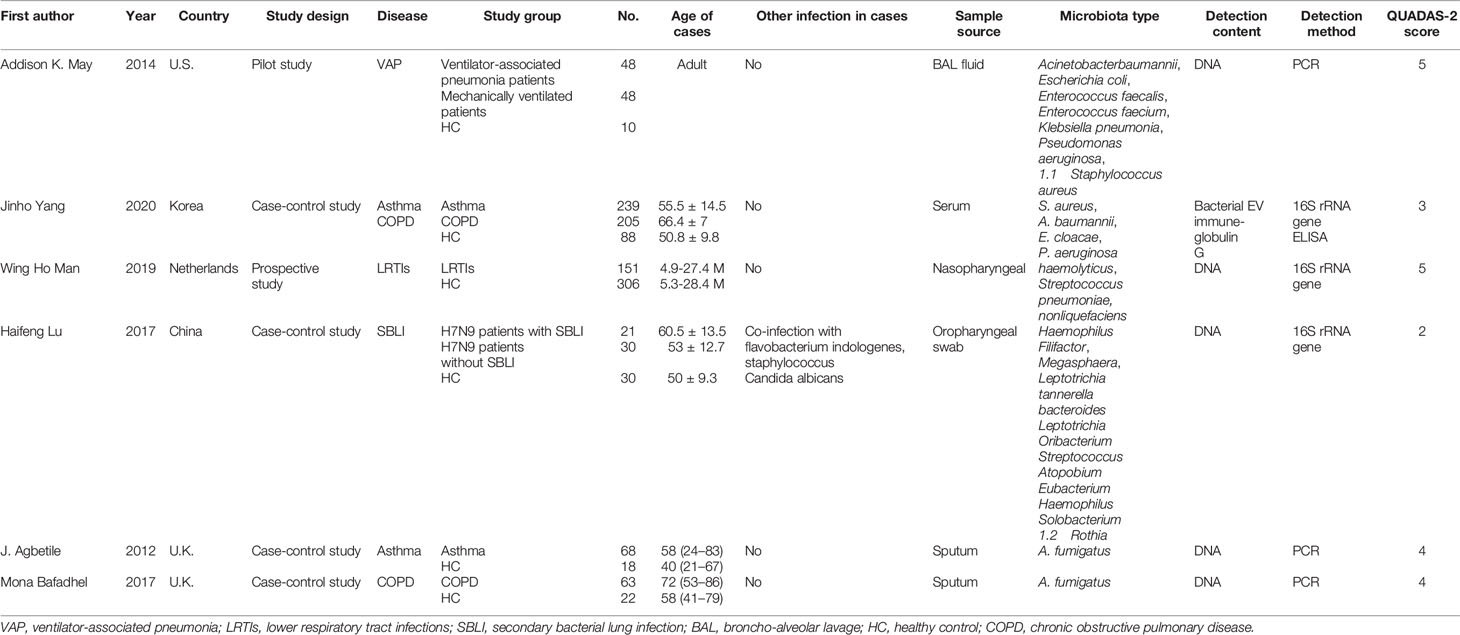
Table 1 Characteristics of the included studies.
As shown in Supplementary Figure 1, the results of the QUADAS-2 study quality assessment indicated that the quality of the included studies was convincing. The quality scores by the QUADAS-2 tool are summarized in Table 1. There are four included studies with a score ≥ 4, and two included studies with a score ≤ 4. Therefore, we included two poor quality studies and four better quality studies.
Diagnostic Performance
The pooled diagnostic effect of these 26 comparisons was evaluated by a random effects model. The values of the pooled SEN and SPE are shown in Figure 2. The pooled SEN was 0.90 (95% CI: 0.83-0.94, I2 = 88.64%, P<0.05) and the pooled SPE was 0.89 (95% CI: 0.76-0.95, I2 = 91.10%, P<0.05). Figure 3 illustrates the values of the pooled DLR+ and DLR-. The pooled DLR+ was 7.86 (95% CI: 3.39-18.21, I2 = 90.24%, P<0.05) and the pooled DLR- was 0.12 (95% CI: 0.06-0.21, I2 = 89.92%, P<0.05). The DOR value was 22.54 (95% CI: 12.83-39.59, I2 = 76.4%, P<0.05; Figure 4A) and the AUC was 0.95 (95% CI: 0.93-0.97; Figure 4B). These findings described that lung microbiota biomarkers played an important role in diagnosis of lung diseases. But the Cochran’s Q values suggested significant heterogeneity during the analysis.
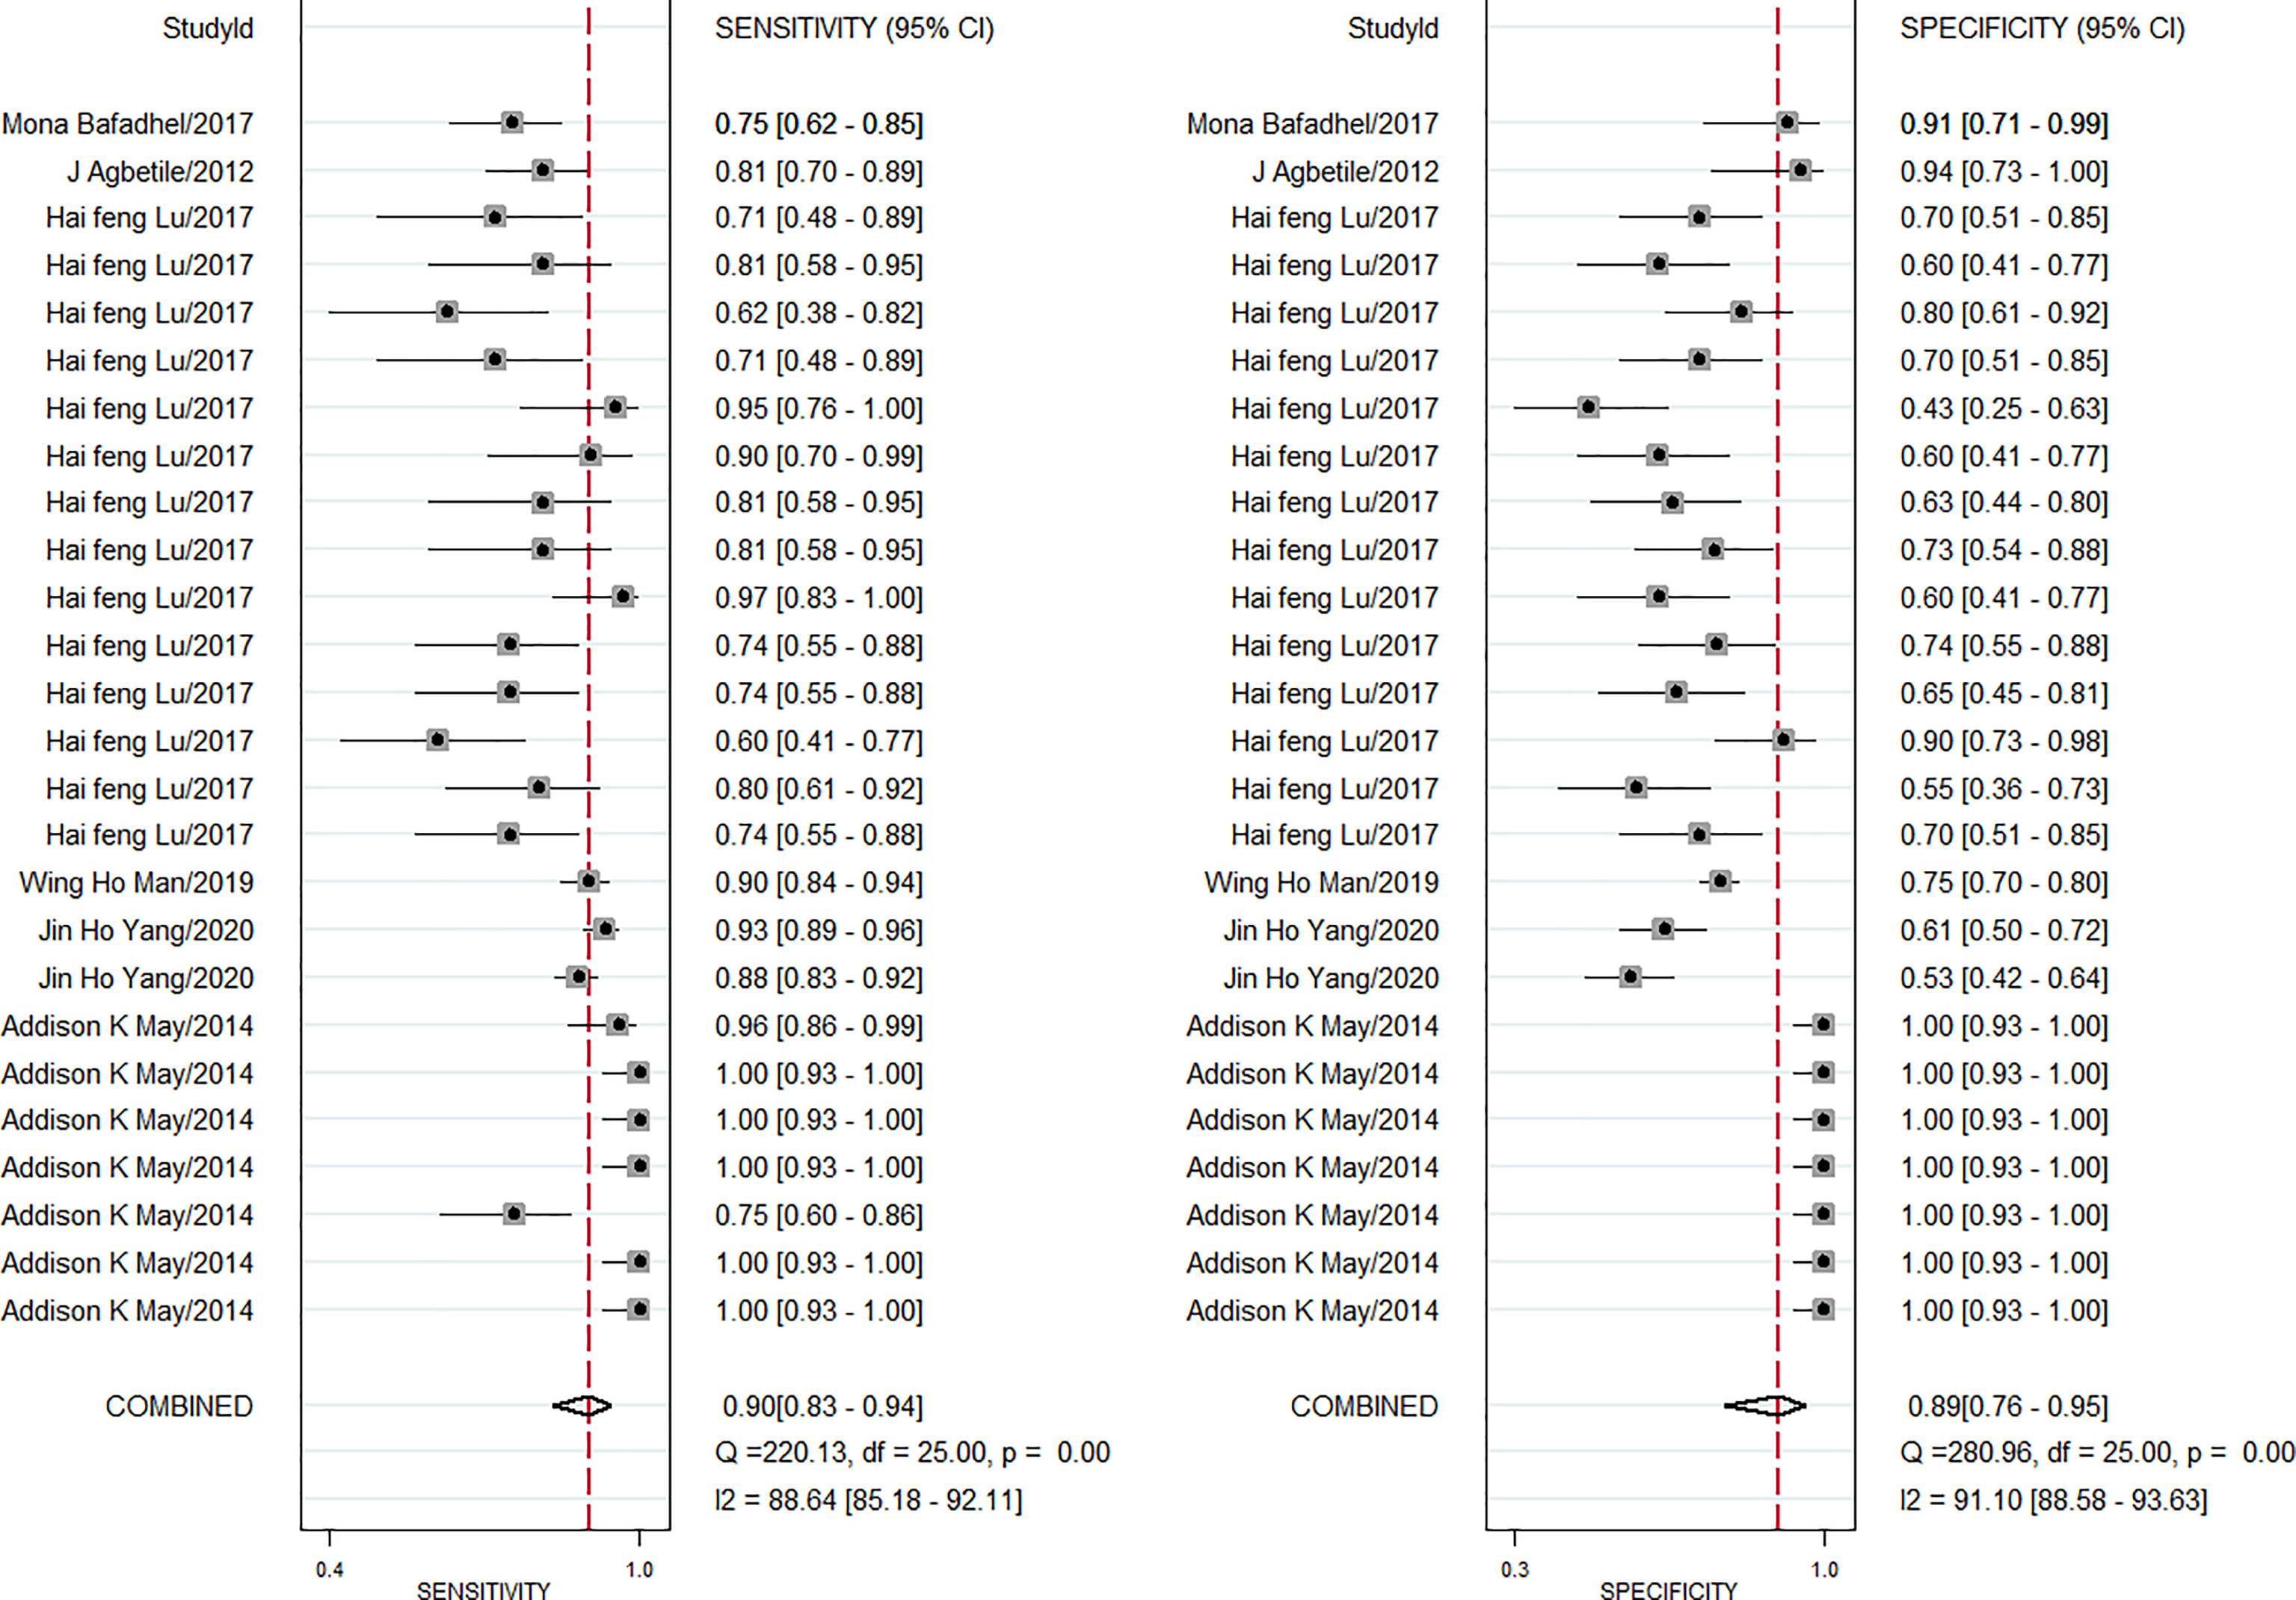
Figure 2 Forest plot of sensitivity and specificity of microbiota biomarkers for the diagnosis of lung diseases.
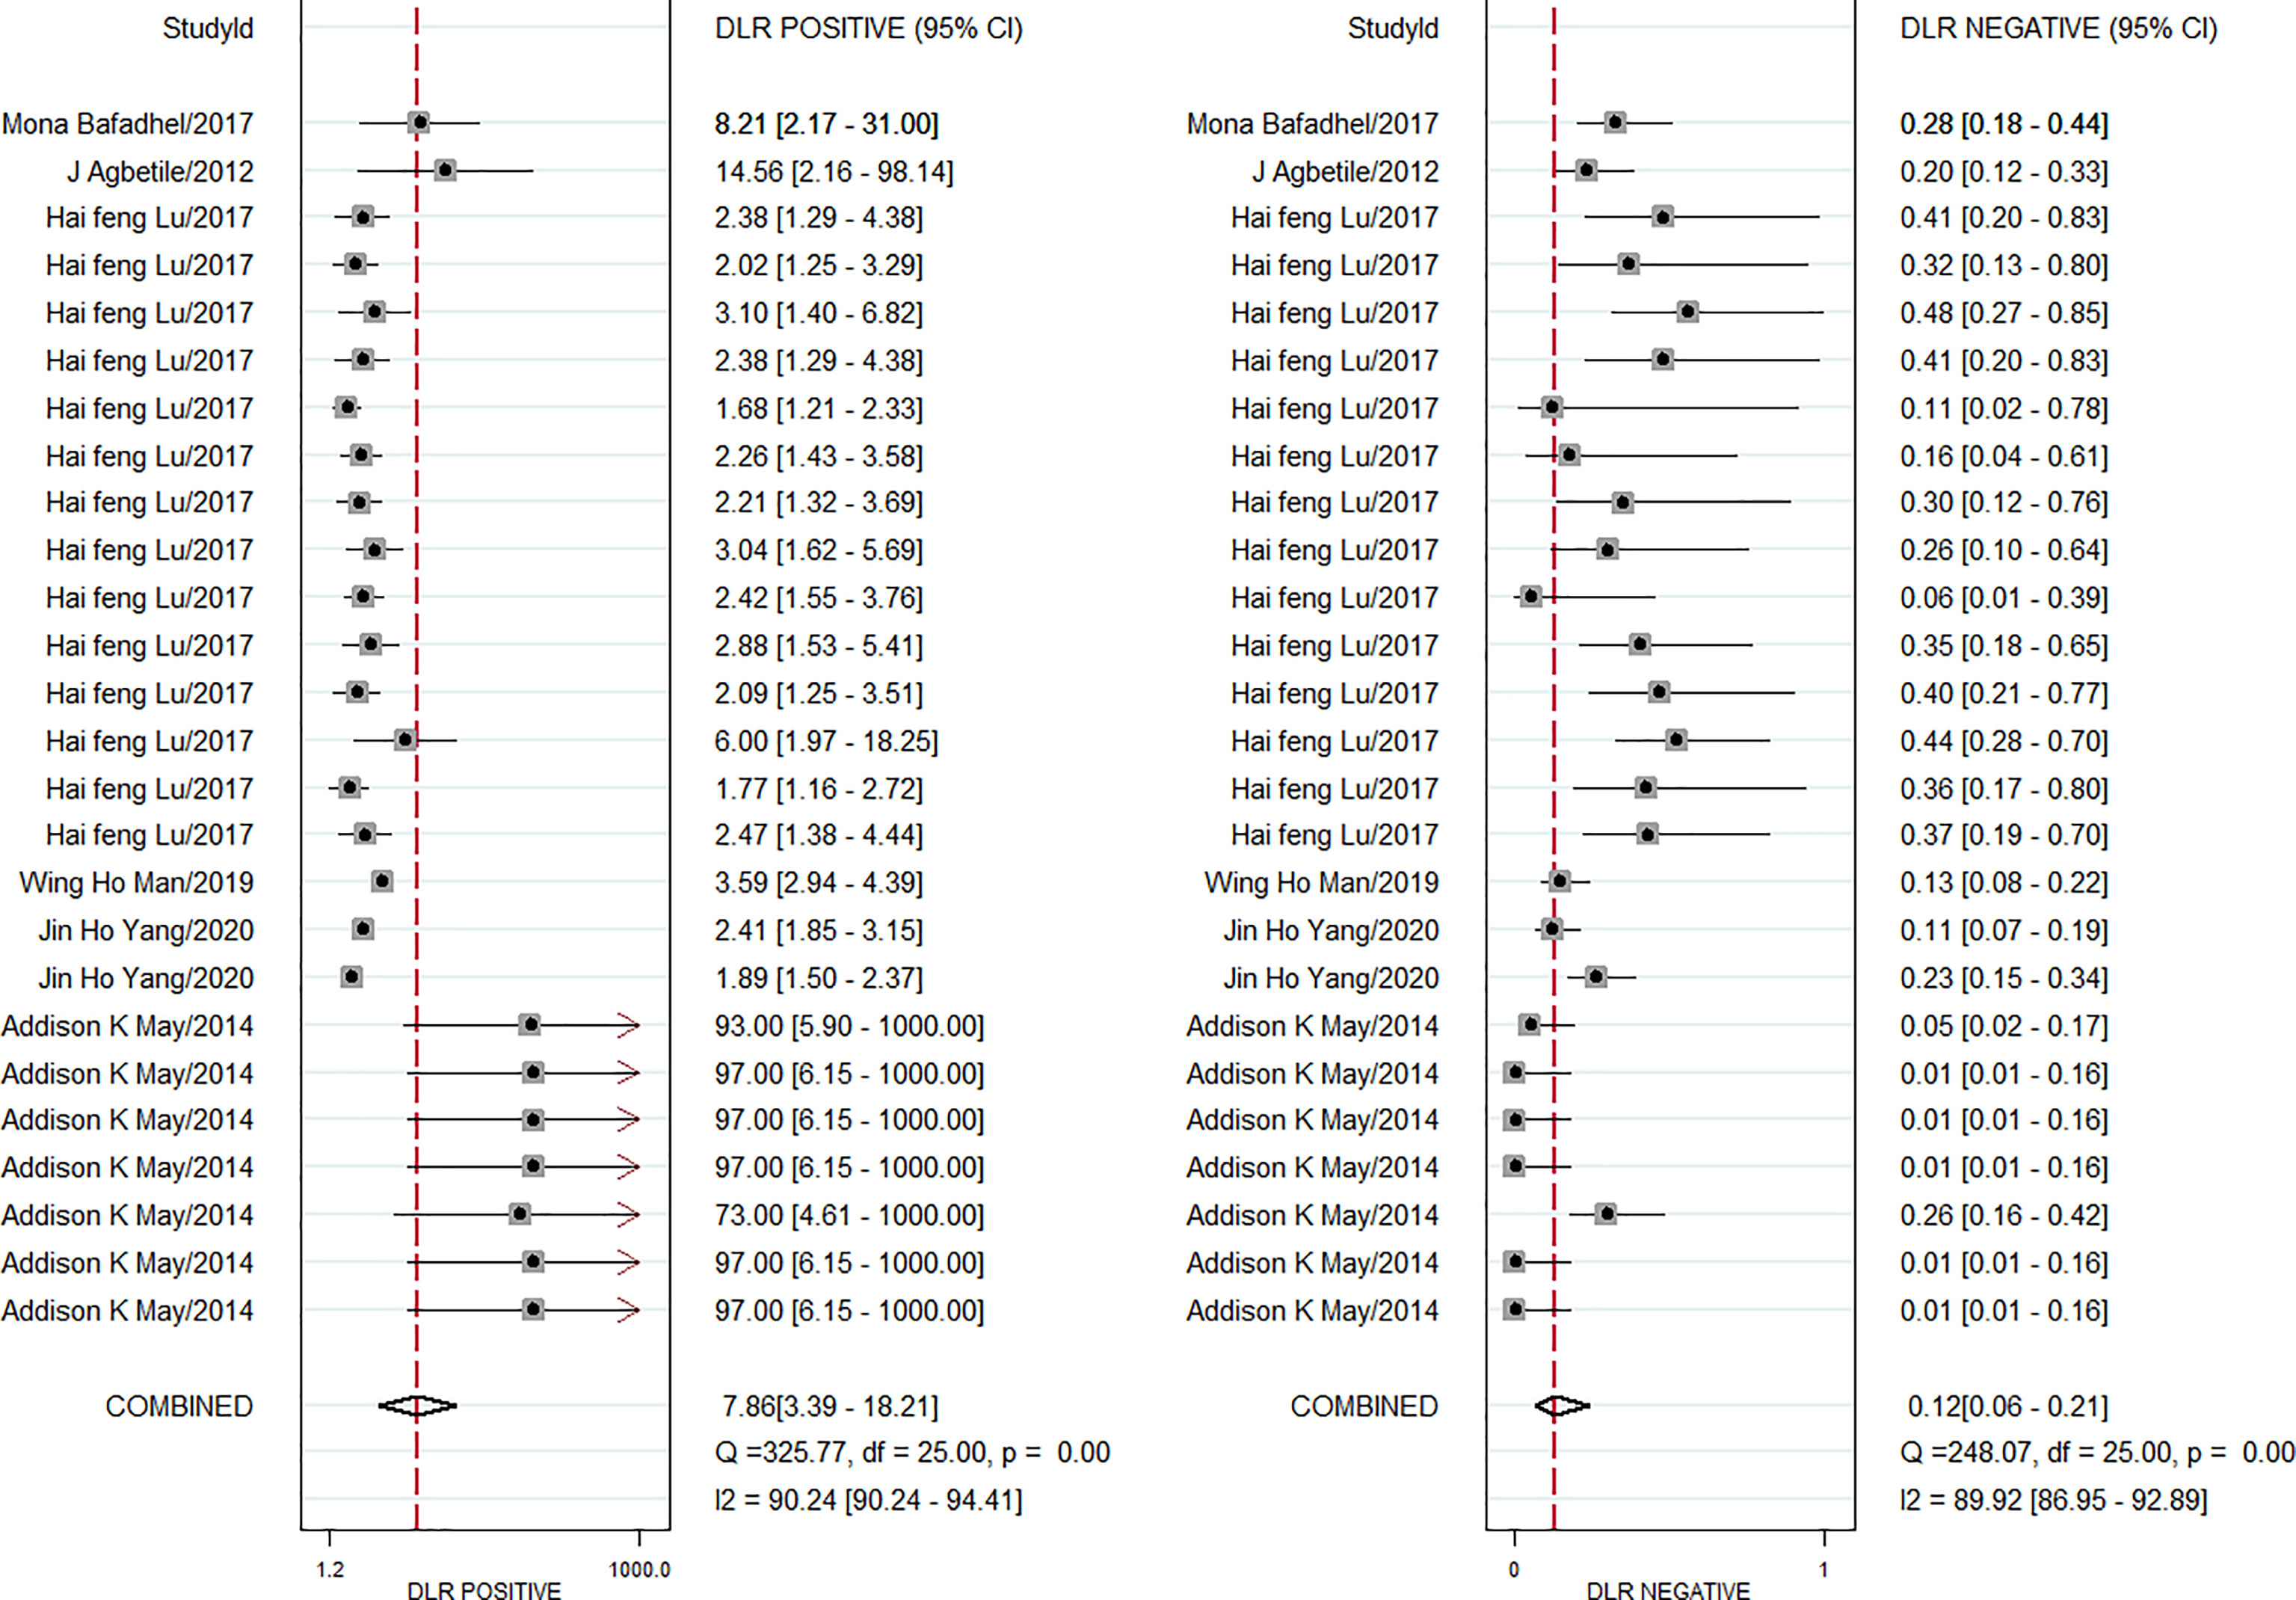
Figure 3 Forest plot of DLR+ and DLR− of microbiota biomarkers for the diagnosis of lung disease.
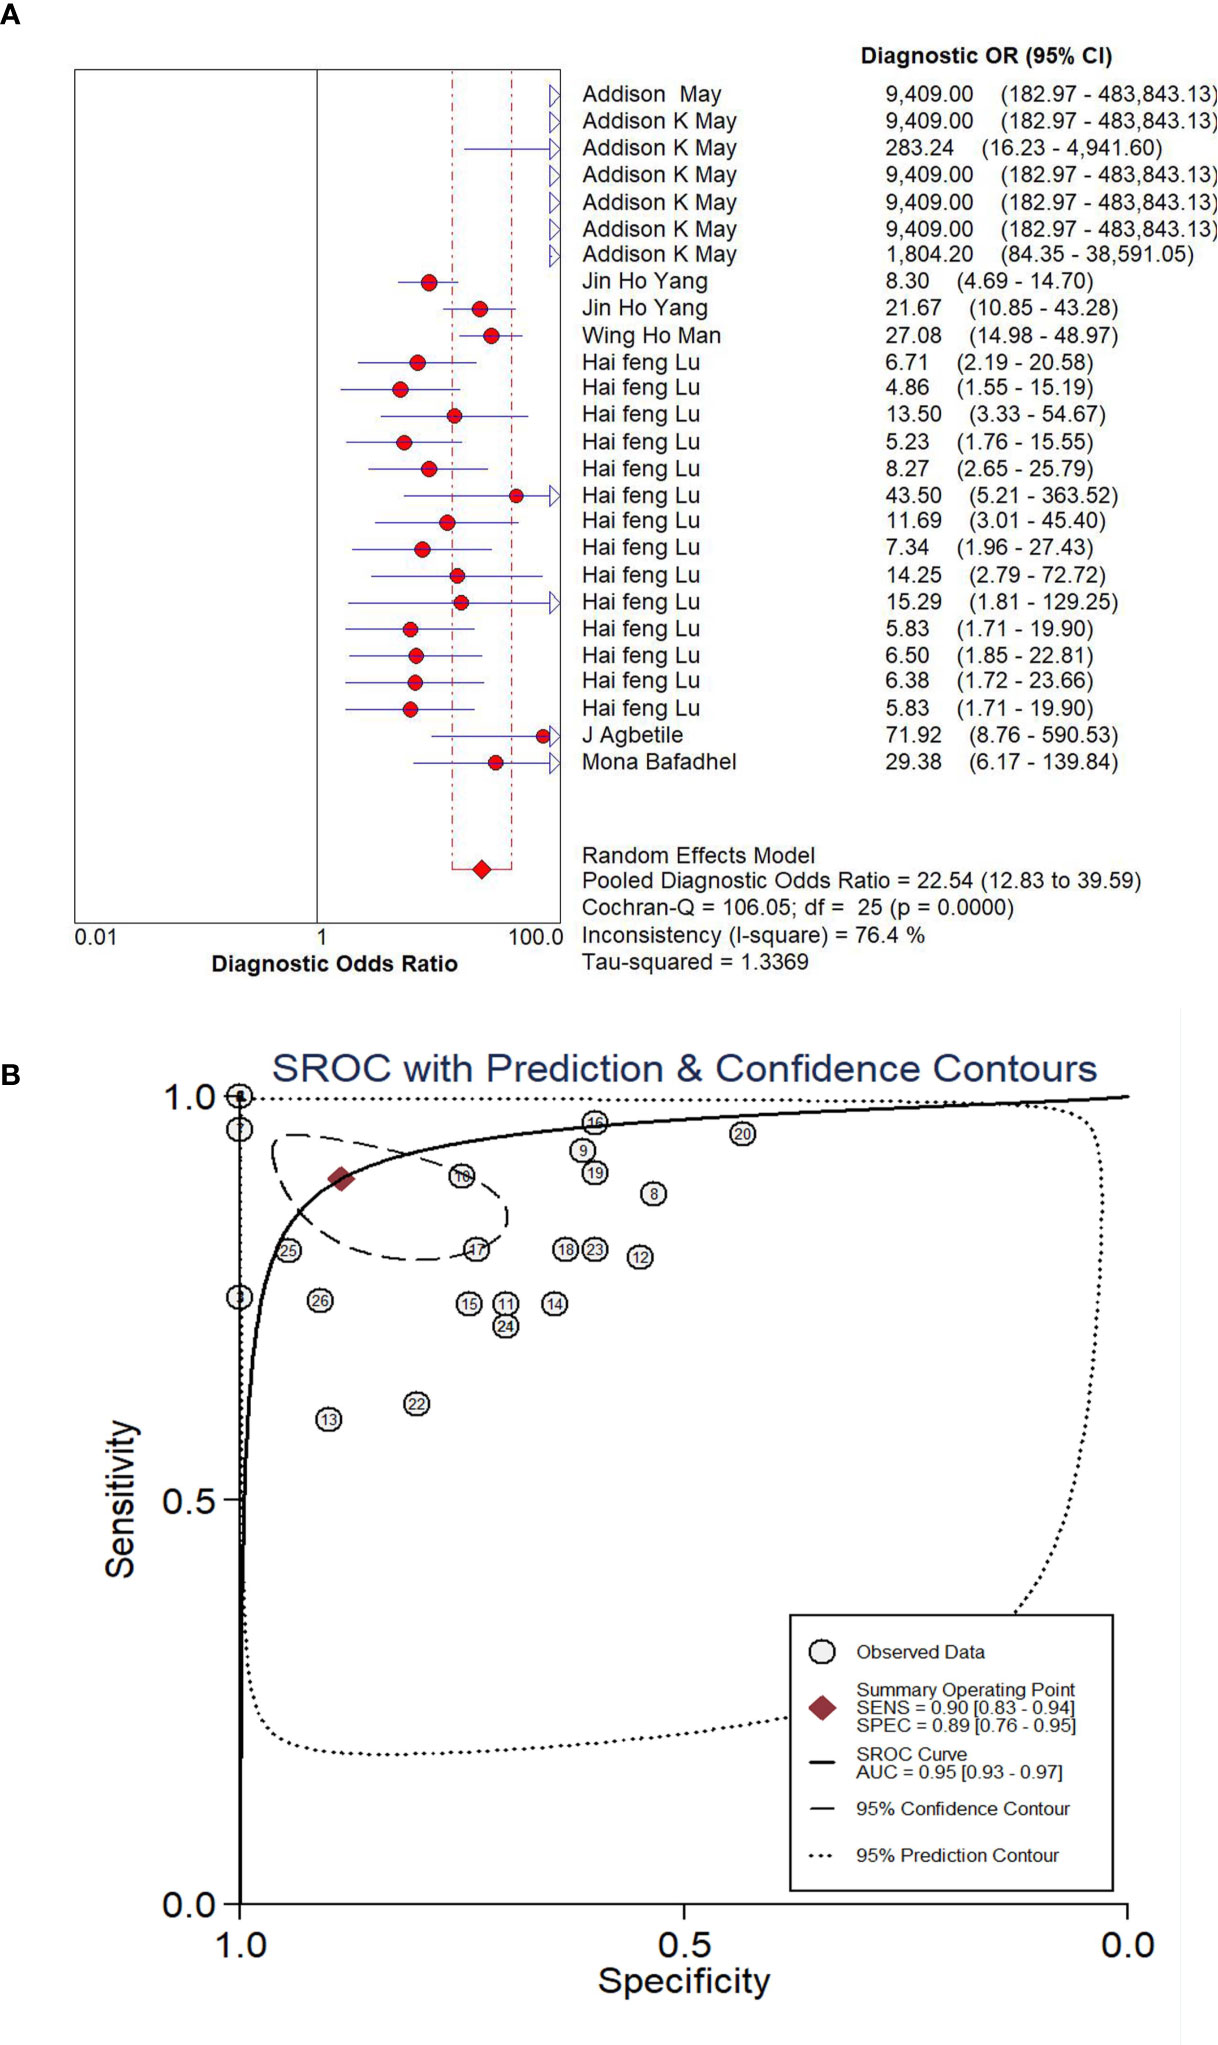
Figure 4 Forest plot of DOR (A) and SROC (B) of microbiota biomarkers for the diagnosis of lung disease.
The Assessment of Heterogeneity
The heterogeneity analysis across studies was used for the Cochran Q and I2 tests. Results showed that the Cochran Q was 69.923 (p < 0.05) and I2 value was 97 (95% CI, 95–99). The Cochran Q and I2 values of sensitivity were 220.13 (p < 0.05) and 88.64 (95% CI, 85.18-92.11), respectively. The Cochran Q and I2 values of specificity were 280.96 (p < 0.05) and 91.10 (95% CI, 88.58–93.63) (Figure 2), respectively. Therefore, the results suggested that there was significant heterogeneity between the included studies. Then, subgroup analysis was conducted to explore the potential heterogeneity. The ethnicity (Caucasian or Asian), age of case subjects (children, adult, and old population), detection method (PCR or ELISA), sample source (BAL fluid, serum, mouth), type of lung disease (pneumonia, lung infection, COPD, asthma) were used as covariates to perform the subgroup analysis using Meta-disc 1.4 software. As shown in Table 2, in the subgroup based on ethnicity, lung microbiota markers had higher diagnosis ability for Caucasian than for Asian populations, which was with higher sensitivity (0.91 vs. 0.86), specificity (0.99 vs. 0.68), and AUC (0.99 vs. 0.81) in the Caucasian population. In the analysis of lung microbiota source, microbiota isolated from BAL fluid seemed to be the optimal source because of its high sensitivity, specificity, and AUC, which were 0.96, 0.99, and 0.99, respectively. However, we also obtained a significant diagnostic value from the mouth microbiota, which was 0.81 of AUC. For the subgroup based on the detection method of lung microbiota, we found differences between PCR and ELISA detection. Sensitivity (0.86), specificity (0.80), and AUC (0.93) were shown with good diagnostic values in the PCR method. Moreover, the distinctions between different lung diseases in microbiota markers extracted from six studies were also performed. The comparison showed a series of good sensitivity (0.96, 0.81, 0.89, and 0.86) for pneumonia, lung infections, COPD, and asthma, but a poor specificity (0.70, 0.67, 0.60) for lung infections, COPD, and asthma. However, there were only two comparisons during subgroup analysis, and we could not obtain an effective AUC value, which may also limit the interpretation of our results.
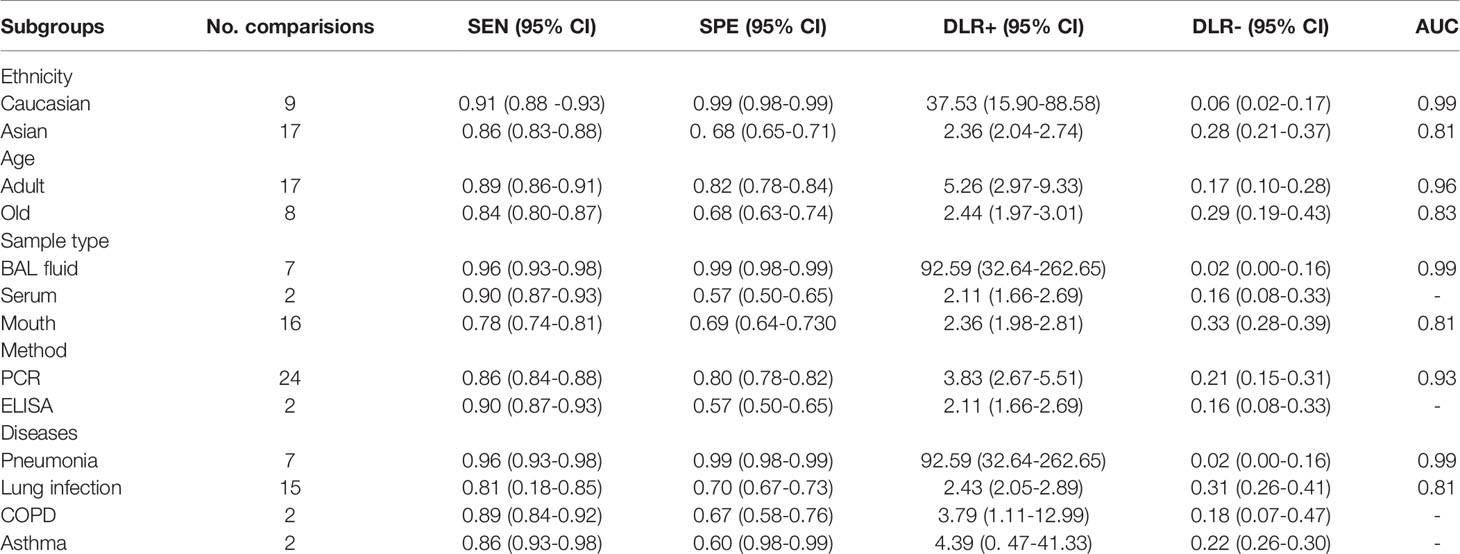
Table 2 Results of subgroup analysis in diagnostic meta-analysis.
Clinical Diagnostic Value of Lung Microbiota Biomarkers in Lung Diseases
To illustrate the diagnostic value of lung microbiota markers in lung diseases, we performed the Fagan nomogram analysis. As shown in Figure 5A, the prior probability, likelihood ratio, and post-probability were 20%, 8, and 66%, respectively. In addition, shown as Figure 5B, when the upper left limit LRP was >10 and the LRN < 0.1 in the likelihood ratio dot plot, it was confirmed and excluded, for example, the comparison of 7. When LRP was > 10 and the LRN was also > 0.1, it was confirmed only, for example, the comparison of 3 and 25. When LRP was < 10 and the LRN was also <0.1, it was excluded only, for example, the comparison of 16. When LRP was < 10 and the LRN was also > 0.1, there was no exclusion and confirmation. In conclusion, it is reliable basically and the microbiota could play the potential biomarkers in the diagnosis of lung diseases.
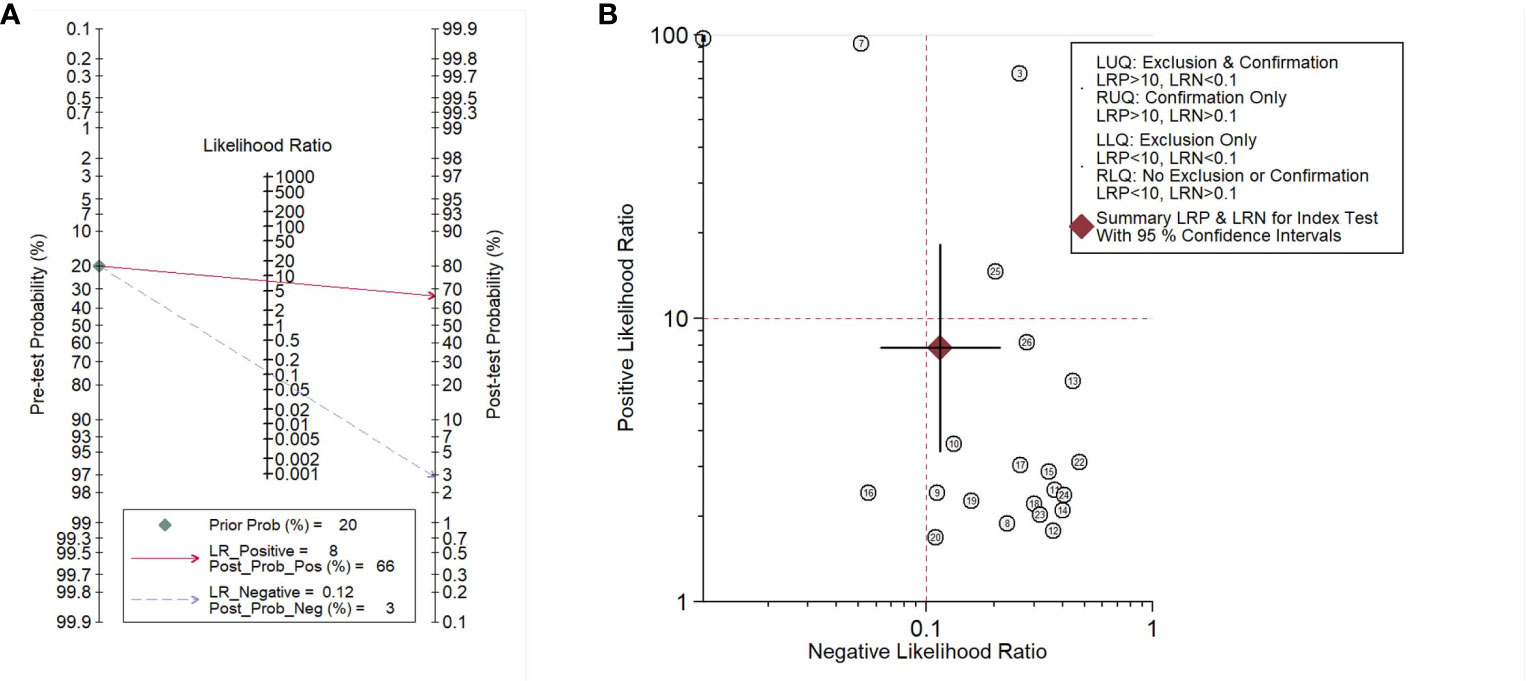
Figure 5 Fagan’s nomogram assessing (A) and dot plot of negative likelihood ratio (B) of microbiota biomarkers for the diagnosis of lung disease.
Sensitivity Analysis and Publication Bias
As shown in Figure 6A, influence analysis indicated that six comparisons were out of the limit. However, after removing the six comparisons, the diagnostic parameters were changed but comparable (sensitivity: 0.83 vs. 0.90; specificity: 0.72 vs. 0.89; AUC: 0.86 vs. 0.95). Therefore, the analysis results were basically reliable. An analysis of publication bias was also performed. As shown in Figure 6B, the P value was 0.94 in Deek’s funnel plot, which suggested that there was no publication bias.
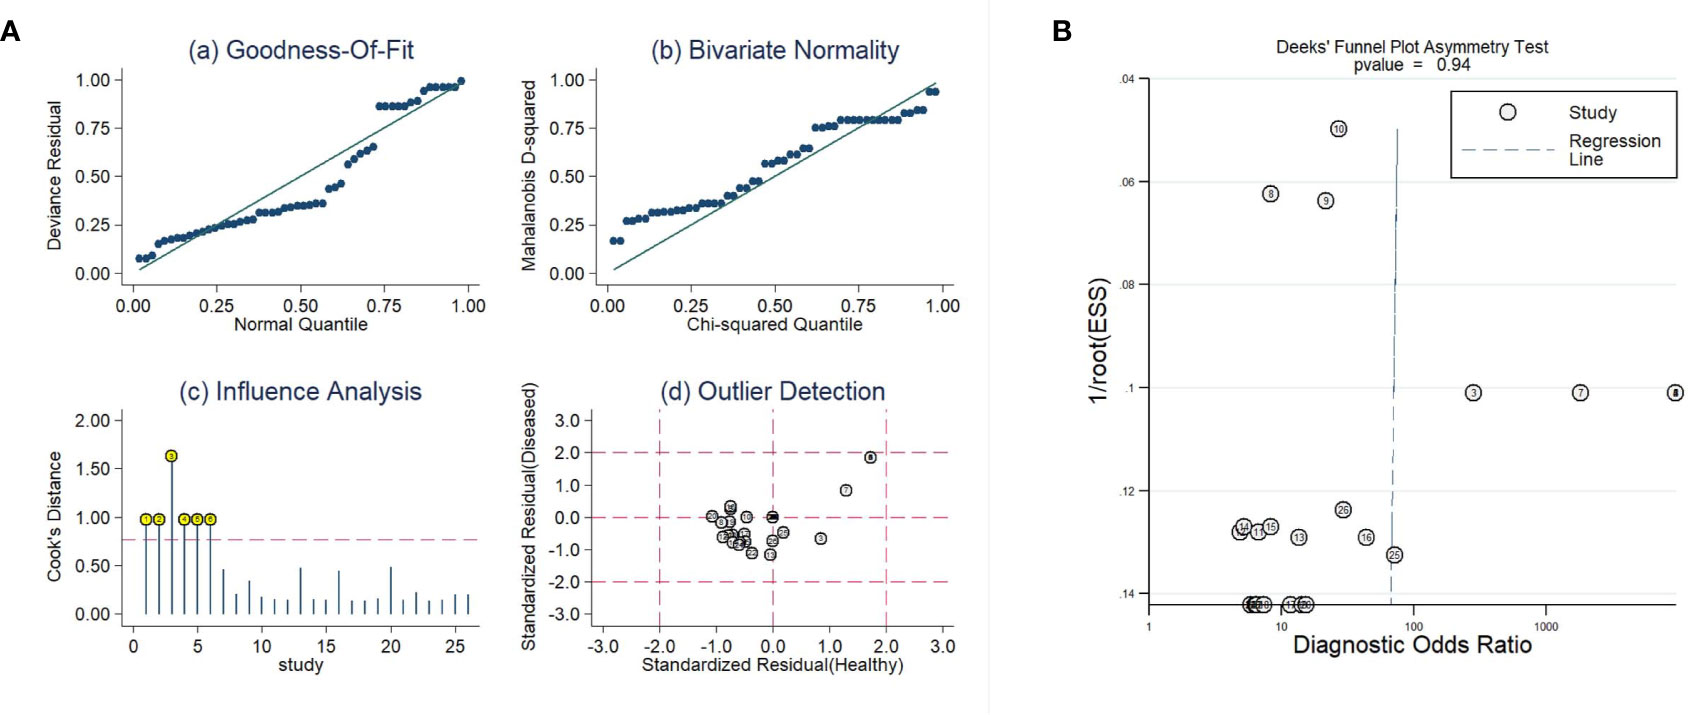
Figure 6 The sensitivity analysis (A) and Deeks’ funnel plot asymmetry test (B) of this meta-analysis.
Discussion
There have always been controversies whether potential microbiota biomarkers could be applied in several lung diseases. Therefore, we present an integrative meta-analysis to illustrate the diagnostic role of potential microbiota biomarkers in COPD and asthma as well as lung infection diseases. Six eligible articles including 26 comparisons were enrolled in the present study. The pooled sensitivity in six studies was 0.90 (95% CI, 0.83-0.94) and the pooled specificity was 0.89 (95% CI, 0.76-0.95). The pooled DLR+ in six studies was 7.86 (95% CI, 3.39-18.21) and the pooled DLR- was 0.12 (95% CI, 0.06-0.21). The AUC was 0.95 (95% CI, 0.93-0.97). Our findings indicate that microbiota biomarkers can be novel biological molecules in the diagnosis of lung diseases. According to the results of this analysis, the reproducibility of the Acinetobacter baumannii, Escherichia coli, Enterococcus faecalis, and so on, in segregating lung diseases patients vs. controls implicated the possibility of microbiota markers for lung diseases diagnostics.
There are multiple kinds of diagnostic biomarkers clinically used in lung diseases, for example, circulating tumor DNA (ctDNA), circulating tumor cells, microRNA, and lncRNAs. Previous reports illustrated that patients with lung cancer who had detectable ctDNA presented a higher risk of recurrence (Lee et al., 2019). Lee et al. also showed that miR-1248 played an up regulator to increase the expression of IL-5 in asthma patients and was a potential useful diagnostic indicator for asthma disease (Panganiban et al., 2012). Another previous study suggested that IL-8 was highly sensitive and vascular endothelial growth factor (VEGF) was highly specific, which had been used in the diagnosis of asthma-COPD overlap syndrome (Ding et al., 2020). Thymic stromal lymphopoietin (TSLP), thymus and activated chemokine (TARC), and IL-8 had also been used in the diagnosis of antifungal treatment of patients with asthma-induced ABPA (Kozlova et al., 2020). In addition, extracellular vesicles (EVs), one kind of novel intercellular transporter, had also been confirmed in the role of diagnostic value in COPD, cystic fibrosis (CF), asthma, and lung cancer (Trappe et al., 2021).
Compared with traditional biomarkers such as IL-5, TSLP, and TARC, microbiota biomarkers also represent a vital role in the development and progress of lung diseases. For instance, Mycobacterium species combined with a specific bacterial community contributed the onset, progression, recurrence, and outcome of pulmonary tuberculosis. R. mucilaginosa, the predominant bacterial community of the upper respiratory tract, led the occurrence of pneumonia and bacteremia in patients that were immunocompromised (Maraki & Papadakis, 2015). These bacteria had also been found to have a diagnostic role in pulmonary tuberculosis (Hong et al., 2018). In addition, Veillonella, Megasphaera, and Streptococcus presented a remarkably higher content in lung cancer patients than in healthy individuals. Similarly, Neisseria, Staphylococcus, and Dialister showed a higher level in lung cancerous lesions than in normal lung tissues (Ran et al., 2020). However, different from the present study, one report found that Proteobacteria, Actinobacteria, and Firmicutes predominantly promoted the development of COPD by contributing the biosynthesis of palmitate, homocysteine, and urate (Wang et al., 2020). Although several novel microbiology biomarkers had been described as having a diagnostic role in lung diseases, it still needs to be further confirmed by larger-scale clinical studies.
In the present study, the included literature usually involved processing of 16S rRNA amplicon sequencing or PCR method to detect the abundance or expression level of microbiome. However, there are several limitations. First, the lung microbiota community was different because of the differences of ethnicity, nationality, and geographical location, which may induce the deviation in different investigations. Second, further replication in large population-based studies is necessary to confirm these results, which should be in the same population (COPD, asthma, or other disease) with the same kind of sample because it is totally different to compare the microbiome from the lungs to that from the upper tract respiratory. Therefore, the correlation between lung microbiology biomarkers and clinical application should be cautiously interpreted. Third, samples in the included studies were different from each one, which may generate inter-study heterogeneity. In the meantime, although subgroup analysis based on ethnicity, age, sample type, method, and disease differences was conducted, COPD and asthma were with only two comparisons, which may also decrease the diagnostic value of lung microbiome markers for these two lung diseases. Last, our analysis only included the bacterial microbiome; however, virome was also a key composition of the lung microbial community which had obtained less attention.
In conclusion, as a type of special marker, microbiota could be a promising indicator for the diagnosis of lung disease. Our results provide essential data to confirm this point. However, it is still difficult to identify the different stages of the disease through the biomarker’s expression values. Therefore, further studies are needed to define the expression values for diagnosis of lung diseases. In the future, more research needs to focus on the diagnosis of lung diseases using novel bacteria biomarkers, which could be used to conduct a more sensitive and accurate biomarker system for the diagnosis of lung diseases.
Data Availability Statement
The original contributions presented in the study are included in the article/Supplementary Material. Further inquiries can be directed to the corresponding authors.
Author Contributions
RR and CS designed the study, performed the meta-analysis, and wrote the draft. QW performed the literature search. XMD and XYD extracted the data and processed the raw data. XMD also designed the study and wrote the manuscript. XL contributed to the revised manuscript. All authors contributed to the article and approved the submitted manuscript.
Funding
This work was supported by the Health Bureau of Jiangsu Province (Z2020054) and the Health Bureau of Zhejiang Province (2020KY383).
Conflict of Interest
The authors declare that the research was conducted in the absence of any commercial or financial relationships that could be construed as a potential conflict of interest.
Publisher’s Note
All claims expressed in this article are solely those of the authors and do not necessarily represent those of their affiliated organizations, or those of the publisher, the editors and the reviewers. Any product that may be evaluated in this article, or claim that may be made by its manufacturer, is not guaranteed or endorsed by the publisher.
Supplementary Material
The Supplementary Material for this article can be found online at: https://www.frontiersin.org/articles/10.3389/fcimb.2021.709634/full#supplementary-material
References
Agbetile, J., Fairs, A., Desai, D., Hargadon, B., Bourne, M., Mutalithas, K., et al. (2012). Isolation of Filamentous Fungi From Sputum in Asthma Is Associated With Reduced Post-Bronchodilator FEV1. Clin. Exp. Allergy 42 (5), 782–791. doi: 10.1111/j.1365-2222.2012.03987.x
Ahearn, C. P., Gallo, M. C., Murphy, T. F. (2017). Insights on Persistent Airway Infection by non-Typeable Haemophilus Influenzae in Chronic Obstructive Pulmonary Disease. Pathog. Dis. 75 (4), ftx042. doi: 10.1093/femspd/ftx042
Bafadhel, M., McKenna, S., Agbetile, J., Fairs, A., Desai, D., Mistry, V., et al. (2014). Aspergillus Fumigatus During Stable State and Exacerbations of COPD. Eur. Respir. J. 43 (1), 64–71. doi: 10.1183/09031936.00162912
Bouquet, J., Tabor, D. E., Silver, J. S., Nair, V., Tovchigrechko, A., Griffin, M. P., et al. (2020). Microbial Burden and Viral Exacerbations in a Longitudinal Multicenter COPD Cohort. Respir. Res. 21 (1), 77. doi: 10.1186/s12931-020-01340-0
Budden, K. F., Shukla, S. D., Rehman, S. F., Bowerman, K. L., Keely, S., Hugenholtz, P., et al. (2019). Functional Effects of the Microbiota in Chronic Respiratory Disease. Lancet Respir. Med. 7 (10), 907–920. doi: 10.1016/S2213-2600(18)30510-1
Choi, K. J., Cha, S. I., Shin, K. M., Lee, J., Hwangbo, Y., Yoo, S. S., et al. (2013). Prevalence and Predictors of Pulmonary Embolism in Korean Patients With Exacerbation of Chronic Obstructive Pulmonary Disease. Respiration 85 (3), 203–209. doi: 10.1159/000335904
Ding, Q., Sun, S., Zhang, Y., Tang, P., Lv, C., Ma, H., et al. (2020). Serum IL-8 and VEGFA Are Two Promising Diagnostic Biomarkers of Asthma-COPD Overlap Syndrome. Int. J. Chron. Obstruct. Pulmon. Dis. 15, 357–365. doi: 10.2147/COPD.S233461
Hamza, T. H., Arends, L. R., van Houwelingen, H. C., Stijnen, T. (2009). Multivariate Random Effects Meta-Analysis of Diagnostic Tests With Multiple Thresholds. BMC Med. Res. Methodol. 9, 73. doi: 10.1186/1471-2288-9-73
Higgins, J. P., Thompson, S. G., Deeks, J. J., Altman, D. G. (2003). Measuring Inconsistency in Meta-Analyses. BMJ 327 (7414), 557–560. doi: 10.1136/bmj.327.7414.557
Hong, B. Y., Paulson, J. N., Stine, O. C., Weinstock, G. M., Cervantes, J. L. (2018). Meta-Analysis of the Lung Microbiota in Pulmonary Tuberculosis. Tuberculosis (Edinb) 109, 102–108. doi: 10.1016/j.tube.2018.02.006
Huffnagle, G. B., Dickson, R. P., Lukacs, N. W. (2017). The Respiratory Tract Microbiome and Lung Inflammation: A Two-Way Street. Mucosal Immunol. 10 (2), 299–306. doi: 10.1038/mi.2016.108
Kramer, C. D., Genco, C. A. (2017). Microbiota, Immune Subversion, and Chronic Inflammation. Front. Immunol. 8:255. doi: 10.3389/fimmu.2017.00255
Kozlova, Y., Frolova, E., Uchevatkina, A., Filippova, L., Aak, O., Burygina, E. (2020). Diagnostic Markers of Allergic Bronchopulmonary Aspergillosis in Patients With Severe Asthma. Mycoses 63, 596–603. doi: 10.1111/myc.13083
Lee, J. S., Rhee, T. M., Pietrasz, D., Bachet, J. B., Laurent-Puig, P. (2019). Circulating Tumor DNA as a Prognostic Indicator in Resectable Pancreatic Ductal Adenocarcinoma: A Systematic Review and Meta-Analysis Sci. Rep. 9 (1), 16971. doi: 10.1038/s41598-019-53271-6
Liu, J., Ran, Z., Wang, F., Xin, C., Xiong, B., Song, Z. (2021). Role of Pulmonary Microorganisms in the Development of Chronic Obstructive Pulmonary Disease. Crit. Rev. Microbiol. 47 (1), 1–12. doi: 10.1080/1040841X.2020.1830748
Lu, H. F., Li, A., Zhang, T., Ren, Z. G., He, K. X., Zhang, H., et al. (2017). Disordered Oropharyngeal Microbial Communities in H7N9 Patients With or Without Secondary Bacterial Lung Infection. Emerg. Microbes Infect. 6 (12), e112. doi: 10.1038/emi.2017.101
Man, W. H., van Houten, M. A., Merelle, M. E., Vlieger, A. M., Chu, M., Jansen, N. J. G., et al. (2019). Bacterial and Viral Respiratory Tract Microbiota and Host Characteristics in Children With Lower Respiratory Tract Infections: A Matched Case-Control Study. Lancet Respir. Med. 7 (5), 417–426. doi: 10.1016/S2213-2600(18)30449-1
Maraki, S., Papadakis, I. S. (2015). Rothia Mucilaginosa Pneumonia: A Literature Review. Infect. Dis. (Lond) 47 (3), 125–129. doi: 10.3109/00365548.2014.980843
May, A. K., Brady, J. S., Romano-Keeler, J., Drake, W. P., Norris, P. R., Jenkins, J. M., et al. (2015). A Pilot Study of the Noninvasive Assessment of the Lung Microbiota as a Potential Tool for the Early Diagnosis of Ventilator-Associated Pneumonia. Chest 147 (6), 1494–1502. doi: 10.1378/chest.14-1687
Mayhew, D., Devos, N., Lambert, C., Brown, J. R., Clarke, S. C., Kim, V. L., et al. (2018). Longitudinal Profiling of the Lung Microbiome in the AERIS Study Demonstrates Repeatability of Bacterial and Eosinophilic COPD Exacerbations. Thorax 73 (5), 422–430. doi: 10.1136/thoraxjnl-2017-210408
Moffatt, M. F., Cookson, W. O. (2017). The Lung Microbiome in Health and Disease. Clin. Med. (Lond) 17 (6), 525–529. doi: 10.7861/clinmedicine.17-6-525
Moher, D., Liberati, A., Tetzlaff, J., Altman, D. G., Group P (2009). Preferred Reporting Items for Systematic Reviews and Meta-Analyses: The PRISMA Statement. J. Clin. Epidemiol. 62 (10), 1006–1012. doi: 10.1016/j.jclinepi.2009.06.005
Oever, J. T., Netea, M. G. (2014). The Bacteriome-Mycobiome Interaction and Antifungal Host Defense. Eur. J. Immunol. 44 (11), 3182–3191. doi: 10.1002/eji.201344405
Panganiban, R. P., Pinkerton, M. H., Maru, S. Y., Jefferson, S. J., Roff, A. N., Ishmael, F. T. (2012). Differential microRNA Epression in Asthma and the Role of miR-1248 in Regulation of IL-5. Am. J. Clin. Exp. Immunol. 1 (2), 154–165.
Ran, Z., Liu, J., Wang, F., Xin, C., Xiong, B., Song, Z. (2020). Pulmonary Micro-Ecological Changes and Potential Microbial Markers in Lung Cancer Patients. Front. Oncol. 10, 576855. doi: 10.3389/fonc.2020.576855
Reitsma, J. B., Glas, A. S., Rutjes, A. W., Scholten, R. J., Bossuyt, P. M., Zwinderman, A. H. (2005). Bivariate Analysis of Sensitivity and Specificity Produces Informative Summary Measures in Diagnostic Reviews. J. Clin. Epidemiol. 58 (10), 982–990. doi: 10.1016/j.jclinepi.2005.02.022
Trappe, A., Donnelly, S. C., McNally, P., Coppinger, J. A. (2021). Role of Extracellular Vesicles in Chronic Lung Disease. Thorax 0, 1–10. doi: 10.1136/thoraxjnl-2020-216370
Wang, Z., Yang, Y., Yan, Z., Liu, H., Chen, B., Liang, Z., et al. (2020). Multi-Omic Meta-Analysis Identifies Functional Signatures of Airway Microbiome in Chronic Obstructive Pulmonary Disease. ISME J. 14 (11), 2748–2765. doi: 10.1038/s41396-020-0727-y
Whiting, P. F., Rutjes, A. W., Westwood, M. E., Mallett, S., Deeks, J. J., Reitsma, J. B., et al. (2011). QUADAS-2: A Revised Tool for the Quality Assessment of Diagnostic Accuracy Studies. Ann. Intern. Med. 155 (8), 529–536. doi: 10.7326/0003-4819-155-8-201110180-00009
Wolff, N. S., Hugenholtz, F., Wiersinga, W. J. (2018). The Emerging Role of the Microbiota in the ICU. Crit. Care 22 (1), 78. doi: 10.1007/978-3-319-73670-9_47
Keywords: lung microbiota, COPD, asthma, diagnosis, meta-analysis
Citation: Ruan R, Deng X, Dong X, Wang Q, Lv X and Si C (2021) Microbiota Emergencies in the Diagnosis of Lung Diseases: A Meta-Analysis. Front. Cell. Infect. Microbiol. 11:709634. doi: 10.3389/fcimb.2021.709634
Received: 14 May 2021; Accepted: 17 August 2021;
Published: 21 September 2021.
Edited by:
Gabriel López-Velázquez, National Institute of Pediatrics, MexicoReviewed by:
Jose Francisco Gonzalez-Zamora, National Institute of Pediatrics, MexicoCarlos Jimenez Gutierrez, Hospital General Dr. Manuel Gea Gonzalez, Mexico
Ana Alejandra Ortiz Hernandez, National Institute of Pediatrics, Mexico
Copyright © 2021 Ruan, Deng, Dong, Wang, Lv and Si. This is an open-access article distributed under the terms of the Creative Commons Attribution License (CC BY). The use, distribution or reproduction in other forums is permitted, provided the original author(s) and the copyright owner(s) are credited and that the original publication in this journal is cited, in accordance with accepted academic practice. No use, distribution or reproduction is permitted which does not comply with these terms.
*Correspondence: Xiaoling Lv, ams0OTkxQDEyNi5jb20=; Caijuan Si, c2ljYWlqdWFuMDkyNkAxMjYuY29t
†These authors have contributed equally to this work