 Yifan Zhang
 Weiwei Jiang3†
 Jun Xu
 Yulan Liu
- 1Department of Gastroenterology, Peking University People's Hospital, Beijing, China
- 2Clinical Center of Immune-Mediated Digestive Diseases, Peking University People's Hospital, Beijing, China
- 3Department of Gastroenterology, The First Affiliated Hospital of Shandong First Medical University, Jinan, China
- 4Institute of Clinical Molecular Biology & Central Laboratory, Peking University People’s Hospital, Beijing, China
Objective: The gut microbiota is associated with nonalcoholic fatty liver disease (NAFLD). We isolated the Escherichia coli strain NF73-1 from the intestines of a NASH patient and then investigated its effect and underlying mechanism.
Methods: 16S ribosomal RNA (16S rRNA) amplicon sequencing was used to detect bacterial profiles in healthy controls, NAFLD patients and NASH patients. Highly enriched E. coli strains were cultured and isolated from NASH patients. Whole-genome sequencing and comparative genomics were performed to investigate gene expression. Depending on the diet, male C57BL/6J mice were further grouped in normal diet (ND) and high-fat diet (HFD) groups. To avoid disturbing the bacterial microbiota, some of the ND and HFD mice were grouped as “bacteria-depleted” mice and treated with a cocktail of broad-spectrum antibiotic complex (ABX) from the 8th to 10th week. Then, E. coli NF73-1, the bacterial strain isolated from NASH patients, was administered transgastrically for 6 weeks to investigate its effect and mechanism in the pathogenic progression of NAFLD.
Results: The relative abundance of Escherichia increased significantly in the mucosa of NAFLD patients, especially NASH patients. The results from whole-genome sequencing and comparative genomics showed a specific gene expression profile in E. coli strain NF73-1, which was isolated from the intestinal mucosa of NASH patients. E. coli NF73-1 accelerates NAFLD independently. Only in the HFD-NF73-1 and HFD-ABX-NF73-1 groups were EGFP-labeled E. coli NF73-1 detected in the liver and intestine. Subsequently, translocation of E. coli NF73-1 into the liver led to an increase in hepatic M1 macrophages via the TLR2/NLRP3 pathway. Hepatic M1 macrophages induced by E. coli NF73-1 activated mTOR-S6K1-SREBP-1/PPAR-α signaling, causing a metabolic switch from triglyceride oxidation toward triglyceride synthesis in NAFLD mice.
Conclusions: E. coli NF73-1 is a critical trigger in the progression of NAFLD. E. coli NF73-1 might be a specific strain for NAFLD patients.
Introduction
The gut-liver axis is the passageway by which the gut microbiota and gut-derived hepatotoxic bacterial products can easily enter the liver (Wiest et al., 2017; Chu et al., 2019). Interplay between the gut microbiota and liver injury through the gut-liver axis is known to play a pivotal role in the development and progression of nonalcoholic fatty liver disease (NAFLD) (Schnabl and Brenner, 2014; Chu et al., 2019). Emerging evidence has demonstrated that the gut microbial profile in NAFLD and/or nonalcoholic steatohepatitis (NASH) patients is strikingly different from that of healthy subjects (Safari and Gerard, 2019; Kim et al., 2019; Kolodziejczyk et al., 2019). NAFLD patients generally exhibit decreased microbial diversity compared with healthy controls (Del Chierico et al., 2017). In addition, Proteobacteria, which includes Escherichia, is the most common differentially abundant taxon between obese patients with NASH and those without NASH (Boursier et al., 2016). Many studies have found that germ-free or antibiotic-treated (bacteria-depleted) mice exhibited less lipid accumulation and inflammation than conventional mice fed a high-fat diet (HFD), which highlights the pivotal role of the gut microbiota in the natural progression of NAFLD (Backhed et al., 2004; Brandt et al., 2017; Wang et al., 2018). Moreover, after being administered the microbiota of NASH patients orally by gavage, HFD-fed germ-free mice showed an exacerbated NASH phenotype, manifesting as increased liver steatosis and inflammation (Chiu et al., 2017). The gut microbiota, in brief, has been indicated to play a critical role in the development of NAFLD.
Until now, most studies have determined the bacterial composition of intestinal feces at the genus level but have failed to identify bacteria at the species or strain level. In previous studies, a common finding in NAFLD patients was an increase in Escherichia at the genus level (Zhu et al., 2013; Mouzaki et al., 2013; Jiao et al., 2018). Furthermore, it has been reported that Escherichia is a unique genus that is significantly elevated in NASH patients compared with healthy controls and obese patients (Li et al., 2017). Another study confirmed that Escherichia was the predominant bacterium in NAFLD patients with small intestinal bacterial overgrowth (SIBO) (Kapil et al., 2016). Additionally, based on our previous research, a higher abundance of fecal Escherichia was observed in the Chinese population with NAFLD than in healthy subjects; of note, the abundance of Escherichia increased gradually in the progression of NAFLD to NASH (Jiang et al., 2015). These facts suggest that Escherichia can be a risk factor in the disease progression from NAFLD to NASH.
Of note, several studies have shown that multiple bacterial genera are associated with various diseases, and different strains of the same genus might have different pathogenic mechanisms (Kostic et al., 2013; Tsoi et al., 2017; Yu et al., 2017). Escherichia coli is an opportunistic pathogen that exists in NAFLD patients and healthy controls and is generally considered safe under normal health conditions. Increased bacterial colonization by E. coli or increased expression of virulence-related genes of E. coli may be inherently pathogenic (Kaper et al., 2004; Zargar et al., 2015). In addition, translocation of gut microbes was reported to trigger the progression of liver disease. Enterococcus gallinarum was reported to translocate into the liver in autoimmune hepatitis (AIH) (Manfredo Vieira et al., 2018). Previous studies have also shown that NAFLD is influenced by pathological bacterial translocation (PBT) from the gut (Wu et al., 2018). Therefore, we became interested in the effect and mechanism of gut microbes, especially E. coli, in the pathogenic progression of NAFLD.
Few studies have focused on the mucosal microbiota, especially bacterial strains, from the intestinal mucosa of clinical patients. In this study, to determine the relative bacterial abundance in mucosal samples at the genus level among healthy, NAFLD and NASH groups. We performed 16S ribosomal RNA (16S rRNA) amplicon sequencing. The data showed that, compared with the healthy group, the relative abundance of E. coli was increased in the NASH and NAFLD groups, especially in the NASH group, which was consistent with the changes in stool samples. These results further confirmed the accumulation of E. coli in the pathogenic progression from NAFLD to NASH. Bacterial cultivation, isolation and full-length 16S rRNA sequencing were performed to cluster the strains of E. coli enriched in NASH patients. We named the most abundant E. coli strain E. coli NF73-1 (authorized patent in China: No. 201610591293.4). In addition to bacterial abundance, the expression of virulence-related genes was also reported to be inherently pathogenic (Kaper et al., 2004; Zargar et al., 2015); thus, we performed whole-genome sequencing of E. coli NF73-1. The data showed enrichment of adherence genes and pathogenic genes, such as fimH (Chen et al., 2009), ybt (Ellermann et al., 2019), etc. in the genome of E. coli NF73-1(Table S1). Based on its highest abundance in NASH patients and its genetic pattern, we inferred that E. coli NF73-1 played a pivotal role in the progression of NAFLD.
The overall aim of the current study was to investigate the effect of E. coli NF73-1 in the progression of NAFLD, especially in liver inflammation and lipid metabolism.
Materials and Methods
Patients and Mucosa Collection
This cross-sectional study was approved by the Conjoint Health Research Ethics Board of Peking University People’s Hospital, and informed consent forms were signed by all the subjects prior to participation in this study. The diagnosis of NAFLD was established according to the Gastroenterology Organization Guidelines (Chalasani et al., 2012).
A total of 19 NAFLD patients were recruited at Peking University People’s Hospital. All patients were confirmed to exhibit NAFLD based on either imaging or histological evidence. Additionally, 10 healthy subjects were invited to participate as controls (Table 1). The 29 subjects agreed to undergo gastroscopy for physical examination and signed the appropriate informed consent form. In all cases, the mucosa samples were collected prior to endoscopy. On the day prior to the gastroscopic procedure, a blood sample was collected to measure the metabolic and hepatic parameters.
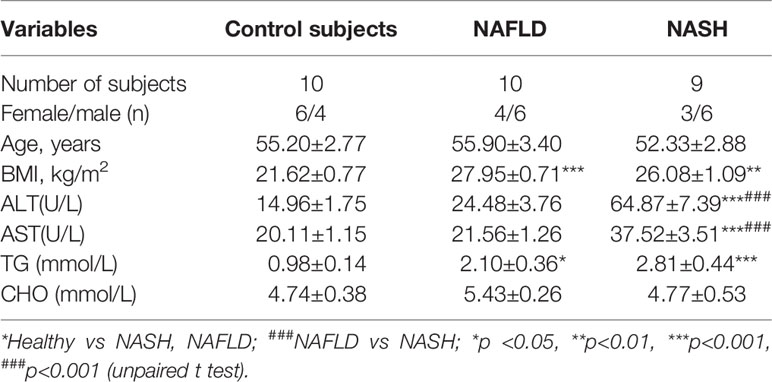
Table 1 Clinical and biochemical features of patients with NAFLD, NASH patients and the control group.
Mucosal Bacterial 16S rRNA Sequencing and Analysis
Microbial genomic DNA was extracted according to the manufacturer’s instructions, with minor modifications (Qiagen, Hilden, Germany). After DNA extraction, bacterial 16S rDNA was amplified. Briefly, the V3–V4 region of 16S rDNA was amplified using paired primers (357F/806R). After library preparation and quantification (Thermo Scientific, USA), paired-end sequencing (2 × 150 bp) was performed on an Illumina HiSeq 2500 sequencer at the Center for Molecular Immunology of Chinese Academy of Sciences (Beijing, China). In addition, raw fastq files were quality-filtered using the fastq_quality_filter (-p 90 -q 25 -Q33) in FASTX-Toolkit (v.0.0.14) and merged by Fast Length Adjustment of SHort reads (FLASH) (Caporaso et al., 2010; Edgar et al., 2011; Magoc and Salzberg, 2011). The OTUs were aligned utilizing the UCLUST algorithm with 97% identity and taxonomically classified using the SILVA database, v128, released on 29/09/2016. Additionally, the relative abundances of the various phyla, classes, orders, families, and genera in each sample were computed and compared among all groups. The detailed methods have been described in our previous studies (Xu et al., 2018; Jun et al., 2019).
Identification and classification of E. coli in NAFLD/NASH
Based on the 16S rRNA sequencing analysis, the significantly enriched E. coli were chosen for further study. First, E. coli-specific culturing was performed to pick pathogenic strains. Approximately 100 strains of E. coli were cultured and subjected to full-length 16S rRNA sequencing. The data showed 99% similarity with E. coli in the NCBI database. To analyze the evolutionary relationship among the strains, a phylogenetic tree was established with kSNP3 software (Gardner et al., 2015) using the neighbor-joining (NJ) method. Based on the similarity of genomic sequences, three types of E. coli subspecies were identified, i.e., NF73, NF4 and NF23.
E. coli-specific Comparative Genomic Analysis
E. coli NF73-1 was used for full-length genomic sequencing and further comparative genomic analysis. The genome of E. coli NF73-1 was sequenced using an Illumina HiSeq 4000 system (Illumina, San Diego, CA, USA) at the Beijing Genomics Institute (Shenzhen, China). The sequenced reads were assembled using SOAPdenovo v1.05 software.
For phylogenetic analysis based on full-length 16S rRNA, the evolutionary history was inferred by using the maximum likelihood method based on the Tamura-Nei model. Evolutionary analyses were conducted in MEGA7. A phylogenetic tree based on the whole-genome sequence was constructed by TreeBeST using the NJ method.
Gene prediction was performed on the E. coli NF73-1 genome assembly by glimmer3 with hidden Markov models. tRNA, rRNA and sRNA recognition was conducted with tRNAscan-SE (Lowe and Eddy, 1997), RNAmmer, and the Rfam database. Tandem repeat annotation was obtained using the Tandem Repeat Finder (http://tandem.bu.edu/trf/trf.html), and the minisatellite DNA and microsatellite DNA were selected based on the number and length of repeat units. The Genomic Island Suite of Tools (GIST) was used for genomic island analysis (http://www5.esu.edu/cpsc/bioinfo/software/GIST/) with the IslandPath-DIOMB, SIGI-HMM, and IslandPicker methods. Prophage regions were predicted using the PHAge Search Tool (PHAST) web server (http://phast.wishartlab.com/), and CRISPR identification was performed using CRISPR Finder. The best hit was abstracted using the BLAST alignment tool for functional annotation. Database, namely Kyoto Encyclopedia of Genes and Genomes (KEGG) were used for general function annotation.
According to the dispensable gene in different strains, a heat map showed the cluster analysis among E.coli strains. A detailed description of genomes can be found in Table S1. Diamond (V0.9.18.119) software was used to compare the sequences of 2 strains in the KEGG database, and the annotation information for KEGG was obtained (Kanehisa et al., 2014). The key genes were selected to compare and display the heatmap.
Animal Experiments
Six-week-old C57BL/6J specific-pathogen-free (SPF) male mice were purchased from the Vital River facility (Beijing, China). Animals were housed with free access to food and sterile drinking water in a temperature-controlled room (21°C ± 2°C) under a 12-h dark-light cycle in a SPF facility. Male C57BL/6J SPF mice were divided into a conventional group and a flora-deficient group. Then, both groups were fed either a normal diet (ND) or an HFD (45% kcal fat; Mediscience Ltd, China) (Table 6) for 16 weeks. Depletion of the gut microbiota was performed as previously described, with slight modifications (Tsoi et al., 2017; Schneider et al., 2019). After 8 weeks, the flora-deficient group was treated with a cocktail of broad-spectrum antibiotic complex (ABX, 1 g/L ampicillin, 0.5 g/L vancomycin, 1 g/L neomycin sulfate, and 1 g/L metronidazole) for 2 weeks to eliminate intestinal bacteria. After week 10, all groups were further treated intragastrically with 1 × 10⁸ colony-forming units (CFU) of E. coli NF73-1 (HFD-NF73-1 group, ND-NF73-1 group, HFD-ABX-NF73-1 group and ND-ABX-NF73-1 group), Luria-Bertani (LB) medium (HFD-LB group, ND-LB group, HFD-ABX-LB group and ND-ABX-LB group), or 1 × 10⁸ CFU of the control bacterium E. coli MG1655 (HFD-MG1655 group, ND-MG1655 group, HFD-ABX-MG1655 group and ND-ABX-MG1655 group) every day.
For depletion of liver macrophages, we injected flora-deficient HFD mice with liposome-encapsulated clodronate (CLOD) (0.1 mL per 10 grams, F7010C-AC, Formumax, USA) intravenously once for the first week and then twice per week (0.05 mL per 10 grams) for the following five weeks. Liposome-encapsulated phosphate-buffered saline (PBS) was used as a control (CLOD CON).
At the time indicated, animals fasted for 12 h were anesthetized, and whole blood was withdrawn by cardiac puncture. Serum and tissues were collected, including the liver and intestine.
Stool DNA Extraction
For optimal isolation of bacterial DNA, mucosal biopsies were disrupted by bead-beating after digestion with an enzymatic cocktail of mutanolysin and lysozyme (Sigma-Aldrich, USA). Then, extraction and purification were performed using the QIAamp DNA Mini Kit. Stool DNA was quantified using a Nanodrop-1000 (Thermo Scientific, USA).
Serum biochemical measurements
Serum was collected from blood and assayed for levels of alanine aminotransferase (ALT), aspartate aminotransferase (AST), total triglyceride (TG) and cholesterol (TC) using an automatic biochemical detector (Labospect 008 AS, Japan).
Oil Red O Staining and H&E Staining
For Oil Red O staining, optimal cutting temperature (OCT)-embedded frozen tissue was sectioned at 5 to 7 μm. After washing with PBS, dried slides were subsequently incubated with 100% propylene glycol and Oil Red O solution (ab150678; Sigma, USA). Stained slides were differentiated with 85% propylene glycol solution and distilled water. Then, stained slides were incubated in hematoxylin and mounted with glycerin.
For hematoxylin and eosin (H&E) staining, liver tissue was fixed in 10% neutral buffered formalin (Sericebio; China). Paraffin-embedded liver tissues were used. The NAFLD activity score was assessed by two blinded investigators.
Isolation of MNCs in the Liver
Livers were perfused with PBS via the portal vein to eliminate the effects of lymphocytes in blood. In brief, mouse livers were homogenized and filtered through a 70-μm nylon cell strainer (BD Bioscience, San Jose, CA, USA). Liver mononuclear cells (MNCs) were separated from nonparenchymal cells using density separation in a Percoll gradient (17089101, GE, USA). Percoll is silica sol with nondialyzable polyvinylpyrrolidone coating, the density of which is 1.13±0.005 g/mL. We prepared 80% Percoll solution: Mix 4 ml of Percoll separation solution with 36 ml of sterile 10× PBS and 10 ml of sterile 1× PBS. We prepared 40% Percoll solution by mixing 2 ml of Percoll separation solution with 18 mL of sterile 10× PBS and 30 ml of sterile 1× PBS. The density of 40% Percoll is less than 1.050 g/mL. The density of mononuclear cells is 1.050 to 1.095 g/mL. The density of 80% Percoll is greater than 1.095 g/mL. After removing debris, hepatic nonparenchymal cells were collected and suspended in 40% Percoll. The cell suspension was gently overlaid onto 80% Percoll and centrifuged at 4°C for 25 min at 3000 r.p.m. Liver mononuclear cells (MNCs) were collected from the interface. Then, the MNCs were resuspended in fresh PBS after red blood cell lysis (Biolegend, USA). In brief, FcγR was first blocked with anti-CD16/CD32 antibody (TruStain fcX, Biolegend) at 4°C for 10 min. All resuspended cells were further sorted by a Gallios instrument (Beckman, USA) using the following antibodies (Biolegend, USA): AF700-conjugated anti-mouse CD45, APC-Cy7 tagged anti-mouse F4/80 and PE-Cy7-conjugated anti-mouse CD11b, BV-570-conjugated anti-mouse Ly-6G, BV421 tagged anti-mouse CD86, and FITC conjugated anti-mouse CD206. Natural killer (NK, NK1.1+CD3−) cells, natural killer T (NKT, NK1.1+CD3+) cells, neutrophils (CD11b+Ly6G+), CD4 T cells (CD3+CD4+ CD8-), CD8 T cells (CD3+CD8+CD4-), macrophages (CD11b+F4/80+) and B (CD3-B220+) cells were also analyzed through pseudocolor analysis plots. Stained cells were read with a Gallios instrument. The gating strategy is illustrated in Figures S3C, D. The results were analyzed using Beckman software.
Immunochemical Staining
Liver tissues were removed at sacrifice and then fixed in formalin, embedded in paraffin, and prepared for histology. The liver tissue slides were blocked with 10% goat serum for 30 min, followed by incubation for 1 h with anti‐F4/80 antibody (1:200; ab16911, Abcam, China) and anti‐pS6 antibody (1:200; 2211, CST, USA) at 4°C overnight. After incubation with a poly‐peroxidase‐conjugated goat anti‐rat IgG or goat anti‐rabbit IgG (Zhongshan Golden Bridge, China) at 37°C for 30 min, the slides were counterstained with 3,3′‐diaminobenzidine (DAB) and hematoxylin and eventually mounted with glycerin.
RT-qPCR
Total RNA from the liver and macrophages was isolated TRIzol reagent (15596; Thermo Fisher Scientific) and reverse transcribed to complementary DNA by the qScript Reverse Transcriptase Kit (Thermo Fisher Scientific, USA). Gene expression profiles were quantified by quantitative PCR using the ABI 7500 Real-Time PCR System (ABI) with SYBR FAST qPCR Kits (Transgen, China). mRNA amounts were calculated by the comparative cycle threshold method (ΔΔCt method) with normalization to actin mRNA. Primers were purchased from Sangon Company (Shanghai) and are listed in Table 2.
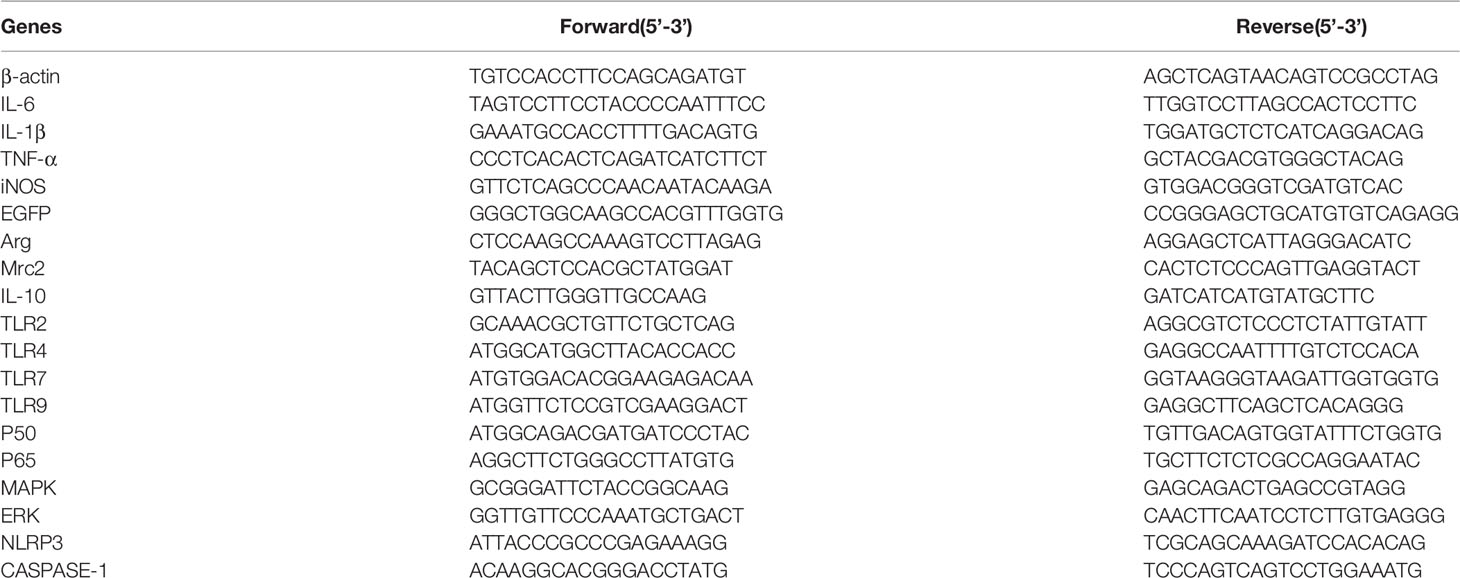
Table 2 Primers.
Liver TG and TC Levels
Hepatic lipids were extracted from 50 mg of liver tissue and assayed using a triglyceride assay kit and a cholesterol assay kit (E1013, E1015, Applygen Technologies, China) according to the manufacturer’s recommended protocols. Protein concentrations were quantified by using a Pierce BCA Protein Assay Kit (23227, Thermo, USA).
Cell Coculture and Oil Red O Staining (RAW 264.7, L02, H2.35, E. coli NF73-1)
RAW 264.7 cells (obtained from ATCC and free from mycoplasma) were stimulated with 1 mM palmitate and oleic acid conjugated to fatty acid-free bovine serum albumin (BSA) (A2000, Applygen Technologies, China) or only fatty acid-free BSA for 1 h and then cultured with or without NF73-1. Then, surface immunofluorescence antibody staining was performed quickly for identification of macrophages. L02 and H2.35 (obtained from ATCC and free from mycoplasma) were stimulated with 1 mM palmitate and oleic acid conjugated with fatty acid-free BSA or only fatty acid-free BSA for 20 h and then cocultured with or without NF73-1 for 4 h. After washing with PBS, the cells were incubated with 4% neutral buffered formalin and Oil Red O solution (ab150678; Sigma, USA). Stained slides were washed with 85% propylene glycol solution and distilled water and then mounted with glycerin.
Bacterial Culture
E. coli NF73-1 and E. coli MG1655 were transformed with plasmid CV129-EGFP to induce the expression of enhanced green fluorescent protein (EGFP) and β-lactamase, conferring resistance to ampicillin, to follow bacterial translocation from the intestine. E. coli EGFP-NF73-1 and E. coli EGFP-MG1655 were cultured in LB under aerobic conditions. Primers of EGFP were purchased from Sangon Company (Shanghai) and are listed in Table 2.
All experiments were performed under strict sterile conditions. At the time indicated, livers (100 mg each) were removed aseptically, homogenized, plated on ampicillin-supplemented Luria Broth plates and cultured at 37°C overnight. The CFUs were then counted to quantify bacteria.
Immunofluorescence Staining and Confocal Imaging Assay
Liver and intestinal tissues were fixed in OCT (4583, Sakura Finetek, USA) and cut at 5-µm thickness using a Leica freezing slicer. The tissue slides were blocked with 10% goat serum for 30 min and incubated with 4′,6′-diamidino-2-2phenylindole (DAPI) (ZLI-9557, Zhongshan Golden Bridge, China) to stain the nuclei. The slides were observed using a confocal microscope (Nikon A1R, Tokyo, Japan).
Western Blotting
Total protein samples were isolated from liver tissue and cells cultured using RIPA lysis buffer (Thermo Fisher Scientific, USA) containing protease and phosphatase inhibitors (Roche, Basel, Switzerland). Samples were separated by 10% SDS-polyacrylamide gel electrophoresis and transferred onto polyvinylidene difluoride membranes (Millipore, CA). The membranes were blocked in 5% milk and incubated with primary antibodies against mTOR (2983T), p-mTOR (5536T), p70S6 (9234), S6 (2217), pS6 (2211), TLR2 (13744), pNF-κBp65 (3033), NF-κBp65 (4764), NF-κBp50 (13586) and β-actin (4970) (CST, USA) at 1:1000 in TBST. Antibodies against PPAR-α (ab24509), SREBP-1 (ab28481), FASN (ab22759), ACC1 (ab45174), S6K1 (ab32529) and Caspase-1 (ab1872) were obtained from Abcam (Cambridge, USA). The intensity of the bands was analyzed by scanning densitometry and quantified by NIH Image J software. For protein expression, the specific band intensity was quantified, normalized to those of β-actin, and presented as a value relative to the control.
Coculture of E. coli NF73-1, RAW264.7, and Hepatocytes
RAW264.7 macrophages (2 × 10³ cells/ml) were cultured in DMEM with oleic acid and palmitic acid in the upper chamber, and L02 and H2.35 (2 × 10⁵ cells/ml) were cocultured in the lower chamber of a 6-well Transwell plate (3412; Corning, USA) for 20 h; the chambers were separated by a 0.4-µm track-etched membrane. Then, E. coli NF73-1 or rapamycin was added to the coculture system. After 4 h of cultivation, hepatocytes were collected for Western blot analysis.
In another experiment, after 4 h of cultivation with E. coli NF73-1, RAW264.7 cells were collected and labeled with APC-Cy7-F4/80, CD11b-PerCP, BV421-CD86, and CD206-FITC antibodies and detected using a Gallios (Beckman, USA) flow cytometer. Moreover, RAW264.7 cells were harvested for RNA extraction and Western blot analysis. The gating strategy is illustrated in Figure S3E. The data were analyzed using Beckman software.
Statistical Analysis
Statistical analysis was performed using GraphPad Prism (version 5.01, San Diego, CA, USA). The results are shown as the mean ± S.E.M. (standard error mean). The results were analyzed by one-way analysis of variance between multiple groups when appropriate, and by a two-tailed Student’s t test for comparison of two groups. P < 0.05 was considered statistically significant.
Results
Isolation and Identification of E. coli Strains From the Intestinal Mucosa of NASH Patients
To explore the key bacterial strains involved in the pathogenesis of NAFLD, especially mucosa-adherent bacterial strains, we analyzed the abundance of Escherichia in mucosal samples from NAFLD patients recruited at Peking University People’s Hospital. An increased abundance of bacteria belonging to Escherichia within the phylum Proteobacteria was observed in the microbiota from the NASH and NAFLD groups compared with the healthy group. Seven genera, namely Bacteroides, Faecalibacterium, Prevotella, Blautia, Lachnospiracea, Clostridium, and Roseburia, were less abundant in both the NAFLD and NASH patients than the healthy subjects (Figure S1A). In addition, the relative abundance of Escherichia in the NASH group was higher than that in the NAFLD group (Figure 1A). The changes in Escherichia in the mucosal flora of these groups were consistent with the fecal flora in our previous research. In our data, the average relative abundance of E. coli in the healthy control group was 0.14 ± 0.5. Therefore, we define an E. coli colonization abundance less than 0.14 as “low-abundance colonization” and greater than 0.14 as “high-abundance colonization”. It was found that 40% of the healthy controls were high-abundance colonized populations, while the proportions for NAFLD and NASH patients were 80% and 77.8%, respectively (Figure 1B).
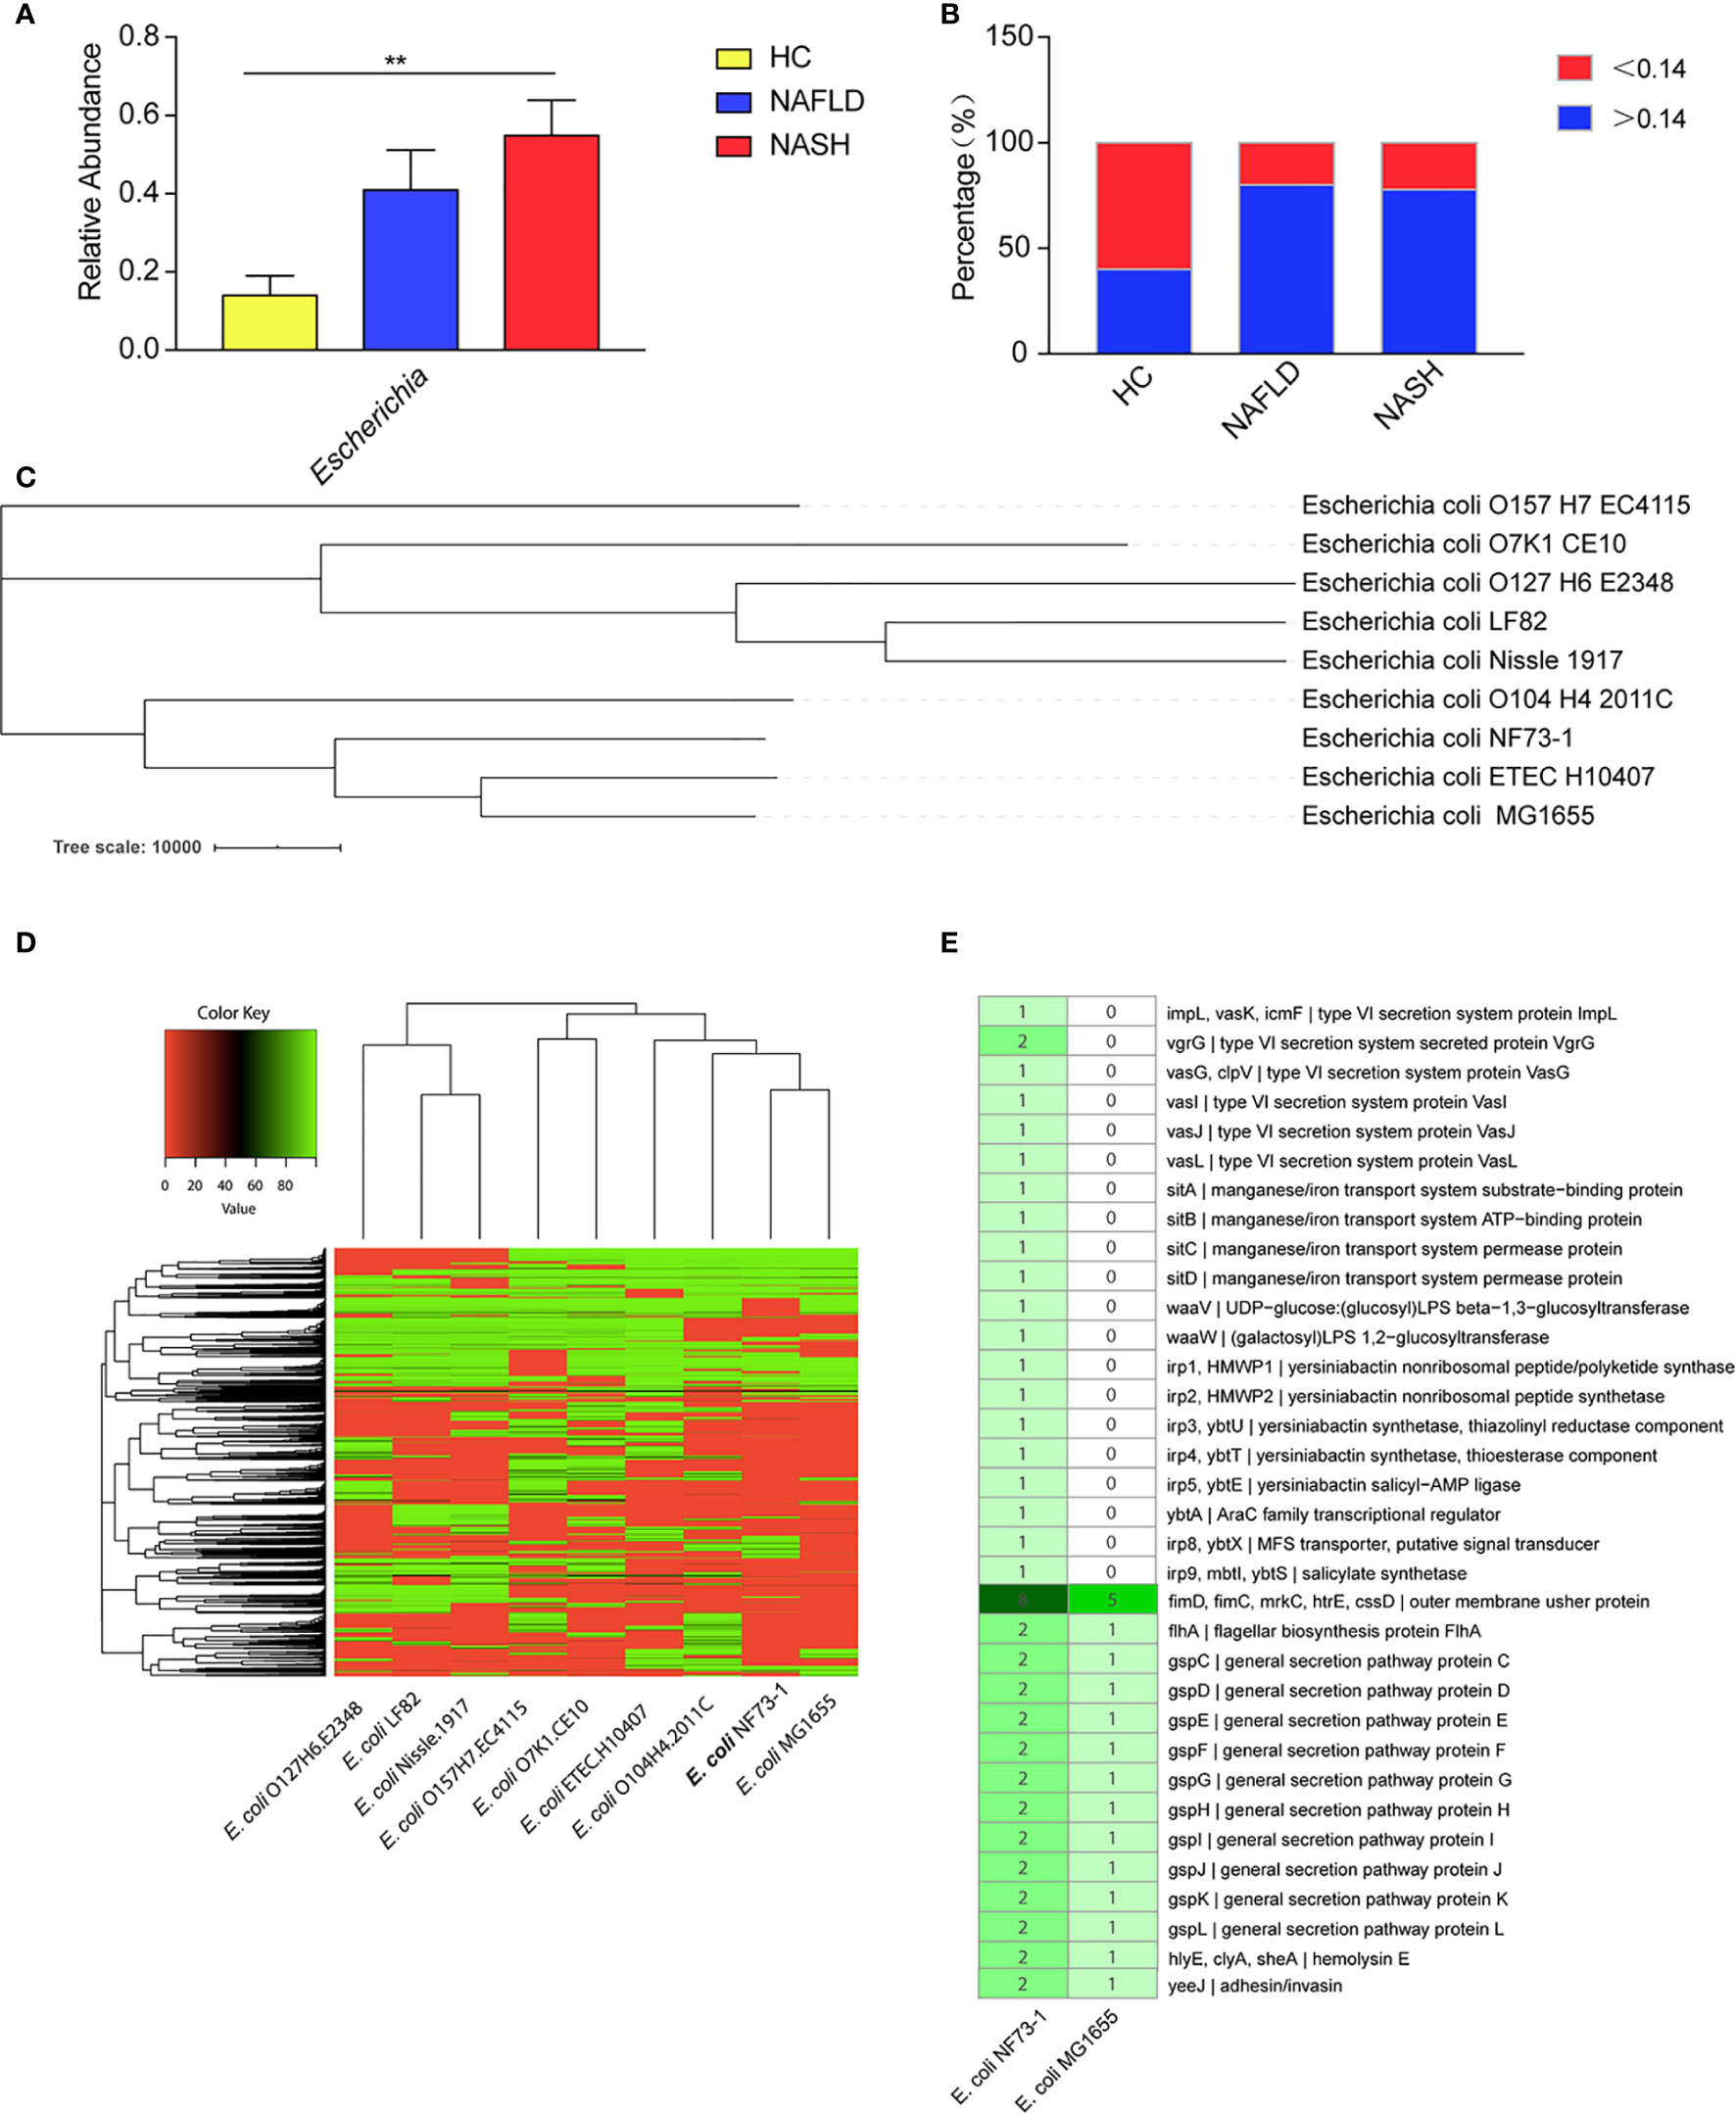
Figure 1 E. coli–specific comparative genomic analysis. (A) Comparison of the Escherichia abundance at the genus level among NASH and NAFLD patients and healthy subjects. (B) High-abundance (>0.14) Escherichia colonized percentage of the healthy controls, NAFLD and NASH patients. (C) A phylogenetic tree was constructed by TreeBeST using the neighbor-joining (NJ) method. (D) Cluster heat map of 9 E. coli genomes. The cluster tree of dispensable genes is represented on the Y-axis and the E. coli genomes are listed on the X axis (E. coli. O127H6.E2348, E. coli. LF82, E. coli. Nissle.1917, E. coli. O157H7.EC4115, E. coli. O7K1.CE10, E. coli. ETEC.H10407, E. coli. O104H4.2011C, E. coli.MG1655 and E. coli. NF73-1). The color key representing the degree of similarities and differences of the genomes based on dispensable genes. A detailed description of genomes can be found in Table S1. (E) Comparative genomics of E. coli NF73-1 and E. coli MG1655 in KEGG general functional annotations. Gene names are represented on Y-axis and the E. coli genomes are listed on the X-axis. The color key representing the degree of differences of the genomes based on the presence or absence of genes. Detail description of genomes can be found in Table S3. Data are calculated as the mean ± SEM, n = 9–10 per group. **p <0.01 (one-way analysis of variance between multiple groups).
We selected and isolated E. coli strains from the colonic mucosa of the NASH patient who had the highest abundance of Escherichia (Table 3 and Figures S1B-E). The genotypic identification of the above E. coli strains was carried out by full-length 16S rRNA sequencing of all 100 strains. The sequences showed 99% similarity with E. coli in the NCBI database. To analyze the evolutionary relationships among these strains, a phylogenetic tree was established using the maximum-likelihood method. The results showed that the 100 strains grouped into 3 clusters, which were named E. coli NF73-1 to NF73-73, E. coli NF23-1 to NF23-23 and E. coli NF4-1 to NF4-4 (Figure S1F). The 16S rRNA sequence of different E. coli NF strains have been uploaded to the NCBI GenBank database (MT649758-MT649857). Thus, E. coli NF73-1-NF73-73 were the dominant strains of Escherichia in the colonic mucosa of NASH patients. Therefore, E. coli NF73-1 was chosen for genome sequencing and verification of the pathogenic effect on NAFLD progression.
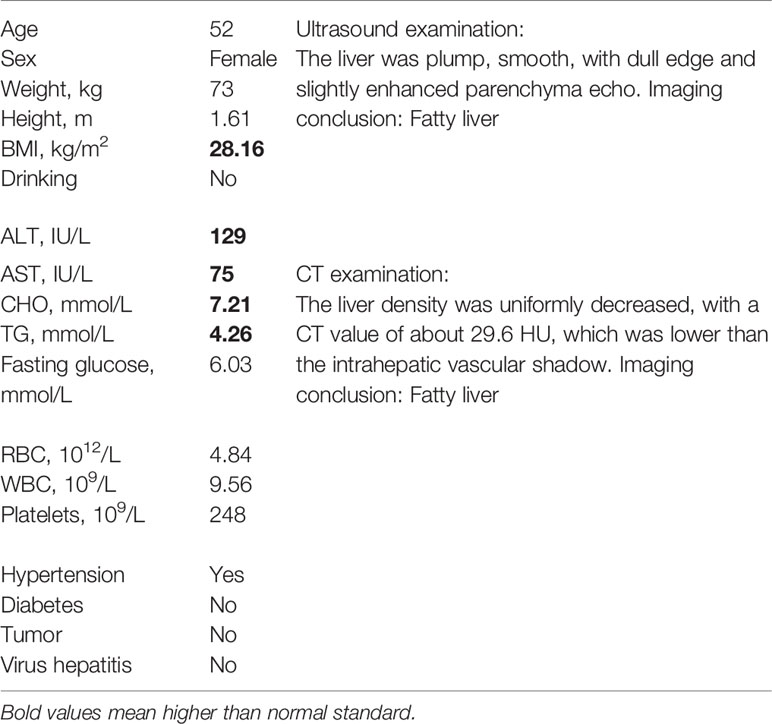
Table 3 Clinical characteristics of a NASH patient.
Whole-Genome Sequencing Analysis of the E. coli NF73-1 Strain
The genome of E. coli NF73-1 (authorized patent in China: No. 201610591293.4) was sequenced using an Illumina HiSeq 4000 system (Illumina, San Diego, CA, USA) at the Beijing Genomics Institute (Shenzhen, China). All experiments were conducted by HUADA GENE Company (Project Code. F17FTSNCKF1064_ECOaxmR). The sequenced reads were assembled using SOAPdenovo v1.05 software, leading to a final assembly of 113 contigs with an N50 of 75,968 bp (Table 4). The results of genomic component information analysis (Seq type scaffold) are presented in Table 5. The values for total length values were 4,626,248 (scaffold) and 4,612,049 (contig) depending on the seq type. The genomic sequence of E. coli NF73-1 has been uploaded to the SRA database (BioProject ID: PRJNA529543).

Table 4 Genomic assembly information of E.coli NF73-1.

Table 5 General genome information of E.coli NF73-1.
The phylogenetic tree constructed by TreeBeST showed that E. coli NF73-1 was distinguished from other strains and shared relatively close evolutionary relationships with E. coli ETEC.H10407 and E. coli K12.MG1655 (Figure 1C). These data suggested that E. coli NF73-1, which was isolated from the intestinal mucosa of NASH patients, possessed several critical and pathogenic genes and differed from known strains. The analysis is shown in the Table S1. The genomes were assembled and annotated, and cluster analysis was performed (Figure 1D). A total of 4372 genes were obtained, of which 3241 were successfully annotated in KEGG databases (Figure S2A and Table S2). Through comparative genomics analysis with E. coli MG1655, it was found that virulence genes related to adhesion and invasion were more abundant in E. coli NF73-1 than E. coli MG1655. Virulence genes related to secretion system, manganese/iron transport system etc. only existed in E. coli NF73-1 (Figure 1E and Table S3).
In addition, the abundance of Escherichia was commonly increased in not only the stool samples but also the intestinal mucosa of NASH patients (Jiang et al., 2015). We speculated that the highly abundant E. coli NF73-1 may be an important pathogen causing NAFLD progression.
E. coli NF73-1 Aggravated Hepatosteatosis and Inflammatory Cell Infiltration in NAFLD Mice
Considering the enrichment of E. coli NF73-1 in the intestinal mucosa sample, we investigated the potential effect of this particular bacterial strain on NAFLD progression (Figure 2A). To further confirm whether E. coli NF73-1 independently caused the progression of NAFLD, we utilized flora-deficient mice in our gavage model to exclude the potential impact of other symbiotic gut microbes and repeat the experiments. None of the groups showed abnormal signs or symptoms. E. coli NF73-1 did not result in mouse death. E. coli NF73-1-treated HFD (Table 6) mice showed significantly higher weight gain than nontreated mice (Figure S2B) We did not observe significant differences in weight gain in ND mice harboring high E. coli NF73-1 abundance.
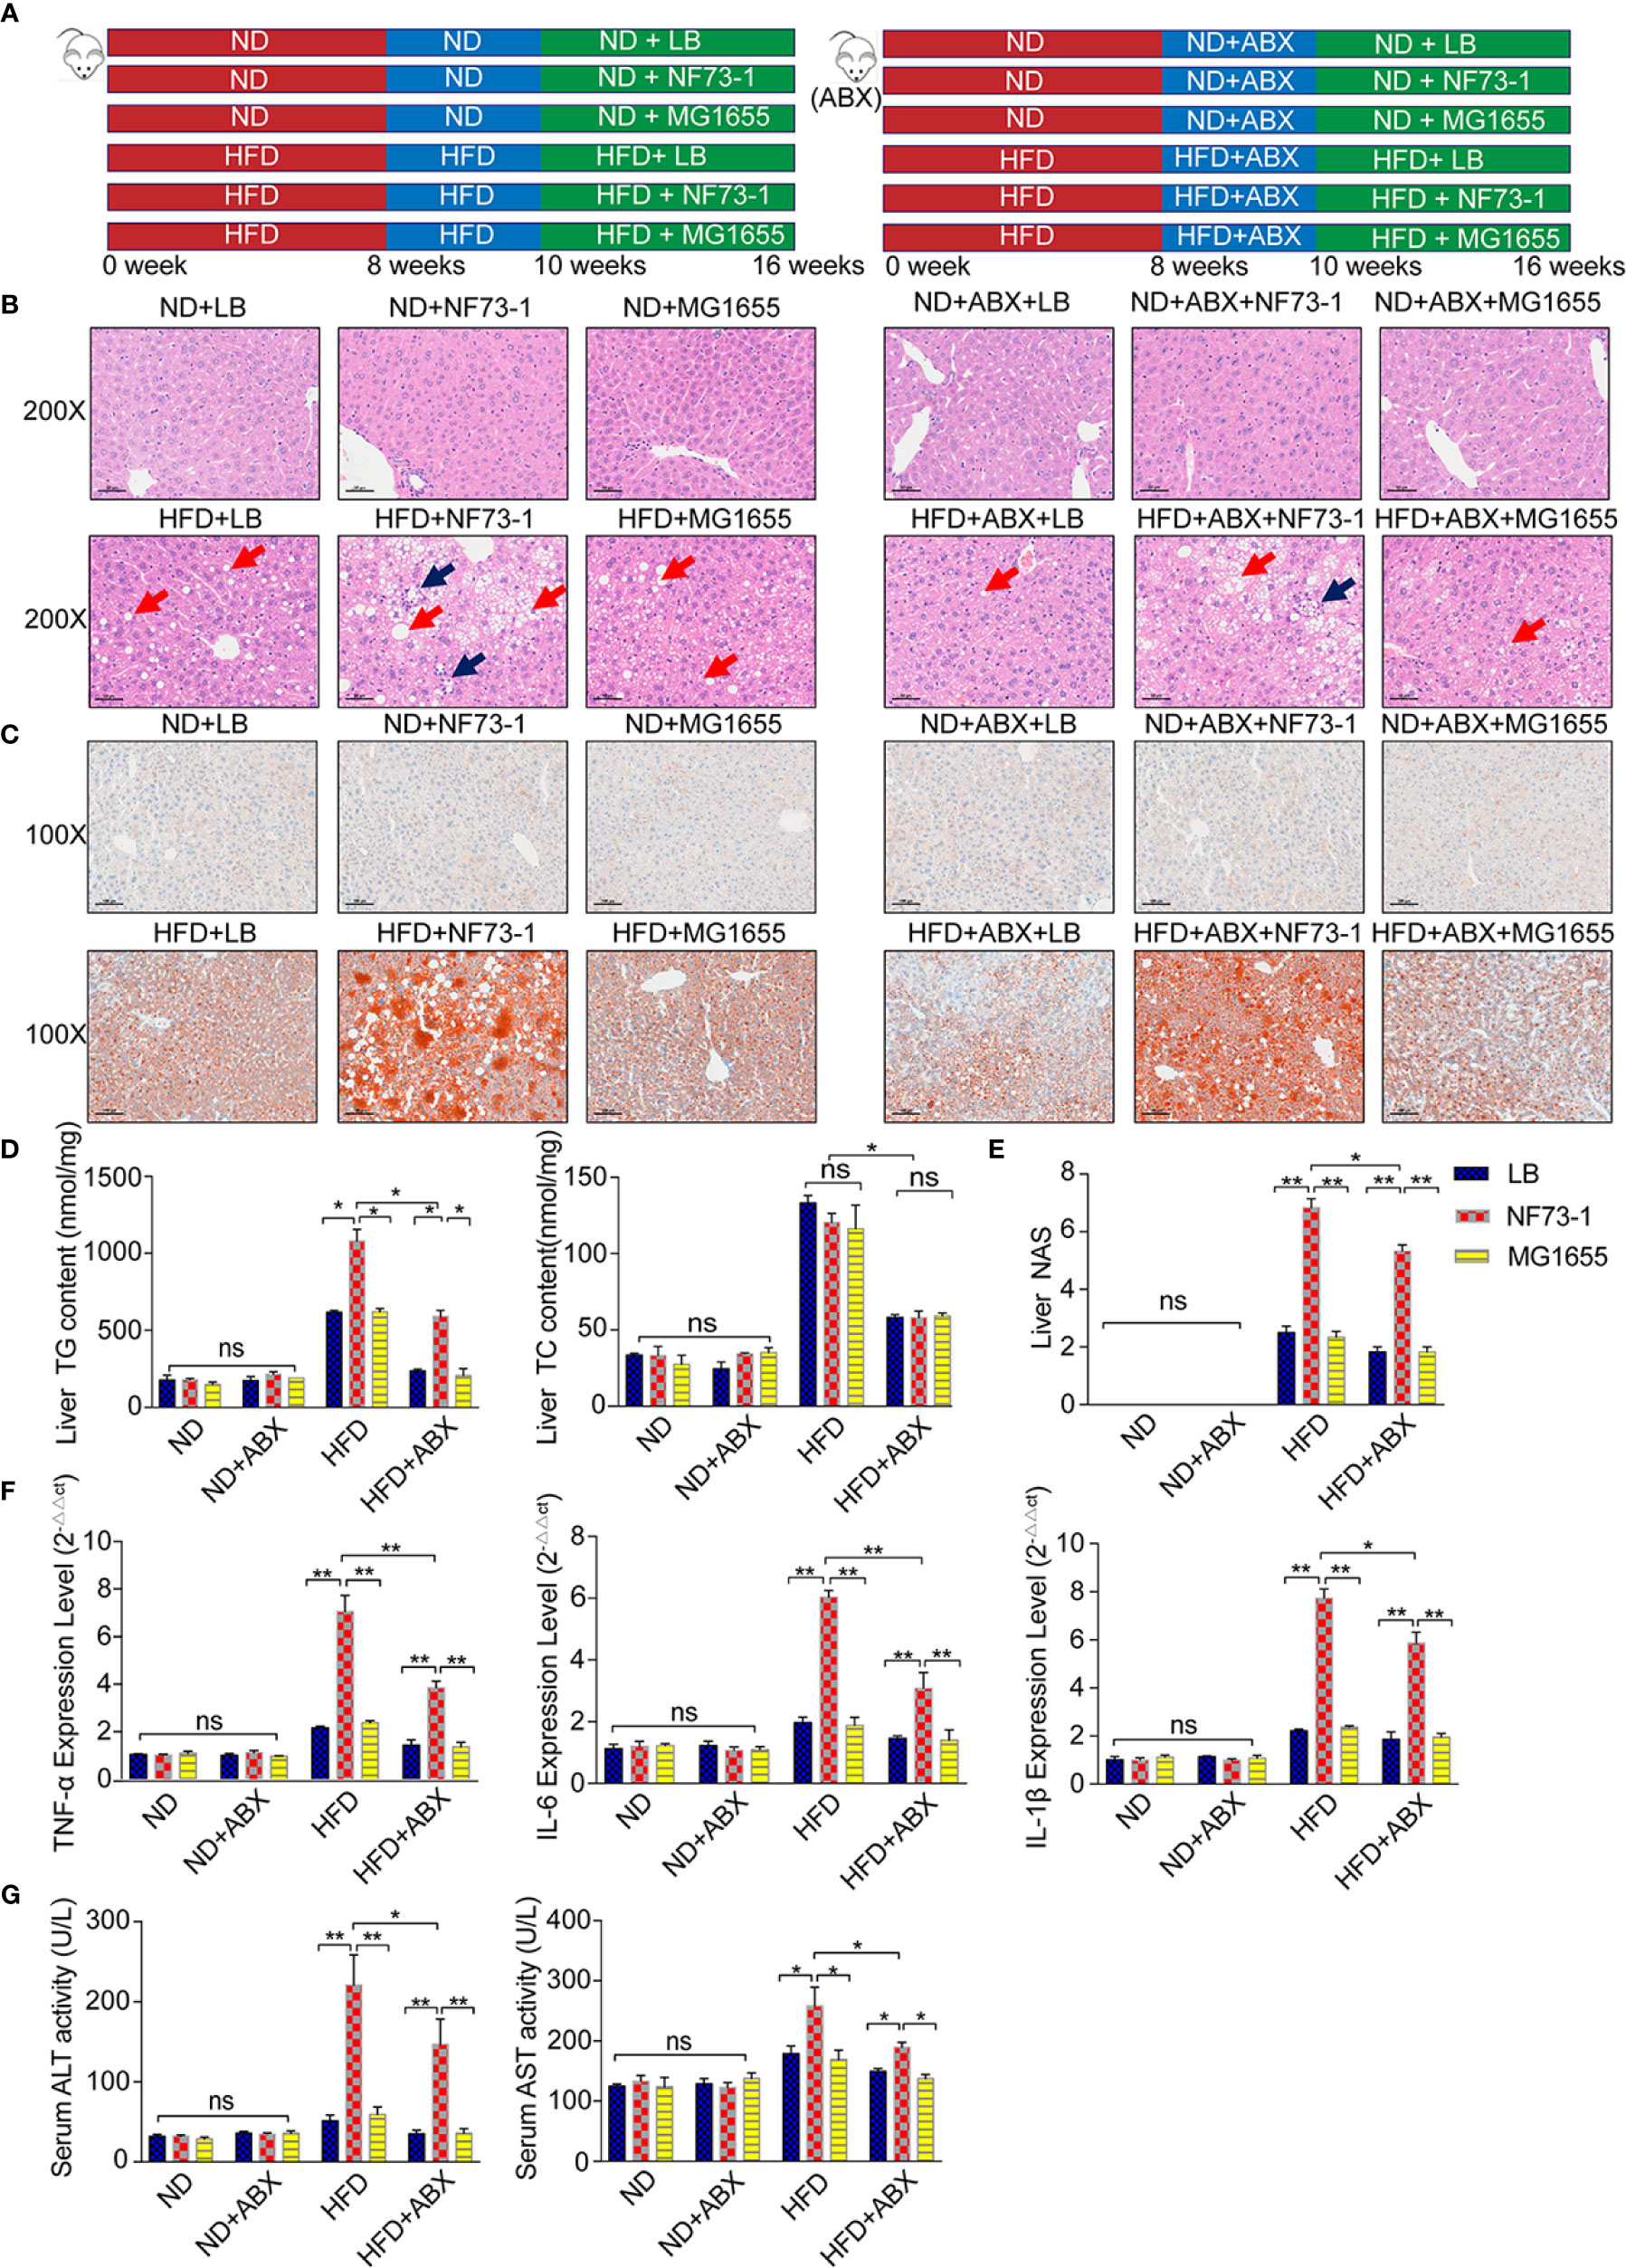
Figure 2 Liver injury enhancement in NAFLD mice with E. coli NF73-1. (A) Schematic diagram showing the overall design and complete timeline for model construction. (B) Representative images of H&E-stained mouse liver (blue arrows, inflammatory cells; red arrows, steatosis); scale bar indicates 50 μm. (C) Oil Red O-stained liver images; scale bar indicates 100 μm. (D) Hepatic triglyceride and cholesterol content and their concentrations in serum in each group. (E) NAS analysis of the liver. (F) TNF-α, IL-6, and IL-1β content in the liver in each group. (G) Serum ALT and AST activity in each group. Data are calculated as the mean ± SEM, n = 6–8 per group. ns p>0.05, *p <0.05, **p <0.01 (unpaired t test). NAFLD, non-alcoholic fatty liver disease; ABX, broad-spectrum antibiotics complex; ALT, alanine aminotransferase; AST, aspartate aminotransferase; TC, total cholesterol; TG, total triglyceride; H&E, hematoxylin & eosin; NAS, NAFLD activity score; TNF-α, tumor necrosis factor α; IL-6, interleukin 6; IL-1β, interleukin 1β; ND, normal diet; HFD, high-fat diet; NS, no significance.
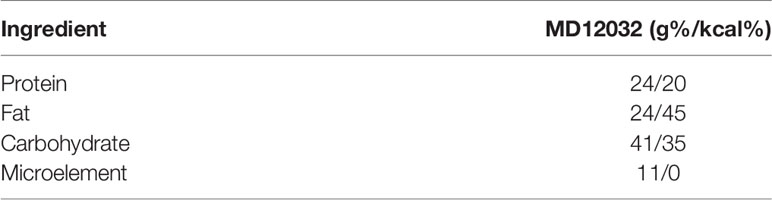
Table 6 Components of high fat diet.
Both small and large lipid droplet vacuoles within hepatocytes were significantly increased in the HFD-NF73-1 group compared with the HFD-LB and HFD-MG1655 groups, which was confirmed by liver H&E and Oil Red O staining (Figures 2B, C). Notably, only the HFD-NF73-1 group exhibited much higher hepatic triglyceride levels than paired-fed HFD mice (Figure 2D).
Liver H&E staining showed that E. coli NF73-1 administration resulted in inflammatory cell infiltration in the HFD-NF73-1 group compared with paired-fed HFD mice (Figure 2B). The HFD-NF73-1 group showed a higher NAFLD activity score (NAS) than the HFD-LB and HFD-MG1655 groups (Figure 2E). Moreover, real-time PCR analysis showed that the HFD-NF73-1 group had higher expression of inflammatory cytokines, including interleukin 6 (IL-6), interleukin 1β (IL-1β), and tumor necrosis factor α (TNF-α), in the liver than the HFD-LB and HFD-MG1655 groups (Figure 2F). Importantly, significant increases in ALT and AST were observed in the HFD-NF73-1 group compared with the HFD-LB and HFD-MG1655 groups (Figure 2G). No liver steatosis or inflammation was found among the ND-LB, ND-NF73-1, ND-MG1655, ND-ABX-LB, ND-ABX-NF73-1, and ND-ABX-MG1655 groups (Figures 2B–F).
After antibiotic cocktail treatment, bacterial abundance decreased significantly in stool and was maintained at a very low level (Figure S3A), indicating the establishment of natural gut flora depletion. Consistent with the conventional mouse model, elevated hepatic inflammation levels, triglyceride content and serum liver enzymes were also observed in the HFD-ABX-NF73-1 group compared with the paired-fed HFD-ABX mice (Figures 2B–G).
Translocation of E. coli NF73-1 via the Gut-Liver Axis Is Observed in HFD but Not ND Mice
To follow bacterial translocation, EGFP-labeled, ampicillin-resistant E. coli EGFP-NF73-1 and E. coli EGFP-MG1655 were generated and used in animal experiments (Figure S3B and Figure 3A).
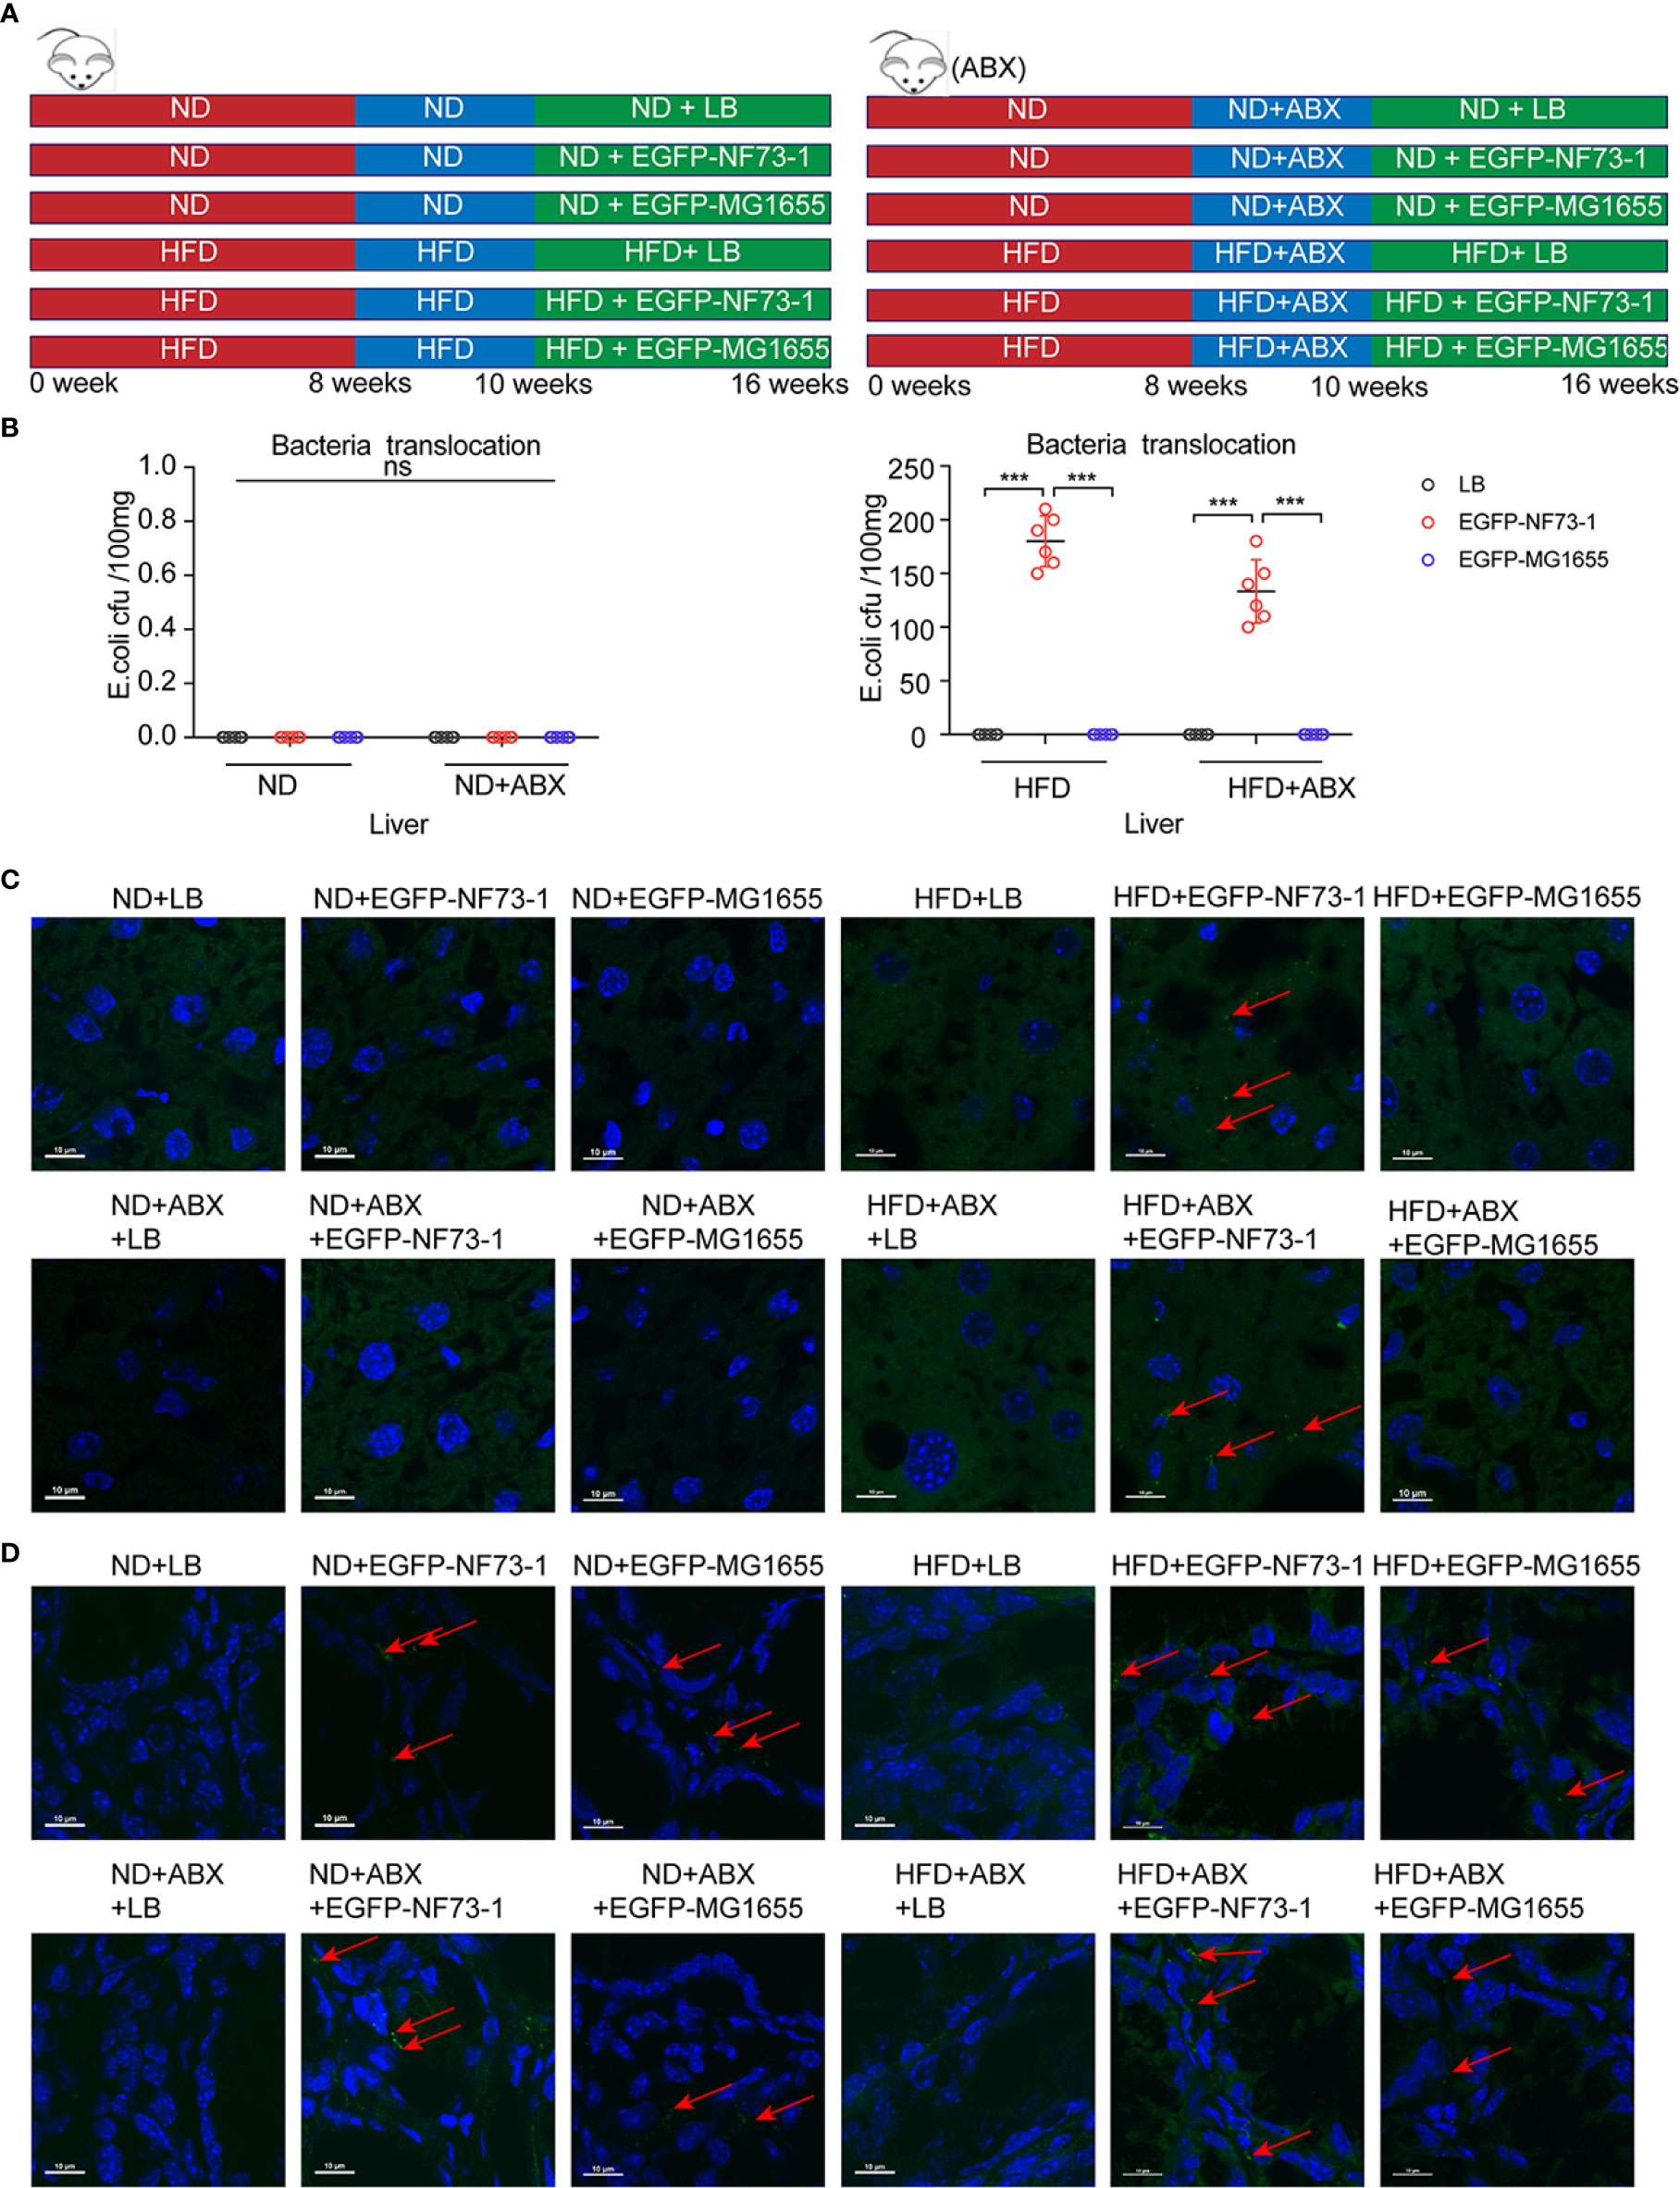
Figure 3 Translocation of E. coli EGFP-NF73-1 into the liver in the HFD-NF73-1 and HFD-ABX-NF73-1 groups and not in the ND-NF73-1 and ND-ABX-NF73-1 groups. (A) Schematic illustration of treatment with E. coli EGFP-NF73-1, E. coli EGFP-MG1655 and LB in ND and HFD mice. (B) Bacterial counts at specific points after oral gavage of NAFLD mice with 108 E. coli EGFP-NF73-1 CFU per 0.1 g of liver. (C) Liver section assessment for E. coli EGFP-NF73-1 in mouse experiments. Highly notable EGFP signal in the livers of the HFD-NF73-1 and HFD-ABX-NF73-1 groups (red arrows, EGFP signal). The white scale bar indicates 10 μm. (D) Intestinal section assessment for E. coli EGFP-NF73-1 in mouse experiments (red arrows, EGFP signal); the white scale bar indicates 10 μm. Data are calculated as the mean ± SEM, n = 6 per group. ns p>0.05, ***p <0.001(unpaired t test). EGFP, enhanced green fluorescent protein; HFD, high-fat diet; ND, normal diet; NAFLD, non-alcoholic fatty liver disease. NS, no significance.
Notably, in the ND-EGFP-NF73-1, ND-ABX-EGFP-NF73-1, ND-EGFP-MG1655, and ND-ABX-EGFP-MG1655 groups, E. coli EGFP-NF73-1 and E. coli MG1655 were detected in the intestine but not in the liver, as confirmed by immunofluorescence and bacterial culture experiments (Figures 3B–D). However, in the HFD-EGFP-NF73-1 and HFD-ABX-EGFP-NF73-1 groups, E. coli EGFP-NF73-1 was detected not only in the intestine but also in the liver (Figures 3B–D).
Therefore, regardless of antibiotic cocktail treatment, E. coli EGFP-NF73-1 can adhere to the intestinal mucosa and translocate into the liver in NAFLD mice, but not in ND mice, via the gut-liver axis.
E. coli NF73-1 Promoted M1 Macrophage Polarization in NAFLD Mice
We subsequently attempted to identify the liver immune cell subtypes of NAFLD mice by flow cytometry analysis after E. coli NF73-1 administration.
Notably, the population of CD45+CD11b+F4/80+ macrophages was significantly increased in the HFD-NF73-1 group compared with the HFD-LB group (Figures 4A, B). Flow cytometry analyses revealed no changes in hepatic lymphocyte and neutrophil populations between the HFD-NF73-1 and HFD-LB groups (Figures 4C, D). Furthermore, E. coli NF73-1 led to a sharp increase in M1 (CD45+ly6G-F4/80+CD11b+CD86+CD206-) macrophages and a decrease in M2 (CD45+ly6G-F4/80+CD11b+CD206+CD86−) macrophages, indicating preponderant M1 polarization in the HFD-NF73-1 group (Figures 4A, B). In addition, these effects were also observed in flora-deficient HFD mice (Figures 4A–D). Collectively, E. coli NF73-1 might promote the progression of steatohepatitis by acting on hepatic M1 macrophage polarization.
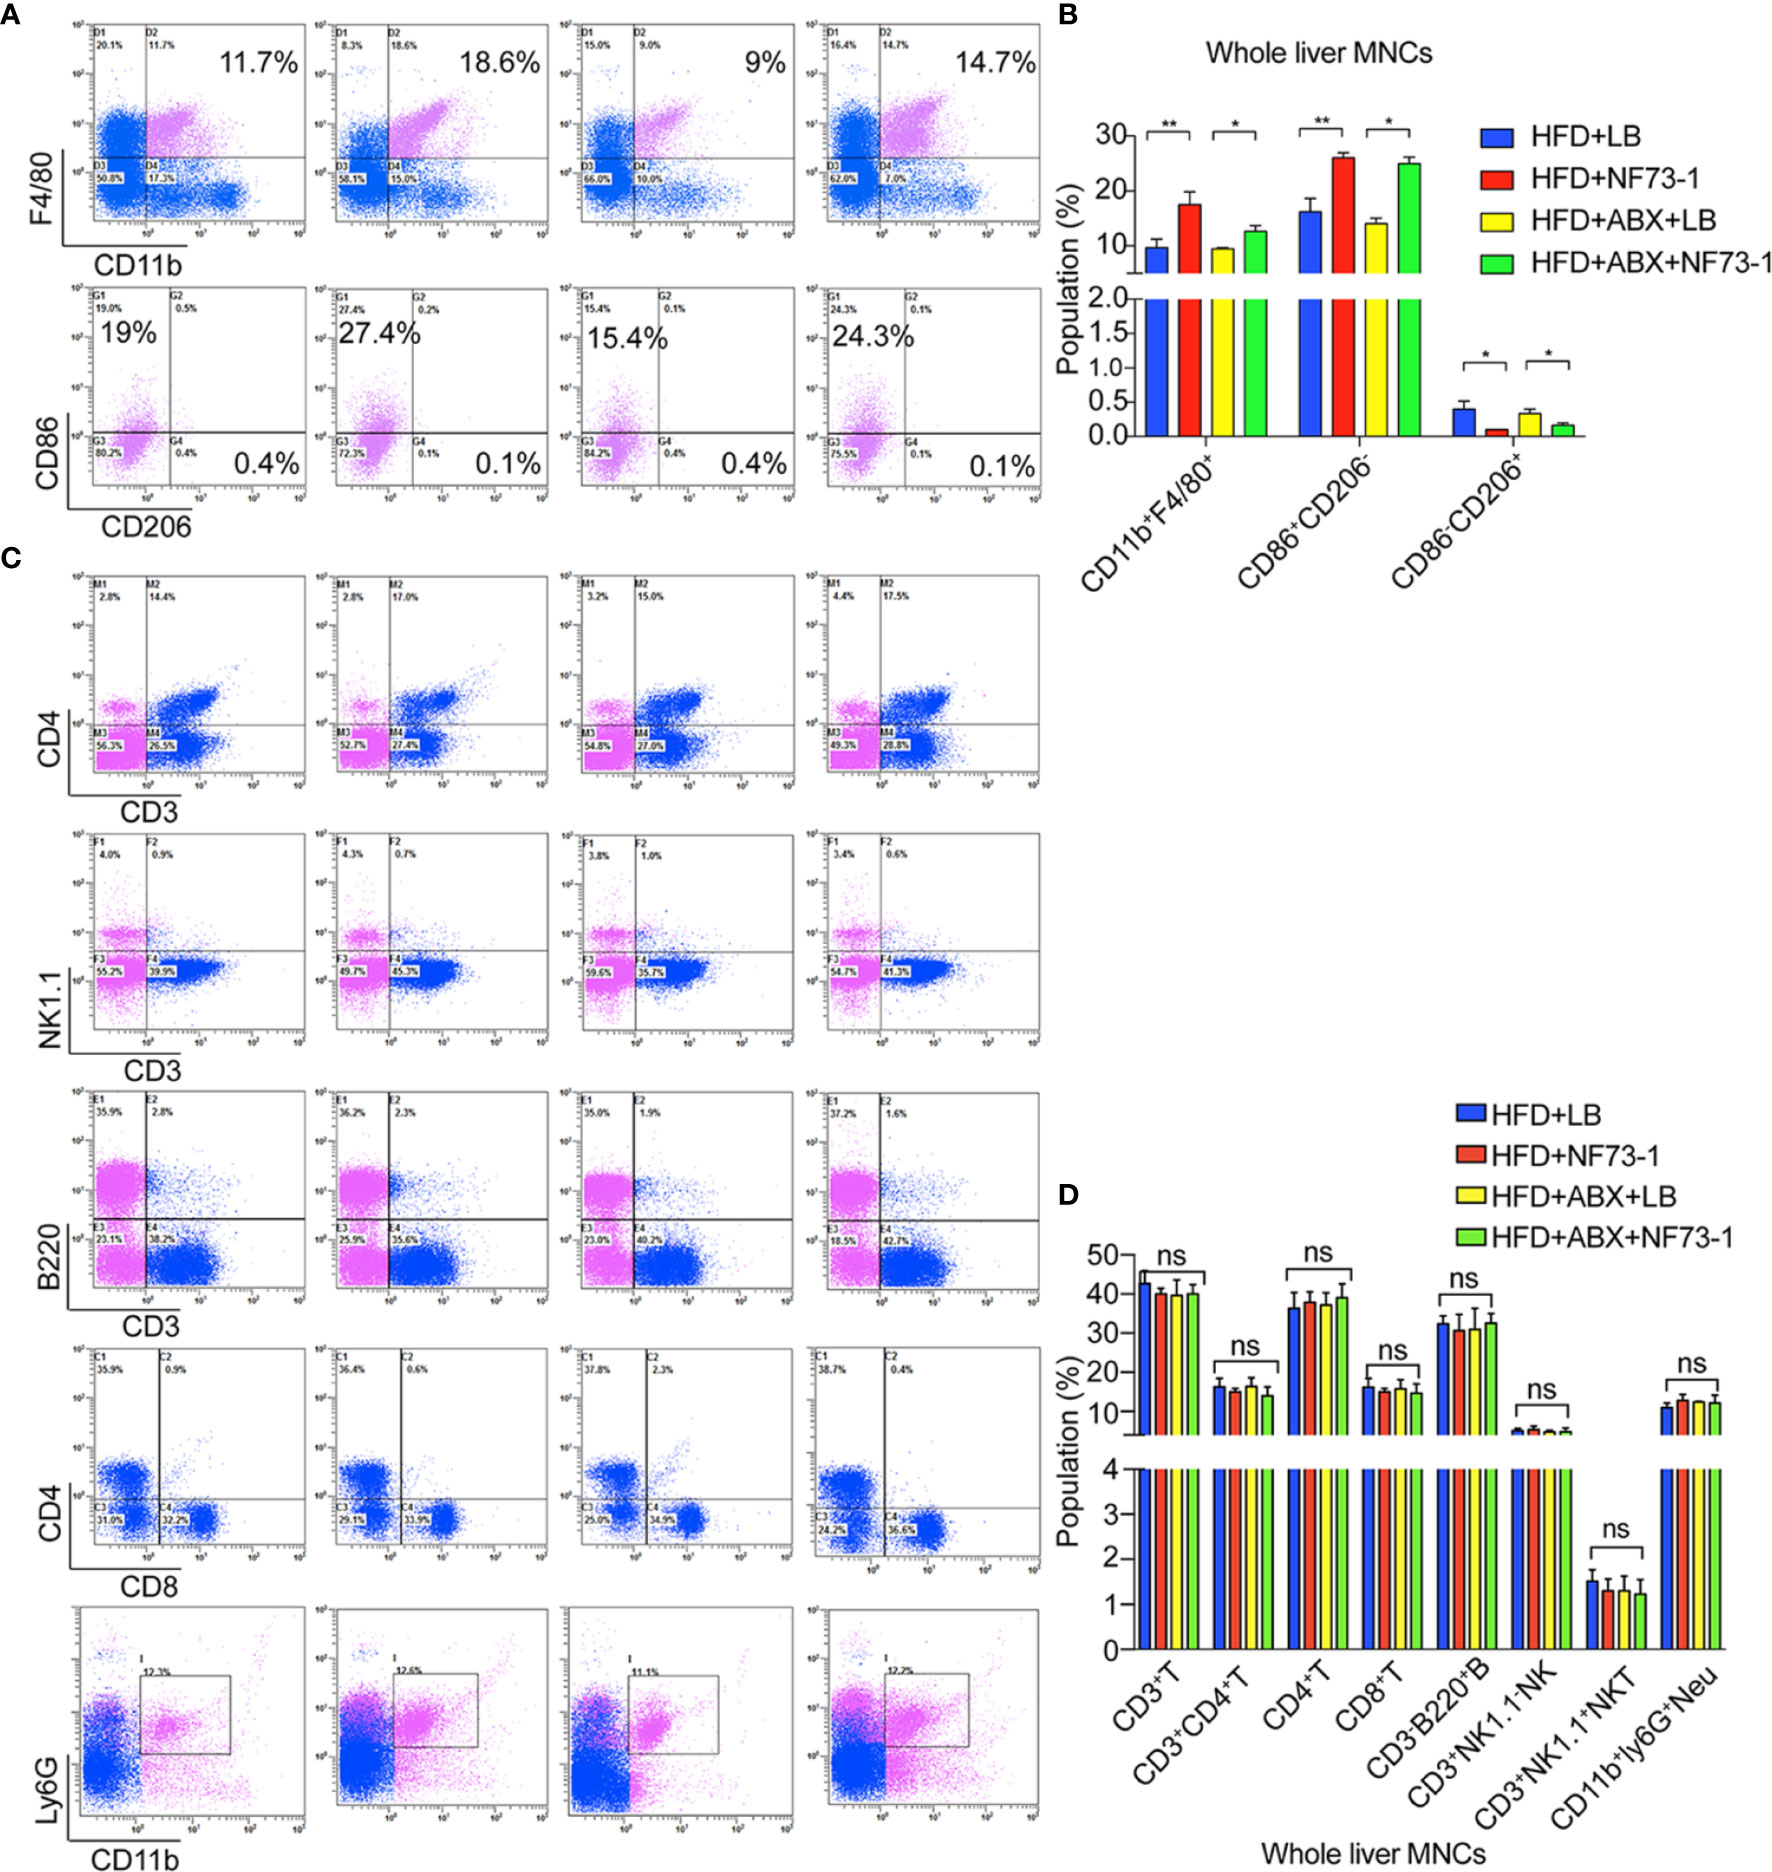
Figure 4 M1 macrophage polarization in NAFLD mice with E. coli EGFP-NF73-1. (A) Representative flow cytometric plots of the CD45+F4/80+CD11b+ liver macrophage population, M1(CD45+F4/80+CD11b+CD206-CD86+) and M2(CD45+F4/80+CD11b+CD86-CD206+) in the livers of the HFD-NF73-1, HFD-LB, HFD-ABX-NF73-1, and HFD-ABX-LB groups; (B) Liver macrophage counts in the livers of the HFD-NF73-1, HFD-LB, HFD-ABX-NF73-1, and HFD-ABX-LB groups; (C) Representative flow cytometric plots of the liver lymphocyte and neutrophil populations in the livers of the HFD-NF73-1, HFD-LB, HFD-ABX-NF73-1, and HFD-ABX-LB groups; (D) Lymphocyte and neutrophil counts in the livers of the HFD-NF73-1, HFD-LB, HFD-ABX-NF73-1, and HFD-ABX-LB groups. Data are calculated as the mean ± SEM, n = 4–6 per group. ns p>0.05, *p <0.05, **p <0.01 (unpaired t test). NAFLD, non-alcoholic fatty liver disease; HFD, high-fat diet.; NS, no significance.
Depletion of Macrophages Attenuates E. coli NF73-1-Induced Hepatic Inflammation and Hepatosteatosis
We treated HFD and flora-deficient HFD mice with liposome-encapsulated clodronate (CLOD) to deplete macrophages or liposome-encapsulated PBS as a negative control (Figure 5A). Macrophages were significantly depleted by injection of CLOD in the HFD-NF73-1 and HFD-ABX-NF73-1 groups (Figure 5B). Liver H&E staining revealed that the depletion of polarized macrophages could significantly reduce hepatic steatosis and inflammation (Figure 5C). Liver enzymes and NAS were dramatically alleviated in the HFD-NF73-1 and HFD-ABX-NF73-1 groups treated with CLOD (Figures 5D, E). These results suggested that removing polarized M1 macrophages significantly ameliorated the liver damage and lipid abnormalities caused by E. coli NF73-1 in NAFLD mice.
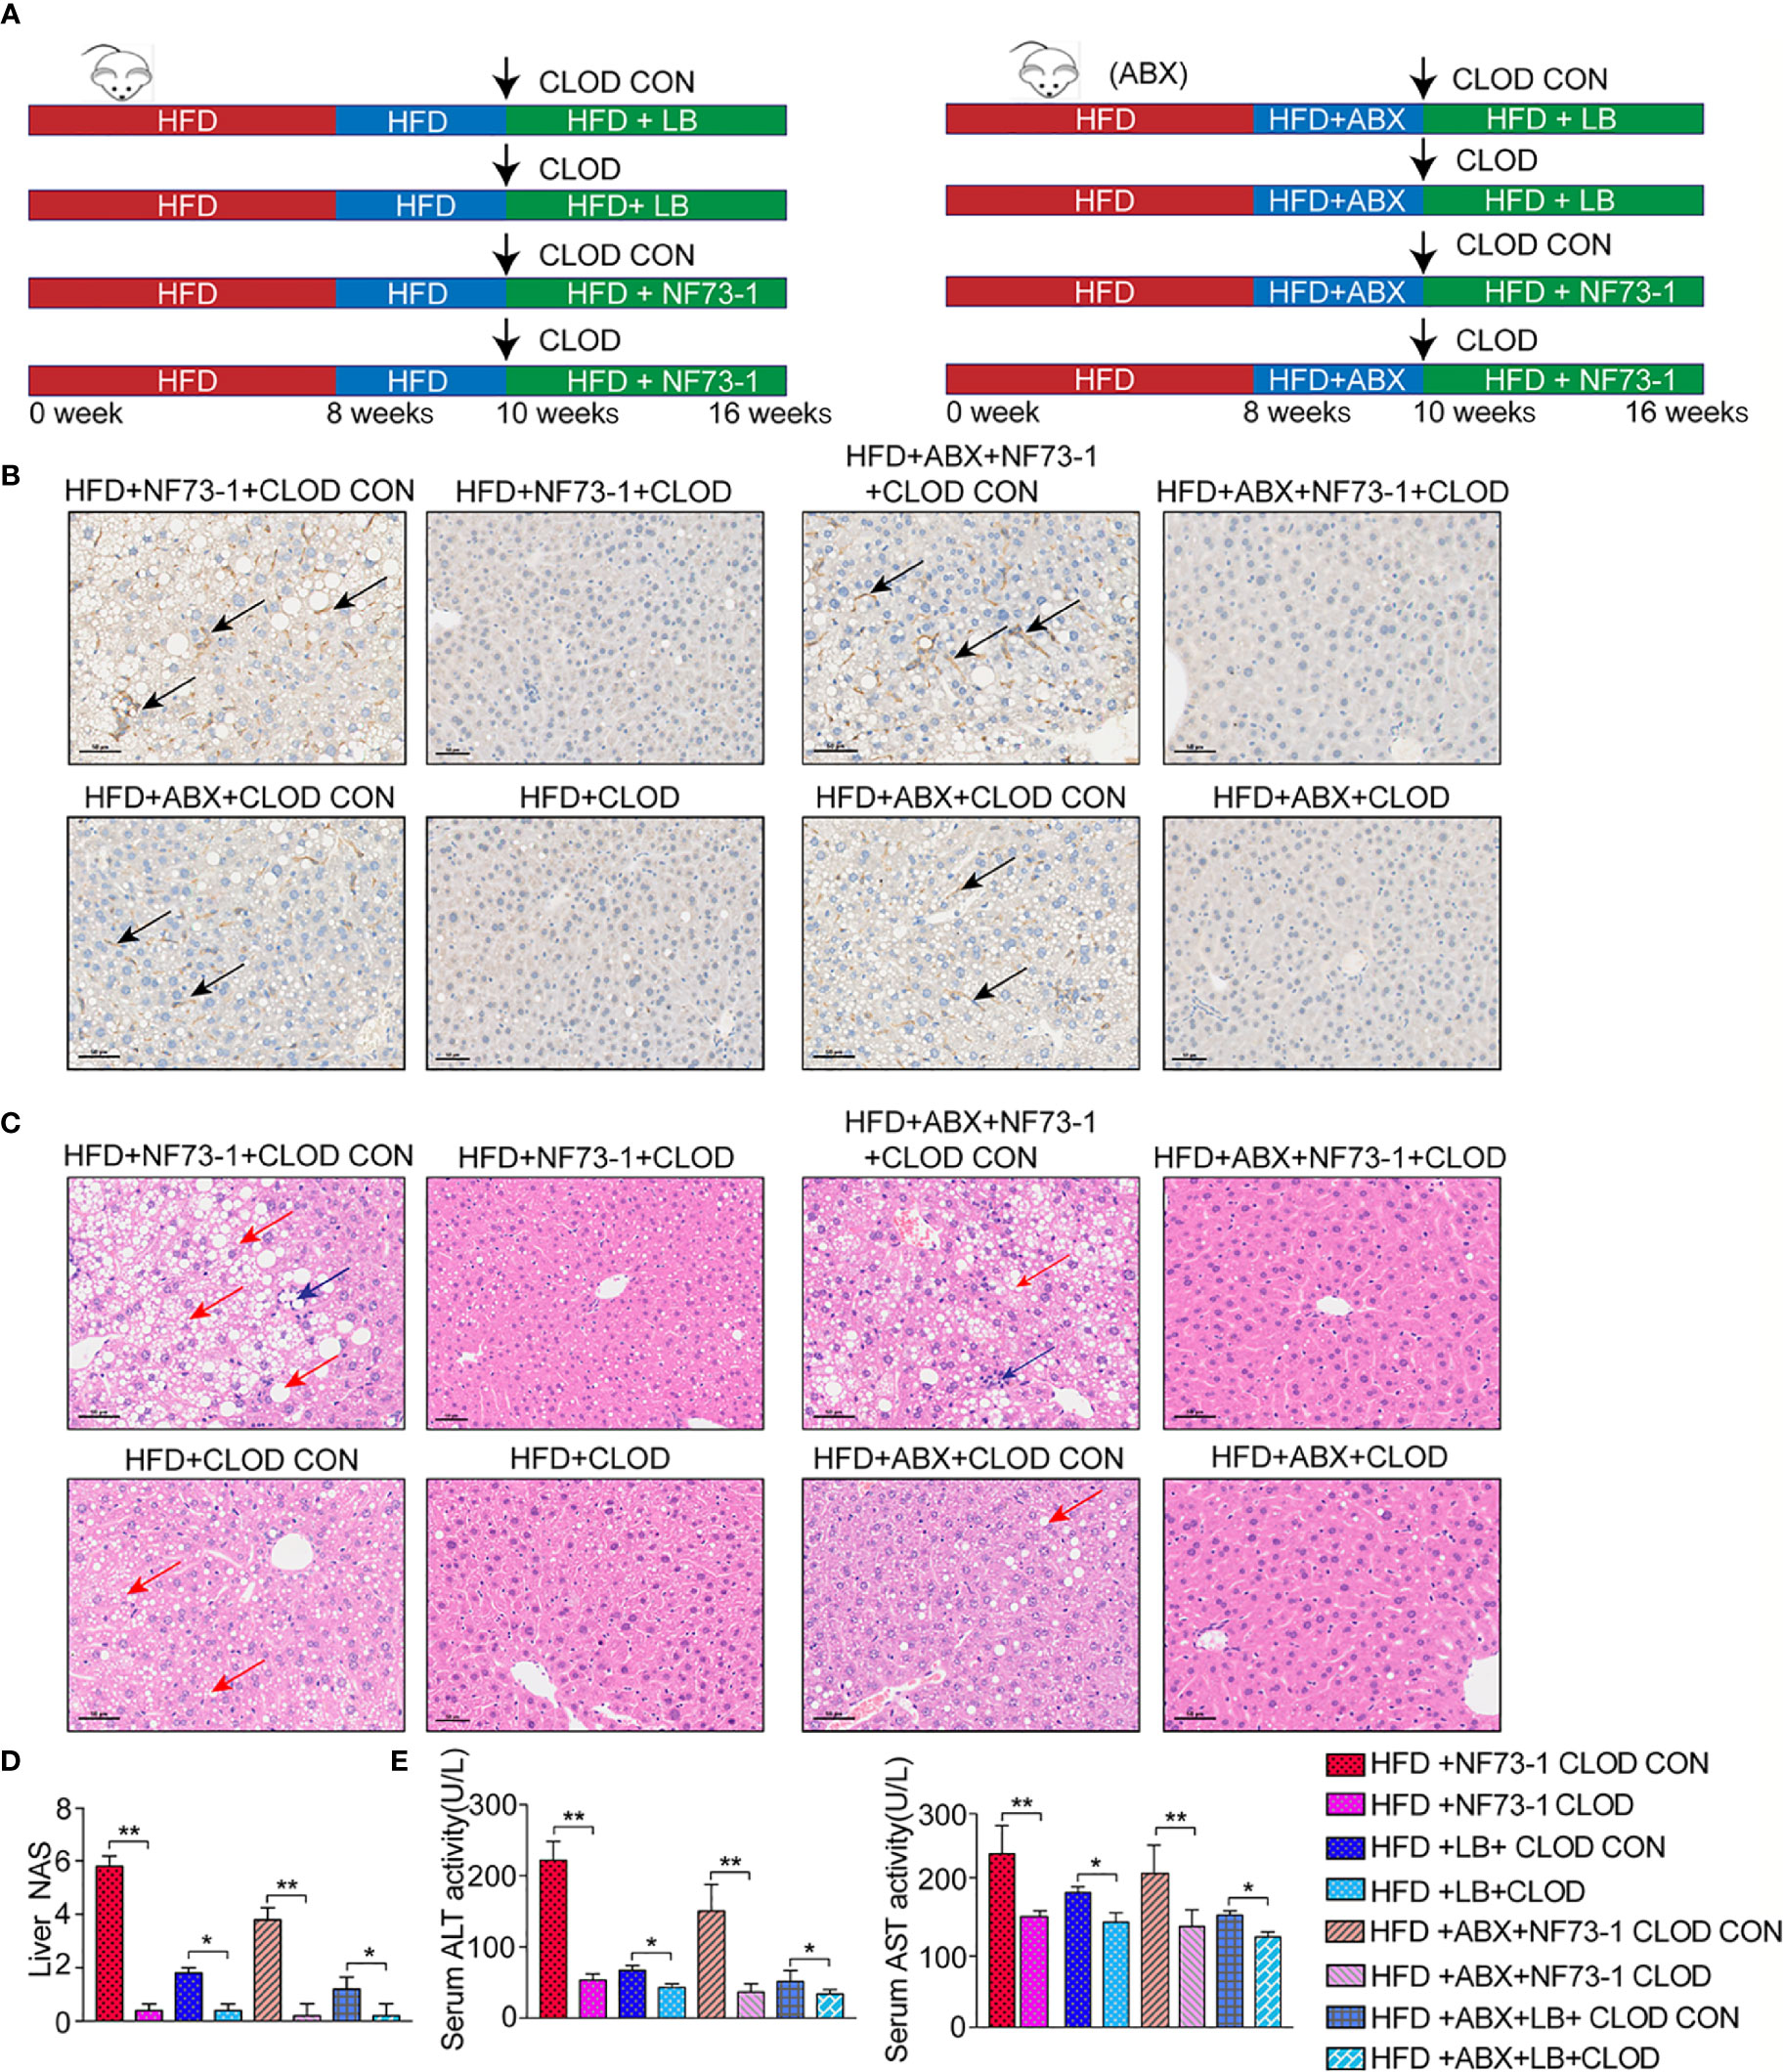
Figure 5 Pharmacological CLOD liposomes prevented E. coli NF73-1–induced steatohepatitis in NAFLD mice. (A) Schematic illustration of effective CLOD liposomes and control CLOD liposomes in the HFD and HFD-ABX groups with or without treatment with E. coli NF73-1. (B) Representative immunohistochemistry images for F4/80 in livers from the HFD-NF73-1, HFD-LB, HFD-ABX-NF73-1, and HFD-ABX-LB groups depleted of macrophages by CLOD treatment. (C) Representative H&E images of livers (blue arrows, inflammatory cells; red arrows, steatosis); black scale bar indicates 50 μm. (D) NAS analysis of liver samples. (E) Sreum ALT and AST in each group. Data are calculated as the mean ± SEM, n = 4–6 per group. *p <0.05, **p <0.01 (unpaired t test). NAFLD, non-alcoholic fatty liver disease; HFD, high-fat diet; ALT, alanine aminotransferase; AST, aspartate aminotransferase; H&E, hematoxylin & eosin; NAS, NAFLD activity score; CLOD, clodronate liposome; CLOD CON, clodronate liposome control.
E. coli NF73-1 Induces RAW264.7 Macrophage M1 Polarization by Activating Toll-Like Receptor 2 (TLR2)-NF-κB/NLRP3-Caspase-1 Signaling In Vitro
We validated the effect of E. coli NF73-1 on M1 polarization in vitro (Figure 6A). We found that the proportion of M1 (CD11b+F4/80+CD86+CD206-) macrophages markedly increased after treatment with E. coli NF73-1 (Figures 6B, C). Moreover, after coculture with E. coli NF73-1, RAW264.7 macrophages showed increased expression of most proinflammatory cytokines (TNF-α, IL-6, IL-1β, and iNOS) and decreased expression of tissue repair-related M2 genes (Arg1, Mrc2, and IL-10) (Figure 6D). The cytokine secretion profiles suggested that E. coli NF73-1 functioned as a proinflammatory agent and induced M1 polarization.
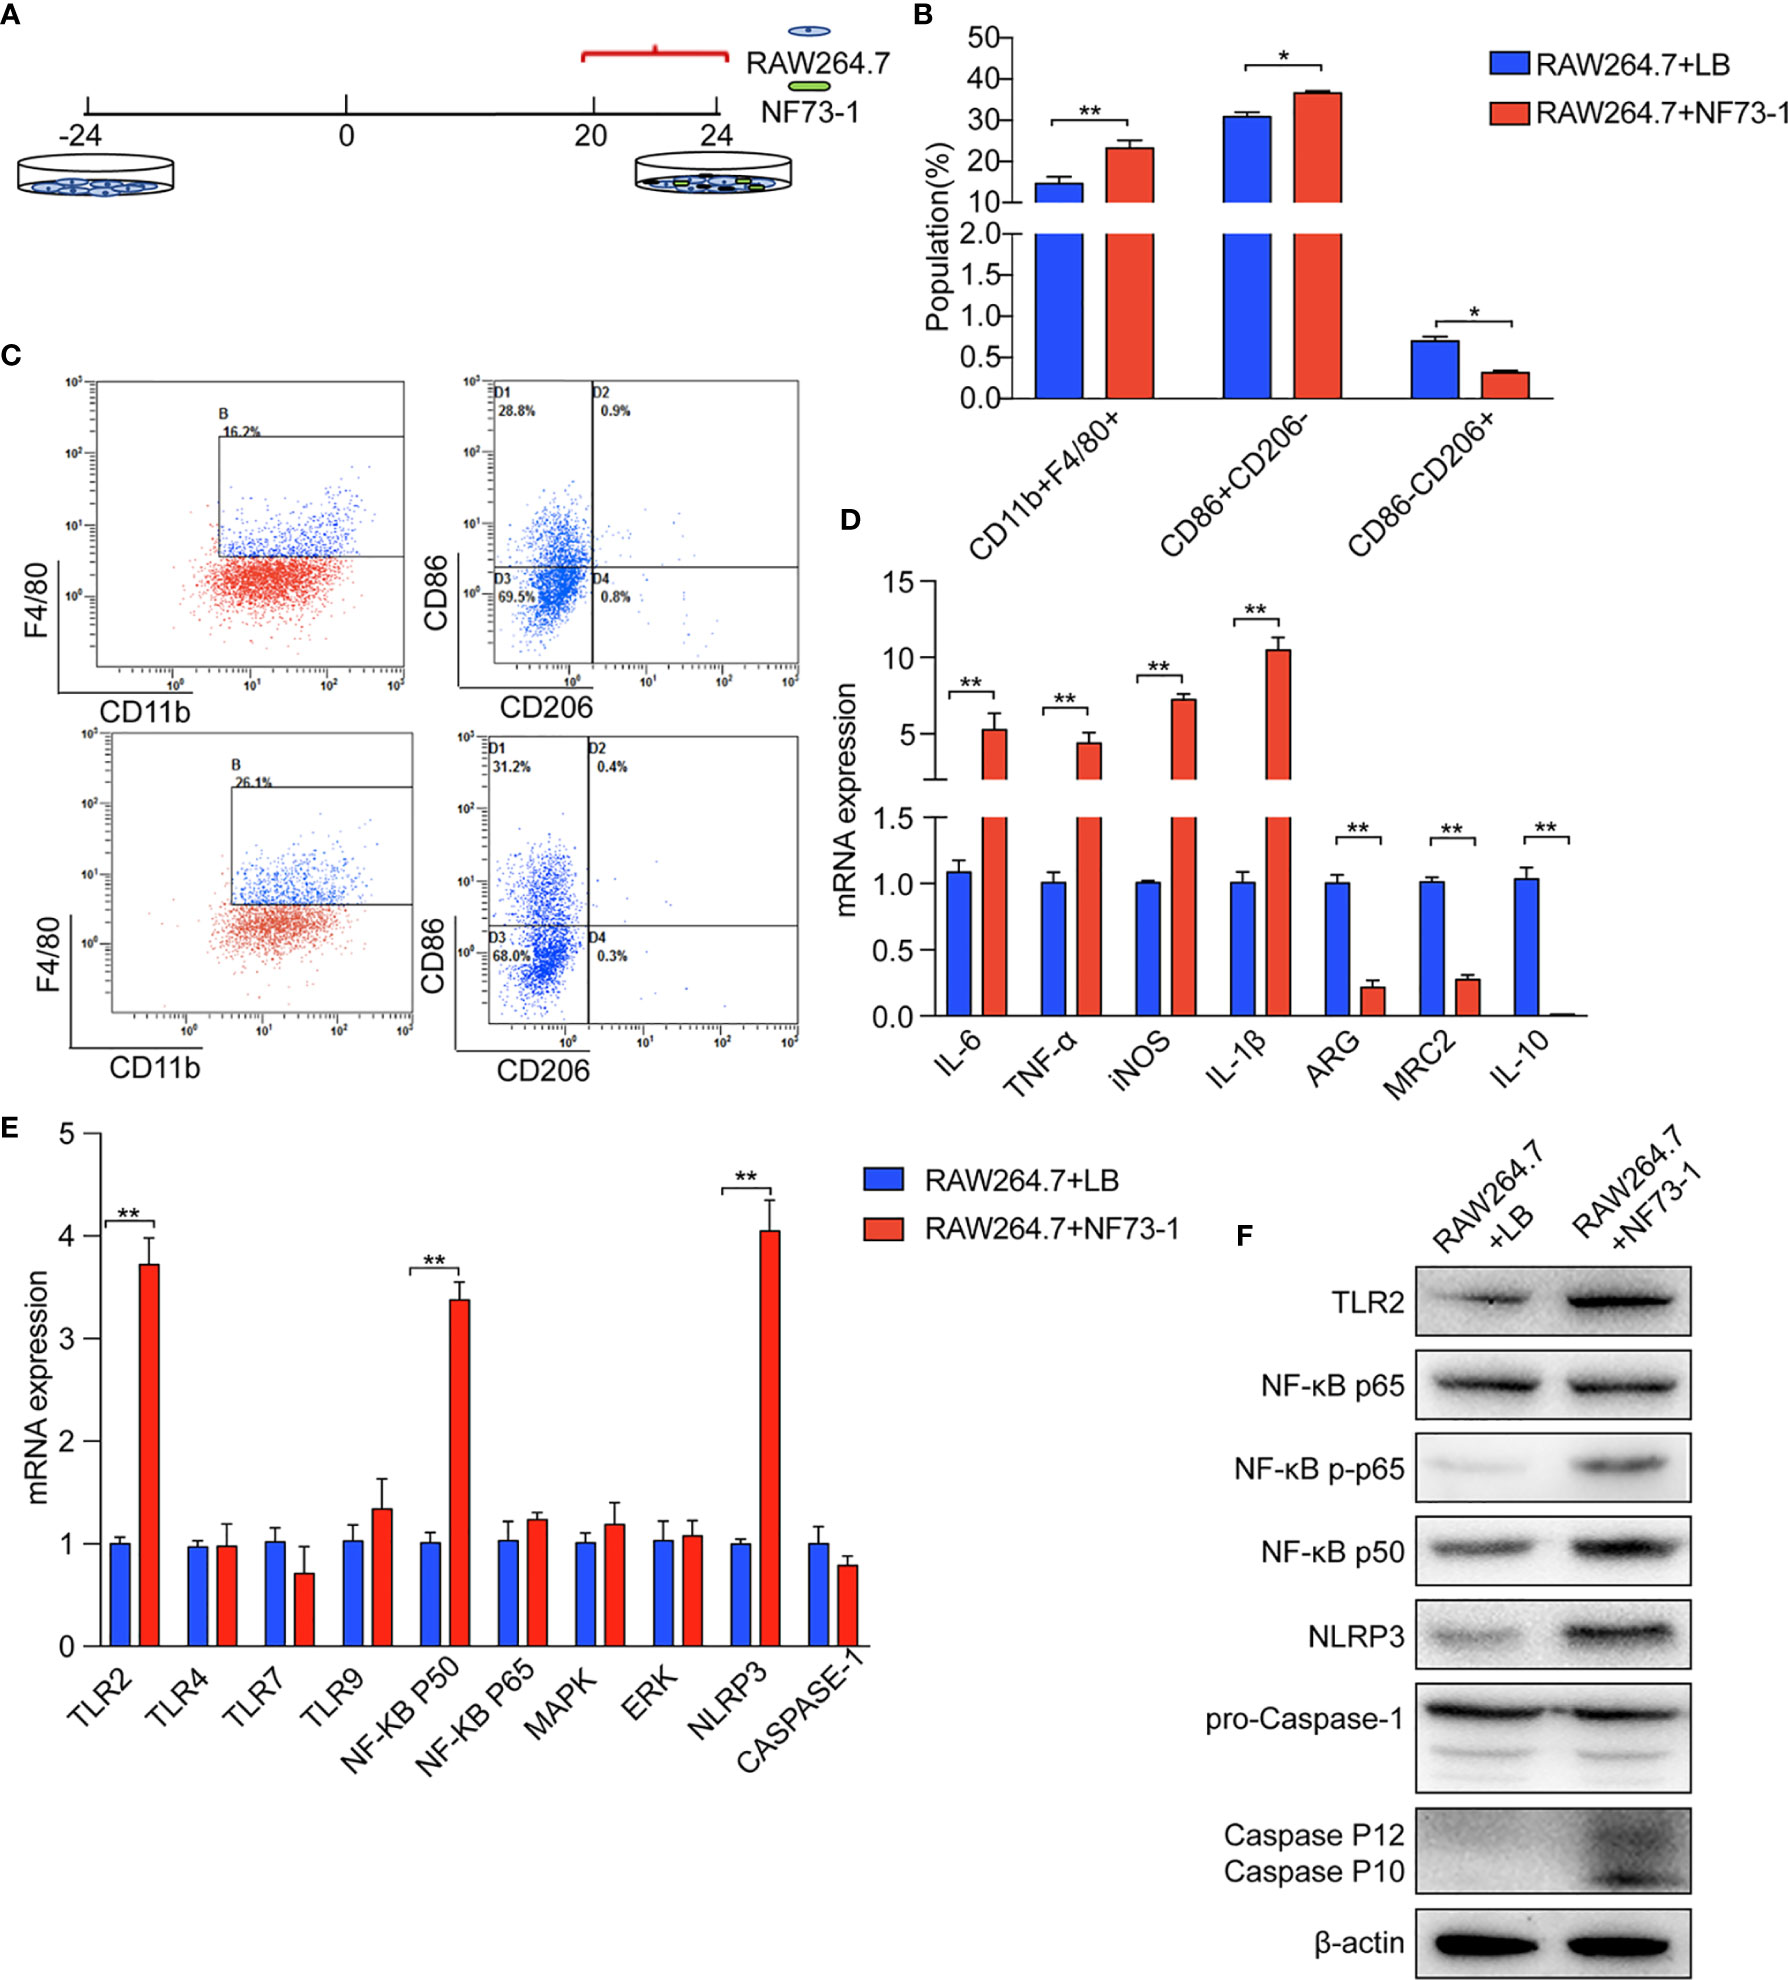
Figure 6 E. coli NF73-1, the inducer of M1 macrophage polarization. (A) RAW264.7 cells exposed to E. coli NF73-1 (multiplicity of infection = 1:10) for 4 h. (B) Effects of E. coli NF73-1 on the expression of CD11b, F4/80, CD86, and CD206 in RAW264.7 cells. RAW264.7 cells were cultured with palmitic acid and oleic acid for 20 h without E. coli NF73-1. (C) Representative flow plots. (D) cDNA expression of M1 and M2 markers after coculture with RAW264.7 and E. coli NF73-1 cells. (E) mRNA expression in RAW264.7 cells. (F) Protein synthesis in RAW264.7 cells. Data are calculated as the mean ± SEM, *p <0.05, **p <0.01 (unpaired t test). TNF-α, tumor necrosis factor α; IL-6, interleukin 6; IL-1β, interleukin 1β; iNOS, inducible nitric oxide synthase; Arg, arginase; Mrc2, macrophage mannose receptor 2, IL-10, interleukin 10; TLR, toll-like receptor; NF-KB, nuclear factor kappa-B; MAPK, mitogen-activated protein kinase; ERK, extracellular regulated protein kinases; NLRP3, Nod-like receptor pyrin domain containing 3.
We found that E. coli NF73-1 stimulation upregulated the mRNA expression of TLR2, nuclear factor-κB (NF-κB) p50, and Nod-like receptor pyrin domain containing 3 (NLRP3), as well as the protein level (Figures 6E, F). E. coli NF73-1 stimulation upregulated the phosphorylation of NF-κB P65 and Cleaved-Caspase-1 on RAW264.7 macrophages (Figure 6F). These results strongly suggested that E. coli NF73-1 directly promotes the activation and polarization of RAW264.7 macrophages via the TLR2-NF-κB/NLRP3-Caspase-1 pathway.
E. coli NF73-1 Induces the Disruption of Triglyceride Synthesis and Oxidation in NAFLD Mice
An excess of fat accumulation was also accompanied by upregulation of sterol regulatory element binding protein-1 (SREBP-1) and downregulation of peroxisome proliferator-activated receptor alpha (PPAR-α) (Chen et al., 2018). E. coli NF73-1-mediated upregulation of SREBP-1 and its target genes, including acetyl-coenzyme A carboxylase (ACC1) and fatty acid synthase (FAS), was significantly higher than in the HFD-LB group (Figure 7A). Moreover, Western blot analysis showed that E. coli NF73-1 exposure caused significant impairment in fatty acid oxidation, as evidenced by decreased expression of the nuclear receptor PPAR-α (Figure 7A).
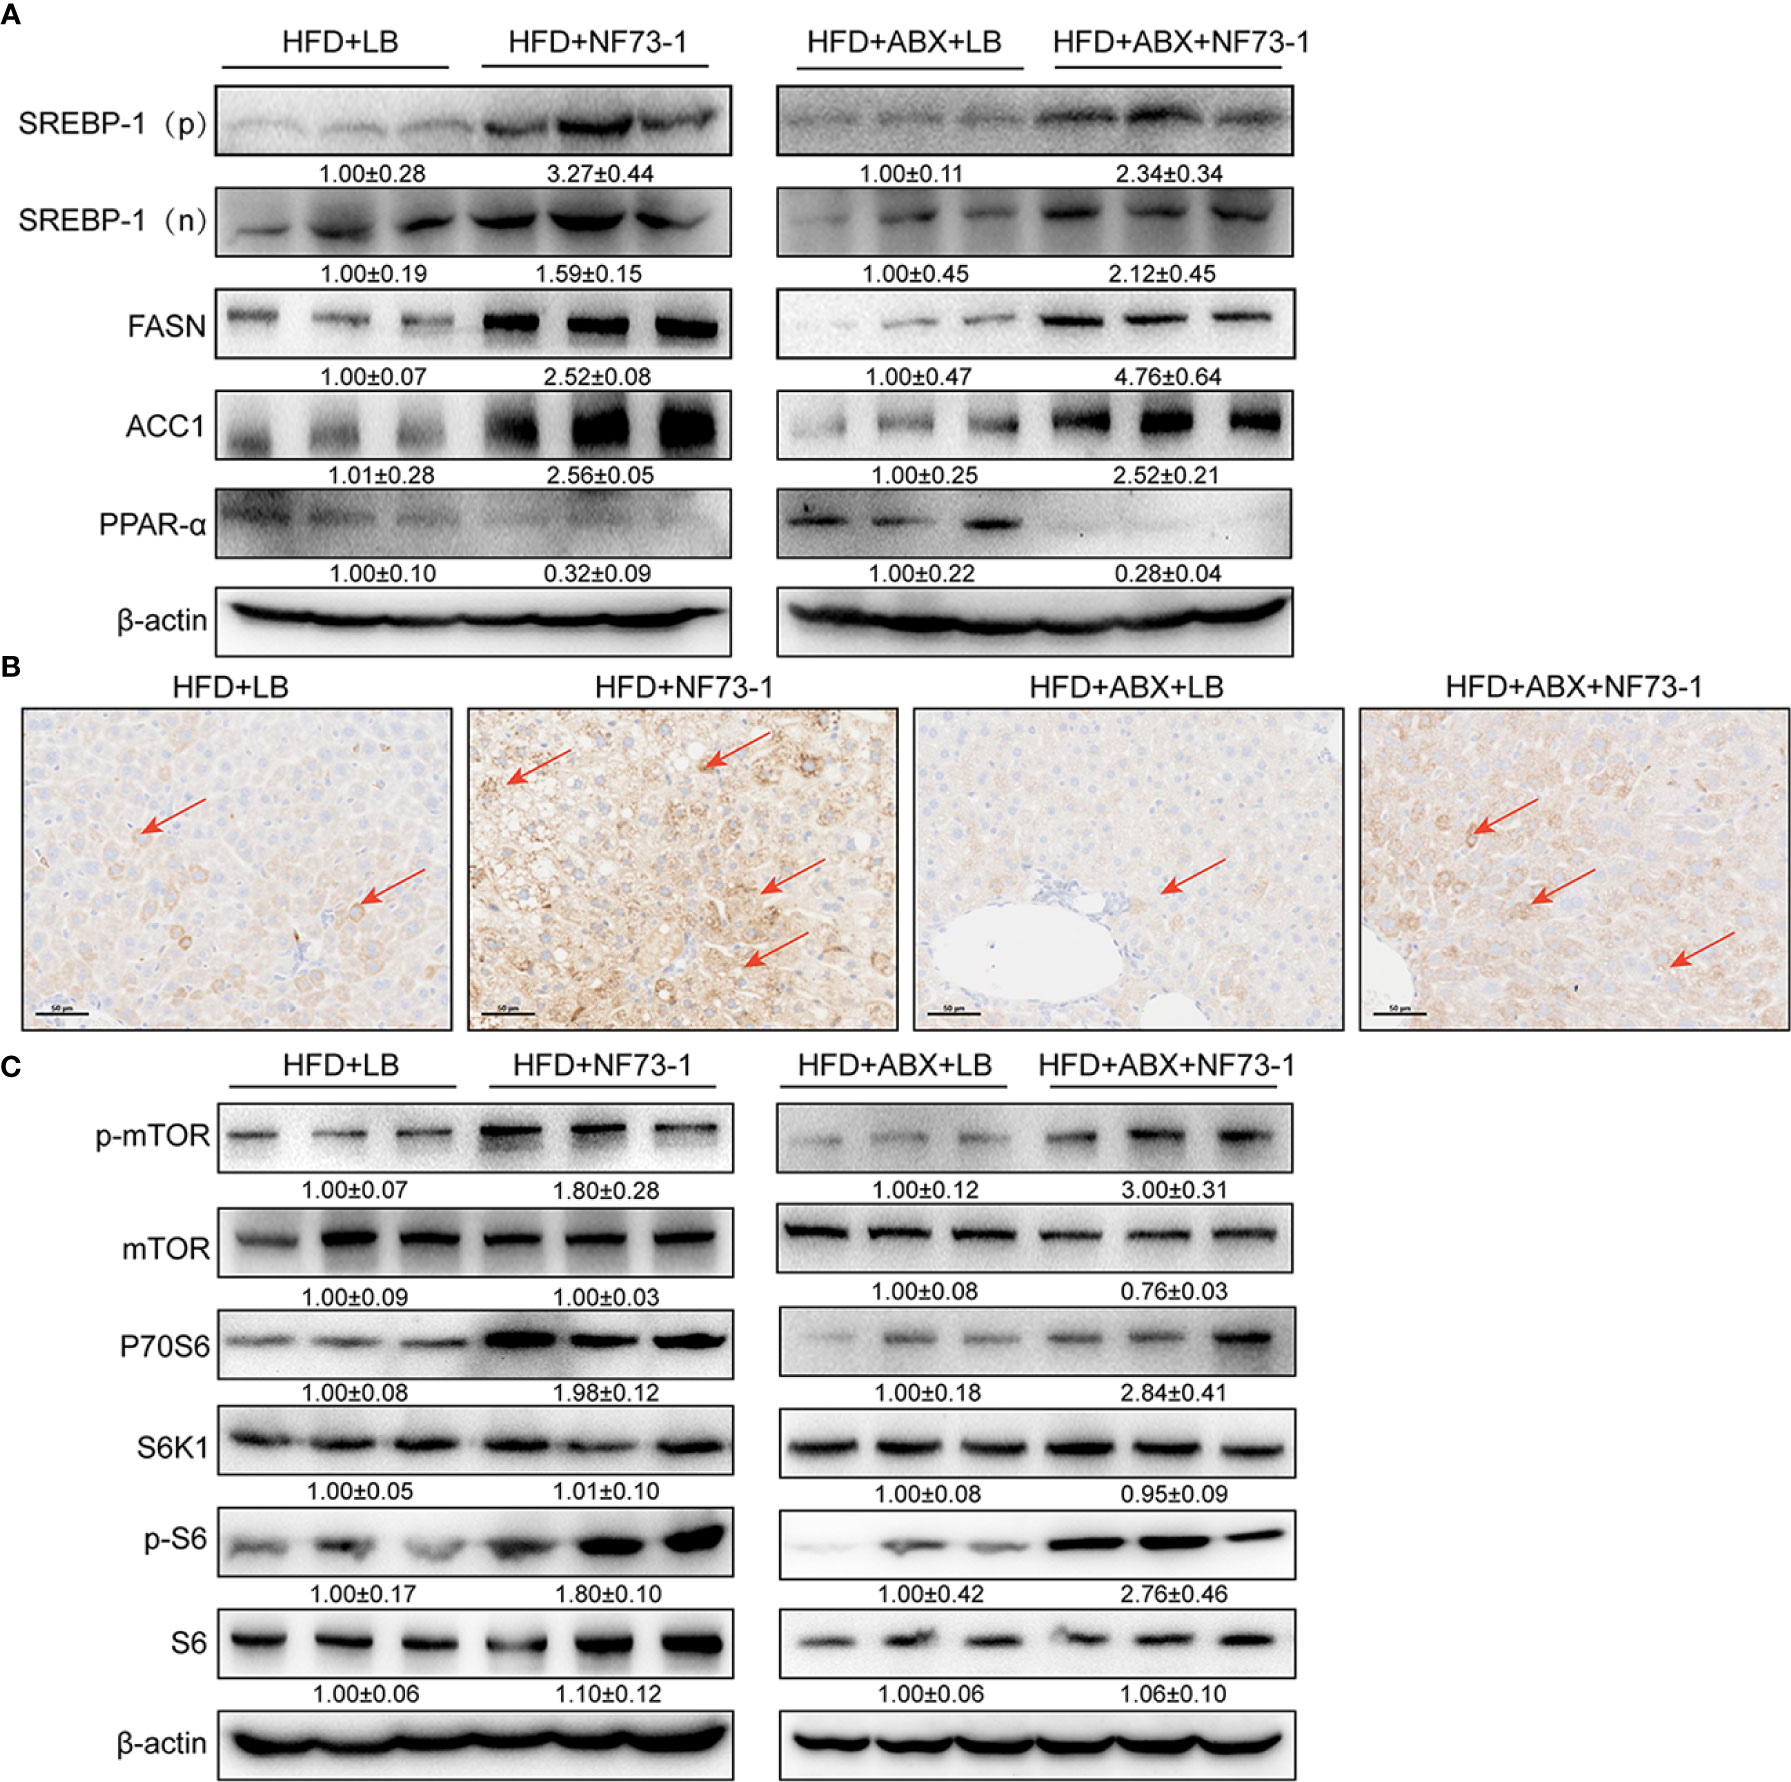
Figure 7 Activation of mTOR signaling and promotion of NAFLD in E. coli NF73-1–fed mice. (A) Increasing nuclear translocation of SREBP-1(N) and expression of SREBP-1 (P), as well as its targets, such as ACC1 and FASN, after E. coli NF73-1 treatment and decreasing PPAR-α expression after E. coli NF73-1 treatment. (B) Positive immunostaining for phosphorylated S6 (brown color), the predominant location in lipid-rich hepatocytes (red arrows) of NAFLD mice. (C) Representative immunoblots of phosphorylation of mTOR, S6K1, and S6 in livers from three mice in each group. Total liver lysates of the indicated genotypes were subjected to western blot analysis and densitometry analysis. Data are means ± SEM (n = 3). NAFLD, non-alcoholic fatty liver disease; mTOR, mammalian target of rapamycin; N, cleaved nuclear (68 kDa) form of SREBP-1; P, precursor (125 kDa) form of SREBP-1; S6K1, S6 kinase 1; SREBP-1, sterol-regulatory element binding protein-1; ACC1, acetyl-coenzyme A carboxylase; FASN, fatty acid synthase; PPAR-α, peroxisome proliferator-activated receptor alpha.
Furthermore, immunohistochemical analysis revealed that elevated positive signals of S6 phosphorylation were colocalized primarily in the cytoplasm of lipid droplet-rich hepatocytes of the HFD-NF73-1 group (Figure 7B). Constitutively activated mTOR greatly elevates de novo lipid synthesis (Duvel et al., 2010; Chen et al., 2018). Phosphorylation of mammalian target of rapamycin (mTOR) at Ser2448 was increased in the HFD-NF73-1 group compared with the HFD-LB group (Figure 7C). Thr389 phosphorylation of S6K1, which is modulated by mTOR, was increased. The phosphorylation of the S40 ribosomal protein S6 at Ser235/Ser236, a well-characterized substrate of S6K1 (S6 kinase 1), was increased (Figure 7C).
In addition, regardless of whether antibiotics were used, the expression of the above genes presented a consistent trend. Collectively, E. coli NF73-1-mediated disruption of mTOR-S6K1-SREBP-1/PPAR-α signaling caused the disruption of triglyceride synthesis and oxidation in NAFLD mice.
M1 Macrophages Stimulated by E. coli NF73-1 Enhance Triglyceride Accumulation via the mTOR/S6K1-Dependent Pathway in Hepatocytes
We investigated whether E. coli NF73-1 is involved in regulating triglyceride accumulation in hepatocytes following translocation (Figure S4A). We proposed that E. coli NF73-1 is a promoting factor of triglyceride accumulation in hepatocytes. However, lipid accumulation in oleic acid- and palmitic acid-induced L02 and H2.35 cells treated with or without E. coli NF73-1 was similar (Figure S4B). E. coli NF73-1 cannot restore the expression of lipolytic genes (PPAR-α, SREBP-1 and p-mTOR) in hepatocytes (Figure S4C). Our results suggest that E. coli NF73-1 could not directly promote lipid accumulation in hepatocytes.
In vitro, E. coli NF73-1 enriched lipid accumulation in oleic acid- and palmitic acid-induced L02 and H2.35 cells via M1 polarized RAW264.7 macrophages (Figure 8A), respectively, which was more significant than the accumulation observed in the non-E. coli NF73-1 coculture group. The expression of p-mTOR and its downstream genes was altered consistently between the 2 cell lines, leading to increased lipid synthesis and reduced lipid oxidation catabolism (Figures 8B, C). These pathways coincide with those observed in NAFLD mice, consistent with lipid dysmetabolism. After adding rapamycin, an inhibitor of p-mTOR, the lipid accumulation and gene expression profiles were significantly reversed and showed consistent changes in the two cell lines (Figures 8B, C).
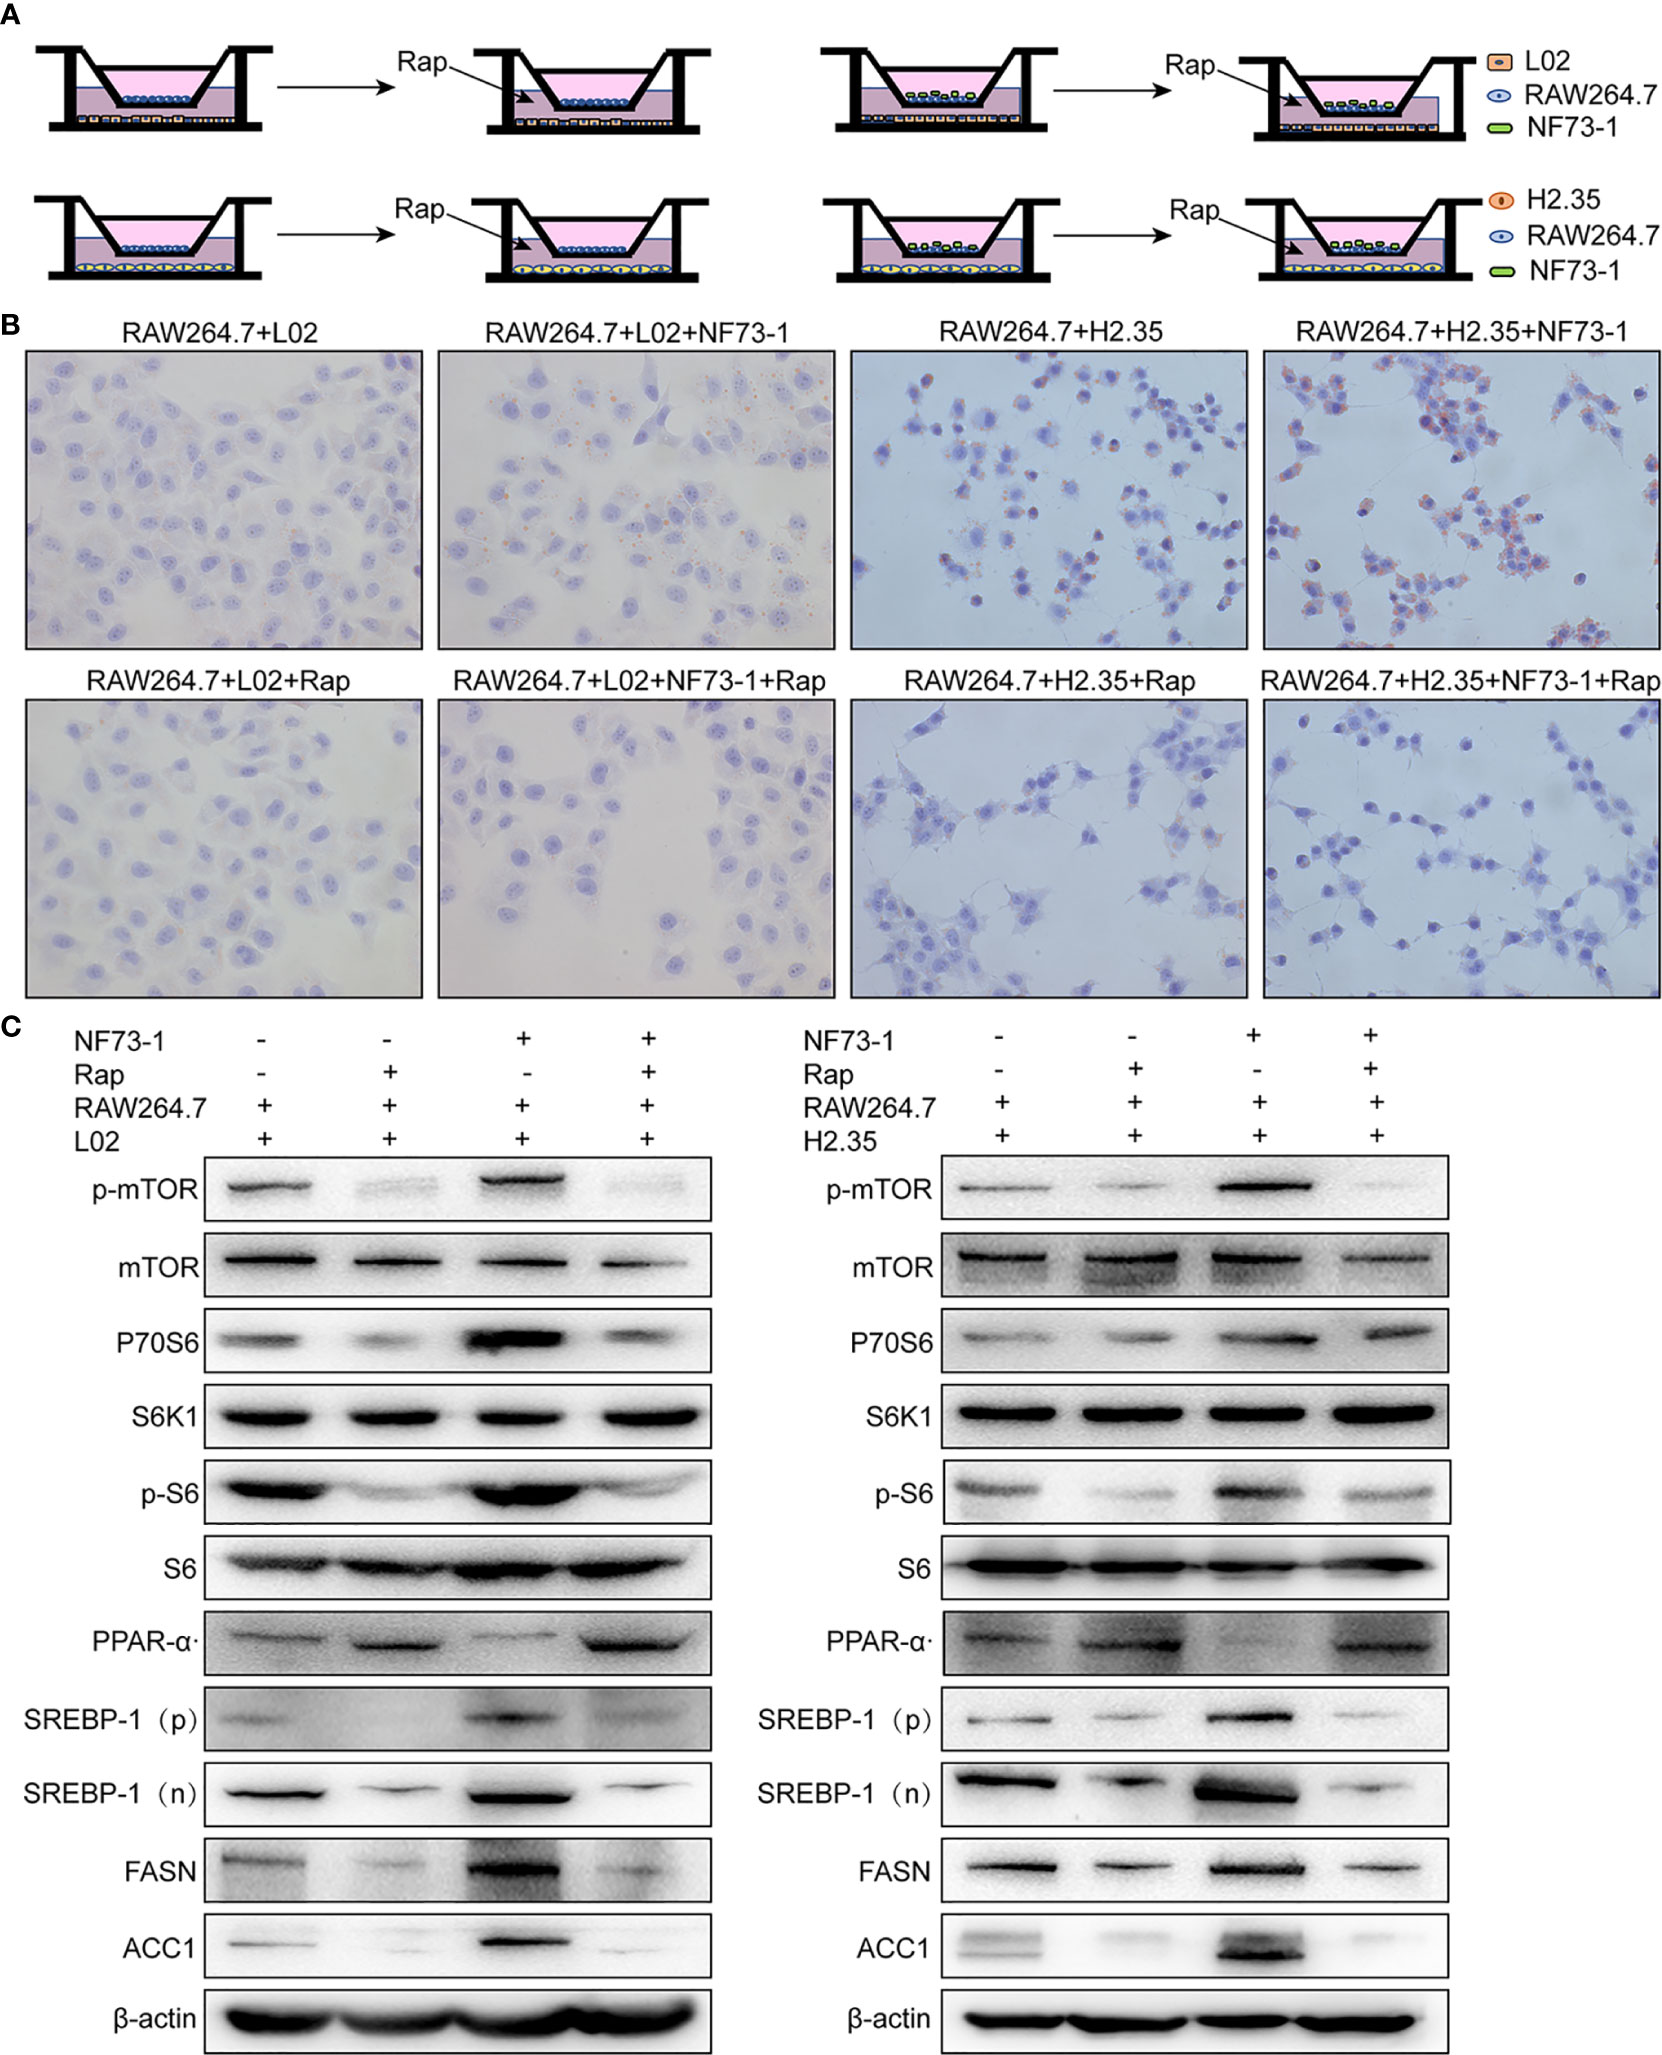
Figure 8 E. coli NF73-1, the inducer of M1 polarization and hepatocyte steatohepatitis in vitro. (A) Schematic illustration of L02 and H2.35 hepatocytes with RAW264.7, in the presence or absence E. coli NF73-1 and rapamycin with palmitic acid- and oleic acid-containing medium. (B) Lipid accumulation detected by Oil Red O staining in hepatocytes cocultured with RAW264.7 in the presence or absence E. coli NF73-1 and rapamycin with palmitic acid- and oleic acid-containing medium. (C) Protein synthesis of phosphorylated mTOR, S6K1, S6, SREBP-1, ACC1, FASN, and PPAR-α in palmitic acid- and oleic acid-treated hepatocytes cocultured with or without E. coli NF73-1 and rapamycin. mTOR, mammalian target of rapamycin; S6K1, S6 kinase 1; SREBP-1, sterol-regulatory element binding protein-1; ACC1, acetyl-coenzyme A carboxylase; FASN, fatty acid synthase; PPAR-α, peroxisome proliferator-activated receptor alpha; N, cleaved nuclear (68 kDa) form of SREBP-1; P, precursor (125 kDa) form of SREBP-1.
These experiments showed that E. coli NF73-1 could increase triglyceride synthesis and reduce the catabolism of hepatocytes via the mTOR pathway through the activation of M1 macrophages.
Discussion
The gut microbiota has emerged as a key player in NAFLD (Le Roy et al., 2013; Safari and Gerard, 2019). Increasing evidence has demonstrated a difference in gut microbiota composition between NAFLD patients and healthy controls (Ley et al., 2006; Jiang et al., 2015; Schwimmer et al., 2019). However, previous studies have seldom focused on one specific bacterial strain in the investigation of NAFLD pathogenesis. Therefore, little data available from animal models showing that changes in gut bacterial strains contribute to NAFLD. More importantly, deeper insight into how the gut microbiota influences NAFLD at the strain level is still lacking.
Different strains of different bacterial species have different effects and clinical manifestations in human hosts with NAFLD. Klebsiella pneumoniae, a high-alcohol-producing strain, causes autobrewery syndrome (ABS) and hepatic mitochondrial dysfunction (Yuan et al., 2019). Enterobacter cloacae B29, an opportunistic pathogen, causes obesity in mice via insulin resistance (Fei and Zhao, 2013; Yan et al., 2016). Even different strains of the same bacterial species have different effects in the human host. As shown in the present study, liver injury was not induced by a nonpathogenic control bacterial strain (E. coli MG1655). Indeed, the mechanisms in NAFLD development, which are launched by specific strains of gut microbiota, need to be further explored.
In this study, we also found that the Escherichia abundance increased in NAFLD patients, not only in feces but also in the gut mucosa. E. coli NF73-1, the most highly enriched strain of Escherichia in NAFLD and NASH patients, was successfully isolated from the intestinal mucosa of NASH patients, and its effect on NAFLD progression was confirmed in animal experiments. Several liver diseases have been shown to be influenced by PBT from the gut (Fouts et al., 2012; Manfredo Vieira et al., 2018), such as autoimmune liver disease (Manfredo Vieira et al., 2018), cholestatic liver injury (Liu et al., 2018; Liao et al., 2019), liver cirrhosis (Sorribas et al., 2019) and NAFLD (Wu et al., 2018). We revealed that E. coli NF73-1 translocated into the liver of bacteria-depleted NAFLD mice, which also supported the conclusion regarding PBT. Interestingly, E. coli NF73-1 translocated only into the liver of NAFLD mice. We inferred that this was based on damage to the intestinal mechanical barrier of NAFLD mice (Peterson and Artis, 2014), as well as the immune barrier (Bibbo et al., 2018), intestinal vascular barrier (Mouries et al., 2019) and even liver barrier (Balmer et al., 2014).
We further confirmed that the liver immune response, which was activated by E. coli NF73-1 exposure, was related to the progression from NAFLD to NASH. The data showed that liver macrophages played a critical role in the pathogenic mechanisms of NASH induced by E. coli NF73-1. Liver macrophages exhibit heterogeneity and plasticity in the tissue microenvironment, especially under pathological conditions such as steatohepatitis (Sica et al., 2014). Macrophage infiltration is an early event in the development of NASH and is associated with progressive disease (Gadd et al., 2014). Microbial detection requires the recognition of pathogen-associated molecular patterns (PAMPs) by pattern recognition receptors (PRRs) in innate immune cells (Himes and Smith, 2010; Csak et al., 2011; Jenne and Kubes, 2013; Miura et al., 2013; Mridha et al., 2017). Previous studies have found that macrophages activate local inflammatory responses and cytokine production, and the coactivation of TLR2 and free fatty acids leads to the progression of NASH (Spruss et al., 2009; Miura et al., 2013; Roh and Seki, 2013). Additionally, the NLRP3 inflammasome has been reported to be involved in bacterial recognition as well as macrophage activation. Complex lipids of bacterial origin trigger inflammation through the binding of NLRP3 to induce Caspase-1 cleavage in macrophages (Vandanmagsar et al., 2011). Taken together, the results indicated that E. coli NF73-1 induced the activation of the TLR2-NF-KB/NLRP3-Caspase-1 signaling pathway to mediate the polarization of macrophages.
The different polarization states of macrophages are correlated with their functional diversity (Chawla et al., 2011). Macrophages are generally classified as M1 and M2 phenotypes. Evidence from both human and animal studies suggests that during the progression of NASH, excess metabolites and bacterial products induce macrophage M1 polarization (Itoh et al., 2013; Lotowska et al., 2013; Gadd et al., 2014). In our study, we demonstrated that the M1 polarization induced by E. coli NF73-1 was responsible for the progression of NAFLD. The above findings from animal experiments were further confirmed by in vitro assays. Hence, our data suggested that E. coli NF73-1 was involved in triggering of inflammation in macrophages. Abnormal metabolism of triglycerides is also an important factor in the pathogenesis of NAFLD (Kawano and Cohen, 2013). Previous studies have reported that the mTOR signaling pathway regulates lipid metabolism (Ai et al., 2012). With obesity, overnutrition and alcoholic liver disease (ALD), mTOR is hyperactivated, resulting in persistent activation of SREBP-1 in the liver (Ai et al., 2012). Based on our data, triglyceride metabolism disruption, which was induced by E. coli NF73-1, tended to be an important factor in NAFLD development. We discovered that the mTOR pathway was triggered by E. coli NF73-1 in mice with NAFLD, which is characterized by an increase in mTOR-mediated phosphorylation and activity of S6K1 and S6. We speculate that activation of the mTOR signaling pathway by E. coli NF73-1 might be the mechanism of NAFLD aggravation. Collectively, our data suggested that E. coli NF73-1 switched macrophage polarization to the M1 phenotype, inducing hepatocyte lipolysis.
Numerous studies have shown that gut dysbiosis is a pathogenetic factor that plays a significant role in the development and progression of liver diseases. Different pathogenic bacteria have been found to exert distinct effects in different liver diseases. It is necessary to identify pathogenic bacteria and functional bacteria, which might be a novel target for the prevention and diagnosis of liver diseases. However, most previous studies focused on the disturbance of the gut flora at only the genus and species levels; they did not illustrate how these pathogenic bacteria aggravate liver diseases at the strain level. Thus, more breakthroughs at the strain level are needed to obtain deeper insight into the prevention of liver diseases associated with the gut flora. In summary, the exploration of bacterial strains is a key point for investigating the mechanisms of liver diseases.
In this study, the pathogenic strain was successfully isolated from clinical intestinal mucosa samples. We demonstrated that translocation of intestinal E. coli NF73-1 into the liver was responsible for the high hepatic M1 population, which further aggravated liver injury, leading to disturbance of the hepatic triglyceride metabolism and, eventually, NAFLD progression. In conclusion, E. coli NF73-1 might be a critical trigger in the progression of NAFLD to NASH, and future clinical trials are needed to clarify the role of E. coli NF73-1 in a larger NAFLD population.
Data Availability Statement
The 16S rRNA sequence of different E. coli NF strains have been uploaded to the NCBI GenBank database (MT649758-MT649857).
Ethics Statement
The studies involving human participants were reviewed and approved by the Ethics Committee of Peking University People’s Hospital. The patients/participants provided their written informed consent to participate in this study. The animal study was reviewed and approved by the Ethics Committee of Peking University People’s Hospital.
Author Contributions
Supervision, reviewing and editing, resources: YLL. Writing, Original draft preparation: YFZ. Funding acquisition: YLL. Project administration: YLL. Investigation: YFZ and WWJ. Methodology, software, validation: YFZ, JX, and YW. Data curation, formal analysis: NW, TYL, and YL. All authors contributed to the article and approved the submitted version.
Funding
This work was financially supported by grant from National Key Research and Development Program of China (Grant Number 2017YFC0908903) and the National Natural Science Foundation of China (Grant Number 81873549) and the National Natural Science Foundation of China (Grant Number 82070539).
Conflict of Interest
The authors declare that the research was conducted in the absence of any commercial or financial relationships that could be construed as a potential conflict of interest.
Supplementary Material
The Supplementary Material for this article can be found online at: https://www.frontiersin.org/articles/10.3389/fcimb.2020.535940/full#supplementary-material
Supplementary Figure 1 | Isolation and whole-genome sequencing of clinical Escherichia strains from the intestinal mucosa of NASH patients. (A) Comparison of the seven genera abundance among NASH and NAFLD patients and healthy subjects. (B) Schematic diagram of the overall design and bacterial isolation. (C) Two representative liver H&E images of NASH patients (blue arrows, inflammatory cells; red arrows, steatosis). (D) Negative immunostaining for HBsAg and HBcAg in the NASH patient. (E) Representative image of Escherichia strains on E. coli Chromogenic Medium. (F) Phylogenetic relationships among clinical E. coli strains inferred with the maximum likelihood method based on the full-length 16S rRNA sequence. The black scale bar indicates 100 μm and 50 μm. Data are calculated as the mean ± SEM, n = 9–10 per group. *p <0.05, **p <0.01 (one-way analysis of variance between multiple groups).
Supplementary Figure 2 | General functional annotations of E. coli NF73-1 and body weight of mouse. (A) KEGG general functional annotations of E. coli NF73-1. (B) Body weight of mouse. Data are calculated as the mean ± SEM, n = 5 per group. *p <0.05, **p <0.01 (one-way analysis of variance between multiple groups).
Supplementary Figure 3 | Total bacteria in stool samples with administration of antibiotics in NAFLD mice and the generation of E. coli EGFP-NF73-1. (A) Total bacterial loads in stool samples of NAFLD mice and ND mice treated with antibiotics were determined from the DNA concentrations. Data are calculated as the mean ± SEM, n = 4–6 per group. **p <0.01 (one-way analysis of variance between multiple groups). (B) Representative image of EGFP expression of E. coli EGFP-NF73-1 and E. coli EGFP-MG 1655 strains and the positive control. (C) Flow cytometry gating strategies for liver macrophages. Representative flow cytometric plots. (D) Flow cytometry gating strategies for liver lymphocytes. Representative flow cytometric plots; (E) Flow cytometry gating strategies for RAW264.7 macrophages. Representative flow cytometric plots.
Supplementary Figure 4 | E. coli NF73-1, the non-inducer of lipid accumulation in hepatocytes in vitro. (A) The human liver normal cell line L02 and mouse liver normal cell line H2.35 were exposed to E. coli NF73-1 (multiplicity of infection = 1:10) for 4 h. (B) Lipid accumulation determined by Oil Red O staining of palmitic acid- and oleic acid-treated hepatocytes cocultured with or without E. coli NF73-1. (C) Protein synthesis of phosphorylated mTOR, S6K1, S6, SREBP-1, ACC1, FASN, and PPAR-α in palmitic acid- and oleic acid-treated hepatocytes cocultured with or without E. coli NF73-1. mTOR, mammalian target of rapamycin; S6K1, S6 kinase 1; SREBP-1, sterol-regulatory element binding proteins-1; ACC1, acetyl-coenzyme A carboxylase; FASN, fatty acid synthase; PPAR-a, peroxisome proliferator-activated receptor alpha; N, cleaved nuclear (68 kDa) form of SREBP-1; P, precursor (125 kDa) form of SREBP-1.
Abbreviations
NAFLD, non-alcoholic fatty liver disease; ABX, broad-spectrum antibiotics complex; ALT, alanine aminotransferase; AST, aspartate aminotransferase; TC, total cholesterol; TG, total triglyceride; H&E, hematoxylin & eosin; NAS, NAFLD activity score; TNF-α, tumor necrosis factor α; IL-6, interleukin 6; IL-1β, interleukin 1β; ND, normal diet; HFD, high-fat diet; EGFP, enhanced green fluorescent protein; H&E, hematoxylin & eosin; iNOS, inducible nitric oxide synthase; Arg, arginase; Mrc2, macrophage mannose receptor 2, IL-10, interleukin 10; TLR, toll-like receptor; NF-KB, nuclear factor kappa-B; MAPK, mitogen-activated protein kinase; ERK, extracellular regulated protein kinases; NLRP3, Nod-like receptor pyrin domain containing 3; mTOR, mammalian target of rapamycin; N, cleaved nuclear form of SREBP-1; P, precursor form of SREBP-1; S6K1, S6 kinase 1; SREBP-1, sterol-regulatory element binding protein-1; ACC1, acetyl-coenzyme A carboxylase; FASN, fatty acid synthase; PPAR-α, peroxisome proliferator-activated receptor alpha; ABX, broad-spectrum antibiotics complex.
References
Ai D., Baez J. M., Jiang H., Conlon D. M., Hernandez-Ono A., Frank-Kamenetsky M., et al. (2012). Activation of ER stress and mTORC1 suppresses hepatic sortilin-1 levels in obese mice. J. Clin. Invest. 122, 1677–1687. doi: 10.1172/JCI61248
Backhed F., Ding H., Wang T., Hooper L. V., Koh G. Y., Nagy A., et al. (2004). The gut microbiota as an environmental factor that regulates fat storage. Proc. Natl. Acad. Sci. U.S.A. 101, 15718–15723. doi: 10.1073/pnas.0407076101
Balmer M. L., Slack E., de Gottardi A., Lawson M. A. E., Hapfelmeier S., Miele L., et al. (2014). The Liver May Act as a Firewall Mediating Mutualism Between the Host and Its Gut Commensal Microbiota. Sci. Transl. Med. 6 (237), 237ra66. doi: 10.1126/scitranslmed.3008618
Bibbo S., Ianiro G., Dore M. P., Simonelli C., Newton E. E., Cammarota G. (2018). Gut Microbiota as a Driver of Inflammation in Nonalcoholic Fatty Liver Disease. Mediators Inflammation 2018, 9321643. doi: 10.1155/2018/9321643
Boursier J., Mueller O., Barret M., Machado M., Fizanne L., Araujo-Perez F., et al. (2016). The severity of nonalcoholic fatty liver disease is associated with gut dysbiosis and shift in the metabolic function of the gut microbiota. Hepatology 63, 764–775. doi: 10.1002/hep.28356
Brandt A., Jin C. J., Nolte K., Sellmann C., Engstler A. J., Bergheim I. (2017). Short-Term Intake of a Fructose-, Fat- and Cholesterol-Rich Diet Causes Hepatic Steatosis in Mice: Effect of Antibiotic Treatment. Nutrients 9(9), 1013. doi: 10.3390/nu9091013
Caporaso J. G., Kuczynski J., Stombaugh J., Bittinger K., Bushman F. D., Costello E. K., et al. (2010). QIIME allows analysis of high-throughput community sequencing data. Nat. Methods 7, 335–336. doi: 10.1038/nmeth.f.303
Chalasani N., Younossi Z., Lavine J. E., Diehl A. M., Brunt E. M., Cusi K., et al. (2012). The diagnosis and management of non-alcoholic fatty liver disease: practice guideline by the American Gastroenterological Association, American Association for the Study of Liver Diseases, and American College of Gastroenterology. Gastroenterology 142, 1592–1609. doi: 10.1053/j.gastro.2012.04.001
Chawla A., Nguyen K. D., Goh Y. P. (2011). Macrophage-mediated inflammation in metabolic disease. Nat. Rev. Immunol. 11, 738–749. doi: 10.1038/nri3071
Chen S. L., Hung C. S., Pinkner J. S., Walker J. N., Cusumano C. K., Li Z., et al. (2009). Positive selection identifies an in vivo role for FimH during urinary tract infection in addition to mannose binding. Proc. Natl. Acad. Sci. U.S.A. 106, 22439–22444. doi: 10.1073/pnas.0902179106
Chen H., Shen F., Sherban A., Nocon A., Li Y., Wang H., et al. (2018). DEP domain-containing mTOR-interacting protein suppresses lipogenesis and ameliorates hepatic steatosis and acute-on-chronic liver injury in alcoholic liver disease. Hepatology 68, 496–514. doi: 10.1002/hep.29849
Chiu C. C., Ching Y. H., Li Y. P., Liu J. Y., Huang Y. T., Huang Y. W., et al. (2017). Nonalcoholic Fatty Liver Disease Is Exacerbated in High-Fat Diet-Fed Gnotobiotic Mice by Colonization with the Gut Microbiota from Patients with Nonalcoholic Steatohepatitis. Nutrients 9 (11), 1220. doi: 10.3390/nu9111220
Chu H., Duan Y., Yang L., Schnabl B. (2019). Small metabolites, possible big changes: a microbiota-centered view of non-alcoholic fatty liver disease. Gut 68, 359–370. doi: 10.1136/gutjnl-2018-316307
Csak T., Velayudham A., Hritz I., Petrasek J., Levin I., Lippai D., et al. (2011). Deficiency in myeloid differentiation factor-2 and toll-like receptor 4 expression attenuates nonalcoholic steatohepatitis and fibrosis in mice. Am. J. Physiol. Gastrointest. Liver Physiol. 300, G433–G441. doi: 10.1152/ajpgi.00163.2009
Del Chierico F., Nobili V., Vernocchi P., Russo A., De Stefanis C., Gnani D., et al. (2017). Gut microbiota profiling of pediatric nonalcoholic fatty liver disease and obese patients unveiled by an integrated meta-omics-based approach. Hepatology 65, 451–464. doi: 10.1002/hep.28572
Duvel K., Yecies J. L., Menon S., Raman P., Lipovsky A. I., Souza A. L., et al. (2010). Activation of a metabolic gene regulatory network downstream of mTOR complex 1. Mol. Cell 39, 171–183. doi: 10.1016/j.molcel.2010.06.022
Edgar R. C., Haas B. J., Clemente J. C., Quince C., Knight R. (2011). UCHIME improves sensitivity and speed of chimera detection. Bioinformatics 27, 2194–2200. doi: 10.1093/bioinformatics/btr381
Ellermann M., Gharaibeh R. Z., Fulbright L., Dogan B., Moore L. N., Broberg C. A., et al. (2019). Yersiniabactin-Producing Adherent/Invasive Escherichia coli Promotes Inflammation-Associated Fibrosis in Gnotobiotic Il10(-/-). Mice Infect. Immun. 87 (11), e00587–19. doi: 10.1128/IAI.00587-19
Fei N., Zhao L. (2013). An opportunistic pathogen isolated from the gut of an obese human causes obesity in germfree mice. ISME J. 7, 880–884. doi: 10.1038/ismej.2012.153
Fouts D. E., Torralba M., Nelson K. E., Brenner D. A., Schnabl B. (2012). Bacterial translocation and changes in the intestinal microbiome in mouse models of liver disease. J. Hepatol. 56, 1283–1292. doi: 10.1016/j.jhep.2012.01.019
Gadd V. L., Skoien R., Powell E. E., Fagan K. J., Winterford C., Horsfall L., et al. (2014). The portal inflammatory infiltrate and ductular reaction in human nonalcoholic fatty liver disease. Hepatology 59, 1393–1405. doi: 10.1002/hep.26937
Gardner S. N., Slezak T., Hall B. G. (2015). kSNP3.0: SNP detection and phylogenetic analysis of genomes without genome alignment or reference genome. Bioinformatics 31, 2877–2878. doi: 10.1093/bioinformatics/btv271
Himes R. W., Smith C. W. (2010). Tlr2 is critical for diet-induced metabolic syndrome in a murine model. FASEB J. 24, 731–739. doi: 10.1096/fj.09-141929
Itoh M., Kato H., Suganami T., Konuma K., Marumoto Y., Terai S., et al. (2013). Hepatic crown-like structure: a unique histological feature in non-alcoholic steatohepatitis in mice and humans. PLoS One 8, e82163. doi: 10.1371/journal.pone.0082163
Jenne C. N., Kubes P. (2013). Immune surveillance by the liver. Nat. Immunol. 14, 996–1006. doi: 10.1038/ni.2691
Jiang W., Wu N., Wang X., Chi Y., Zhang Y., Qiu X., et al. (2015). Dysbiosis gut microbiota associated with inflammation and impaired mucosal immune function in intestine of humans with non-alcoholic fatty liver disease. Sci. Rep. 5, 8096. doi: 10.1038/srep08096
Jiao N., Baker S. S., Chapa-Rodriguez A., Liu W., Nugent C. A., Tsompana M., et al. (2018). Suppressed hepatic bile acid signalling despite elevated production of primary and secondary bile acids in NAFLD. Gut 67, 1881–1891. doi: 10.1136/gutjnl-2017-314307
Jun X., Ning C., Yang S., Zhe W., Na W., Yifan Z., et al. (2019). Alteration of Fungal Microbiota After 5-ASA Treatment in UC Patients. Inflammation Bowel Dis. 26, 380–390. doi:10.1093/ibd/izz207
Kanehisa M., Goto S., Sato Y., Kawashima M., Furumichi M., Tanabe M. (2014). Data, information, knowledge and principle: back to metabolism in KEGG. Nucleic Acids Res. 42, D199–D205. doi: 10.1093/nar/gkt1076
Kaper J. B., Nataro J. P., Mobley H. L. (2004). Pathogenic Escherichia coli. Nat. Rev. Microbiol. 2, 123–140. doi: 10.1038/nrmicro818
Kapil S., Duseja A., Sharma B. K., Singla B., Chakraborti A., Das A., et al. (2016). Small intestinal bacterial overgrowth and toll-like receptor signaling in patients with non-alcoholic fatty liver disease. J. Gastroenterol. Hepatol. 31, 213–221. doi: 10.1111/jgh.13058
Kawano Y., Cohen D. E. (2013). Mechanisms of hepatic triglyceride accumulation in non-alcoholic fatty liver disease. J. Gastroenterol. 48, 434–441. doi: 10.1007/s00535-013-0758-5
Kim H. N., Joo E. J., Cheong H. S., Kim Y., Kim H. L., Shin H., et al. (2019). Gut Microbiota and Risk of Persistent Nonalcoholic Fatty Liver Diseases. J. Clin. Med. 8, 1089. doi: 10.3390/jcm8081089
Kolodziejczyk A. A., Zheng D., Shibolet O., Elinav E. (2019). The role of the microbiome in NAFLD and NASH. EMBO Mol. Med. 11 (2), e9302. doi: 10.15252/emmm.201809302
Kostic A. D., Chun E., Robertson L., Glickman J. N., Gallini C. A., Michaud M., et al. (2013). Fusobacterium nucleatum potentiates intestinal tumorigenesis and modulates the tumor-immune microenvironment. Cell Host Microbe 14, 207–215. doi: 10.1016/j.chom.2013.07.007
Le Roy T., Llopis M., Lepage P., Bruneau A., Rabot S., Bevilacqua C., et al. (2013). Intestinal microbiota determines development of non-alcoholic fatty liver disease in mice. Gut 62, 1787–1794. doi: 10.1136/gutjnl-2012-303816
Ley R. E., Turnbaugh P. J., Klein S., Gordon J. I. (2006). Microbial ecology: human gut microbes associated with obesity. Nature 444, 1022–1023. doi: 10.1038/4441022a
Li F., Hao X., Chen Y., Bai L., Gao X., Lian Z., et al. (2017). The microbiota maintain homeostasis of liver-resident gammadeltaT-17 cells in a lipid antigen/CD1d-dependent manner. Nat. Commun. 7, 13839. doi: 10.1038/ncomms13839
Liao L., Schneider K. M., Galvez E. J. C., Frissen M., Marschall H. U., Su H., et al. (2019). Intestinal dysbiosis augments liver disease progression via NLRP3 in a murine model of primary sclerosing cholangitis. Gut 68, 1477–1492. doi: 10.1136/gutjnl-2018-316670
Liu R., Li X., Huang Z., Zhao D., Ganesh B. S., Lai G., et al. (2018). C/EBP homologous protein-induced loss of intestinal epithelial stemness contributes to bile duct ligation-induced cholestatic liver injury in mice. Hepatology 67, 1441–1457. doi: 10.1002/hep.29540
Lotowska J. M., Sobaniec-Lotowska M. E., Lebensztejn D. M. (2013). The role of Kupffer cells in the morphogenesis of nonalcoholic steatohepatitis - ultrastructural findings. First Rep. Pediatr. Patients Scand. J. Gastroenterol. 48, 352–357. doi: 10.3109/00365521.2012.746390
Lowe T. M., Eddy S. R. (1997). tRNAscan-SE: a program for improved detection of transfer RNA genes in genomic sequence. Nucleic Acids Res. 25, 955–964. doi: 10.1093/nar/25.5.955
Magoc T., Salzberg S. L. (2011). FLASH: fast length adjustment of short reads to improve genome assemblies. Bioinformatics 27, 2957–2963. doi: 10.1093/bioinformatics/btr507
Manfredo Vieira S., Hiltensperger M., Kumar V., Zegarra-Ruiz D., Dehner C., Khan N., et al. (2018). Translocation of a gut pathobiont drives autoimmunity in mice and humans. Science 359, 1156–1161. doi: 10.1126/science.aar7201
Miura K., Yang L., van Rooijen N., Brenner D. A., Ohnishi H., Seki E. (2013). Toll-like receptor 2 and palmitic acid cooperatively contribute to the development of nonalcoholic steatohepatitis through inflammasome activation in mice. Hepatology 57, 577–589. doi: 10.1002/hep.26081
Mouries J., Brescia P., Silvestri A., Spadoni I., Sorribas M., Wiest R., et al. (2019). Microbiota-driven gut vascular barrier disruption is a prerequisite for non-alcoholic steatohepatitis development. J. Hepatol. (6), 1216–1228. doi: 10.1016/j.jhep.2019.08.005
Mouzaki M., Comelli E. M., Arendt B. M., Bonengel J., Fung S. K., Fischer S. E., et al. (2013). Intestinal microbiota in patients with nonalcoholic fatty liver disease. Hepatology 58, 120–127. doi: 10.1002/hep.26319
Mridha A. R., Haczeyni F., Yeh M. M., Haigh W. G., Ioannou G. N., Barn V., et al. (2017). TLR9 is up-regulated in human and murine NASH: pivotal role in inflammatory recruitment and cell survival. Clin. Sci. (Lond) 131, 2145–2159. doi: 10.1042/CS20160838
Peterson L. W., Artis D. (2014). Intestinal epithelial cells: regulators of barrier function and immune homeostasis. Nat. Rev. Immunol. 14, 141–153. doi: 10.1038/nri3608
Roh Y. S., Seki E. (2013). Toll-like receptors in alcoholic liver disease, non-alcoholic steatohepatitis and carcinogenesis. J. Gastroenterol. Hepatol. 28 Suppl 1, 38–42. doi: 10.1111/jgh.12019
Safari Z., Gerard P. (2019). The links between the gut microbiome and non-alcoholic fatty liver disease (NAFLD). Cell Mol. Life Sci. 76, 1541–1558. doi: 10.1007/s00018-019-03011-w
Schnabl B., Brenner D. A. (2014). Interactions between the intestinal microbiome and liver diseases. Gastroenterology 146, 1513–1524. doi: 10.1053/j.gastro.2014.01.020
Schneider K. M., Mohs A., Kilic K., Candels L. S., Elfers C., Bennek E., et al. (2019). Intestinal Microbiota Protects against MCD Diet-Induced Steatohepatitis. Int. J. Mol. Sci. 20 (2), 308. doi: 10.3390/ijms20020308
Schwimmer J. B., Johnson J. S., Angeles J. E., Behling C., Belt P. H., Borecki I., et al. (2019). Microbiome Signatures Associated With Steatohepatitis and Moderate to Severe Fibrosis in Children With Nonalcoholic Fatty Liver Disease. Gastroenterology 157, 1109–1122. doi: 10.1053/j.gastro.2019.06.028
Sica A., Invernizzi P., Mantovani A. (2014). Macrophage plasticity and polarization in liver homeostasis and pathology. Hepatology 59, 2034–2042. doi: 10.1002/hep.26754
Sorribas M., Jakob M. O., Yilmaz B., Li H., Stutz D., Noser Y., et al. (2019). FXR-modulates the gut-vascular barrier by regulating the entry sites for bacterial translocation in experimental cirrhosis. J. Hepatol. (6), 1126–1140. doi: 10.1016/j.jhep.2019.06.017
Spruss A., Kanuri G., Wagnerberger S., Haub S., Bischoff S. C., Bergheim I. (2009). Toll-like receptor 4 is involved in the development of fructose-induced hepatic steatosis in mice. Hepatology 50, 1094–1104. doi: 10.1002/hep.23122
Tsoi H., Chu E. S. H., Zhang X., Sheng J., Nakatsu G., Ng S. C., et al. (2017). Peptostreptococcus anaerobius Induces Intracellular Cholesterol Biosynthesis in Colon Cells to Induce Proliferation and Causes Dysplasia in Mice. Gastroenterology 152, 1419–1433.e5. doi: 10.1053/j.gastro.2017.01.009
Vandanmagsar B., Youm Y. H., Ravussin A., Galgani J. E., Stadler K., Mynatt R. L., et al. (2011). The NLRP3 inflammasome instigates obesity-induced inflammation and insulin resistance. Nat. Med. 17, 179–188. doi: 10.1038/nm.2279
Wang R., Li H., Yang X., Xue X., Deng L., Shen J., et al. (2018). Genetically Obese Human Gut Microbiota Induces Liver Steatosis in Germ-Free Mice Fed on Normal Diet. Front. Microbiol. 9, 1602. doi: 10.3389/fmicb.2018.01602
Wiest R., Albillos A., Trauner M., Bajaj J. S., Jalan R. (2017). Targeting the gut-liver axis in liver disease. J. Hepatol. 67, 1084–1103. doi: 10.1016/j.jhep.2017.05.007
Wu Z., Tan J., Chi Y., Zhang F., Xu J., Song Y., et al. (2018). Mesenteric adipose tissue contributes to intestinal barrier integrity and protects against nonalcoholic fatty liver disease in mice. Am. J. Physiol. Gastrointest. Liver Physiol. 315, G659–G670. doi: 10.1152/ajpgi.00079.2018
Xu J., Chen N., Wu Z., Song Y., Zhang Y., Wu N., et al. (2018). 5-Aminosalicylic Acid Alters the Gut Bacterial Microbiota in Patients With Ulcerative Colitis. Front. Microbiol. 9, 1274. doi: 10.3389/fmicb.2018.01274
Yan H., Fei N., Wu G., Zhang C., Zhao L., Zhang M. (2016). Regulated Inflammation and Lipid Metabolism in Colon mRNA Expressions of Obese Germfree Mice Responding to Enterobacter cloacae B29 Combined with the High Fat Diet. Front. Microbiol. 7, 1786. doi: 10.3389/fmicb.2016.01786
Yu T., Guo F., Yu Y., Sun T., Ma D., Han J., et al. (2017). Fusobacterium nucleatum Promotes Chemoresistance to Colorectal Cancer by Modulating Autophagy. Cell 170, 548–563.e16. doi: 10.1016/j.cell.2017.07.008
Yuan J., Chen C., Cui J., Lu J., Yan C., Wei X., et al. (2019). Fatty Liver Disease Caused by High-Alcohol-Producing Klebsiella pneumoniae. Cell Metab. 30, 675–688.e7. doi: 10.1016/j.cmet.2019.08.018
Zargar A., Quan D. N., Carter K. K., Guo M., Sintim H. O., Payne G. F., et al. (2015). Bacterial secretions of nonpathogenic Escherichia coli elicit inflammatory pathways: a closer investigation of interkingdom signaling. mBio 6, e00025. doi: 10.1128/mBio.00025-15
Keywords: bacteria strain, non-alcoholic steatohepatitis, triglyceride accumulation, macrophage, hepatic inflammation
Citation: Zhang Y, Jiang W, Xu J, Wu N, Wang Y, Lin T, Liu Y and Liu Y (2020) E. coli NF73-1 Isolated From NASH Patients Aggravates NAFLD in Mice by Translocating Into the Liver and Stimulating M1 Polarization. Front. Cell. Infect. Microbiol. 10:535940. doi: 10.3389/fcimb.2020.535940
Received: 18 February 2020; Accepted: 09 October 2020;
Published: 11 December 2020.
Edited by:
Esaki M. Shankar, Central University of Tamil Nadu, IndiaReviewed by:
Ricardo Oropeza, National Autonomous University of Mexico, MexicoSridhar Muthusami, Karpagam Academy of Higher Education, India
Copyright © 2020 Zhang, Jiang, Xu, Wu, Wang, Lin, Liu and Liu. This is an open-access article distributed under the terms of the Creative Commons Attribution License (CC BY). The use, distribution or reproduction in other forums is permitted, provided the original author(s) and the copyright owner(s) are credited and that the original publication in this journal is cited, in accordance with accepted academic practice. No use, distribution or reproduction is permitted which does not comply with these terms.
*Correspondence: Yulan Liu, bGl1eXVsYW5AcGt1cGguZWR1LmNu
†These authors have contributed equally to this work