- 1International Joint Research Center for Photo-responsive Molecules and Materials, School of Chemical and Material Engineering, Jiangnan University, Wuxi, China
- 2International Joint Research Laboratory for Biointerface and Biodetection, State Key Laboratory of Food Science and Technology, Jiangnan University, Wuxi, China
Developing highly sensitive and selective detection methods is crucial for environmental and healthcare monitoring. In this study, the chiral and fluorescent signals of L-glutathione-modified gold nanoclusters (L-GSH-Au NCs) were discovered to be responsive to Co2+, which displayed linear correlations with the concentration changes of Co2+. Notably, the chiral signal was more sensitive than the FL signal, whose limit of detection (LOD) was calculated to be 0.37 μM and 3.93 times lower than the LOD obtained with fluorescent signals. Moreover, the chiral signals exhibited unexpectedly high selectivity towards Co2+, effectively avoiding interference from other metal ions and biomolecules. Furthermore, the concentrations of Co2+ in various samples, such as Taihu water, tap water, bottled water, and animal serum, were accurately quantified using the chiral signals of L-GSH-Au NCs without complex pretreatment, with recoveries ranging between 95.64% and 103.22%. This study not only provides an innovative approach for Co2+ detection but also highlights the detection capabilities of chiral signals in complex environments.
1 Introduction
Cobalt ion (Co2+) is mainly present in the human body to form cobalamin (vitamin B12), playing a vital role in various catalytic reactions and myelin synthesis (Tvermoes et al., 2013; Kim et al., 2017). However, excessive intake can affect the nervous system and lead to heart failure and other diseases, such as pulmonary hypoplasia and thyroid damage (Lindsay and Kerr, 2011; Hussain et al., 2018; Saqib et al., 2018). Humans mainly take in Co2+ through food, water, and breathing. Therefore, it is essential to develop highly efficient and sensitive strategies to monitor the concentration of Co2+ in different propagation mediums, considering the health risks associated with Co2+.
Detecting metal ions typically involves traditional methods such as inductively coupled plasma mass spectrometry (ICP-MS) or atomic absorption spectrometry (AAS) (Hanhauser et al., 2020; Hou et al., 2020; Kong et al., 2020; Lin et al., 2020; Hong et al., 2021). However, these methods require extensive technical knowledge and time-consuming sample preparation. Despite being highly sensitive and accurate, they still need high requirements and tedious pretreatment (Shirani et al., 2019; Ma et al., 2020). To address these limitations, new detection methods have been developed using fluorescent spectrometry, electro-chemiluminescence, and colorimetry, which offer high convenience and rapid response (Xiao et al., 2016; Wu et al., 2023). However, with limited methods available, Co2+ detection with high sensitivity and selectivity still poses a challenge.
Chiral nanomaterials possess distinctive asymmetrical configurations, and their components can be manipulated, which allows for controlling chiral optical activities in the visible or near-infrared regions. This characteristic provides excellent anti-interference and high sensitivity towards configurational changes, making it possible to detect biological molecules such as disease markers, drugs, and metal ions with high sensitivity. For example, gold mimetic nanoparticles (L/D-P+ NPs) synthesized by Liguang Xu et al. possess excellent immunomodulatory capabilities and can be used to regulate the maturation of immune cells, in which the L-P+ NPs showed a higher (800-fold) efficiency as adjuvants for H9N2 influenza virus vaccination than commercial aluminum adjuvants (Xu et al., 2022). However, based on these advantages, using chiral nanomaterials for metal ion detection still needs to be explored.
Metal nanoclusters (NCs) are ultramicroscopic particles with specific optical properties, such as chirality and fluorescence (Zhang et al., 2020; Zhao and Li, 2020; Zhang et al., 2021; Sagadevan et al., 2022; Li et al., 2023). They have been used to construct metal ion-responsive luminescent probes based on aggregation-induced emission (AIE) characteristics, which displayed high sensitivity and signal-to-noise ratio. For example, Deyan Qi et al. synthesized CuAuNCs-Ce assemblies by exploiting the aggregation-induced properties between Ce3+ and glutathione-capped bimetallic copper and gold nanoclusters (CuAuNCs@GSH). The introduction of Ce3+ dramatically enhanced the fluorescence properties and quantum yield of the probe, which was applied to the highly sensitive detection of ATP with a detection limit of 53 nM (Qi et al., 2022). However, the chirality response of chiral metal NCs toward metal ions has yet to attract much attention. In this study, an innovative approach for Co2+ detection has been established based on the chiral responsiveness of L-GSH-Au NCs toward Co2+ (Scheme 1).
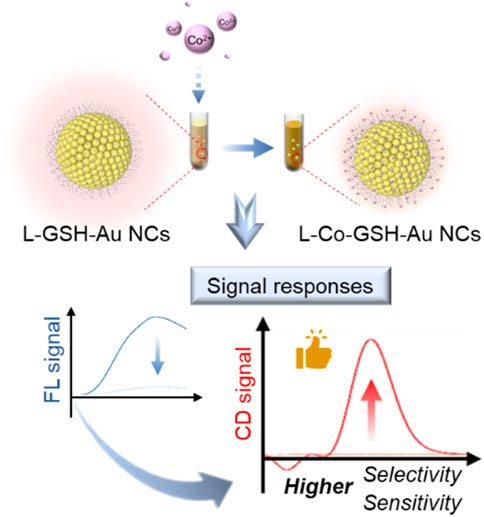
Scheme 1. Scheme of Co2+ detection based on the chiral and fluorescent signals of L-GSH stabilized Au NCs.
2 Experimental section
2.1 Regents and instruments
Gold chloride trihydrate (HAuCl4·H2O, 99%) was purchased from Sigma-Aldrich (Shanghai, China). Cobalt chloride (CoCl2, 99%) and glutathione (GSH, 99.9%) were purchased from Aladdin (Shanghai, China). The water used in the experiments was purified by the Milli-Q Biocel System, with a resistivity of 18.2 MΩ• cm. All chemicals were used as received without further purification.
Transmission electron microscopy (TEM) images were captured using a JEOL JEM-2100F transmission electron microscope (Hitachi, Tokyo, Japan) at an acceleration voltage of 200 kV. The circular dichroism (CD) signals were analyzed with a Chirascan plus CD spectrometer from Applied Photophysics (Surrey, United Kingdom) with an optical path length of 1 cm. Fluorescence spectra were obtained with a Hitachi F-7000 fluorescence spectrometer at room temperature. X-ray photoelectron spectroscopy (XPS) was performed using Axis Supra (Kratos, United Kingdom). Size distributions were determined with a Zetasizer (Malvern Instruments Ltd., Malvern, United Kingdom). The Shimadzu UV-vis 3101 spectroscope was used to obtain all ultraviolet light (UV)-visible absorption spectra. The Thermo-Nicolet Nexus 470FTIR spectrometer was used to perform Transform Infrared Spectrometer (FTIR) measurements. Fluorescence spectra were obtained with a Hitachi F-7000 fluorescence spectrometer at room temperature.
2.2 Preparation of L-GSH stabilized Au NCs (L-GSH-Au NCs)
L-GSH-Au NCs were synthesized using a thermal reduction method, as described in previous reports (Liu et al., 2016). To briefly summarize the process, 1.50 mL of 20 mM HAuCl4 was mixed with 8.56 mL 1.76 mg/mL L-GSH solution under stirring vigorously. The mixture was then heated in an oil bath at 95°C for 30 min to synthesize L-GSH-Au NCs. The mixed solution gradually changed from clear to light-yellow during the reaction. Once the reaction was complete, the synthesized L-GSH-Au NCs were purified through centrifugation at 11,000 rpm to remove any excess aggregates. Anhydrous ethanol was added to further purify the supernatant, which was then centrifuged at 3,500 rpm for 5 min. The remaining solution was resuspended in water, and the resulting L-GSH-Au NCs were stored at 4°C for later use.
2.3 Detection of Co2+
A gradient concentration of Co2+ solution (5 μL, range from 1 mM to 100 mM) was added into 500 μL as-synthesized L-GSH-Au NCs. The mixture was incubated at room temperature for 10 min. Afterward, the mixture’s CD, fluorescence, and UV absorbance signal were detected to determine the linear relationship between the concentration of Co2+, CD, fluorescence, and absorbance signals (Fluorescence excitation wavelength: 405 nm). Subsequently, the Co2+ concentration in each sample was evaluated based on the standard concentration curve.
2.4 Calculation and analysis of LOD
The LOD was calculated via sensitivity analysis. The calibration curve was presented as:
where a and b are variables obtained through least-squares linear regression of the signal–concentration curve, variable Y represents the C/fluorescence intensity of Au NCs at a Co2+ concentration of C (μM), and X is equal to log C.
The LOD was calculated as follows:
When b > 0,
where SD is the standard deviation and Cblank is the CD intensity or fluorescence intensity of the blank sample (without Co2+) and SD is the standard deviation.
When b < 0,
SD was calculated based on the formula:
Nr: total number of samples;Xi: the CD intensity or fluorescence intensity of each sample;Xavg: average value for the CD intensity or fluorescence intensity obtained for a specific series of identical samples repeated Nr times.
2.5 Analysis for real samples
Three water samples were collected to demonstrate the detection method’s applicability in environmental samples, which included lake water from Taihu Lake in Wuxi, China, bottled water from Wahaha® purified water, and tap water from Jiangnan University, also in Wuxi, China. To remove impurities or insoluble substances, all water samples were pretreated with a 0.22 μm membrane filter (BRAND®) and then centrifuged at 9,000 rpm for 5 min to collect the supernatant solution. After that, Co2+ was spiked to the pretreated water samples and then detected with L-GSH-Au NCs (the final concentration of Co2+ was 10 μM).
The anticoagulant-treated mouse blood sample was centrifuged at 3,500 rpm for 5 min to separate the serum. Afterward, 1 mL of serum was diluted to 9 mL with ultrapure water and then treated with 1 mL HNO3 for 2 h. The pretreated serum sample was centrifuged at 4,000 rpm for 2 min to obtain the supernatant. Finally, Co2+ was spiked to the pretreated serum samples (the final concentrations of Co2+ are 10, 30, and 50 μM, respectively) and then detected with L-GSH-Au NCs. Animal experiments were carried out in accordance with the ethical guidelines of the Animal Welfare Committee of Jiangnan University. The experimental animal license used was SYXK (Su) 2016-0045. Animal Welfare and Ethical Review Number is JN. No20240630b1201231 [328].
3 Results and discussion
Based on TEM images, the size of L-GSH-stabilized Au NCs (L-GSH-Au NCs) was determined to be 1.4 ± 0.3 nm (Figure 1A); the size of Co2+ treated L-GSH-stabilized Au NCs (L-Co-GSH-Au NCs) was analyzed to be 1.4 ± 0.2 nm (Figure 1B). After adding Co2+ with a final concentration of 500 μM, no noticeable morphological changes were observed in L-GSH-Au NCs. However, the CD and fluorescent (FL) optical activities of L-GSH-Au NCs changed obviously. In detail, the CD signal of L-GSH-Au NCs was initially distributed before 410 nm and shifted to the visible light region, with two new CD peaks appearing at 475 and 645 nm due to the addition of Co2+ (Figure 1C), accompanied by apparent changes in absorption (Supplementary Figure S1). The asymmetrical factor (g-factor) of L-GSH-Au NCs enhanced 40.22-fold after adding Co2+ (Supplementary Figure S2). Additionally, the FL emission peak of L-GSH-Au NCs displayed at 720 nm decreased significantly when Co2+ was added to the colloid solution of L-GSH-Au NCs (Figure 1D).
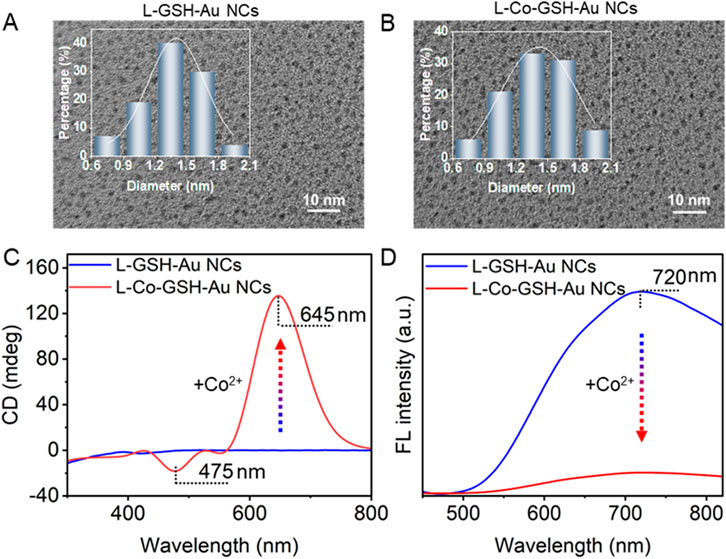
Figure 1. Transmission electron microscopy (TEM) images of (A) L-GSH-Au NCs and (B) L-Co-GSH-Au NCs (the insets show the size distribution histogram of L-GSH-Au NCs and L-Co-GSH-Au NCs). (C) Circular dichroism (CD) spectra and (D) fluorescence (FL) spectra of L-GSH-Au NCs and L-Co-GSH-Au NCs (Excitation wavelength: 405 nm). The final concentration of Co2+ is 500 μM for preparing the sample of L-Co-GSH-Au NCs.
The mechanism of the CD and FL signal changes of L-GSH-Au NCs induced by adding Co2+ was further investigated. First, no obvious morphological and size changes were observed after the addition of Co2+, thus the aggregation of L-GSH-Au NCs can be excluded (Figures 1A, B). Therefore, it is likely that a new coordination state was formed between Co2+ and individual L-GSH-Au NC. This deduction could be demonstrated by the decreasing surface charge when Co2+ was added to the colloid solution of L-GSH-Au NCs (Supplementary Figure S3). The measurement results of X-ray photoelectron spectroscopy (XPS) further illustrated the suspicion. They suggested the presence of Co elements in the sample of L-Co-GSH-Au NCs (Supplementary Figures S4, S5; Supplementary Table S1), which meant that Co2+ indeed interacted with L-GSH-Au NCs. The high-resolution XPS spectra of Co 2p that were distributed in the sample of L-Co-GSH-Au NCs displayed two binding energies at 780.5 and 796.9 eV, indicating that the Co ions were presented with +2 valence (Figure 2A). The binding energy of N and O also changed significantly due to the addition of Co2+, suggesting the probable coordination between L-GSH-Au NCs and Co2+ via the surface carboxyl and amino groups (Figures 2B, C). The Fourier transform infrared spectroscopy (FTIR) spectra of L-GSH-Au NCs and L-Co-GSH-Au NCs were also measured (Figure 2D). The FTIR peaks at 1,230 and 1734 cm-1 corresponded to C=O, and the FTIR at 1,533 and 3,081 cm−1 corresponded to -NH. These FTIR peaks decreased obviously due to the addition of Co2+, which proved that Co2+ indeed coordinated with the -NH and -COOH functional groups (Shi et al., 2022; Ding et al., 2024). The -NH and -COOH functional groups originated from the GSH molecules modified on the surface of L-GSH-Au NCs via Au-S covalent bonding. According to previous studies, Co2+ should coordinate with two GSH molecules on the surface of Au NCs in the specific mode of CoN2O2, which attributed to the signal change of chirality (Ding et al., 2024).
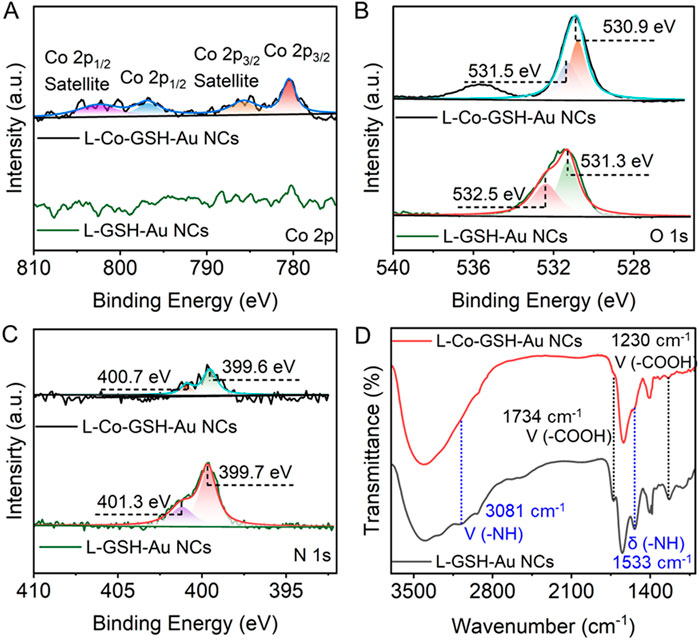
Figure 2. High-resolution X-ray photoelectron spectroscopy (XPS) spectra of (A) Co 2p, (B) O 1s, and (C) N 1s in L-GSH-Au NCs and L-Co-GSH-Au NCs. (D) The Fourier transform infrared spectroscopy of L-GSH-Au NCs (black), and L-Co-GSH-Au NCs (red).
After that, the response-ability of the CD and FL signals of L-GSH-Au NCs was investigated by adding different concentrations of Co2+. The results showed that the CD intensity at 475 nm and 645 nm enhanced significantly as the concentration of Co2+ increased from 0 to 500 μM (Figure 3A), accompanied by the absorption increase and FL intensity decrease (Figure 3B; Supplementary Figure S6A). When the concentration of Co2+ was increased from 500 to 1,000 μM, the CD signal at 645 nm reached a plateau (Figure 3C). However, the absorption at 368 nm continued to increase (Supplementary Figure S6B). Additionally, the FL intensity at 720 nm slightly decreased, as depicted in Figure 3D. The negligible CD signal changes indicated that Co2+ occupied all the covalent binding sites on the surface of L-GSH-Au NCs. The absorption and FL signal changes with the concentration of Co2+ ranging from 500 to 1,000 μM were attributed to the aggregation of L-Co-GSH-Au NCs induced by the excess amount of Co2+ (Supplementary Figures S7, S8).
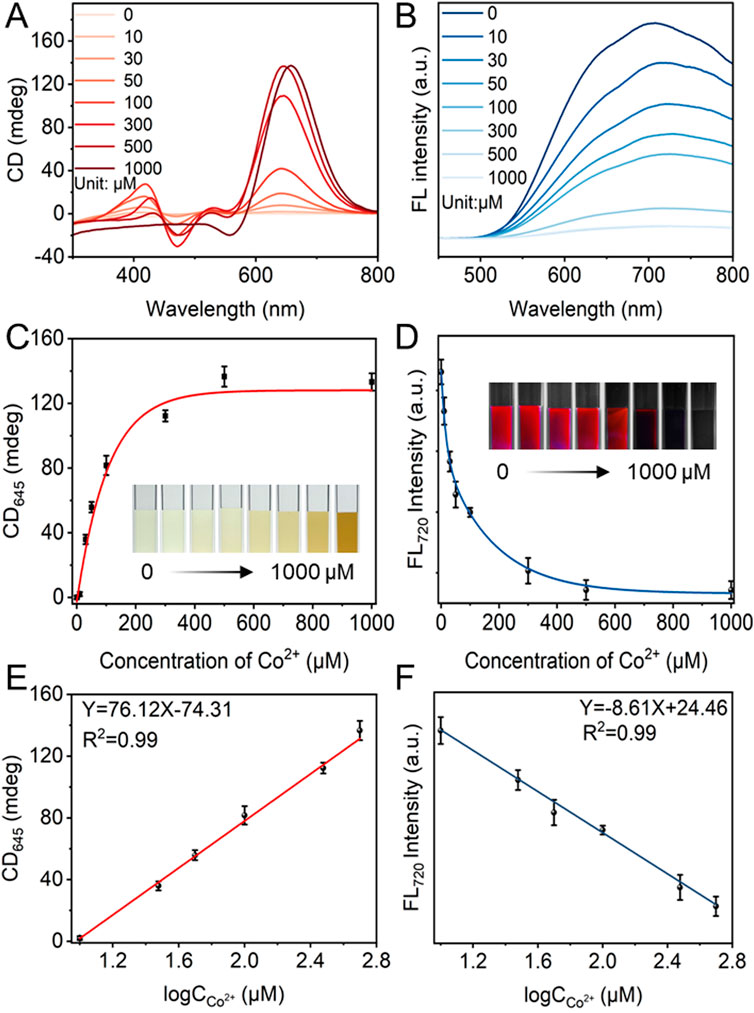
Figure 3. (A) Circular dichroism (CD) and (B) fluorescence (FL) of L-Co-GSH-Au NCs with the concentration of Co2+ changing from 0 to 1,000 μM (Excitation wavelength: 405 nm). (C) The CD intensity of L-Co-GSH-Au NCs at 645 nm and (D) the FL intensity of L-Co-GSH-Au NCs at 720 nm with Co2+ concentration ranging from 0 to 1,000 μM. The inset images in (C, D) are captured under daylight and UV light irradiation, respectively. Data are presented as mean ± standard deviation (n = 3). The linear relationships between (E) the CD intensity at 645 nm and the logarithm of Co2+ concentrations (logCco2+), and (F) the FL intensity at 720 nm and the logarithm of Co2+ concentrations. Data are presented as mean ± standard deviation (s.d.) (n = 3).
In order to test the detection sensitivity of the CD and FL signals, the linear relationships between the CD intensities and Co2+ concentrations, as well as the FL intensities and Co2+ concentrations were examined. It could be observed that the CD intensity at 645 nm and FL intensity at 720 nm showed good linear relationships with the logarithm of Co2+ concentrations ranging from 10–500 μM, respectively (Figures 3E, F). Meanwhile, the absorption intensity at 368 nm did not display any linear relationship with the concentration changes of Co2+ (Supplementary Figure S6C), which was attributed to the disturbance of the natural color of Co2+. The limits of detection (LOD) were calculated to be 0.37 μM and 1.45 μM based on the CD and FL signals. The results indicated that the CD signal was more sensitive than the FL signal under the same detection conditions. The higher detection sensitivity of CD signals should derive from their higher sensitivity toward the chiral configurational changes compared with that of FL signals.
In addition to the detection sensitivity, the selectivity of the CD and FL signals was also studied. According to Figure 4 and Supplementary Figure S9, the FL intensity of L-GSH-Au NCs is enhanced in the presence of Ti4+, Cu2+ or Pb2+. On the other hand, GSH, BSA, Cr3+, Ca2+, Na+ and Cd2+ showed negligible effects on the FL intensity of L-GSH-Au NCs, while other metal ions resulted in decreases in FL intensity. However, among these metal ions and biological molecules, only Co2+ enhanced the CD signals of L-GSH-Au NCs (Figure 4; Supplementary Figure S10). These results illustrated that the CD signals of L-GSH-Au NCs exhibited high selectivity towards Co2+ while the FL signal did not. The high selectivity of L-GSH-Au NCs’ CD signal should originate from the specific coordination of CoN2O2 between Co2+ and L-GSH-Au NCs, which made the Co2+ differs from other metal ions.
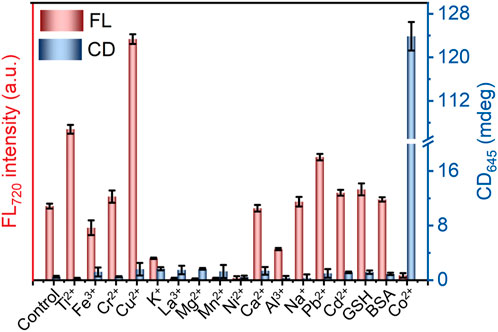
Figure 4. CD intensity at 645 nm and FL intensity at 720 nm of metal ions and biological interferences (500 μM) treated L-GSH-Au NCs, data are presented as mean ± s.d. (n = 3).
Thanks to the high sensitivity and excellent selectivity of L-GSH-Au NCs’ chiral response, the Co2+ concentrations in various real samples, including Taihu water, animal serum, and tap water, were measured based on the CD signal of L-GSH-Au NCs. To investigate the detection ability of L-GSH-Au NCs’ chiral signal, the water samples were spiked with Co2+ to achieve a final concentration of 10.00 µM. As indicated in Table 1, the spiked recoveries of water samples ranged from 95.63% to 104.68%, with the relative standard deviations (RSDs) of 1.27%∼1.74% (n = 3). Moreover, the Co2+ concentration in the serum samples that were diluted 100-fold was spiked to be 10, 30, and 50 µM. The recoveries were detected to be ranging from 92.63% to 105.46%, with RSDs of 1.27%∼2.57%. Besides, the concentration of Co2⁺ in the real samples with spiked Co2+ was measured via ICP-MS. The Co2⁺ detection results from ICP-MS were consistent with those obtained from the CD assay, confirming that L-GSH-Au NCs can accurately detect Co2⁺ in real samples. Above all, L-GSH-Au NCs were proved to be a reliable and practical tool for detecting Co2+ in various samples.
4 Conclusion
In conclusion, this study systematically investigated how L-GSH-Au NCs’ CD and FL signals respond when interacting with various metal ions and biological molecules. This research revealed that the CD signal of L-GSH-Au NCs not only displayed high sensitivity but also showed selectivity toward Co2+ compared to the FL signals. This unexceptional finding led to the successful development of a convenient method for detecting Co2+ without the need for complex pretreatment. Based on the chiral responsiveness of L-GSH-Au NCs, the detection method could accurately quantify the Co2+ concentrations in water and serum samples. This study demonstrated the detection potential of nanomaterials’ CD signals and introduced a new approach to developing highly sensitive and selective detection probes suitable for complex detection scenarios.
Data availability statement
The original contributions presented in the study are included in the article/Supplementary Material, further inquiries can be directed to the corresponding authors.
Ethics statement
The animal study was approved by Animal Welfare Committee of Jiangnan University. The study was conducted in accordance with the local legislation and institutional requirements.
Author contributions
QD: Data curation, Formal Analysis, Investigation, Writing–original draft. FW: Formal Analysis, Writing–review and editing. WY: Investigation, Methodology, Writing–review and editing. XX: Visualization, Writing–review and editing. HL: Investigation, Supervision, Writing–review and editing. LX: Supervision, Writing–review and editing. SL: Resources, Supervision, Writing–review and editing.
Funding
The author(s) declare that financial support was received for the research, authorship, and/or publication of this article. This work was supported by the National Natural Science Foundation of China (32101142), the National Natural Science Foundation of Jiangsu Province (BK20221532), and the Fundamental Research Funds for the Central Universities (JUSRP622037).
Conflict of interest
The authors declare that the research was conducted in the absence of any commercial or financial relationships that could be construed as a potential conflict of interest.
Publisher’s note
All claims expressed in this article are solely those of the authors and do not necessarily represent those of their affiliated organizations, or those of the publisher, the editors and the reviewers. Any product that may be evaluated in this article, or claim that may be made by its manufacturer, is not guaranteed or endorsed by the publisher.
Supplementary material
The Supplementary Material for this article can be found online at: https://www.frontiersin.org/articles/10.3389/fchem.2024.1478021/full#supplementary-material
References
Ding, Q., Yang, W., Xing, X., Lin, H., Xu, C., Xu, L., et al. (2024). Modulation by Co (II) ion of optical activities of L/D-glutathione (GSH)-modified chiral copper nanoclusters for sensitive adenosine triphosphate detection. Angew. Chem. Int. Ed. 63, e202401032. doi:10.1002/anie.202401032
Hanhauser, E., Bono, M. S., Vaishnav, C., Hart, A. J., and Karnik, R. (2020). Solid-phase extraction, preservation, storage, transport, and Analysis of trace contaminants for water quality monitoring of heavy metals. Environ. Sci. Technol. 54 (5), 2646–2657. doi:10.1021/acs.est.9b04695
Hong, A., Tang, Q., Khan, A. U., Miao, M., Xu, Z., Dang, F., et al. (2021). Identification and speciation of nanoscale silver in complex solid matrices by sequential extraction coupled with inductively coupled plasma optical emission spectrometry. Anal. Chem. 93 (4), 1962–1968. doi:10.1021/acs.analchem.0c04741
Hou, Y., Zhang, Z., Lu, S., Yuan, J., Zhu, Q., Chen, W.-P., et al. (2020). Highly emissive perylene diimide-based metallacages and their host–guest chemistry for information encryption. J. Am. Chem. Soc. 142 (44), 18763–18768. doi:10.1021/jacs.0c09904
Hussain, M. M., Asiri, A. M., Arshad, M. N., and Rahman, M. M. (2018). Development of selective Co2+ ionic sensor based on various derivatives of benzenesulfonohydrazide (BSH) compound: an electrochemical approach. Chem. Eng. J. 339, 133–143. doi:10.1016/j.cej.2018.01.130
Kim, D., Jo, A., Yang, H.-M., Seo, B.-K., Lee, K.-W., and Lee, T. S. (2017). Colorimetric detection and removal of radioactive Co ions using sodium alginate-based composite beads. J. Hazard. Mater. 326, 69–76. doi:10.1016/j.jhazmat.2016.12.007
Kong, L., Hu, X., Peng, X., and Wang, X. (2020). Specific H2S release from thiosulfate promoted by UV irradiation for removal of arsenic and heavy metals from strongly acidic wastewater. Environ. Sci. Technol. 54 (21), 14076–14084. doi:10.1021/acs.est.0c05166
Li, Y. H., Zhao, S. N., and Zang, S. Q. (2023). Programmable kernel structures of atomically precise metal nanoclusters for tailoring catalytic properties. Exploration 3 (3), 20220005. doi:10.1002/EXP.20220005
Lin, J., Chen, N., Feng, R., Nilges, M. J., Jia, Y., Wang, S., et al. (2020). Sequestration of selenite and selenate in gypsum (CaSO4·2H2O): insights from the single-crystal electron paramagnetic resonance spectroscopy and synchrotron X-ray absorption spectroscopy study. Environ. Sci. Technol. 54 (6), 3169–3180. doi:10.1021/acs.est.9b05714
Liu, J., Duchesne, P. N., Yu, M., Jiang, X., Ning, X., Vinluan, R. D., et al. (2016). Luminescent gold nanoparticles with size-independent emission. Angew. Chem. Inter. Ed. 55 (31), 8894–8898. doi:10.1002/anie.201602795
Ma, N., Ren, X., Wang, H., Kuang, X., Fan, D., Wu, D., et al. (2020). Ultrasensitive controlled release aptasensor using thymine–Hg2+–thymine mismatch as a molecular switch for Hg2+ detection. Anal. Chem. 92 (20), 14069–14075. doi:10.1021/acs.analchem.0c03110
Qi, D.-Y., Wang, C., Gao, Y.-C., Li, H.-W., and Wu, Y. (2022). Heteroatom doping and supramolecular assembly promoted copper nanoclusters to be a stable and high fluorescence sensor for trace amounts of ATP determination. Sens. Actuat B-Chem. 358, 131469. doi:10.1016/j.snb.2022.131469
Sagadevan, A., Ghosh, A., Maity, P., Mohammed, O. F., Bakr, O. M., and Rueping, M. (2022). Visible-light copper nanocluster catalysis for the C-N coupling of aryl chlorides at room temperature. J. Am. Chem. Soc. 144 (27), 12052–12061. doi:10.1021/jacs.2c02218
Saqib, M., Qi, L., Hui, P., Nsabimana, A., Halawa, M. I., Zhang, W., et al. (2018). Development of luminol-N-hydroxyphthalimide chemiluminescence system for highly selective and sensitive detection of superoxide dismutase, uric acid and Co2+. Biosens. Bioelectron. 99, 519–524. doi:10.1016/j.bios.2017.08.028
Shi, Y., Sun, K., Shan, J., Li, H., Gao, J., Chen, Z., et al. (2022). Selective CO2 electromethanation on surface-modified Cu catalyst by local microenvironment modulation. ACS Catal. 12 (14), 8252–8258. doi:10.1021/acscatal.2c01544
Shirani, M., Habibollahi, S., and Akbari, A. (2019). Centrifuge-less deep eutectic solvent based magnetic nanofluid-linked air-agitated liquid–liquid microextraction coupled with electrothermal atomic absorption spectrometry for simultaneous determination of cadmium, lead, copper, and arsenic in food samples and non-alcoholic beverages. Food Chem. 281, 304–311. doi:10.1016/j.foodchem.2018.12.110
Tvermoes, B. E., Finley, B. L., Unice, K. M., Otani, J. M., Paustenbach, D. J., and Galbraith, D. A. (2013). Cobalt whole blood concentrations in healthy adult male volunteers following two-weeks of ingesting a cobalt supplement. Food Chem. Toxicol. 53, 432–439. doi:10.1016/j.fct.2012.11.033
Wu, M., Yang, B., Shi, L., Tang, Q., Wang, J., Liu, W., et al. (2023). Peroxidase-mimicking DNAzymes as receptors for label-free discriminating heavy metal ions by chemiluminescence sensor arrays. Anal. Chem. 95 (6), 3486–3492. doi:10.1021/acs.analchem.2c05447
Xiao, L., Wang, B., Ji, L., Wang, F., Yuan, Q., Hu, G., et al. (2016). An efficient electrochemical sensor based on three-dimensionally interconnected mesoporous graphene framework for simultaneous determination of Cd(II) and Pb(II). Electrochim. Acta 222, 1371–1377. doi:10.1016/j.electacta.2016.11.113
Xu, L., Wang, X., Wang, W., Sun, M., Choi, W. J., Kim, J. Y., et al. (2022). Enantiomer-dependent immunological response to chiral nanoparticles. Nature 601 (7893), 366–373. doi:10.1038/s41586-021-04243-2
Zhang, J. H., Zhang, Z. T., Ou, Y. J., Zhang, F., Meng, J., Wang, G., et al. (2020). Red-emitting GSH-Cu NCs as a triplet induced quenched fluorescent probe for fast detection of thiol pollutants. Nanoscale 12 (37), 19429–19437. doi:10.1039/d0nr04645k
Zhang, X. P., Huang, K. Y., He, S. B., Peng, H. P., Xia, X. H., Chen, W., et al. (2021). Single gold nanocluster probe-based fluorescent sensor array for heavy metal ion discrimination. J. Hazard. Mater. 405, 124259. doi:10.1016/j.jhazmat.2020.124259
Keywords: chirality, fluorescence, nanoclusters, cobalt ion, detection
Citation: Ding Q, Wang F, Yang W, Xing X, Lin H, Xu L and Li S (2024) Ultrasensitive and highly selective Co2+ detection based on the chiral optical activities of L-glutathione-modified gold nanoclusters. Front. Chem. 12:1478021. doi: 10.3389/fchem.2024.1478021
Received: 09 August 2024; Accepted: 23 September 2024;
Published: 09 October 2024.
Edited by:
Qu Zhou, Southwest University, ChinaReviewed by:
Shaobin He, The Second Affiliated Hospital of Fujian Medical University, ChinaShi Gang Liu, Hunan Agricultural University, China
Copyright © 2024 Ding, Wang, Yang, Xing, Lin, Xu and Li. This is an open-access article distributed under the terms of the Creative Commons Attribution License (CC BY). The use, distribution or reproduction in other forums is permitted, provided the original author(s) and the copyright owner(s) are credited and that the original publication in this journal is cited, in accordance with accepted academic practice. No use, distribution or reproduction is permitted which does not comply with these terms.
*Correspondence: Si Li, c2lsaUBqaWFuZ25hbi5lZHUuY24=; Hengwei Lin, bGluaGVuZ3dlaUBqaWFuZ25hbi5lZHUuY24=
 Qi Ding1
 Liguang Xu
 Si Li
Si Li