
94% of researchers rate our articles as excellent or good
Learn more about the work of our research integrity team to safeguard the quality of each article we publish.
Find out more
ORIGINAL RESEARCH article
Front. Chem., 04 April 2024
Sec. Chemical Biology
Volume 12 - 2024 | https://doi.org/10.3389/fchem.2024.1371982
This article is part of the Research TopicNatural Products from Plants or Microorganisms for the Treatment of Non-Communicable DiseasesView all 5 articles
 Luis-Manuel Quiros-Guerrero1,2
 Laurence Marcourt1,2
 Nathareen Chaiwangrach3
 Alexey Koval4
 Emerson Ferreira Queiroz1,2
 Bruno David5
 Antonio Grondin5
 Vladimir L. Katanaev4,6
 Jean-Luc Wolfender1,2*
In natural products (NPs) research, methods for the efficient prioritization of natural extracts (NEs) are key for discovering novel bioactive NPs. In this study a biodiverse collection of 1,600 NEs, previously analyzed by UHPLC-HRMS2 metabolite profiling was screened for Wnt pathway regulation. The results of the biological screening drove the selection of a subset of 30 non-toxic NEs with an inhibitory IC50 ≤ 5 μg/mL. To increase the chance of finding structurally novel bioactive NPs, Inventa, a computational tool for automated scoring of NEs based on structural novelty was used to mine the HRMS2 analysis and dereplication results. After this, four out of the 30 bioactive NEs were shortlisted by this approach. The most promising sample was the ethyl acetate extract of the leaves of Hymenocardia punctata (Phyllanthaceae). Further phytochemical investigations of this species resulted in the isolation of three known prenylated flavones (3, 5, 7) and ten novel bicyclo[3.3.1]non-3-ene-2,9-diones (1, 2, 4, 6, 8–13), named Hymenotamayonins. Assessment of the Wnt inhibitory activity of these compounds revealed that two prenylated flavones and three novel bicyclic compounds showed interesting activity without apparent cytotoxicity. This study highlights the potential of combining Inventa’s structural novelty scores with biological screening results to effectively discover novel bioactive NPs in large NE collections.
Nature is a valuable source of chemical diversity, offering a wide range of molecules with therapeutic properties (Newman and Cragg, 2020). Plants serve as important reservoirs of bioactive natural products (NPs) that have been utilized for medicinal purposes for centuries. NPs often exhibit complex chemical structures due to evolutionary processes that enable them to interact with biological targets in precise ways (Feher and Schmidt, 2003; Atanasov et al., 2021). These characteristics are challenging to replicate synthetically, making NPs exceptionally suitable as starting points for drug development (Clark, 1996; Dias et al., 2012; Allard et al., 2023). Natural extracts (NEs) from plant origin possess a vast chemical diversity of NPs, positioning them as highly promising assets for the exploration and advancement of novel therapeutic agents. Although to date, only about c.a. 20% of plant species have been investigated, finding novel or rare structural scaffolds is becoming increasingly difficult. This challenge arises because species that are taxonomically related tend to biosynthesize similar constituents (David et al., 2015).
The most common approaches used for the selection of NEs prior to in-depth phytochemical studies include high-throughput bioactivity screening, traditional use of given medicinal plants, and literature reports (Hostettmann and Terreaux, 2000; Sarker et al., 2005; Sarker and Nahar, 2012). The identification of the active principles is classically performed by bio guided isolation. This strategy is resource-intensive and time-consuming due to the need for multiple rounds of fractionation and bioassays. There is also a risk of bioactivity lost during the isolation process while other concerns include false positives, selectivity issues in bioassays, and missing synergistic effects (Pieters and Vlietinck, 2005; Hamburger, 2019; Najmi et al., 2022). To overcome certain limitations and anticipate the chances to find bioactive NPs of interest, strategies like structural dereplication and extensive metabolites annotations through metabolomics are increasingly being integrated early in research workflows (Olivon et al., 2017; Caesar et al., 2021).
Early structural identifications of NPs in NEs can assist researchers in avoiding reported active NPs or efficiently searching for analogs of previously reported bioactive NPs (Hubert et al., 2017; Selegato et al., 2023). With the advancement of computational annotations methods throughput in metabolomics, it is now possible to evaluate the chemical space of large NEs collections (Gaudry et al., 2023). This information can be used to prioritize samples in the search for structurally novel NPs (Quiros-Guerrero et al., 2022).
To automatedly mine the large amount of metabolite profiling data and make use of prior pharmacognosy knowledge we recently introduced Inventa (Quiros-Guerrero et al., 2022), a metabolomics bioinformatic workflow designed to streamline the NEs selection process. Its primary objective is to pinpoint NEs with a heightened probability of containing structurally novel NPs within NEs collections, that have undergone untargeted UHPLC-HRMS2 metabolite profiling. Inventa follows a structured process and takes as input the results from the MZmine data processing (Schmid et al., 2023), the subsequent MS2 spectral data organization using Featured-Based Molecular Networking (FBMN) (Nothias et al., 2020), and the MS2 spectra annotation from advanced computational methods like TIMA (Allard et al., 2016; Rutz et al., 2019), and SIRUS (Dührkop et al., 2019). The annotation results of the features [a peak with an m/z value at a given retention time (RT)] detected in the samples include molecular formulas, chemical classes based on NPClassifier (Dührkop et al., 2021; Kim et al., 2021), and structural candidates (Dührkop et al., 2015; Cabral et al., 2016). It integrates previous literature reports for the considered taxon by conducting automated searches in the LOTUS initiative (Rutz et al., 2022), where NP structure occurrences are catalogued in their respective source organisms. Additionally, it exploits the MEMO (Gaudry et al., 2022) spectral fingerprints to evaluate the spectral diversity exhibited by a particular sample within a set of NEs. Based on all these data, Inventa calculates four individual component scores: the proportion of annotated features in each NE, the specificity of these features within a NEs data set, the number of reported structures in the NE taxon and the spectral divergence of the individual NE within the data set. It provides a combined score (Priority Score, PS) that enables the prioritization of NEs based on their potential for containing structurally novel NPs. In this study we intend to evaluate how Inventa can be combined with bioactivity screening results to highlight structurally novel bioactive NPs capable of regulating the Wnt signaling pathway.
The Wnt signaling pathway (Q155769) is critical in several biological processes like embryonic development, tissue homeostasis, and cellular proliferation (Blagodatski et al., 2020; Boudou et al., 2022; Liu et al., 2022). However, when dysregulated, it has been associated with several disorders, including cancer (Shaw et al., 2019b; Lim et al., 2021; Jiang et al., 2022), Alzheimer’s (Inestrosa et al., 2012), and osteoporosis (Houschyar et al., 2018; Lojk and Marc, 2021). Many of the current cancer treatments affect rapidly dividing cells resulting in notable side effects since these cells are essential for tissue maintenance in adults. A more targeted and specific approach, with fewer side effects, may be possible by focusing on targeting the Wnt signaling pathway exclusively in the cancer cells (Shaw et al., 2019b). Several NPs from diverse plant species have been reported to have some activity over the Wnt-signaling pathway through disruption of the Wnt/β-catenin cascade (Pooja and Karunagaran, 2014; Gu et al., 2019). Thus, the discovery of NPs capable of inhibiting or regulating the Wnt-signaling pathway has become a topic of significant interest in drug discovery programs (Fuentes et al., 2015; Nusse and Clevers, 2017).
The collection of NEs used for the Wnt-pathway regulation screening consists in a subset of 1,600 NEs from the Pierre Fabre Laboratories (PFL) Library that were previously analyzed by massive UHPLC-HRMS2 metabolite profiling, and different annotations workflows were applied. The set data was publicly disclosed allowing researchers to explore a wide range of chemical compositions across different plant species (Allard et al., 2023). The NEs were generated directly from the plant material by maceration with ethyl acetate, followed by SiO2-SPE filtration. This method was optimized for the recovery of middle polarity compounds, which is crucial for the objectives of the HTS program conducted by PFL. The samples were prepared in DMSO at a concentration of 5 mg/mL (Allard et al., 2023). This set of 1,600 NEs has been exploited for the development of bioinformatics tools (Gaudry et al., 2022; Gaudry et al., 2023).
In the search for structurally novel bioactive NPs from plants, we sought to investigate the UHPLC-HRMS2 metabolite profiling and Wnt-pathway regulation screening results for this set of 1,600 NEs. Then, to increase the chances of selecting active NEs containing novel NPs, Inventa was used to calculate priority scores for structural novelty. The combination of both information, the screening results, and Inventa’s scores highlighted several bioactive NEs with a high potential of containing structurally novel NPs.
The same samples used for the UHPLC-HRMS2 metabolite profiling previously described by Allard et al. (2023) were screened for the presence of compounds with a potential Wnt-regulatory activity. The screening experimental design used the BT-20 triple-negative breast cancer cell line (TNBC), stably transfected with the TopFlash reporter construct, and sensitive to purified Wnt3a stimulation (Koval et al., 2014; Shaw et al., 2019a). The NEs were screened in single repeats at five different concentrations (50, 25, 12.5, 6, and 3 μg/mL) and cytotoxicity was monitored at the same time. Given that the assay does not include positive control compounds, an NEs or compound is considered ‘toxic’ if its IC50 value against Renilla luciferase is less than 1.7 times the estimated TopFlash value. This indicates that any reduction observed in the TopFlash response is likely influenced by a significant toxic effect (Shaw et al., 2019a).
The results of the Wnt-regulatory bioactivity testing showed that out of the 1,600 NEs, 497 exhibited either Wnt-regulatory or cytotoxic activity. Among these active samples, 389 active NEs were classified into 148 NEs Wnt potentiators (79 NEs were non-toxic and 69 NEs had a toxicity IC50 > 50 μg/mL), and 241 NEs Wnt inhibitors (all non-toxic). The remaining 108 NEs were solely cytotoxic, with an IC50 value ranging between 0.30 μg/mL and 50 μg/mL.
Out of these 241 inhibitory NEs, 132 NEs showed a Wnt-inhibition IC50 < 50 μg/mL, with 53 NEs having a Wnt-inhibition IC50 < 10 μg/mL. Focusing on samples capable of inhibiting the Wnt pathway is essential for discovering NPs to treat diseases linked to the dysregulation of this pathway. Therefore, in this study, only inhibitory NEs were further considered.
The 241 NEs with Wnt inhibitory activities mentioned above comprised a total of 58 different botanical families, 97 different genera, and 105 unique species. Fabaceae (Q44448) is the most represented family with 14 samples, followed by Rubiaceae (Q156569) and Euphorbiaceae (Q156584) with nine and eight samples respectively. The most represented genus is Pandanus (Q471914, Pandanaceae Q736182) with five samples, followed by Sambucus (Q131448, Adoxaceae Q156677) with four samples, and Elegia (Q3007993, Restionaceae Q131501), Baliospermum (Q4850999, Euphorbiaceae Q156584), and Dolichos (Q526727, Fabaceae), each with three samples.
To further reduce the list only NEs with an inhibition IC50 below 5 μg/mL were considered. This reduced the 241 to 30 NEs comprising 25 different species from 17 different botanical families, with Fabaceae and Euphorbiaceae being the most prominent, each contributing 5 NEs. Within this reduced set, there were 23 different genera, with the majority represented by only 1 NE, except for Elegia with three samples, and Pandanus, Euphorbia (Q146567), Ehretia (Q276756), and Baliospermum with two samples each.
The biological screening results drove the first selection step, resulting in a subset of 30 non-toxic NEs with an inhibitory IC50 ≤ 5 μg/mL (see Figure 1A). To further refine the selection, additional selection criteria based on UHPLC-HRMS2 metabolite profiling data were used. Specifically, Inventa scores, which evaluates the metabolites potential structural novelty within NEs (Quiros-Guerrero et al., 2022). These scores were calculated for the entire 1,600 NEs set using the positive ionization (PI) mode UHPLC-HRMS2 (Allard et al., 2023) (Figures 1.B,C). They were therefore not limited to the 30 active extracts alone, and thus better demonstrated their potential for holding new structures, since the reference sample set was much broader than that restricted by the biological activity filter.
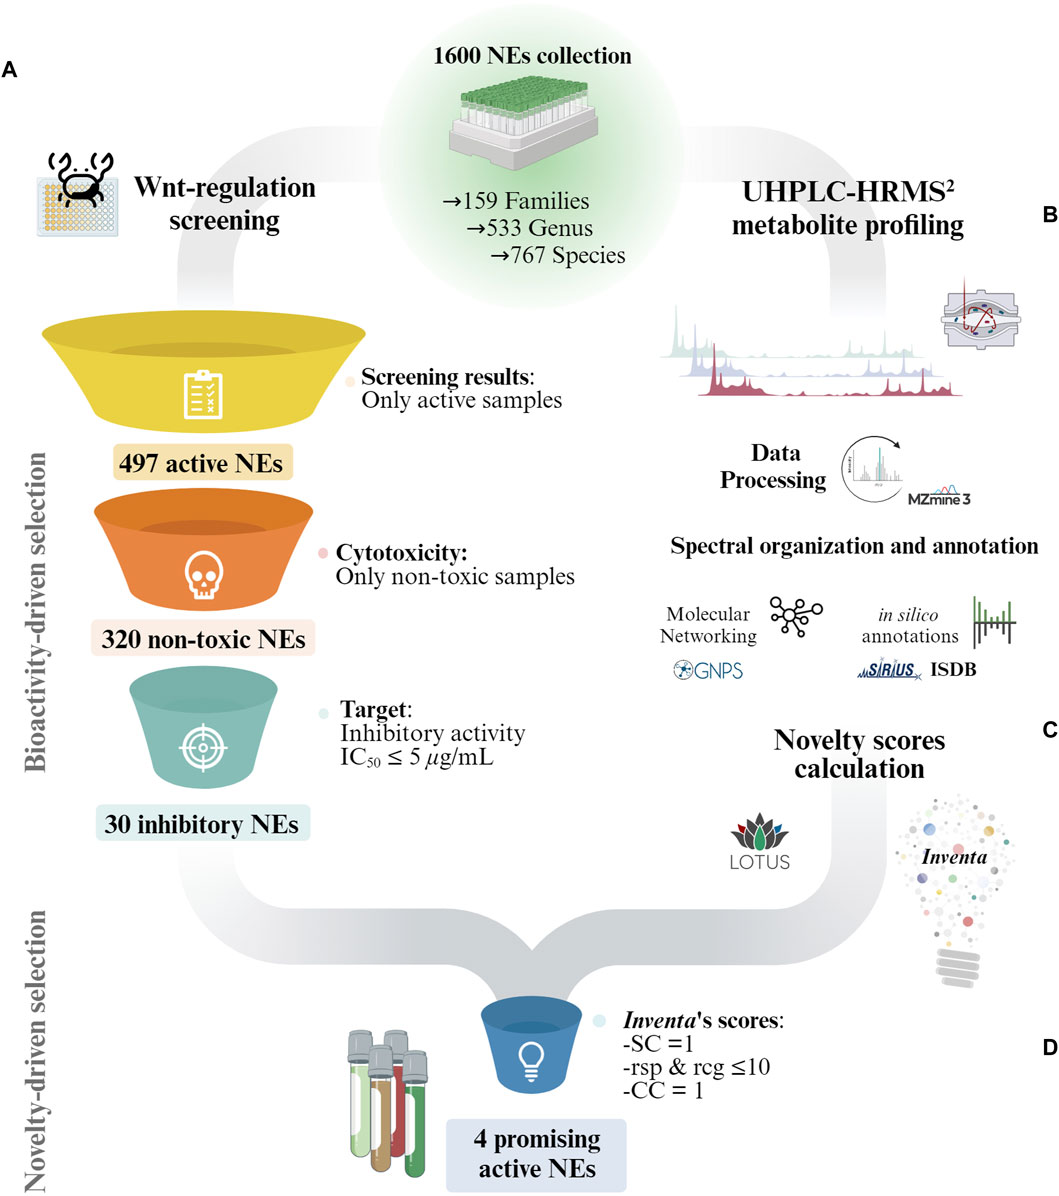
Figure 1. Overview of the general strategy for the selection of promising NEs for the discovery of structurally novel bioactive NPs in collections of NEs. (A) Bioactive-driven selection: The NEs collection is reduced according to the bioactivity screening results. In this study only non-toxic NEs with an Wnt inhibitory IC50 ≤ 5 μg/mL were considered. (B) General overview of the UHPLC-HRMS2 profiling and annotation workflow used for the characterization of the 1,600 NEs collection by Allard et al. (2023). (C) The UHPLC-HRMS2 and annotations results for the entire 1,600 NEs collection were fed to Inventa to calculate the structural novelty scores. (D) Novelty-driven selection: Each component given by Inventa for the reduced set of NEs was individually assessed for a more precise selection. SC: Similarity Component; CC: Class Component; rsp: reported compounds in species; rsg: reported compounds in genus.
The rough ranking based on PS significantly reduces the number of samples to consider which is important in large datasets. However, within the list of top-ranked samples, it is important to evaluate each parameter individually and, when possible, refine the literature search. This provides a better overview of the available data. The PS score enables to rapidly estimate the likeliness of a sample to contain potentially structurally novel NPs. This should not be interpreted as an absolute ranking. In this study, the focus shifted from the entire collection of 1,600 NEs to a much smaller subset of 30 active NEs. Instead of selecting these NEs based on their overall PS assigned by Inventa, a more meticulous approach was adopted. Each Inventa’s component for these NEs was individually assessed for a more precise selection.
The importance of the different novelty score components in the selection of NEs lies in its multifaceted approach to evaluating the structural richness and dissimilarities among samples. Inventa operates at two levels: first, by assessing individual features within each extract to gauge their specificity and annotation status, and second, by comparing the overall spectral space of each extract to measure dissimilarities in a sample set and potentially highlight NEs holding a pool of spectra correlated to a very specific metabolome. Subsequently, it integrates data from literature reports for the taxon, highlighting NEs potentially containing novel NPs (Quiros-Guerrero et al., 2022). The insights gained from these scores offer a thorough evaluation of the potential for extracts to contain structurally novel NPs. This comprehensive evaluation framework empowers researchers to pinpoint NEs with untapped metabolic potential, thereby facilitating the discovery of novel NPs with potential therapeutic applications.
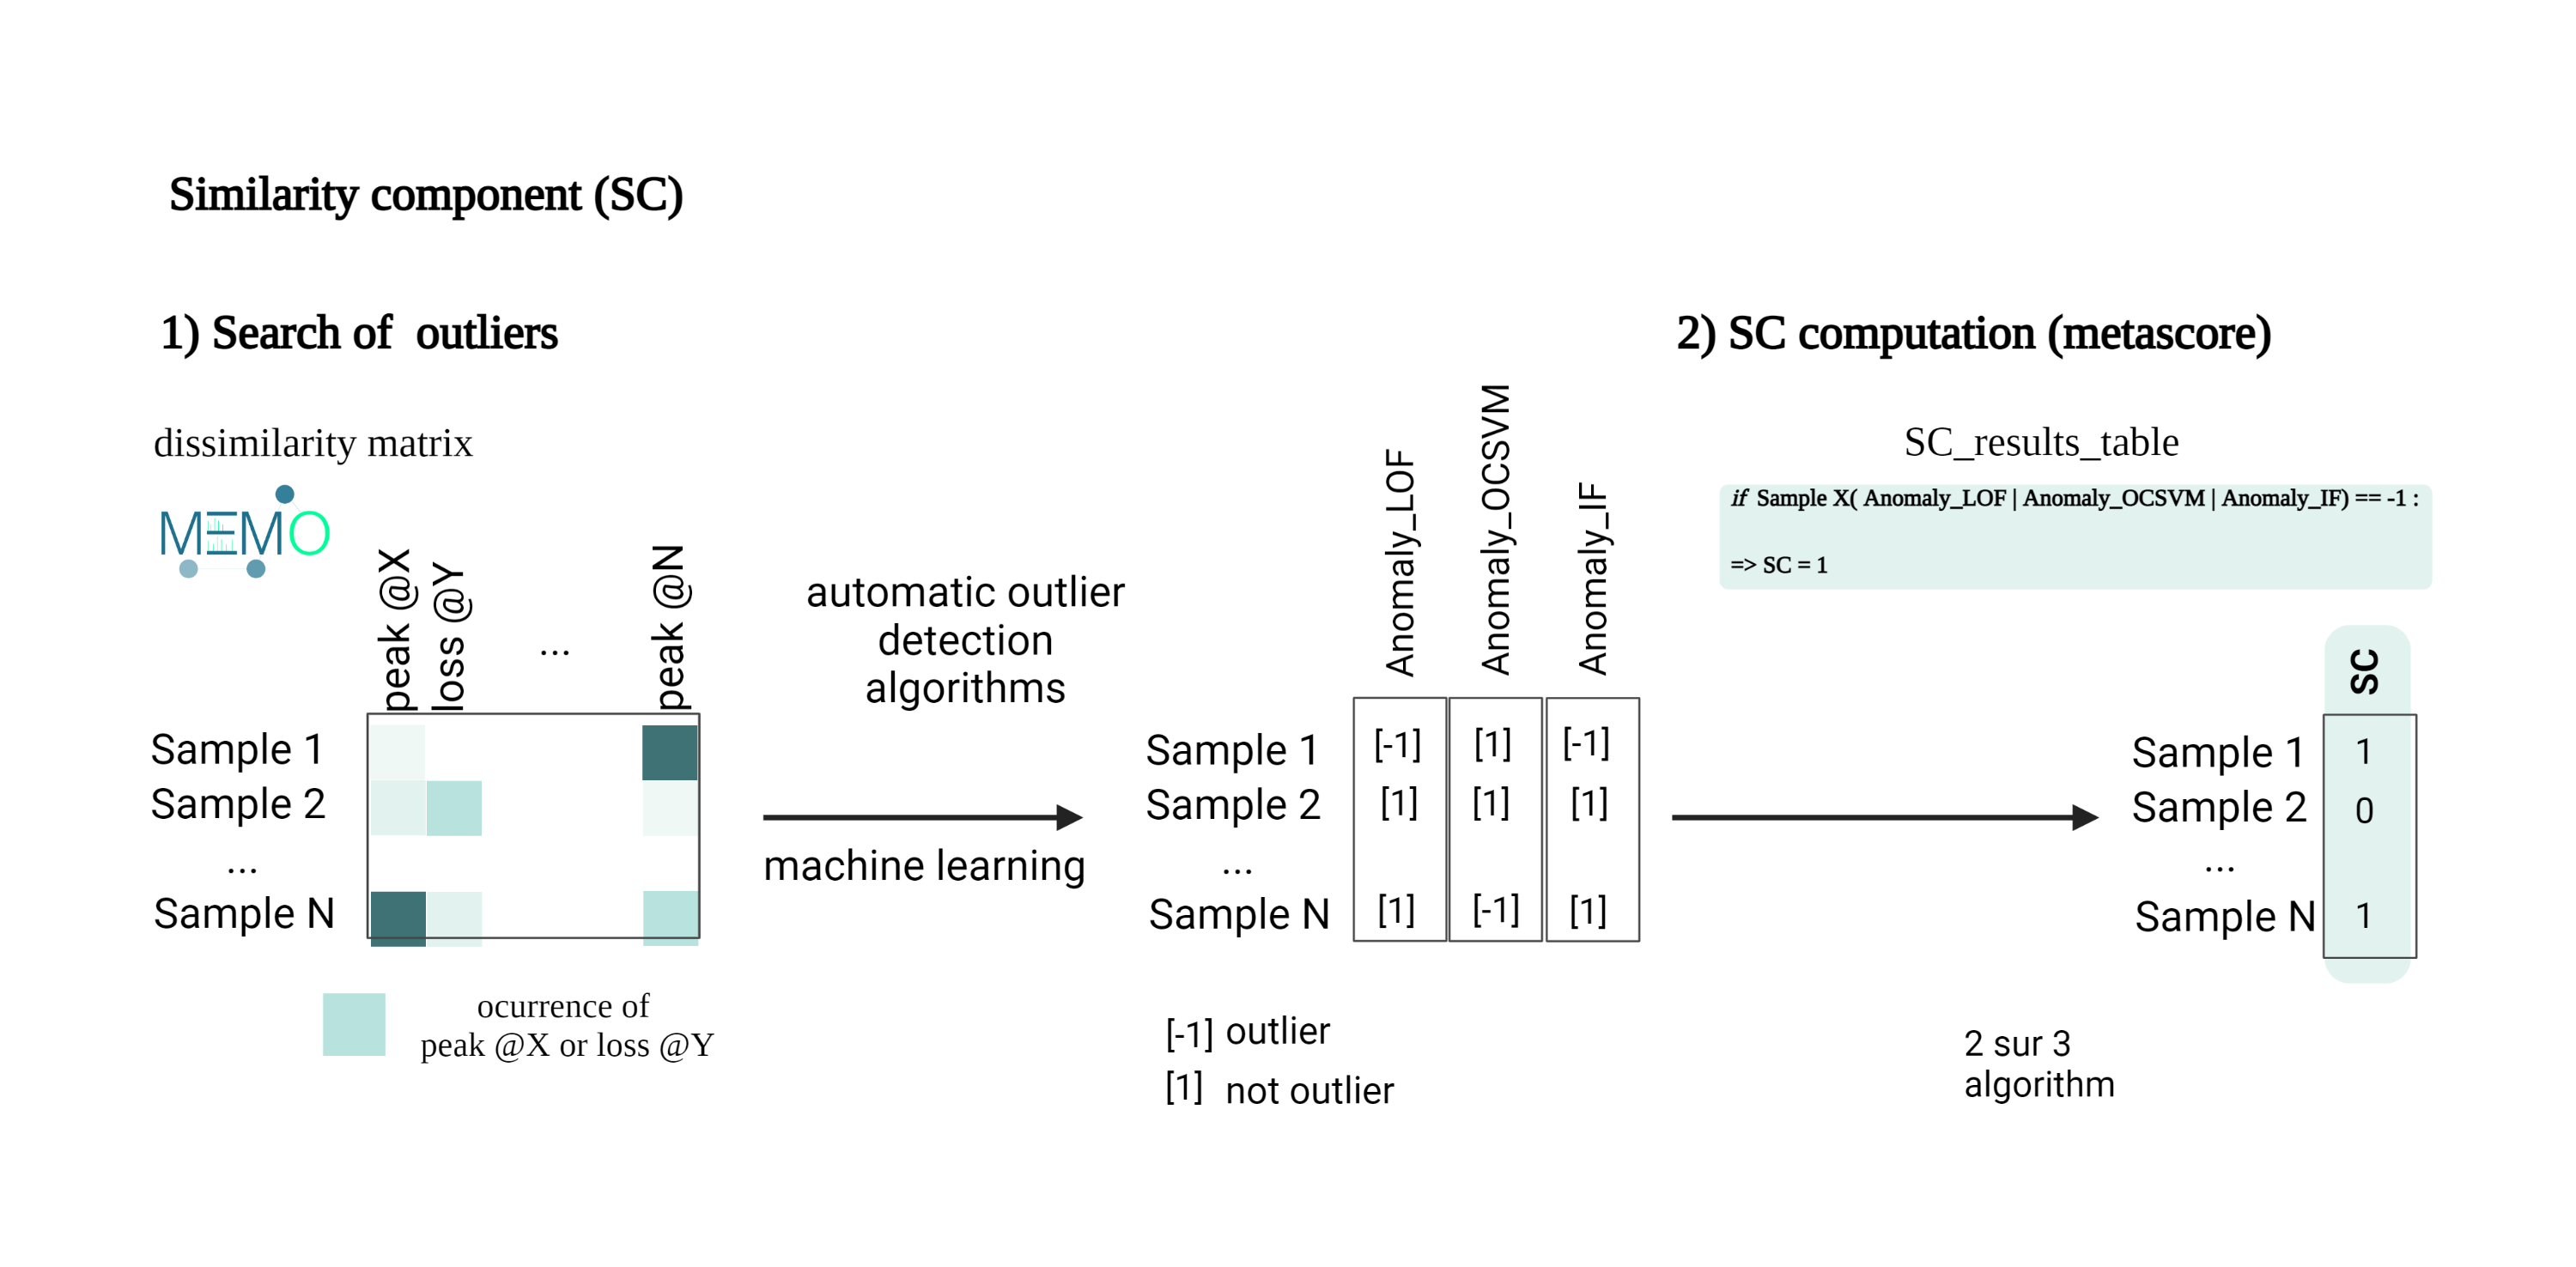
First, to ensure that only NEs potentially holding specific constituents (specific pool of MS2 spectra), only those with a Similarity Component (SC) value of ‘1’ were further considered. This score highlights extracts containing metabolites whose MS2 spectra are significantly different from those of all 1,600 extracts in the data set. The SC employes the MEMO metric (Gaudry et al., 2022) to generate a matrix containing all MS2 information in the form of peaks and neutral losses (Huber et al., 2020; 2021) and automatic outlier detection machine learning algorithms to emphasize NEs that display substantial spectral dissimilarity (Quiros-Guerrero et al., 2022). Out of the 30 NEs only six remained after this filter.
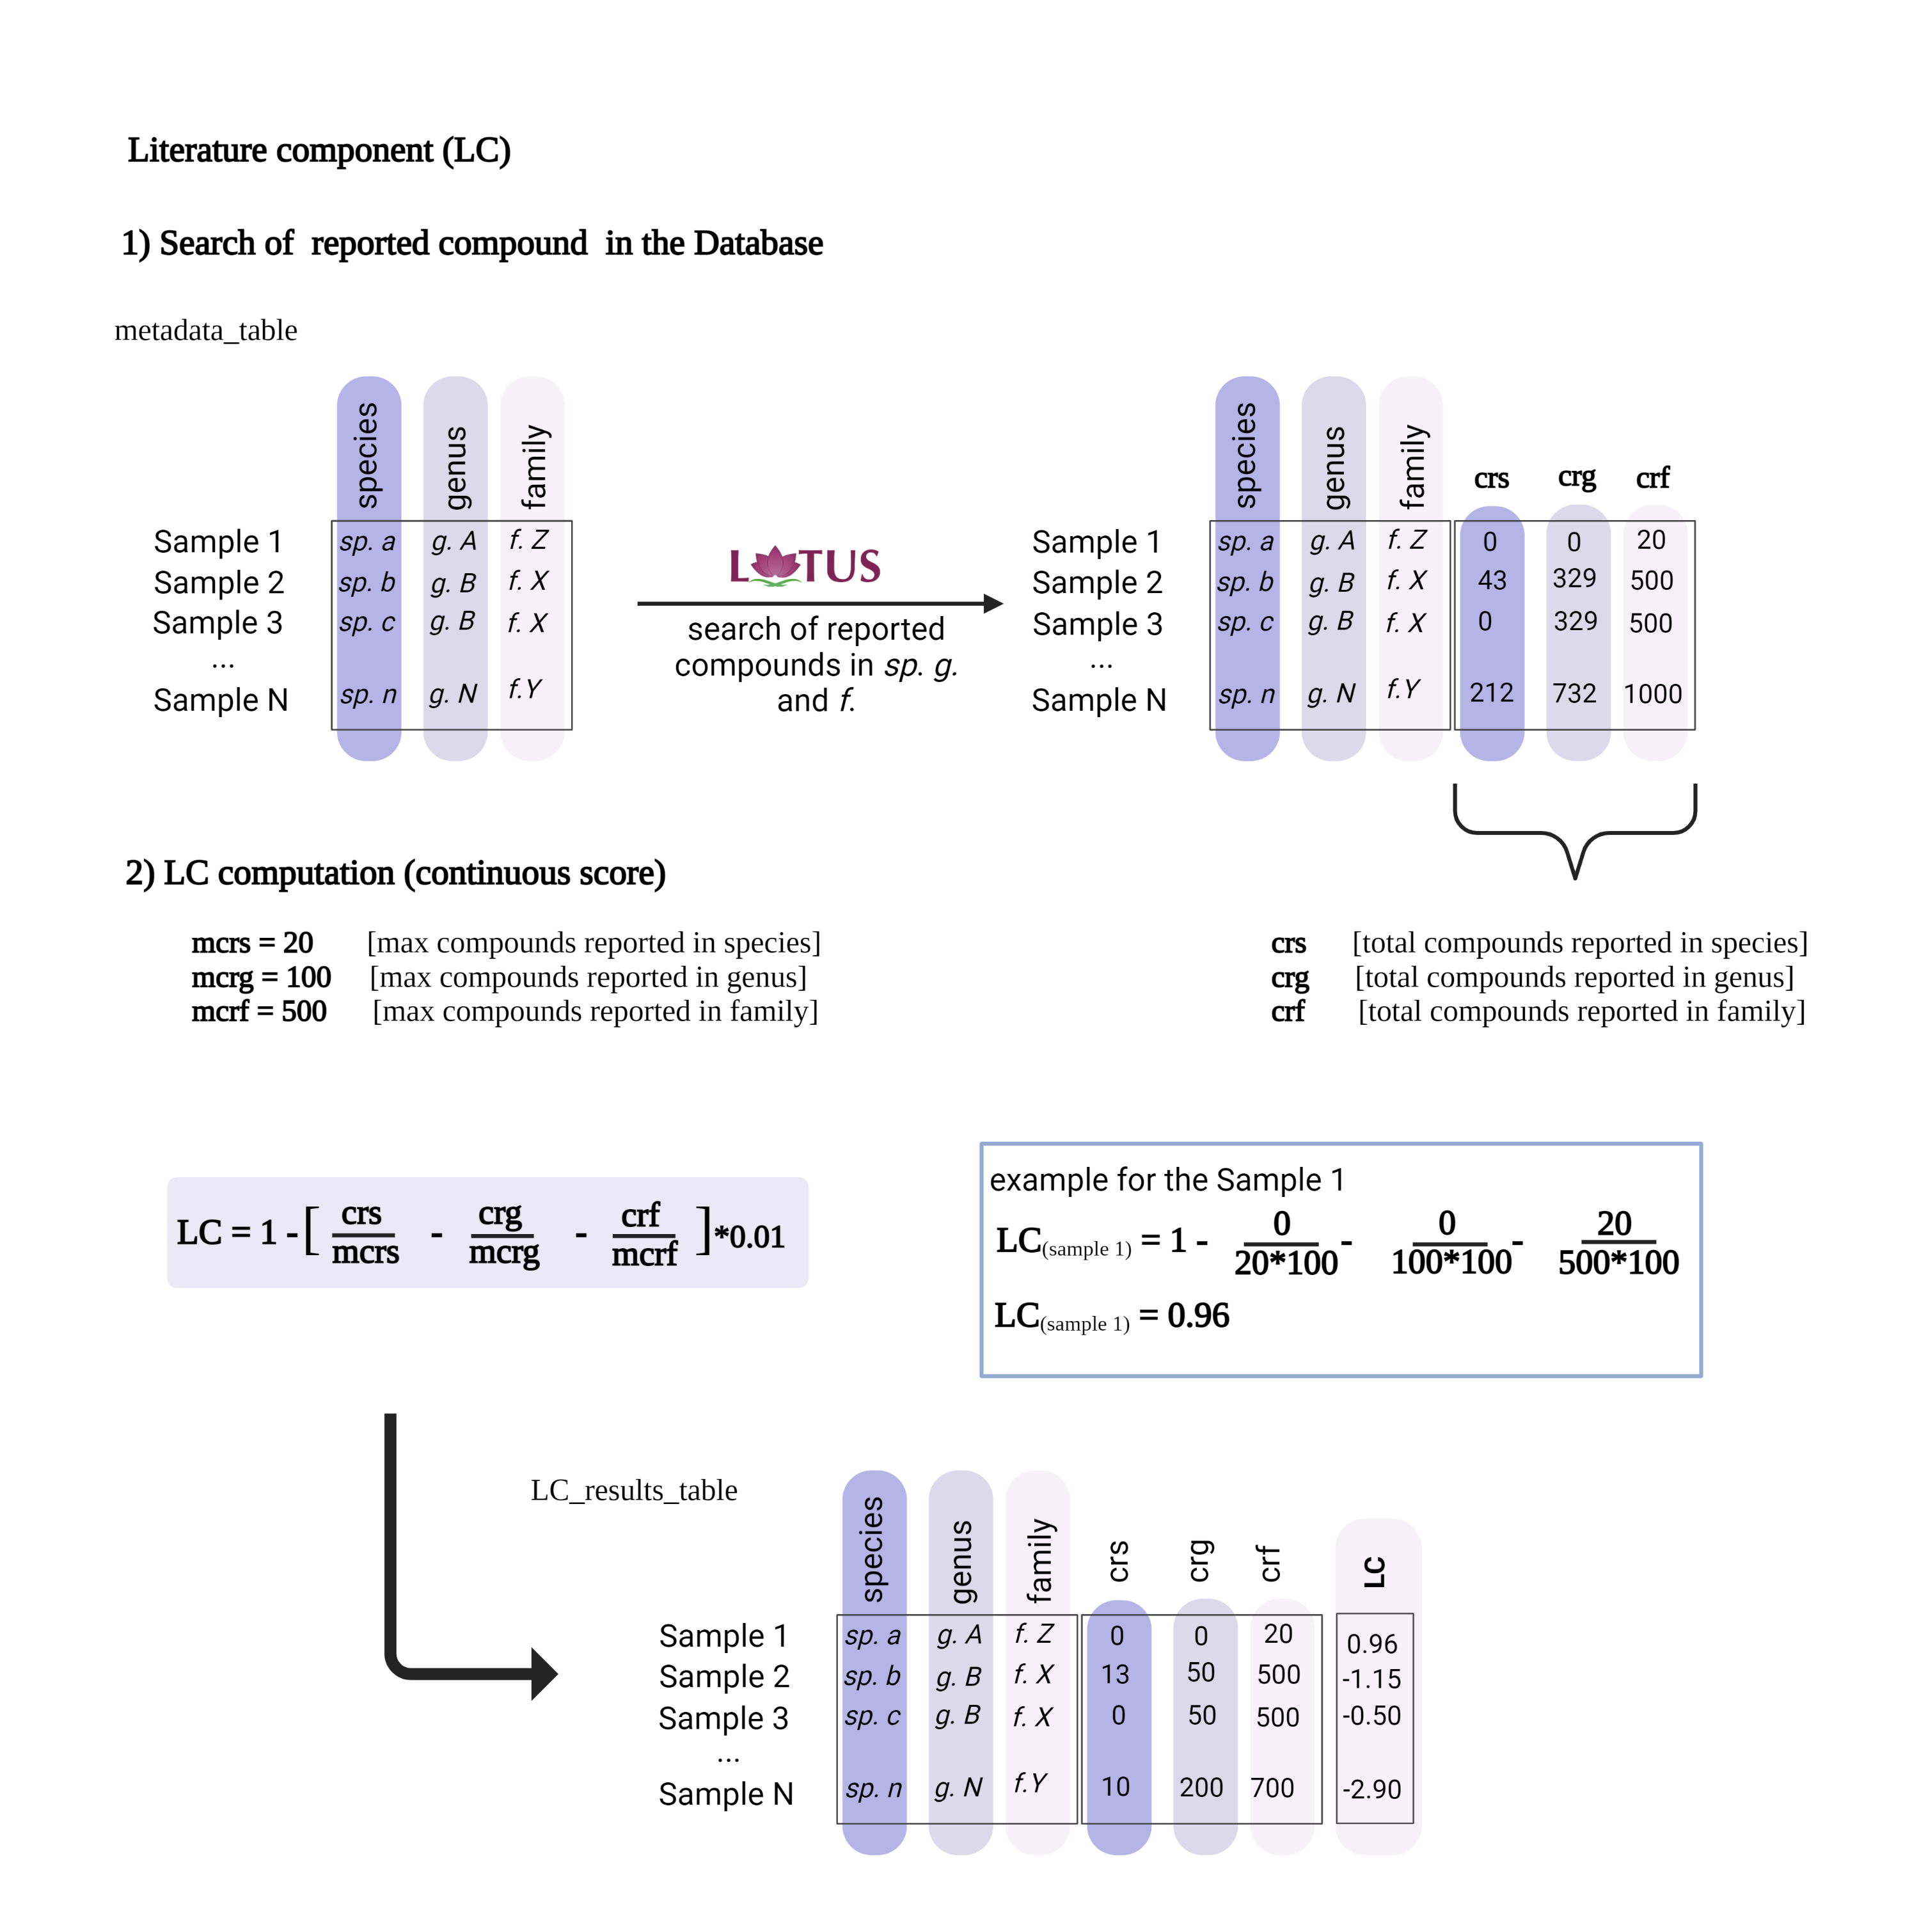
Then, only NEs with a Literature Component (LC) value close to ‘1’ were selected. The value of LC reflects a rough estimation of the extent of the prior phytochemical knowledge for a given taxon (according to LOTUS). The closer to ‘1’, the fewer compounds have been reported at the species, genus, and family levels for a given sample. Inventa calculates the number of reported compounds for each species, genus, and family, and this data forms part of the final information provided for each sample. Based on this information, only NEs reporting less than 10 reported compounds in both genus and species levels were further considered (Figure 1D).
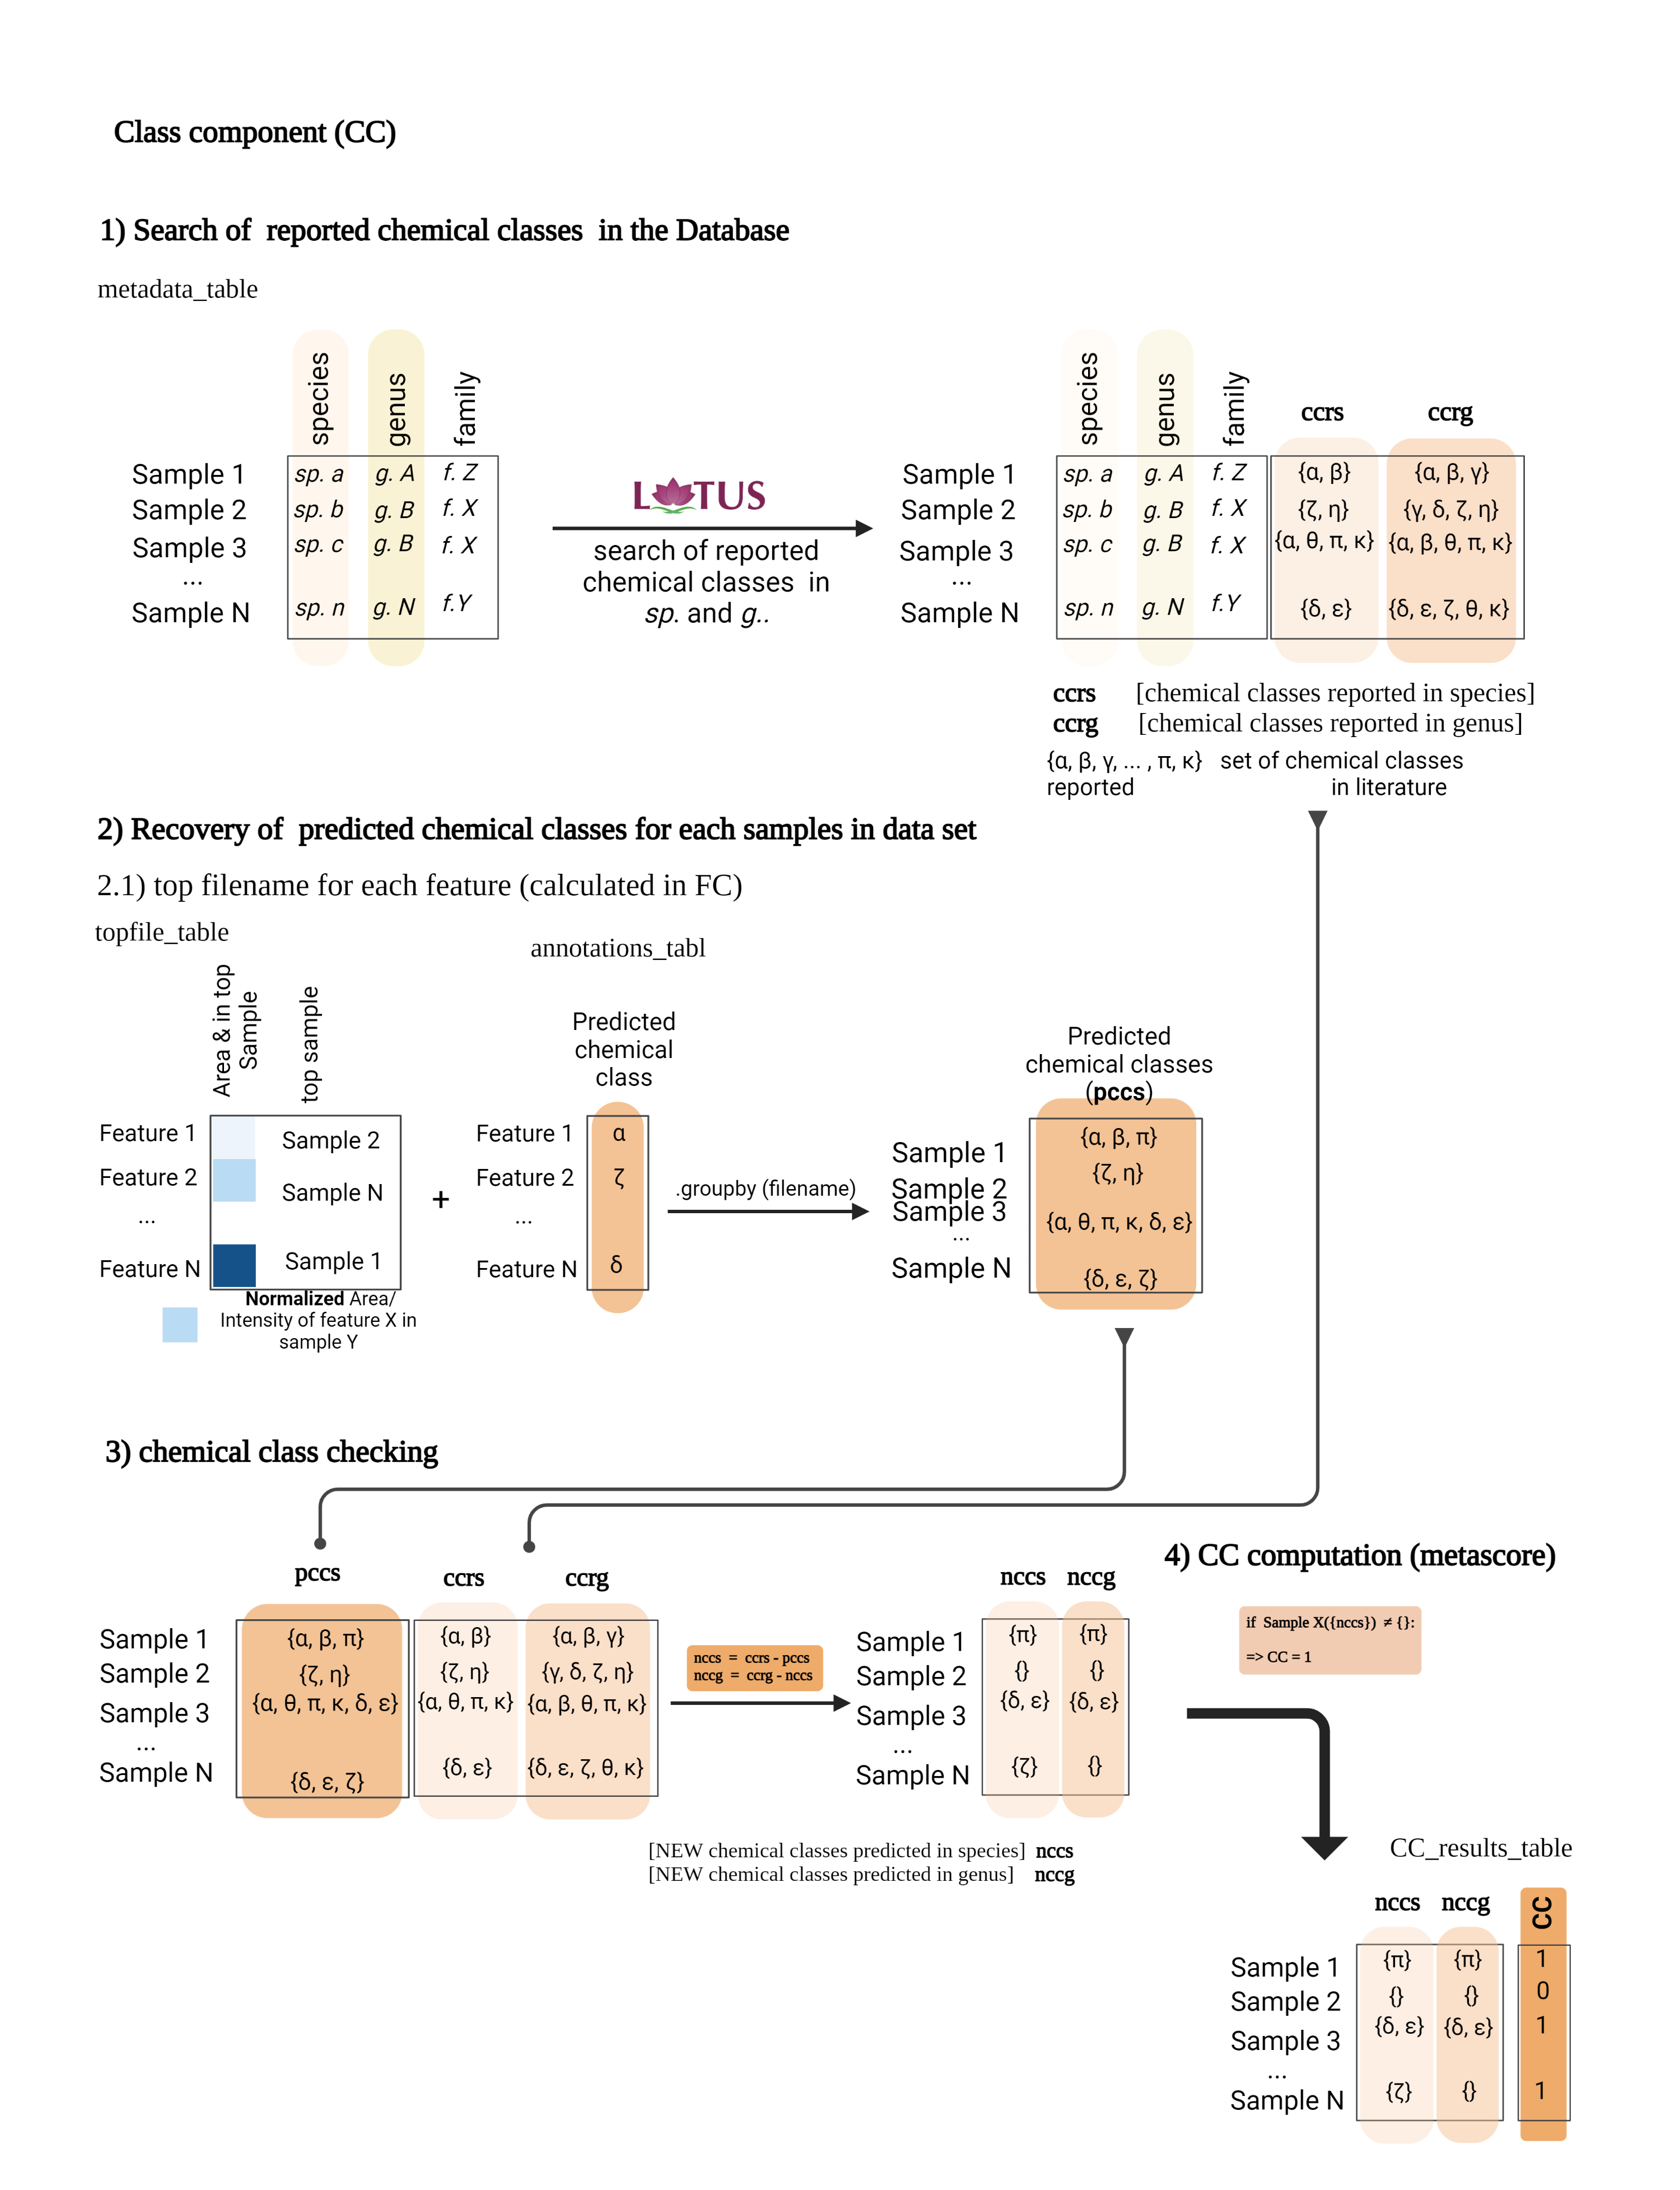
This reduced the 6 NEs to only 4 NEs with few compounds reported, since the species Derris scandens (Q15488445, Fabaceae) and Iris lactea (Q6747387, Iridaceae Q155941) presented over 100 and 400 compounds reported at the genus level respectively (see Wikidata Query results for genus Derris and Iris). Additionally, the remaining 4 NEs presented a Class Component (CC) of ‘1’. A CC value of one indicates that there are chemical classes proposed by CANOPUS (Dührkop et al., 2021) not yet reported for both the species and the genus (according to LOTUS). This suggests a high probability of potentially discovering unreported NPs within these NEs (Quiros-Guerrero et al., 2022).
The four highly active NEs remaining were: Hymenocardia punctata Wall. ex Lindl. (Q15514019, Phyllanthaceae Q133206), Aporosa villosa (Lindl.) Baill. (Q11128570, Euphorbiaceae Q156584), and 2 NEs of different plant parts of Baliospermum sonalifolium (Burm.) Suresh (Q15386102, Euphorbiaceae).
To further refine the selection process, a thorough complementary literature search was done on this final set of three species, considering all the possible botanical synonyms according to WFO Plant List. This search revealed no direct reports for the Brosimum solanifolium species. However, for one of its synonyms, Baliospermum montanum (Q3595677), the literature reports the presence of alkaloids, daphnanes, ingenanes, and phorbol esters (tiglianes Q27117179) like montanin (Q27107381) and baliospermin (Q27105913) (Seigler, 1994; Mali and Wadekar, 2008) with proven anticancer activity (Ogura et al., 1978). These metabolites were not accessible by LOTUS, so they were not considered in first instance. Since B. solanifolium, presents active reported NPs, both extracts were no further considered. For A. villosa, some reports already described various bioactivities of ethanolic extracts from different plant parts were reported (Srikrishna et al., 2008; Venkataraman et al., 2010; Nanna et al., 2021). Additionally, preliminary metabolite profiling indicated a high concentration of fatty acids. Therefore, this plant was not initially considered for further study.
In contrast, for Hymenocardia punctata, there were no existing reports on its chemical composition or bioactivity evaluation. This lack of information aligned with its initial LC score based on the Lotus. Consequently, the ethyl acetate extract of H. punctata leaves was identified as the most promising candidate for the discovery of novel NPs. This plant is a flowering shrub from the Phyllanthaceae family, found in Myanmar, Thailand, Laos, Cambodia, the Malay Peninsula, and Sumatra (van Welzen, 2016).
According to Inventa’s results, the annotation rate for the H. punctata extract was notably high (c.a. 75%). To further explore the regions of the chromatogram that were annotated, the comparison between the original (PI) UHPLC-HRMS2 chromatogram (from the 1,600 NEs collection metabolite profiling) and the Ionmap generated by Inventa was carefully inspected (Figure 2). Upon examination of the SIRIUS and ISDB annotation results, as well as the outcomes of Ion Identity FBMN (II-FBMN, see Supplementary Figure S1, PDF version here) (Nothias et al., 2020; Schmid et al., 2021), it emerged clearly that the most intense features (Figure 2A), were not annotated (green dots on the Ionmap in Figure 2B).
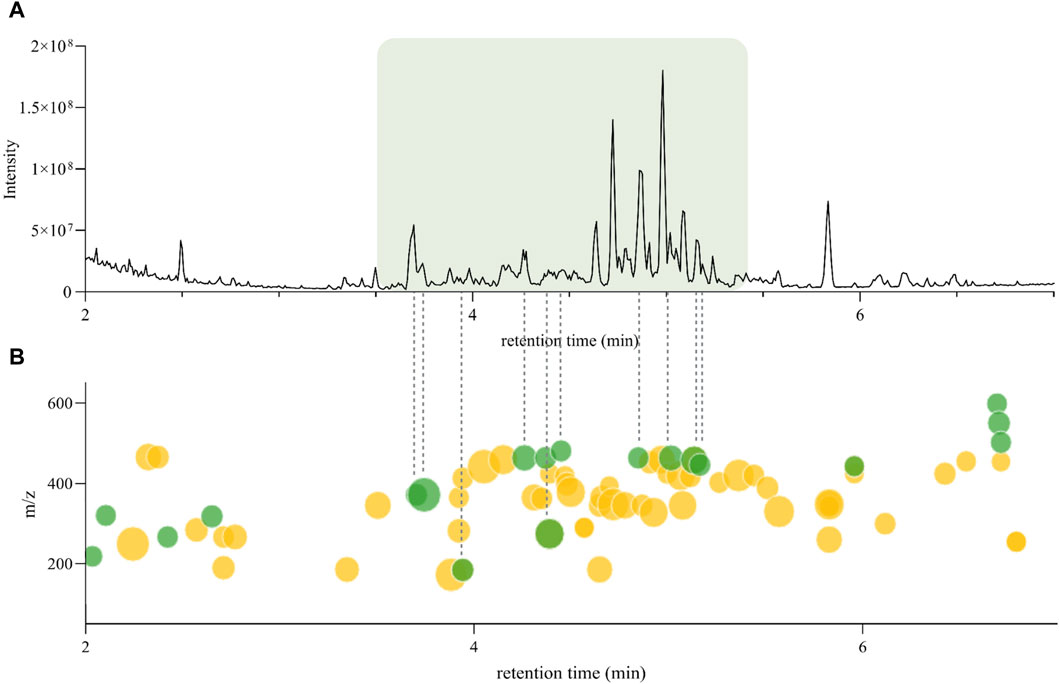
Figure 2. (A) Original UHPLC-HRMS2 chromatogram of Hymenocardia punctata leaves ethyl acetate extract from the 1,600 NEs collection. (B) Inventa’s ion map for the Original UHPLC-HRMS2 chromatogram of Hymenocardia punctata leaves ethyl acetate extract. Each dot represents one feature, the size is proportional to the intensity. The color shows the annotation status, green: unannotated, yellow: annotated (see interactive plot here).
For the following phytochemical studies, the leaves of H. punctata were subsequently extracted on a larger scale with hexane, ethyl acetate (HPE) and methanol. The HPE and HPM extracts underwent UHPLC-HRMS2 metabolite profiling. Additionally, a Charge Aerosol Detector (CAD) was used to obtain semiquantitative information (Ligor et al., 2013; Gamache, 2017). After careful composition assessment, only HPE was further considered. As shown in Figure 3A the features of interest were present and correlated with the major compounds in the extract according to the CAD chromatographic trace (Figure 3B).
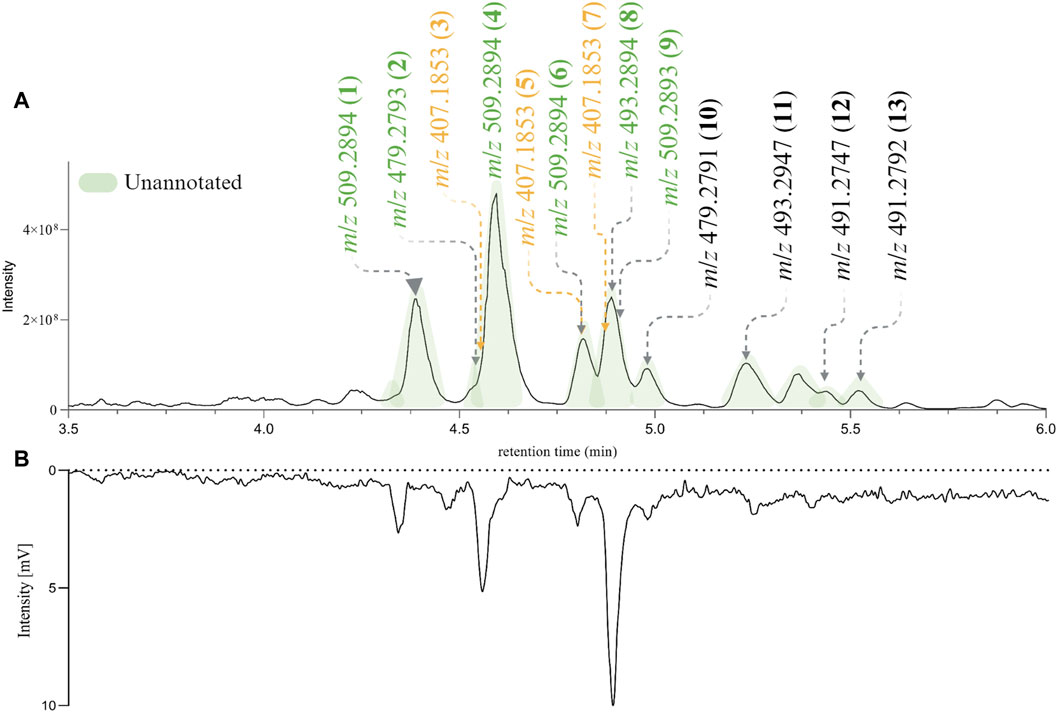
Figure 3. (A) PI UHPLC-HRMS2 chromatogram of de novo Hymenocardia punctata leaves ethyl acetate extract (HPE) between 3.5 min and 6 min. (B) Charge Aerosol Detector semiquantitative trace of HPE. The chromatographic peaks colored in green correspond to unannotated features after the dereplication process. The mass-to-charge ratio (m/z) of the most intense ions in the PI HRMS2 trace are shown. The m/z colored in green (unannotated features) and yellow (annotated features) found in the original HRMS2 profiling of Hymenocardia punctata (in the 1,600 NEs collection, Figure 2A).
The (PI) UHPLC-HRMS2 data from HPE was used to generate a new II-FBMN which confirmed most information obtained in the original extract from the 1,600 NEs collection. The most intense peaks were clustered together indicating their close structural relationship (II-FBMN, see Supplementary Figure S2, PDF version here). The chemical class and structural annotations obtained through GNPS, SIRIUS and CANOPUS (Dührkop et al., 2019; 2021) suggested that most compounds derived from the shikimate-phenylpropanoid and terpenoid pathways (refer to Treemap overview Supplementary Figure S3 -interactive plot visualization here-, and Supplementary Table S1).
Both the CAD and MS traces confirmed that the major constituents of HPE were not annotated. This, together with the novelty scores given by Inventa, confirmed that HPE is a promising extract for the search for new bioactive NPs.
An HPLC-based bioactivity profiling (Hamburger, 2019) was carried out to establish a relationship between the major unannotated chromatographic peaks (potentially new NPs) and the observed bioactivity of HPE. A small amount of HPE (c.a. 10 mg) was fractionated by semi-preparative HPLC-UV under optimized chromatographic conditions. Column’s effluent was collected into a 96 deep-well plate and the Wnt-regulatory bioactivity of each dried micro-fraction was assessed. The HPLC based bioactivity profile confirmed that the bioactivity was mainly related to the major unannotated peaks (See Supplementary Figure S4).
According to the dereplication results and the HPLC-based bioactivity profiling, the isolation efforts should be focused on the peaks with retention times between 3.5 and 6 min (see Figure 3). An in-depth phytochemical study of the HPE extract was carried out to corroborate the presence of structurally novel NPs and evaluate their Wnt regulatory activity. The chromatographic conditions used for the HPLC based bioactivity profiling were adapted to the flash chromatography scale using a geometrical gradient transfer (Guillarme et al., 2008). Several of the fractions obtained contained mixtures of compounds that were further separated by high resolution semi-preparative HPLC using dry-load injection (Queiroz et al., 2019).
This approach allowed the successful isolation of thirteen compounds (1–13, see Figure 4). The structures of all the compounds were determined based on the NMR and HRMS analyses. Three of these compounds were identified as 3′,8-diprenylapigenin 3) previously isolated from Morus alba (Q157307) (Dat et al., 2010), 6,8-diprenylapigenin 5) previously isolated from Glycyrrhiza inflata (Q5572787) (Lin et al., 2017), and 3′,6-diprenylapigenin 7) previously isolated from Glycyrrhiza uralensis (Q1196166) (Fukai et al., 1991). These compounds (3, 5, 7) were annotated as prenylated isoflavones by GNPS and Sirius. The other ten molecules corresponded to new compounds and were named Hymenotamayonins A-J (1, 2, 4, 6, 8–13), their full de novo structure identification is detailed below.
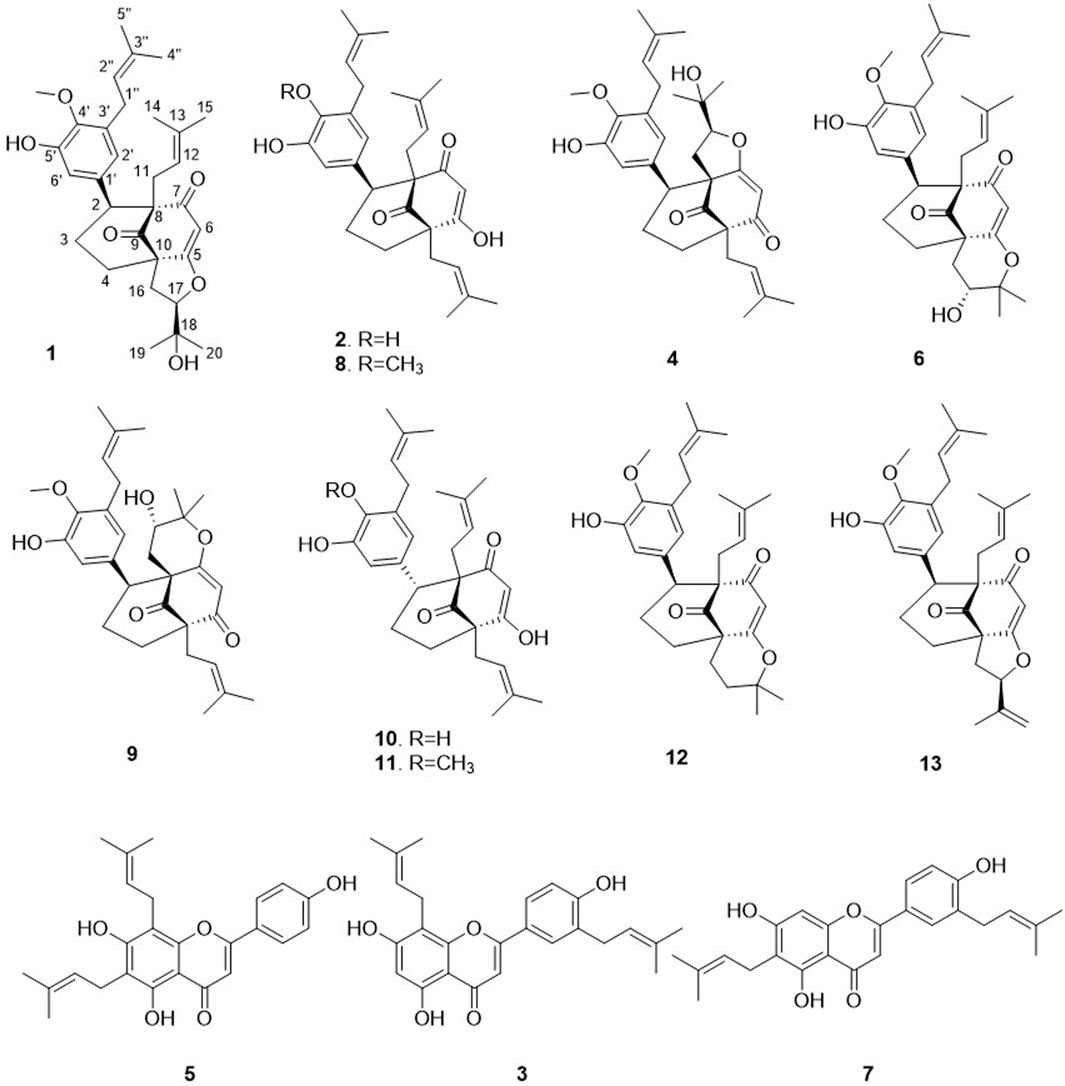
Figure 4. Structures of the isolated compounds from the ethyl acetate extract of Hymenocardia punctata leaves.
The relative retention time in the PI HRMS2 chromatogram is depicted in Figure 3 (numbers in parenthesis). The 13 compounds were recovered in sufficient amounts to allow full structural characterization and assessment of biological activity from only 55 g of dried plant material.
Compound 1 was isolated as an amorphous pale yellow powder with an [M + H]+ of m/z 509.2894 corresponding to a molecular formula (MF) of C31H41O6 (error −0.65 ppm) (see Table 1). It corresponded to the peak at 4.4 min in Figure 3. The NMR data showed signals related to a 3-prenyl-4-methoxy-5-hydroxyphenyl group; with two meta aromatic protons coupled to each other (J = 2.3 Hz) at δH 6.38 (CH-2′) and δH 6.47 (CH-6′), a methoxy singlet at δH 3.75 (4′-OCH3), a methylene at δH 3.28 (2H, m, CH2-1″), a vinylic proton at δH 5.24 (1H, thept, J = 6.7, 1.3 Hz, CH-2″) and two methyl groups at δH 1.73 (3H, d, J = 1.3 Hz, CH3-4″) and δH 1.77 (3H, d, J = 1.3 Hz, CH3-5″). This part of the molecule was confirmed based on the HMBC correlations from CH-2′ to C-1'' (δC 29.1), C-4' (δC 146.0), and C-6' (δC 115.8), from H-6′ to C-2' (δC 121.6), C-4′ and C-5' (δC 151.0), from CH3-4″ and CH3-5″ to C-3'' (δC 133.6) and C-2'' (δC 123.9), from CH2-1″ to C-2′, C-3' (δC 136.3), C-4′, C-2″ and C-3″, and from 4′-OCH3 to C-4' (see Figure 5). A second prenyl group was identified based on the signals at δH 2.05 and δH 2.17 for the methylene CH2-11, δH 4.76 for the ethylenic proton CH-12, and δH 1.48 and δH 1.50 for the two methyl groups CH3-14 and CH3-15. The COSY correlation from the methylene CH2-16 (δH 1.91 and δH 2.82) to the oxymethine CH-17 (δH 4.72) and the HMBC correlations from the methyl groups CH3-19 and CH3-20 (δH 1.21 and δH 1.34) to C-18 (δC 71.1) and CH-17 (δC 92.8) allowed the identification of a 3-methylbutyl chain with positions two and three oxygenated. The aromatic moiety from the 3-prenyl-4-methoxy-5-hydroxyphenyl group was shown to be linked to a methine, which is connected to two consecutive methylenes. This was evidence thanks to the HMBC correlations from the methine CH-2 (δH 3.12) to C-1' (δC 137.9), C-2′, C-6′, the methylenes CH2-3 (δC 27.5) and CH2-4 (δC 33.1), as well as the one from CH-3eq (δH 1.64) to C-1' (see Figure 5). A vinylic singlet at δH 5.80 (CH-6), two quaternary carbons (δC 61.7 (C-10) and 67.2 (C-8)), and three carbonyl carbons (δC 181.2 (C-5), 201.3 (C-7), and 207.7 (C-9)) fitted the number of carbons (31) with the molecular formula. The HMBC correlations from CH2-11 to CH-2, C-7, C-8, and C-9, from CH2-16 to CH2-4, C-5, C-9, and C-10, from CH-6 to C-5, C-8, and C-10, from CH-2 to C-7, and C-9, and from CH2-4 to C-5 allowed to position the 3-prenyl-4-methoxy-5-hydroxyphenyl group, the prenyl, and the 2,3-dihydroxy-3-methylbutyl group on a bicyclic[3.3.1] core as shown in Figure 4. The carbons C-8 and C-10 are bridged by a ketone (C-9) with a typical chemical shift (δC 207.7). These carbons together with CH-2, CH2-3, and CH2-4 integrate the first 6-member ring. The second ring shares the carbons C-8, C-9, and C-10 with a keto-enol system between carbons C-5, C-6, and C-7. According to the molecular formula, an additional ring must be established either between the tertiary alcohol in C-18 and C-5 to form a tetrahydropyran ring, or between the secondary alcohol in C-17 and C-5 to form a tetrahydrofuran ring. The lack of HMBC correlation between CH-17 and C-5 could not answer this question. Measurements in CDCl3 were done to try to find correlations between these protons by avoiding solvent exchanges, but they did not show any correlations either. However, the CH-17 and C-18 chemical shift values (δC 92.8 and δC 71.1, respectively) compared to values in the literature for oblongifolin R (which presents a tetrahydrofuran ring with CH at δC 94.8 and C at δC 71.1) and oblongifolin S (bearing a tetrahydropyran ring with CH at δC 69.6 and C at δC 86.9) (Zhang et al., 2014) led to the conclusion that a 5-member ring is present. The two-dimensional structure of compound 1 was established as shown in Figure 4. The relative configuration was established through the ROESY correlations observed in CD3OD and CDCl3. The spectra recorded in CDCl3 helped identify the pseudo equatorial and axial positions of CH2-3 and CH2-4 protons. These proton signals overlapped with other ones in CD3OD. The ROESY correlations from CH-2'/CH-6′ to CH-4ax indicated that the 3-prenyl-4-methoxy-5-hydroxyphenyl group was in a pseudo axial position and the coupling constant value of CH-2 (J = 5.4 Hz in CD3OD, J = 6.1 Hz in CDCl3) confirmed that CH-2 was in a pseudo equatorial position (Figure 6A). The correlation between CH-17 and CH-4eq indicated the relative configuration of C-17 (Figure 6A). Consequently, the relative configuration of 1 was proposed as (2S,8R,10R,17R) or (2R,8S,10S,17S). To establish its absolute configuration, the ECD spectrum was calculated based on the relative configuration proposed by NMR and compared to the experimental data (Figure 6B). Thus, compound 1 was assigned as (2S,8R,10R,17R)-2-(5-hydroxy, 4-methoxy-3-(3-methylbut-2-en-1-yl)phenyl)-12-(2-hydroxypropan-2-yl)-8-(3-methylbut-2-en-1-yl)-5-oxotricyclo[6.3.1.05,10]dodec-5-ene-7,9-dione and named Hymenotamayonin G.
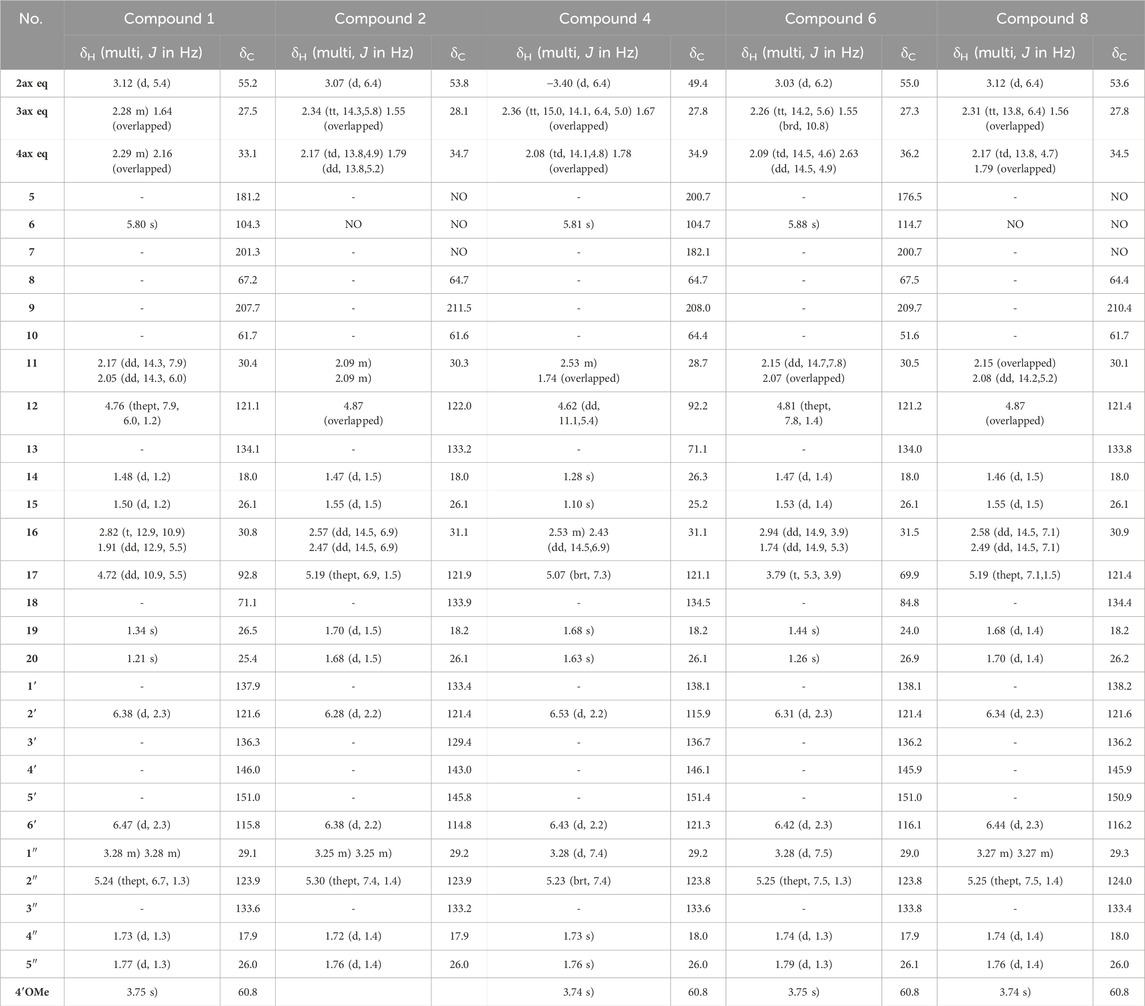
Table 1. 1H NMR (600 MHz) and13C NMR (151 MHz) data of compounds 1, 2, 4, 6, and eight in CD3OD. NA: signal not detected due to the keto-enol tautomerism in system C(5)-C(6)-C(7).
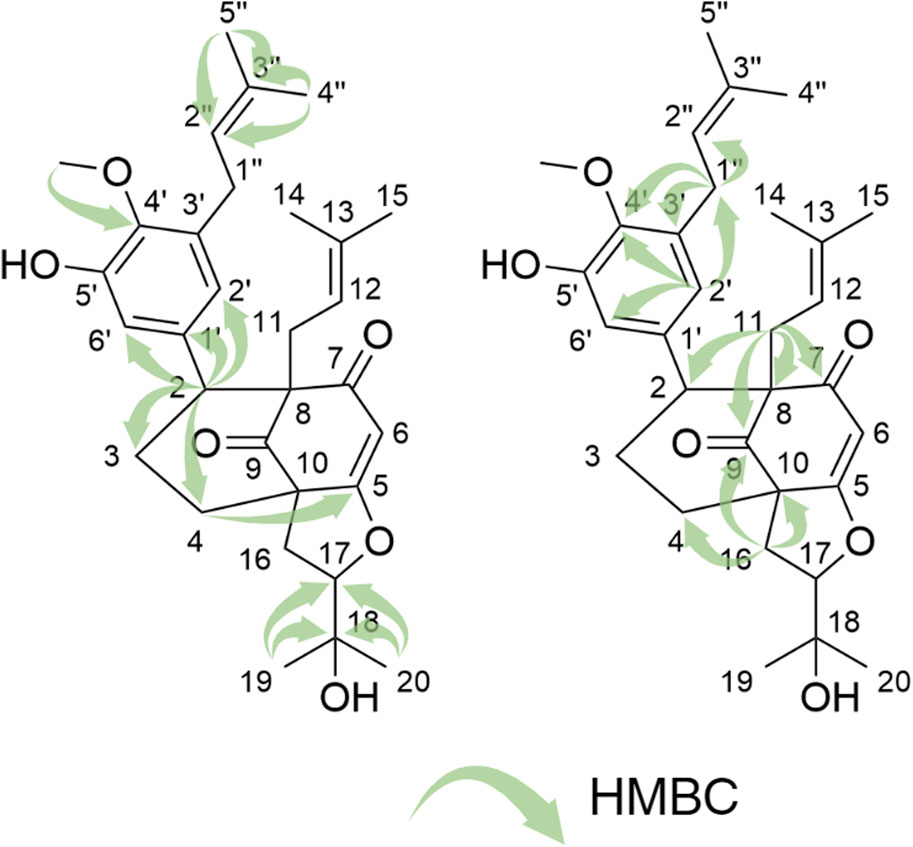
Figure 5. Key HMBC correlation for compound 1.
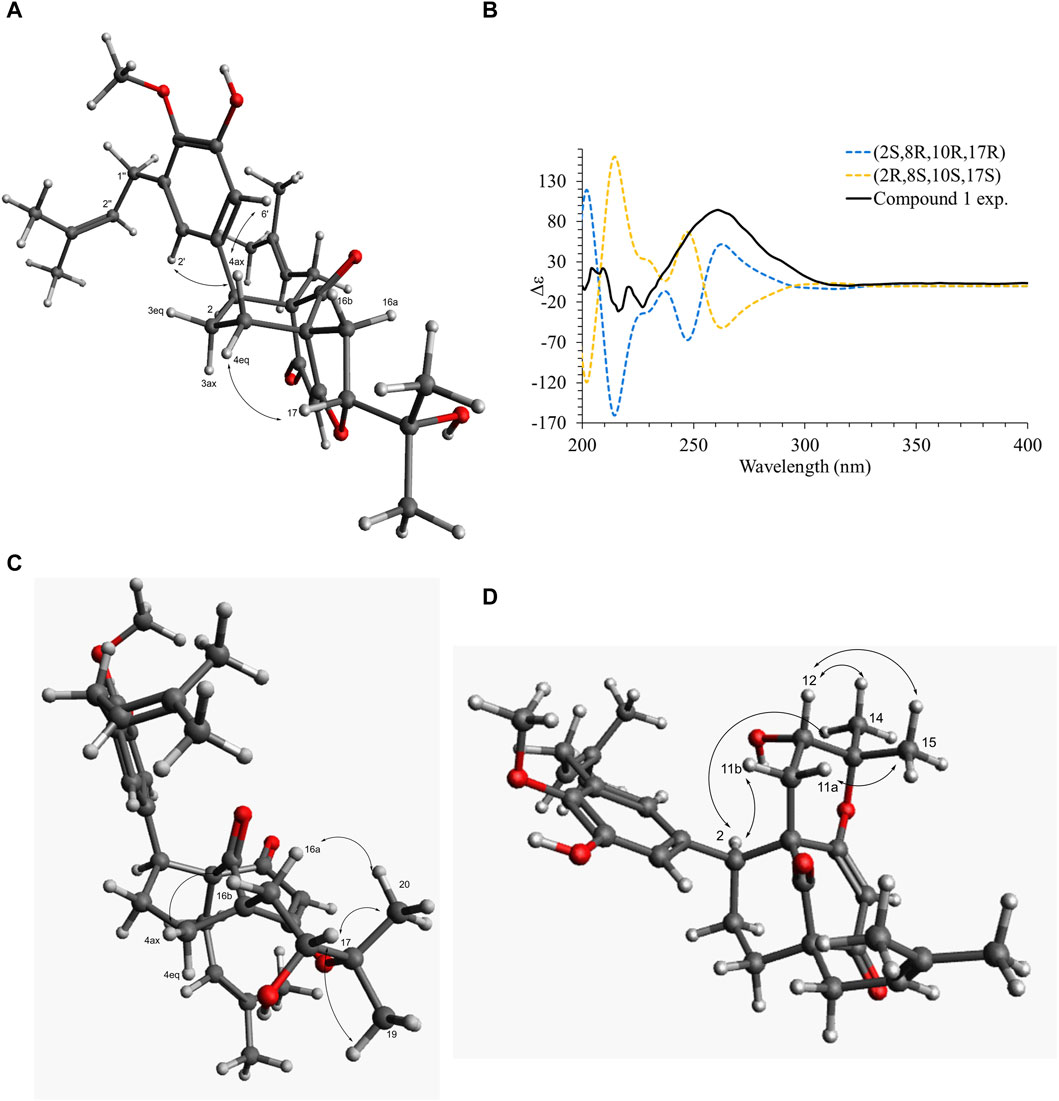
Figure 6. (A) Key dipolar correlations and ROESY spectrum for compound 1. (B) Experimental and B3LYP/def2svp//B3LYP/6-31G(d,p) calculated ECD spectra in methanol for compound 1. (C) Key dipolar correlations for compound 6. (D) Key dipolar correlations for compound 9.
Compound 2 was isolated as an amorphous pale yellow powder with an [M + H]+ of m/z 479.2793 corresponding to MF of C30H39O5 (error 0.21 ppm) (see Table 1). It corresponded to the peak at 4.5 min in Figure 3. The 1H NMR data compared to that of 1 showed that: i) the vinylic singlet at δH 5.80 (CH-6) was missing, ii) the methoxy (4′-OCH3) signal was absent, and iii) signals from the 2,3-dihydroxy-3-methylbutyl chain were replaced by those belonging to a third prenyl group (a methylene CH2-16 at δH 2.47/2.57, a vinylic proton CH-17 at δH 5.19, and two methyl CH3-20/CH3-19 δH 1.68/1.70). This prenyl group was positioned in C-10 thanks to the HMBC correlations from CH2-16 to the methylene CH2-4 (δC 34.7), the quaternary carbon C-10 (δC 61.6) and the ketone C-9 (δC 211.9). To fit with the molecular formula, an enolized 1,3-diketone was placed in C-5, C-6, and C-7. Due to the rapid tautomeric equilibrium and H/D exchange with the solvent, the 1H and 13C signals of C-5, CH-6, and C-7 were not observed (Traven et al., 1997; Rajaonarivelo et al., 2016) (See Supplementary Figure S5). The relative configuration of 2 was the same as described for 1, and the absolute configuration was confirmed with the comparison between the calculated and experimental ECD spectra (See Supplementary Figure S6). Thus compound 2 was identified as (2S,8R,10R)-(4,5-dihydroxy-3-(3-methylbut-2-en-1-yl)phenyl)-5-hydroxy-8,10-bis(3-methylbut-2-en-1-yl)bicyclo[3.3.1]non-6-ene-7,9-dione and named Hymenotamayonin A.
The molecular weight of compound 4, m/z 509.2894 [M + H]+ (calculated for MF C31H41O6, error −0.65 ppm) was the same as compound 1 and the NMR data were also (see Table 1) very close with the same functional groups: a 3-prenyl-4-methoxy-5-hydroxyphenyl, a prenyl group, a 2,3-dihydroxy-3-methylbutyl chain, all attached to a bicyclic[3.3.1] core. The difference between 1 and 4 was the positions of the prenyl group and the 2,3-dihydroxy-3-methylbutyl chain in the bicyclic core. In 4, the HMBC correlations from the methylene CH2-16 of the prenyl at δH 2.43/2.53 to CH2-4 (δC 27.8), C-10 (δC 64.4), C-5 (δC 200.7), and C-9 (δC 208.0), and from the methylene CH2-11 of the 2,3-dihydroxy-3-methylbutyl chain at δH 1.74/2.53 to CH-2 (δC 49.4), C-8 (δC 64.7), and C-7 (δC 182.1) indicated that the prenyl was in C-10 and the 2,3-dihydroxy-3-methylbutyl chain was in C-8. As in 1, the chemical shift of CH-12 (δC 92.2) and C-13 (δC 71.1) showed that a tetrahydrofuran ring is present between CH-12 and C-7. The coupling constant of CH-2 (d, J = 6.4 Hz) and the ROESY from the aromatic protons CH-2′ and CH-6′ to CH-4ax at δH 2.08 (td, J = 14.1, 4.8 Hz) indicated that as in 1, that the aromatic group is in a pseudo axial configuration. The ROESY correlation from CH-2 to the methine CH-12 of the tetrahydrofuran group showed that the configuration of C-12 and C-2 is S. Comparison of the experimental and calculated ECD spectra corroborated this observation (See Supplementary Figure S6). Compound 4 was identified as (2S,8R,10R,12S)-2-(5-hydroxy, 4-methoxy-3-(3-methylbut-2-en-1-yl)phenyl)-17-(2-hydroxypropan-2-yl)-10-(3-methylbut-2-en-1-yl-7-oxotricyclo[6.3.1.07,8]dodec-6-ene-5,9-dione and named Hymenotamayonin H. It corresponded to one of the major peak at 4.6 min in both, MS and CAD traces (Figure 3).
Similar to 1, compound 6 exhibited an MF of C31H40O6 (m/z 509.2894 [M + H]+, error −0.65 ppm) (see Table 1). The NMR data of 6 were very close to those of 1 and indicated that the connectivity and configuration of the bicyclic[3.3.1] core, the pseudo axial position of the 3-prenyl-4-methoxy-5-hydroxyphenyl group in C-2, the linkage of the prenyl group in C-8 were the same as those described for 1. The main differences concerned the 2,3-dihydroxy-3-methylbutyl chain for which the chemical shift values of the oxymethine C-17 were observed at δC 69.9 (δC 92.8 for 1) and the quaternary oxygenated carbon C-18 at δC 84.8 (δC 71.1 for 1). This agreed with the presence of a tetrahydropyran ring (Figure 4). The configuration at C-17 was determined thanks to the ROESY correlation from CH-16eq at δH 1.74 (dd, J = 14.9, 5.3 Hz) to CH-4ax at δH 2.09 (td, J = 14.5, 4.6 Hz), from CH-16ax at δH 2.94 (dd, J = 14.9, 3.9 Hz) to CH3-20 at δH 1.26 (Figure 6C). The coupling constant value of CH-17 (t, J = 5.3, 3.9 Hz) and its ROESY correlations with CH3-19 and CH3-20 indicated its equatorial position. The configuration proposed was confirmed by comparison of the experimental and calculated ECD spectra (See Supplementary Figure S6). Compound 6 was then identified as (2S,8R,10R,17R)-17-hydroxy-2-(5-hydroxy, 4-methoxy-3-(3-methylbut-2-en-1-yl)phenyl)-18,18-dimethyl-8-(3-methylbut-2-en-1-yl)-5-oxotricyclo[7.3.1.05,10]dodec-5-ene-7,9-dione and named Hymenotamayonin I. It corresponded to one of the peaks at 4.8 min in Figure 3. (Table 2)
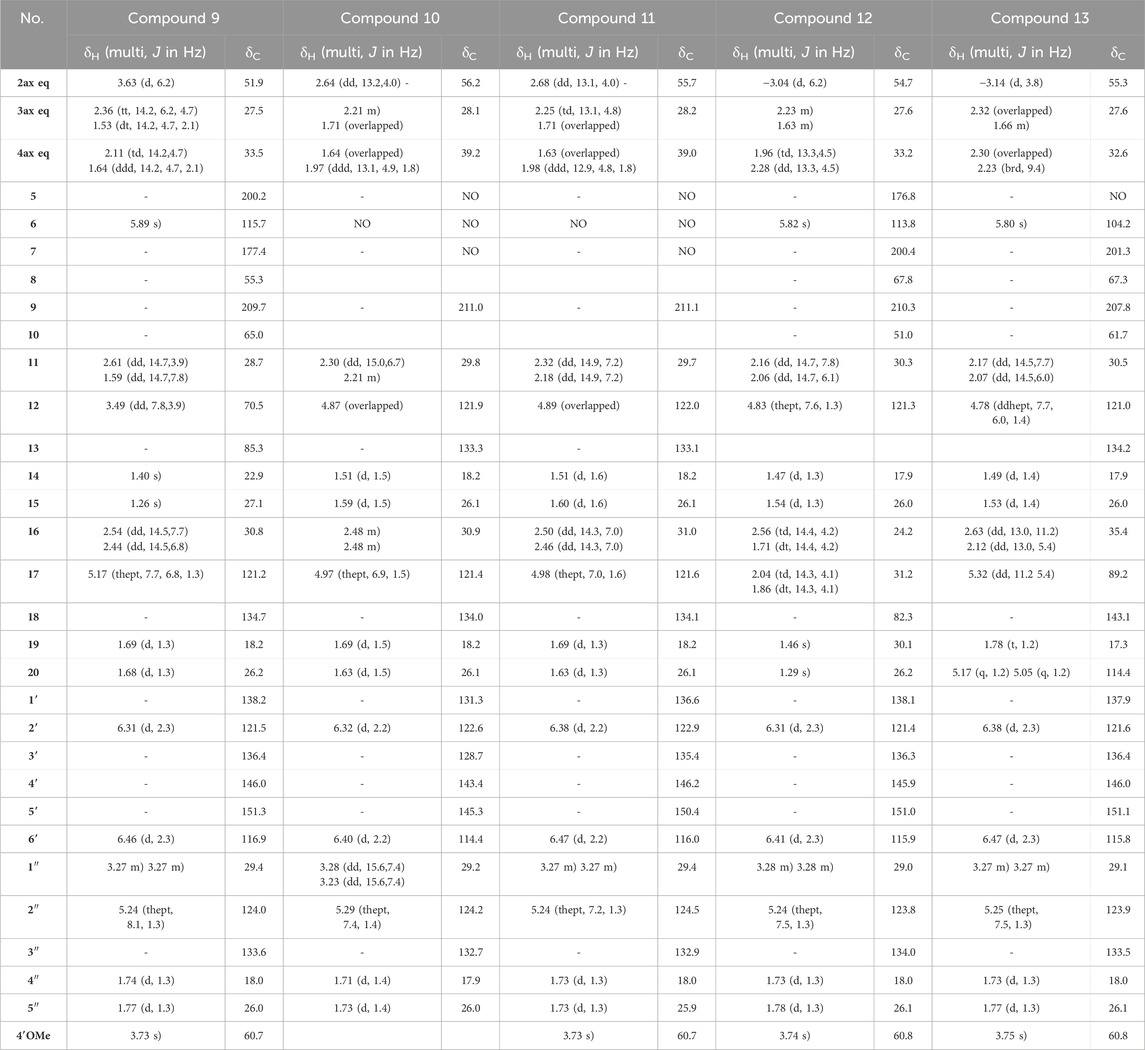
Table 2. 1H NMR (600 MHz) and13C NMR (151 MHz) data of compounds 9–13 in CD3OD. NA: signal not detected due to the keto-enol tautomerism in system C(5)-C(6)-C(7).
The HRMS and NMR data (Table 1) showed that compound 8 (Hymenotamayonin C) was the O-methyl derivative of 2: (2S,8R,10R)-2-(5-hydroxy-4-methoxy-3-(3-methylbut-2-en-1-yl)phenyl)-5-hydroxy-8,10-bis(3-methylbut-2-en-1-yl)bicyclo[3.3.1]non-6-ene-7,9-dione. Thus, the group in C-2 was the same as 1, 4, and 6: a 3-prenyl-4-methoxy-5-hydroxyphenyl group. It corresponded to one of the peaks at 4.9 min in Figure 3.
The NMR data of 9 (Table 2) displayed very close similarities to those of 4, for the same MF as indicated by the HRMS ion at m/z 509.2893 [M + H]+. As for the previous comparison between 6 and 1, the difference between 9 and 4 was the presence of a tetrahydropyran ring in 9 whereas 4 had a tetrahydrofuran ring in the same place. This was indicated by the chemical shift’s values of CH-12 (δC 70.5) and C-13 (δC 85.3), in 9 compared to those of 4 (δC 92.2 and δC 71.1, respectively). The ROESY from CH-11eq at δH 1.59 (dd, J = 14.7, 7.8 Hz) to CH-2 at δH 3.63 (d, J = 6.2 Hz), from CH-11ax at δH 2.61 (dd, J = 14.7, 3.9 Hz) to CH3-15 at δH 1.26 indicated the S configuration at C-12 (See Figure 6D). Thus, compound 9 was identified as (2S,8R,10R,12S)-12-hydroxy-2-(5-hydroxy, 4-methoxy-3-(3-methylbut-2-en-1-yl)phenyl)-13,13-dimethyl-10-(3-methylbut-2-en-1-yl)-7-oxotricyclo[7.3.1.07,8]dodec-5-ene-5,9-dione and named Hymenotamayonin J. Its absolute configuration was confirmed based on the comparison of the experimental and calculated ECD spectra (See Supplementary Figure S6) (see Table 2).
The NMR data of 10 were closely related to those of 2 and the HRMS data confirmed that both molecules had the same MF C30H39O5 (m/z 479.2791 [M + H]+, error −0.19 ppm). The main differences were the chemical shift value of CH-2 and its coupling constants. Whereas the chemical shift values of CH-2 were observed above δH 3.00 in the previous compounds it appeared shielded in 10 at δH 2.64. In the previous compounds, CH-2 was observed as a doublet with a coupling constant between 5.4 Hz and 6.4 Hz. In 10, CH-2 resonated as a doublet of doublet (J = 13.2, 4.0 Hz) indicating that it was, in a pseudo-axial configuration. This was confirmed by the ROESY correlation from CH-2 to CH-4ax at δH 1.64 (overlapped). Thus, compound 10 was identified as (2R,8R,10R)-2-(4,5-dihydroxy-3-(3-methylbut-2-en-1-yl)phenyl)-5-hydroxy-8,10-bis(3-methylbut-2-en-1-yl)bicyclo[3.3.1]non-6-ene-7,9-dione and named Hymenotamayonin B. It corresponded to one of the peaks at 4.95 min in Figure 3 (see Table 2).
The NMR and HRMS data of 11 indicated that it was the 4′-O-methyl derivative of 10, thus (2R,8R,10R)-2-(5-hydroxy-4-methoxy-3-(3-methylbut-2-en-1-yl)phenyl)-5-hydroxy-8,10-bis(3-methylbut-2-en-1-yl)bicyclo[3.3.1]non-6-ene-7,9-dione (Hymenotamayonin D). It corresponded to one of the peaks at 5.25 min in Figure 3. The HRMS of 12 gave an [M + H]+ at m/z 493.2747 calculated for an MF C31H41O5 (error −0.16 ppm) (see Table 2). The NMR data showed as in 6, that the bicyclic[3.3.1] core presented a 3-prenyl-4-methoxy-5-hydroxyphenyl substitution in a pseudo axial configuration in C-2 and a prenyl group in C-8. The oxymethine CH-17 observed in the tetrahydropyran ring of 6 was replaced by a methylene (δH 2.04 (td, J = 14.3, 4.1 Hz, CH-17ax), δH 1.86 (dt, J = 14.3, 4.1 Hz, CH-17eq) and δC 31.2). The HMBC correlations from CH-16ax (δH 2.56, td, J = 14.4, 4.2 Hz) to CH2-4 (δC 33.2) and C-10 (δC 51.0), from CH-17eq to C-10, from CH-16eq (δH 1.71, dt, J = 14.4, 4.2 Hz), CH3-19 (δH 1.46) and CH3-20 (δH 1.29) to quaternary oxygenated carbon C-18 (δC 82.3) confirmed that 12 was the 17-deoxy derivative of 6: (2S,8R,10R)-2-(5-hydroxy, 4-methoxy-3-(3-methylbut-2-en-1-yl)phenyl)-18,18-dimethyl-8-(3-methylbut-2-en-1-yl)-5-oxotricyclo[7.3.1.05,10]dodec-5-ene-7,9-dione (Hymenotamayonin F). It corresponded to one of the peaks at 5.45 min in Figure 3.
The MF of 13 was established as C31H38O5 by HRMS (m/z 491.2792 [M + H]+, error 0.08 ppm). As compounds 1, 6, 8, 11, and 12, the NMR data of 13 (Table 2) showed signals corresponding to a bicyclic[3.3.1] core with, in C-2, a 3-prenyl-4-methoxy-5-hydroxyphenyl in a pseudo axial configuration and, in C-8, a prenyl group. Similar to 1, a tetrahydrofuran ring was observed between C-10 and C-5, as indicated by the signals from the methylene CH2-16 (δH 2.63/δH 2.12) and the oxymethine CH-17 (δH 5.32). The HMBC correlations from the methylidene observed at δH 5.17 (q, J = 1.2 Hz, CH-20a) and δH 5.05 (p, J = 1.2 Hz, CH-20b) to the oxymethine CH-17 (δC 89.2), the vinylic carbon C-18 (δC 143.1) and the methyl CH3-19 (δC 17.3) enabled the identification of the structure shown in Figure 4. The configuration in C-17 was determined as R thanks to the ROESY correlations from CH-17 to CH-4eq (δH 2.23, brd, J = 9.4 Hz, the relative configuration of the other carbons were established as (2S,8R,10R). Thus, compound 13 was identified as (2S,8R,10R,17R)-2-(5-hydroxy, 4-methoxy-3-(3-methylbut-2-en-1-yl)phenyl)-8-(3-methylbut-2-en-1-yl)-17-(prop-1-en-2-yl-5-oxotricyclo[6.3.1.05,10]dodec-5-ene-7,9-dione and named as Hymenotamayonin E. It corresponded to one of the peaks at 5.5 min in Figure 3.
Compounds 1,2,4,6, and 8–13 make part of a very restricted group of NPs that contain an uncommon bicyclo[3.3.1]non-3-ene-2,9-dione core (Lin et al., 2018). To date, only three NPs with this core have been reported. The first compound ever reported in this class was acutifolin A (Q15410235), isolated from a Moraceae (Q156579) Brazilian medicinal plant B. acutifolium (Q15471077) (Takashima and Ohsaki, 2001). Later, tazettone A and tazettone B were isolated from Narcissus tazetta var. chinensis (Q25115128) (Fu et al., 2013), an Amaryllidaceae (Q155848). According to the Angiosperm (Q14832431) phylogeny grouping, N. tazzeta belongs to the Asparagales order (Q26229), while Brosimum acutifolium and H. punctata are comprised in the Fabids clade (Q2683213) but in different orders, Rosales (Q21895) and Malpighiales (Q21887), respectively. There are therefore no closer taxonomic relationships between these species that could explain common biosynthetic pathways (The Angiosperm Phylogeny Group, 2009).
From a biosynthetic point of view, the new compounds isolated from H. punctata may have been formed by rearrangement of an 8-prenylflavane as suggested for acutifolin A, tazettone A, and tazettone B (Figure 7). A similar rearrangement occurs also when catechin is subjected to basic conditions, forming catechinic acid (Sears et al., 1974; Ibrahim et al., 2007; Khiari et al., 2017). The extraction process was under neutral conditions, which is an indication of the authenticity of the compounds. The proposed biosynthesis pathway involves the presence of an electrophilic species that introduces the hydroxy group at position C-10 in acutifolin A, and tazettone A and B. We hypothesize that, in our case, this electrophilic species is a dimethylallyl diphosphate (DMAPP) unit, resulting in the prenylation of the position C-10 (Yazaki et al., 2009; Zhou et al., 2021). This assertion is plausible since we were able to isolate prenylated flavonoids (3, 5 and 7), which is an indication of their abundance in this plant.
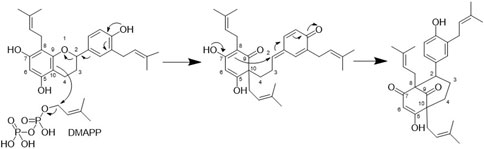
Figure 7. Proposed biosynthesis for the bicyclo[3.3.1]non-3-ene-2,9-dione core of compounds 1,2,4,6, and 8-13.
The Wnt-regulatory activity of all isolated compounds from H. punctata was evaluated using two different cancer cell lines representing TNB cancer, known for its reliance on Wnt signaling: BT-20 and HCC1395 cells. Additionally, Human Embryonic Kidney HEK293 cells were used to represent non-malignant cells. The results for the active compounds are shown in Table 3 (and Supplementary Figure S7).
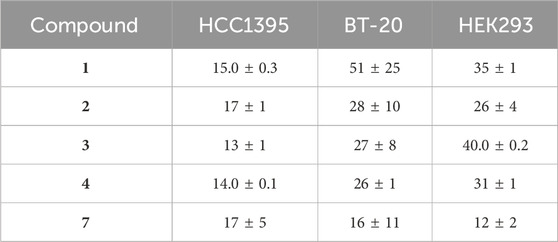
Table 3. Wnt-inhibition assay results IC50 (µM) for the isolated compounds one to four and 7.
The results demonstrated that the prenylated flavone 7, exhibited the highest potency against the HEK293 cell line, with an IC50 value of 12 µM. Other compounds exhibited significantly higher selectivity against HCC1395 cancer cells. For example, the other prenylated flavone 3 demonstrated the highest selectivity, followed by one of the newly discovered bicyclic compounds 4, with IC50 values of 13 µM and 14 μM, respectively. Notably, their potency against both BT-20 and HEK293 cells was nearly two-fold lower. In the case of the BT-20 cell line, seven displayed the highest activity, followed by 4, with IC50 values of 16 µM and 26 μM, respectively. It is worth noting that, in general, the prenylated flavones (3 and 7) had lower IC50 values compared to the novel bicyclic compounds (1, 2 and 4) in at least two out of the three different cell models. Additionally, for all compounds, the specificity for Wnt inhibition was controlled by the absence of effects of the compounds on co-transfected constitutively expressed Renilla luciferase, serving as a reporter of cytotoxic or other negative effects of the compounds on the cell wellbeing (Shaw et al., 2019a).
Over the past 2 decades, numerous studies have revealed that flavonoids and structurally related compounds possess inhibitory effects on human diseases by targeting various cellular signaling components (Amado et al., 2011; 2014). Flavonoids have been recognized as inhibitors of the Wnt pathway, with many of them shown to inhibit it by downregulating the levels of β-catenin (Fuentes et al., 2015). For instance, Apigenin (Q424567), the first flavonoid to be reported as a Wnt inhibitor, has been found to decrease β-catenin levels and promote cell cycle arrest in breast and colorectal cancer (Song et al., 2000; Landesman-Bollag et al., 2001; Amado et al., 2011). However, to date, there have been no reported findings of whether and how prenylation changes the potency of flavones towards the Wnt/β-catenin pathway. A few reports show the direct activity of prenylated isoflavones, such as 8-prenylgenistein by promoting osteogenesis (Zhang et al., 2018; Qiu et al., 2020). Our results clearly demonstrate that prenylated flavones, and similar analogs like the new bicyclic compounds, selectively disrupt the Wnt/β-catenin pathway, however with a potency only modestly improved from that reported for apigenin, from c. a. 30 μM down to 10–20 µM. This is also paralleled by other studies showing that structurally similar prenylated chalcones such as derricin and derricidin isolated from Lonchocarpus sericeus (Q15471182) reduce cell viability and induce cell cycle arrest in colorectal cancer HCT116 cells (Q28334584) through negative modulation of the Wnt/β-catenin pathway (Stevens, 2020).
The plant material was extracted in a Thermo Scientific Dionex ASE 350 Accelerated Solvent Extractor (Thermo Scientific™, Bremen, Germany). HPLC analyses were performed on an HP 1260 Infinity Agilent High-Performance Liquid Chromatography System equipped with a photodiode array detector (HPLC-PDA) (Agilent Technologies, Santa Clara, CA, United States) connected to an Evaporative Light Scattering Detector (ELSD, SEDERE, Orleans, France). The HPLC-based biactivity profiling was performed on an HP 1260 Agilent Infinity II High-Performance liquid chromatography equipped with a photodiode array detector (HPLC-PDA) and a sample collector (Agilent Technologies, Santa Clara, CA, United States). Flash chromatography was performed on a Sepacore instrument (Buchi, Flawil, Switzerland) composed of a pump module C-605, fraction collector model C-620, and UV spectrophotometer model C-640. The semi-preparative HPLC was performed using a Shimadzu system consisting of LC-20A module pumps, an SPD-20A UV/Vis detector, a 7725I Rheodyne® valve, and an FRC-10A fraction collector (Shimadzu, Kyoto, Japan). The system was controlled using the LabSolutions software from Shimadzu. NMR spectroscopic data were acquired on a Bruker Avance Neo 600 MHz spectrometer equipped with a QCI 5 mm Cryoprobe and a sampleJet automated extract changer (Bruker BioSpin, Rheinstetten, Germany). Chemical shifts are reported in parts per million (ppm, δ), and coupling constants are reported in Hertz (Hz, J). The residual CD3OD/CDCl3 signals (δH 3.31/7.26, δC 49.8/77.16) were used as internal standards for 1H and 13C, respectively. Comprehensive assignments were based on 2D-NMR spectroscopy techniques such as COSY, edited-HSQC, HMBC, and ROESY. Electronic Circular Dichroism (ECD) measurements were measured using a JASCO J-815 spectrometer (Loveland, CO, United States) in methanol, utilizing a 1 cm cell. The scan speed was set at 200 nm/min in continuous mode, scanning from 400 nm to 165 nm. Optical rotations were determined in methanol using a JASCO P-1030 polarimeter (Loveland, CO, United States) with a 1 mL, 10 cm tube.
PFL supplied the dried, grounded leaves of H. punctata (Phyllanthaceae) (identifier V114372GP-01). This plant was part of the PFL collection registered with the European Commission on 1 April 2020, under accession number 03-FR-2020. This official registration acknowledges the collection’s compliance with legal standards for access and management. It signifies that the PFL collection adheres to the European Access and Benefit Sharing Regulation criteria, which enforces the Nagoya Protocol’s directives at the European level. These directives pertain to accessing genetic resources and justly sharing the benefits derived from their use (Nagoya Protocol, 2011).
A mass of 55 g was extracted in a 100 mL pressure-resistant stainless steel extraction cell using an ASE system. At the bottom and the top of the cell, a cellulose filter (Dionex™ 100, Thermo Scientific™, Bremen, Germany) was added to prevent solid particles from reaching the internal system. The cell was extracted with 60% rinse volume under pressure at 40°C, three cycles, and a static time of 5 min per cycle. The sample was extracted successively with HPLC quality hexane (Fisher Chemicals, Reinach, Switzerland), ethyl acetate (Fisher Chemicals, Reinach, Switzerland), and methanol (Fisher Chemicals, Reinach, Switzerland). The resulting extracts were dried at 35°C under vacuum in a rotary evaporator to yield 0.32 g of hexanic extract (HPH), 1.13 g of ethyl acetate extract (HPE), and 2.60 g of methanolic extract (HPM).
A mass of 10 mg of HPE was dissolved in 200 μL of DMSO (molecular biology grade, Sigma, St Louis, United States) and then separated on an X-Bridge C18 column (250 × 10 mm i. d., 5 μm) equipped with a Waters C18 precolumn cartridge holder (5 × 10 mm i. d., 5 μm). The flow rate was set to 3.700 mL/min, and a binary solvent system consisting of 0.1% aqueous formic acid [A] and 0.1% formic acid in ACN [B] (Fisher Chemicals, Reinach, Switzerland) was used. A gradient (v/v) of [B] was employed as follows [t(min), %B]: 0.00, 2; 2.00, 2; 6.00, 50; 30.00, 100; 34.0, 100; followed by re-equilibration steps (36.00, 2; 40.00, 2). The collection was done at a fixed fraction volume of 1.600 mL per well (96-W 2 mL Deep Well Plate, Scientific Specialties Inc., California, United States). A 100 µL aliquot of each well was pooled (row-wise and column-wise) in a preweighted vial and then dried under an N2 flux. After weighing, each pooled sample was reconstituted in DMSO at 5 mg/mL.
The HPE (1.1 g) was separated on a Puriflash C18-HP column (200 × 30 mm I.D., 15 μm, Interchim, Montlucon, France) on a Buchi system. The flow rate was set to 60 mL/min, and a binary solvent system consisting of 0.1% aqueous formic acid [A] and 0.1% formic acid in acetonitrile [B] was used. A gradient (v/v) of [B] was employed as follows [t(min), %B]: 0.00, 2; 3.70, 10; 73.50, 65; 84.00, 100; 94.00, 100. The collection was done by a fixed fraction volume of 50 mL per tube. After combining tubes based on the 254 nm and 280 nm UV traces, a total of 24 fractions were obtained. This separation yielded 31 mg of 1 (RT 74.0 min), 33.5 mg of 4 (RT 78.0 min), and 48.5 mg of 8 (RT 83.0 min). The fractions collected at RT 76.0 min (F13, 19.8 mg) and RT 81.0 min (F15, 23.0 mg) were separated in an X-Bridge C18 column (250 × 10 mm i. d., 5 μm) equipped with a Waters C18 precolumn cartridge holder (5 × 10 mm i. d., 5 μm); solvent system ACN B) and H2O A), both containing 0.1% FA, in an isocratic run 50% ACN, to give 2 (1.0 mg, RT 38.5 min), and 3 (0.6 mg, RT 42.0 min); and 6 (0.5 mg, RT 45.0 min) respectively. The following separations were done using the same solvent system and column but different isocratic compositions. The fraction F17 (RT 85.0 min, 48.4 mg) was separated using an isocratic of 55% ACN to give 5 (1.0 mg, RT 36.0 min), 8 (1.7 mg, RT 38.0 min), 9 (2.2 mg, RT 41.0 min) and 10 (2.3 mg, RT 43.5 min). The fractions F18 (RT 87.5 min, 25.7 mg), and F19 (RT 88.0 min, 26.9 mg) were separated using an isocratic of 60% ACN to give 7 (0.4 mg, RT 26 min), and 11 (1.7 mg, RT 41.0 min). Finally, the fraction F20 (RT 89.0 min, 27.7 mg) was separated using an isocratic of 60% ACN to give 12 (0.4 mg, RT 41.0 min), and 13 (0.5 mg, RT 43.0 min). All the fractions were introduced in the system using a Dry-load injection (Queiroz et al., 2019).
Compound 1 (Hymenotamayonin G): (2S,8R,10R,17R)-2-(5-hydroxy, 4-methoxy-3-(3-methylbut-2-en-1-yl)phenyl)-12-(2-hydroxypropan-2-yl)-8-(3-methylbut-2-en-1-yl)-5-oxotricyclo[6.3.1.05,10]dodec-5-ene-7,9-dione. Amorphous pale-yellow powder,
1H NMR (CD3OD, 600 MHz) δ 1.21 (3H, s, H3-20), 1.34 (3H, s, H3-19), 1.48 (3H, d, J = 1.2 Hz, H3-14), 1.50 (3H, d, J = 1.2 Hz, H3-15), 1.64 (1H, overlapped, H-3eq), 1.73 (3H, d, J = 1.3 Hz, H3-4″), 1.77 (3H, d, J = 1.3 Hz, H3-5″), 1.91 (1H, dd, J = 12.9, 5.5 Hz, H-16b), 2.05 (1H, dd, J = 14.3, 6.0 Hz, H-11b), 2.16 (1H, overlapped, H-4eq), 2.17 (1H, dd, J = 14.3, 7.9 Hz, H-11a), 2.28 (2H, m, H-3ax, H-4ax), 2.82 (1H, t, J = 12.9, 10.9 Hz, H-16a), 3.12 (1H, d, J = 5.4 Hz, H-2), 3.28 (2H, m, H2-1″), 3.75 (3H, s, 4′-OCH3), 4.72 (1H, dd, J = 10.9, 5.5 Hz, H-17), 4.76 (1H, thept, J = 7.9, 6.0, 1.2 Hz, H-12), 5.24 (1H, thept, J = 6.7, 1.3 Hz, H-2″), 5.80 (1H, s, H-6), 6.38 (1H, d, J = 2.3 Hz, H-2′), 6.47 (1H, d, J = 2.3 Hz, H-6′); 13C NMR (CD3OD, 151 MHz) δ 17.9 (CH3-4″), 18.0 (CH3-14), 25.4 (CH3-20), 26.0 (CH3-5″), 26.1 (CH3-15), 26.5 (CH3-19), 27.5 (CH2-3), 29.1 (CH2-1″), 30.4 (CH2-11), 30.8 (CH2-16), 33.1 (CH2-4), 55.2 (CH-2), 60.8 (4′-OCH3), 61.7 (C-10), 67.2 (C-8), 71.1 (C-18), 92.8 (CH-17), 104.3 (CH-6), 115.8 (CH-6′), 121.1 (CH-12), 121.6 (CH-2′), 123.9 (CH-2″), 133.6 (C-3″), 134.1 (C-13), 136.3 (C-3′), 137.9 (C-1′), 146.0 (C-4′), 151.0 (C-5′), 181.2 (C-5), 201.3 (C-7), 207.7 (C-9). Supplementary Figures S8–S13. NP0332440.
1H NMR (CDCl3, 600 MHz) δ 1.25 (3H, s, H3-20), 1.38 (3H, s, H3-19), 1.51 (3H, s, H3-14), 1.55 (3H, s, H3-15), 1.67 (1H, overlapped, H-3eq), 1.73 (3H, s, H3-4″), 1.77 (3H, s, H3-5″), 1.85 (1H, dd, J = 13.0, 5.3 Hz, H-16b), 2.04 (1H, dd, J = 13.6, 4.9 Hz, H-4eq), 2.15 (1H, dd, J = 15.1, 5.7 Hz, H-11b), 2.25 (1H, td, J = 13.6, 4.9 Hz, H-4ax), 2.25(1H, dd, J = 15.1, 6.1 Hz, H-11a), 2.33 (1H, tt, J = 13.6, 6.1, 4.9 Hz, H-3ax), 2.83 (1H, t, J = 13.0, 11.1 Hz, H-16a), 3.24 (1H, d, J = 6.1 Hz, H-2), 3.30 (2H, d, J = 7.3 Hz, H2-1″), 3.77 (3H, s, 4′OCH3), 4.57 (1H, dd, J = 11.1, 5.3 Hz, H-17), 4.77 (1H, t, J = 6.1, 5.7 Hz, H-12), 5.23 (1H, t, J = 7.3 Hz, H-2″), 5.86 (1H, s, H-6), 6.41 (1H, d, J = 2.3 Hz, H-2′), 6.53 (1H, d, J = 2.3 Hz, H-6′); 13C NMR (CDCl3, 151 MHz) δ 17.9 (CH3-4″), 18.1 (CH3-14), 24.4 (CH3-20), 26.0 (CH3-5″, CH3-15), 26.6 (CH2-3), 27.0 (CH3-19), 28.3 (CH2-1″), 29.3 (CH2-11), 30.4 (CH2-16), 32.1 (CH2-4), 53.8 (CH-2), 60.1 (C-10), 61.3 (4′-OCH3), 66.0 (C-8), 70.9 (C-18), 91.0 (CH-17), 104.4 (CH-6), 113.1 (CH-6′), 119.7 (CH-12), 121.9 (CH-2″), 122.3 (CH-2″), 133.4 (C-3″), 133.7 (C-13), 134.5 (C-3′), 137.5 (C-1′), 144.2 (C-4′), 148.7 (C-5′), 177.7 (C-5), 198.8 (C-7) 206.4 (C-9). HRESIMS m/z 509.2894 [M + H]+ (calculated for C31H41O6, error −0.65 ppm); MS/MS CCMSLIB00011431737.
InChI = 1S/C31H40O6/c1-182)8-9-20-14-21(15-23(32)27(20)36-7)22-11-12-30-17-26(29(5,6)35)37-25(30)16-24(33)31(22,28(30)34)13-10-193)4/h8,10,14-16,22,26,32,35H,9,11-13,17H2,1-7H3/t22-,26+,30+,31+/m0/s1.
Compound 2 (Hymenotamayonin A): (2S,8R,10R)-2-(4,5-dihydroxy-3-(3-methylbut-2-en-1-yl)phenyl)-5-hydroxy-8,10-bis(3-methylbut-2-en-1-yl)bicyclo[3.3.1]non-6-ene-7,9-dione. Amorphous pale-yellow powder, [α]D20 -2 (c 0.001, MeOH); UV (c 0.001, MeOH) λmax 213, 281 nm.
1H NMR (CD3OD, 600 MHz) δ 1.47 (3H, d, J = 1.5 Hz, H3-14), 1.55 (3H, d, J = 1.5 Hz, H3-15), 1.55 (1H, overlapped, H-3eq), 1.68 (3H, d, J = 1.5 Hz, H3-20), 1.70 (3H, d, J = 1.5 Hz, H3-19), 1.72 (3H, d, J = 1.4 Hz, H3-4″), 1.76 (3H, d, J = 1.4 Hz, H3-5″), 1.79 (1H, dd, J = 13.8, 5.2 Hz, H-4eq), 2.09 (2H, m, H2-11), 2.17 (1H, td, J = 13.8, 4.9 Hz, H-4ax), 2.34 (1H, tt, J = 14.3, 5.8 Hz, H-3ax), 2.47 (1H, dd, J = 14.5, 6.9 Hz, H-16b), 2.57 (1H, dd, J = 14.5, 6.9 Hz, H-16a), 3.07 (1H, d, J = 6.4 Hz, H-2eq), 3.25 (2H, m, H2-1″), 4.87 (1H, overlapped, H-12), 5.19 (1H, thept, J = 6.9, 1.5 Hz, H-17), 5.30 (1H, thept, J = 7.4, 1.4 Hz, H-2″), 6.28 (1H, d, J = 2.2 Hz, H-2′), 6.38 (1H, d, J = 2.2 Hz, H-6′); 13C NMR (CD3OD, 151 MHz) δ 17.9 (CH3-4″), 18.0 (CH3-14), 18.2 (CH3-19), 26.0 (CH3-5″), 26.1 (CH3-15), 26.1 (CH3-20), 28.1 (CH2-3), 29.2 (CH2-1″), 30.3 (CH2-11), 31.1 (CH2-16), 34.7 (CH2-4), 53.8 (CH-2), 61.6 (C-10), 64.7 (C-8), 114.8 (CH-6′), 121.4 (CH-2′), 121.9 (CH-17), 122.0 (CH-12), 123.9 (CH-2″), 129.4 (C-3′), 133.2 (C-3″, C-13), 133.4 (C-1′), 133.9 (C-18), 143.0 (C-4′), 145.8 (C-5′), 211.5 (C-9). Supplementary Figures S14–S19. NP0332433. HRESIMS m/z 479.2793 [M + H]+ (calculated for C30H39O5, error 0.21 ppm); MS/MS CCMSLIB00011431729.
InChI = 1S/C30H38O5/c1-18(2)7-8-21-15-22(16-24(31)27(21)34)23-11-13-29(12-9-19(3)4)25(32)17-26(33)30(23,28(29)35)14-10-20(5)6/h7,9-10,15-17,23,31-32,34H,8,11-14H2,1-6H3/t23-,29-,30+/m0/s1.
Compound 3: 3′,8-diprenylapigenin (Dat et al., 2010). Amorphous white powder, [α]D20 -14 (c 0.0006, MeOH); UV (c 0.0006, MeOH) λmax 203, 276, 349 nm.
1H NMR (CD3OD, 600 MHz) δ 1.68 (3H, s, H3-5″), 1.74 (3H, s, H3-10′), 1.78 (3H, s, H3-11′), 1.81 (3H, s, H3-4″), 3.37 (2H, d, J = 7.4 Hz, H2-7′), 3.53 (2H, d, J = 7.2 Hz, H2-1″), 5.29 (1H, t, J = 7.2 Hz, H-2″), 5.36 (1H, t, J = 7.4 Hz, H-8′), 6.26 (1H, s, H-6), 6.57 (1H, s, H-3), 6.90 (1H, d, J = 8.3 Hz, H-5′), 7.69 (1H, dd, J = 8.3, 2.9 Hz, H-6′), 7.76 (1H, d, J = 2.6 Hz, H-2′); 13C NMR (CD3OD, 151 MHz) δ 17.9 (CH3-10′), 18.2 (CH3-4″), 22.6 (CH2-1″), 25.9 (CH3-11′), 26.0 (CH3-5″), 29.0 (CH2-7′), 99.6 (CH-6), 103.3 (CH-3), 105.2 (C-10), 108.2 (C-8), 116.2 (CH-5′), 123.0 (CH-8′), 123.4 (C-1′), 123.6 (CH-2″), 126.9 (CH-6′), 128.8 (CH-2′), 130.3 (C-3′), 132.7 (C-3″), 134.2 (C-9′), 156.5 (C-9), 160.5 (C-4′), 160.8 (C-5), 163.4 (C-7), 166.5 (C-2), 184.3 (C-4). Supplementary Figures S20–S25 NP0332434. HRESIMS m/z 407.1853 [M + H]+ (calculated for C25H39O5, error 0.14 ppm); MS/MS CCMSLIB00011431727.
InChI = 1S/C25H26O5/c1-142)5-7-16-11-17(8-10-19(16)26)23-13-22(29)24-21(28)12-20(27)18(25(24)30-23)9-6-153)4/h5-6,8,10-13,26-28H,7,9H2,1-4H3.
Compound 4 (Hymenotamayonin H): (2S,8R,10R,12S)-2-(5-hydroxy, 4-methoxy-3-(3-methylbut-2-en-1-yl)phenyl)-17-(2-hydroxypropan-2-yl)-10-(3-methylbut-2-en-1-yl-7-oxotricyclo[6.3.1.07,8]dodec-6-ene-5,9-dione. Amorphous pale yellow powder, [α]D20 + 3 (c 0.03, MeOH); UV (c 0.03, MeOH) λmax 214, 269 nm.
1H NMR (CD3OD, 600 MHz) δ 1.10 (3H, s, H3-15), 1.28 (3H, s, H3-14), 1.63 (3H, s, H3-20), 1.67 (1H, overlapped, H-3eq), 1.68 (3H, s, H-319), 1.73 (3H, s, H3-4″), 1.74 (1H, overlapped, H-11b), 1.76 (3H, s, H3-5″), 1.78 (1H, overlapped, H-4eq), 2.08 (1H, td, J = 14.1, 4.8 Hz, H-4ax), 2.36 (1H, tt, J = 15.0, 14.1, 6.4, 5.0 Hz, H-3ax), 2.43 (1H, dd, J = 14.5, 6.9 Hz, H-16b), 2.53 (2H, m, H-11a, H-16a), 3.28 (2H, d, J = 7.4 Hz, H2-1″), 3.40 (1H, d, J = 6.4 Hz, H-2), 3.74 (3H, s, 4′-OCH3), 4.62 (1H, dd, J = 11.1, 5.4 Hz, H-12), 5.07 (1H, brt, J = 7.3 Hz, H-17), 5.23 (2H, brt, J = 7.4 Hz, H-2″), 5.81 (1H, s, H-6), 6.43 (1H, d, J = 2.3 Hz, H-2′), 6.53 (1H, d, J = 2.3 Hz, H-6′); 13C NMR (CD3OD, 151 MHz) δ 18.0 (CH3-4″), 18.2 (CH3-19), 25.2 (CH3-15), 26.0 (CH3-5″), 26.1 (CH3-20), 26.3 (CH3-14), 27.8 (CH2-3), 28.7 (CH2-11), 29.2 (CH2-1″), 31.1 (CH2-16), 34.9 (CH2-4), 49.4 (CH-2), 60.8 (4′-OCH3), 64.4 (C-10), 64.7 (C-8), 71.1 (C-13), 92.2 (CH-12), 104.7 (CH-6), 115.9 (CH-6′), 121.1 (CH-17), 121.3 (CH-2′), 123.8 (CH-2″), 133.6 (C-3″), 134.5 (C-18), 136.7 (C-3′), 138.1 (C-1′), 146.1 (C-4′), 151.4 (C-5′), 182.1 (C-7), 200.7 (C-5), 208.0 (C-9). Supplementary Figures S26–S31. NP0332430. HRESIMS m/z 509.2894 [M + H]+ (calculated for C31H41O6, error −0.65 ppm); MS/MS CCMSLIB00011431736.
InChI = 1S/C31H40O6/c1-18(2)8-9-20-14-21(15-23(32)27(20)36-7)22-11-13-30(12-10-19(3)4)24(33)16-25-31(22,28(30)34)17-26(37-25)29(5,6)35/h8,10,14-16,22,26,32,35H,9,11-13,17H2,1-7H3/t22-,26-,30-,31+/m0/s1.
Compound 5: 6,8-diprenylapigenin (Lin et al., 2017). Amorphous white powder, [α]D20 -15 (c 0.001, MeOH); UV (c 0.001, MeOH) λmax 207, 281, 337 nm.
1H NMR (CD3OD, 600 MHz) δ 1.68 (3H, d, J = 1.4 Hz, H3-5″), 1.70 (3H, d, J = 1.5 Hz, H3-5‴), 1.80 (3H, d, J = 1.4 Hz, H3-4″), 1.84 (3H, d, J = 1.5 Hz, H3-4‴), 3.39 (2H, d, J = 7.2 Hz, H2-1″), 3.60 (2H, d, J = 6.6 Hz, H2-1‴), 5.21 (2H, m, H-2″, H-2‴), 6.60 (1H, s, H-3), 6.93 (2H, d, J = 8.8 Hz, H-3′, H-5′), 7.85 (2H, d, J = 8.8 Hz, H-2′, H-6′); 13C NMR (CD3OD, 151 MHz) δ 18.0 (CH3-4″), 18.3 (CH3-4‴), 22.5 (CH2-1″), 23.0 (CH2-1‴), 25.9 (CH3-5‴), 26.0 (CH3-5″), 103.6 (CH-3), 105.5 (C-10), 108.2 (C-8), 113.3 (C-6), 117.0 (CH-3′, CH-5′), 123.2 (CH-2″), 123.7 (C-1′), 123.9 (CH-2‴), 129.5 (CH-2′, CH-6′), 132.8 (C-3″), 133.0 (C-3‴), 154.6 (C-9), 157.9 (C-5), 160.8 (C-7), 162.7 (C-4′), 166.1 (C-2), 184.4 (C-4). Supplementary Figures S32–S37. NP0332439. HRESIMS m/z 407.1853 [M + H]+ (calculated for C25H27O5, error 0.14 ppm); MS/MS CCMSLIB00011431739.
InChI = 1S/C25H26O5/c1-14(2)5-11-18-23(28)19(12-6-15(3)4)25-22(24(18)29)20(27)13-21(30-25)16-7-9-17(26)10-8-16/h5-10,13,26,28-29H,11-12H2,1-4H3.
Compound 6 (Hymenotamayonin I): (2S,8R,10R,17R)-17-hydroxy-2-(5-hydroxy, 4-methoxy-3-(3-methylbut-2-en-1-yl)phenyl)-18,18-dimethyl-8-(3-methylbut-2-en-1-yl)-5-oxotricyclo[7.3.1.05,10]dodec-5-ene-7,9-dione. Amorphous pale yellow powder, [α]D20 + 18 (c 0.0005, MeOH); UV (c 0.0005, MeOH) λmax 207, 273 nm.
1H NMR (CD3OD, 600 MHz) δ 1.26 (3H, s, H3-20), 1.44 (3H, s, H3-19), 1.47 (3H, d, J = 1.4 Hz, H3-14), 1.53 (3H, d, J = 1.4 Hz, H3-15), 1.55 (1H, brd, J = 10.8 Hz, H-3eq), 1.74 (1H, dd, J = 14.9, 5.3 Hz, H-16b), 1.74 (3H, d, J = 1.3 Hz, H3-4″), 1.79 (3H, d, J = 1.3 Hz, H3-5″), 2.09 (1H, td, J = 14.5, 4.6 Hz, H-4ax), 2.07 (1H, overlapped, H-11b), 2.15 (1H, dd, J = 14.7, 7.8 Hz, H-11a), 2.26 (1H, tt, J = 14.2, 5.6 Hz, H-3ax), 2.63 (1H, dd, J = 14.5, 4.9 Hz, H-4eq), 2.94 (1H, dd, J = 14.9, 3.9 Hz, H-16a), 3.03 (1H, d, J = 6.2 Hz, H-2eq), 3.28 (2H, d, J = 7.5 Hz, H2-1″), 3.75 (3H, s, 4′-OCH3), 3.79 (1H, t, J = 5.3, 3.9 Hz, H-17), 4.81 (1H, thept, J = 7.8, 1.4 Hz, H-12), 5.25 (1H, thept, J = 7.5, 1.3 Hz, H-2″), 5.88 (1H, s, H-6), 6.31 (1H, d, J = 2.3 Hz, H-2′), 6.42 (1H, d, J = 2.3 Hz, H-6′); 13C NMR (CD3OD, 151 MHz) δ 17.9 (CH3-4″), 18.0 (CH3-14), 24.0 (CH3-19), 26.1 (CH3-5″), 26.1 (CH3-15), 26.9 (CH3-20), 27.3 (CH2-3), 29.0 (CH2-1″), 30.5 (CH2-11), 31.5 (CH2-16), 36.2 (CH2-4), 51.6 (C-10), 55.0 (CH-2), 60.8 (4′-OCH3), 67.5 (C-8), 69.9 (CH-17), 84.8 (C-18), 114.7 (CH-6), 116.1 (CH-6′), 121.2 (CH-12), 121.4 (CH-2′), 123.8 (CH-2″), 133.8 (C-3″), 134.0 (C-13), 136.2 (C-3′), 138.1 (C-1′), 145.9 (C-4′), 151.0 (C-5′), 176.5 (C-5), 200.7 (C-7), 209.7 (C-9). Supplementary Figures S38–43. NP0332438. HRESIMS m/z 509.2894 [M + H]+ (calculated for C31H41O6, error −0.65 ppm); MS/MS CCMSLIB00011431735.
InChI = 1S/C31H40O6/c1-18(2)8-9-20-14-21(15-23(32)27(20)36-7)22-11-12-30-17-25(34)29(5,6)37-26(30)16-24(33)31(22,28(30)35)13-10-19(3)4/h8,10,14-16,22,25,32,34H,9,11-13,17H2,1-7H3/t22-,25+,30+,31+/m0/s1.
Compound 7: 3′,6-diprenyl-diprenylapigenin (Fukai et al., 1991). Amorphous white powder, [α]D20 -23 (c 0.0004, MeOH); UV (c 0.0004, MeOH) λmax 206, 275, 343 nm.
1H NMR (CD3OD, 600 MHz) δ 1.67 (3H, d, J = 1.4 Hz, H3-5″), 1.76 (3H, d, J = 1.3 Hz, H3-10′), 1.79 (6H, d, J = 1.4 Hz, H3-4″, H3-11′), 3.32 (2H, overlapped, H2-1″), 3.36 (2H, d, J = 7.4 Hz, H2-7′), 5.24 (1H, thept, J = 7.0, 1.4 Hz, H-2″), 5.36 (1H, thept, J = 7.4, 1.3 Hz, H-8′), 6.48 (1H, s, H-8), 6.55 (1H, s, H-3), 6.89 (1H, d, J = 9.0 Hz, H-3′), 7.67 (2H, m, H-2′, H-6′); 13C NMR (CD3OD, 151 MHz) δ 17.9 (CH3-4″, CH3-10′), 22.3 (CH2-1″), 25.8 (CH3-11′), 26.0 (CH3-5″), 29.2 (CH2-7′), 94.1 (CH-8), 103.6 (CH-3), 105.1 (C-10), 113.1 (C-6), 116.2 (CH-3′), 123.2 (CH-8′, C-1′), 123.4 (CH-2″), 126.8 (CH-2′), 128.9 (CH-6′), 130.4 (C-5′), 132.2 (C-3″), 134.0 (C-9′), 157.4 (C-9), 159.9 (C-5), 160.5 (C-4′), 163.7 (C-7), 166.4 (C-2), 184.1 (C-4). Supplementary Figures S44–48; NP0332428. HRESIMS m/z 407.1853 [M + H]+ (calculated for C25H27O5, error 0.22 ppm); MS/MS CCMSLIB00011431728.
InChI = 1S/C25H26O5/c1-142)5-7-16-11-17(8-10-19(16)26)22-13-21(28)24-23(30-22)12-20(27)18(25(24)29)9-6-153)4/h5-6,8,10-13,26-27,29H,7,9H2,1-4H3.
Compound 8 (Hymenotamayonin C): (2S,8R,10R)-2-(5-hydroxy-4-methoxy-3-(3-methylbut-2-en-1-yl)phenyl)-5-hydroxy-8,10-bis(3-methylbut-2-en-1-yl)bicyclo[3.3.1]non-6-ene-7,9-dione. Amorphous orange powder, [α]D20 -14 (c 0.001, MeOH); UV (c 0.001, MeOH) λmax 219, 271 nm.
1H NMR (CD3OD, 600 MHz) δ 1.46 (3H, d, J = 1.5 Hz, H3-14), 1.55 (3H, d, J = 1.5 Hz, H3-15), 1.56 (1H, overlapped, H-3eq), 1.68 (3H, d, J = 1.4 Hz, H3-19), 1.70 (3H, d, J = 1.4 Hz, H3-20), 1.74 (3H, d, J = 1.4 Hz, H3-4″), 1.76 (3H, d, J = 1.4 Hz, H3-5″), 1.79 (1H, overlapped, H-4eq), 2.08 (1H, dd, J = 14.2, 5.2 Hz, H-11b), 2.15 (1H, overlapped, H-11a), 2.17 (1H, td, J = 13.8, 4.7 Hz, H-4ax), 2.31 (1H, tt, J = 13.8, 6.4 Hz, H-3ax), 2.49 (1H, dd, J = 14.5, 7.1 Hz, H-16b), 2.58 (1H, dd, J = 14.5, 7.1 Hz, H-16a), 3.12 (1H, d, J = 6.4 Hz, H-2eq), 3.27 (2H, m, H2-1″), 3.74 (3H, s, 4′-OCH3), 4.87 (1H, overlapped, H-12), 5.19 (1H, thept, J = 7.1, 1.5 Hz, H-17), 5.25 (1H, thept, J = 7.5, 1.4 Hz, 2″), 6.34 (1H, d, J = 2.3 Hz, H-2′), 6.44 (1H, d, J = 2.3 Hz, H-6′); 13C NMR (CD3OD, 151 MHz) δ 18.0 (CH3-4″, CH3-14), 18.2 (CH3-19), 26.0 (CH3-5″), 26.1 (CH3-15), 26.2 (CH3-20), 27.8 (CH2-3), 29.3 (CH2-1″), 30.1 (CH2-11), 30.9 (CH2-16), 34.5 (CH2-4), 53.6 (CH-2), 60.8 (4′-OCH3), 116.2 (CH-6′), 121.4 (CH-12, CH-17), 121.6 (CH-2′), 124.0 (CH-2″), 133.4 (C-3″), 133.8 (C-13), 134.4 (C-18), 136.2 (C-3′), 138.2 (C-1′), 145.9 (C-4′), 150.9 (C-5′), 210.4 (C-9). Supplementary Figures S49–54. NP0332429. HRESIMS m/z 493.2894 [M + H]+ (calculated for C31H41O5, error −0.34 ppm); MS/MS CCMSLIB00011431733.
InChI = 1S/C31H40O5/c1-19(2)8-9-22-16-23(17-25(32)28(22)36-7)24-12-14-30(13-10-20(3)4)26(33)18-27(34)31(24,29(30)35)15-11-21(5)6/h8,10-11,16-18,24,32-33H,9,12-15H2,1-7H3/t24-,30-,31+/m0/s1.
Compound 9 (Hymenotamayonin J): (2S,8R,10R,12S)-12-hydroxy-2-(5-hydroxy, 4-methoxy-3-(3-methylbut-2-en-1-yl)phenyl)-13,13-dimethyl-10-(3-methylbut-2-en-1-yl)-7-oxotricyclo[7.3.1.07,8]dodec-5-ene-5,9-dione. Amorphous orange powder, [α]D20 -20 (c 0.002, MeOH); UV (c 0.002, MeOH) λmax 217, 276, 344 nm.
1H NMR (CD3OD, 600 MHz) δ 1.46 (3H, d, J = 1.5 Hz, H3-14), 1.55 (3H, d, J = 1.5 Hz, H3-15), 1.56 (1H, overlapped, H-3eq), 1.68 (3H, d, J = 1.4 Hz, H3-19), 1.70 (3H, d, J = 1.4 Hz, H3-20), 1.74 (3H, d, J = 1.4 Hz, H3-4″), 1.76 (3H, d, J = 1.4 Hz, H3-5″), 1.79 (1H, overlapped, H-4eq), 2.08 (1H, dd, J = 14.2, 5.2 Hz, H-11b), 2.15 (1H, overlapped, H-11a), 2.17 (1H, td, J = 13.8, 4.7 Hz, H-4ax), 2.31 (1H, tt, J = 13.8, 6.4 Hz, H-3ax), 2.49 (1H, dd, J = 14.5, 7.1 Hz, H-16b), 2.58 (1H, dd, J = 14.5, 7.1 Hz, H-16a), 3.12 (1H, d, J = 6.4 Hz, H-2eq), 3.27 (2H, m, H2-1″), 3.74 (3H, s, 4′-OCH3), 4.87 (1H, overlapped, H-12), 5.19 (1H, thept, J = 7.1, 1.5 Hz, H-17), 5.25 (1H, thept, J = 7.5, 1.4 Hz, 2″), 6.34 (1H, d, J = 2.3 Hz, H-2′), 6.44 (1H, d, J = 2.3 Hz, H-6′); 13C NMR (CD3OD, 151 MHz) δ 18.0 (CH3-4″, CH3-14), 18.2 (CH3-19), 26.0 (CH3-5″), 26.1 (CH3-15), 26.2 (CH3-20), 27.8 (CH2-3), 29.3 (CH2-1″), 30.1 (CH2-11), 30.9 (CH2-16), 34.5 (CH2-4), 53.6 (CH-2), 60.8 (4′-OCH3), 116.2 (CH-6′), 121.4 (CH-12, CH-17), 121.6 (CH-2′), 124.0 (CH-2″), 133.4 (C-3″), 133.8 (C-13), 134.4 (C-18), 136.2 (C-3′), 138.2 (C-1′), 145.9 (C-4′), 150.9 (C-5′), 210.4 (C-9). Supplementary Figures S55–S60. NP0332431. HRESIMS m/z 509.2893 [M + H]+ (calculated for C31H41O6, error −0.83 ppm); MS/MS CCMSLIB00011431738.
InChI = 1S/C31H40O6/c1-18(2)8-9-20-14-21(15-23(32)27(20)36-7)22-11-13-30(12-10-19(3)4)24(33)16-26-31(22,28(30)35)17-25(34)29(5,6)37-26/h8,10,14-16,22,25,32,34H,9,11-13,17H2,1-7H3/t22-,25-,30-,31+/m0/s1.
Compound 10 (Hymenotamayonin B): (2R,8R,10R)-2-(4,5-dihydroxy-3-(3-methylbut-2-en-1-yl)phenyl)-5-hydroxy-8,10-bis(3-methylbut-2-en-1-yl)bicyclo[3.3.1]non-6-ene-7,9-dione. Amorphous orange powder, [α]D20 -12 (c 0.002, MeOH); UV (c 0.002, MeOH) λmax 221, 273 nm.
1H NMR (CD3OD, 600 MHz) δ 1.51 (3H, d, J = 1.5 Hz, H3-14), 1.59 (3H, d, J = 1.5 Hz, H3-15), 1.63 (3H, d, J = 1.5 Hz, H3-20), 1.64 (1H, overlapped, H-4ax), 1.69 (3H, d, J = 1.5 Hz, H3-19), 1.71 (3H, d, J = 1.4 Hz, H3-4″), 1.71 (1H, overlapped, H-3eq), 1.73 (3H, d, J = 1.4 Hz, H3-5″), 1.97 (1H, ddd, J = 13.1, 4.9, 1.8 Hz, H-4eq), 2.21 (2H, m, H-3ax, H-11b), 2.30 (1H, dd, J = 15.0, 6.7 Hz, H-11a), 2.48 (2H, m, H2-16), 2.64 (1H, dd, J = 13.2, 4.0 Hz, H-2ax), 3.23 (1H, dd, J = 15.6, 7.4 Hz, H-1″b), 3.28 (1H, dd, J = 15.6, 7.4 Hz, H-1″a), 4.87 (1H, overlapped, H-12), 4.97 (1H, thept, J = 6.9, 1.5 Hz, H-17), 5.29 (1H, thept, J = 7.4, 1.4 Hz, H-2″), 6.32 (1H, d, J = 2.2 Hz, H-2′), 6.40 (1H, d, J = 2.2 Hz, H-6′); 13C NMR (CD3OD, 151 MHz) δ 17.9 (CH3-4″), 18.2 (CH3-14, CH3-19), 26.0 (CH3-5″), 26.1 (CH3-15), 26.1 (CH3-20), 28.1 (CH2-3), 29.2 (CH2-1″), 29.8 (CH2-11), 30.9 (CH2-16), 39.2 (CH2-4), 56.2 (CH-2), 114.4 (CH-6′), 121.4 (CH-17), 121.9 (CH-12), 122.6 (CH-2′), 124.2 (CH-2″), 128.7 (C-3′), 131.3 (C-1′), 132.7 (C-3″), 133.3 (C-13), 134.0 (C-18), 143.4 (C-4′), 145.3 (C-5′), 211.0 (C-9). Supplementary Figures S61–66. NP0332436. HRESIMS m/z 479.2791 [M + H]+ (calculated for C30H39O5, error −0.19 ppm); MS/MS CCMSLIB00011431730.
InChI = 1S/C30H38O5/c1-182)7-8-21-15-22(16-24(31)27(21)34)23-11-13-29(12-9-193)4)25(32)17-26(33)30(23,28(29)35)14-10-205)6/h7,9-10,15-17,23,31-32,34H,8,11-14H2,1-6H3/t23-,29+,30-/m1/s1.
Compound 11 (Hymenotamayonin D): (2R,8R,10R)-2-(5-hydroxy-4-methoxy-3-(3-methylbut-2-en-1-yl)phenyl)-5-hydroxy-8,10-bis(3-methylbut-2-en-1-yl)bicyclo[3.3.1]non-6-ene-7,9-dione. Amorphous pale yellow powder, [α]D20 -27 (c 0.0008, MeOH); UV (c 0.0008, MeOH) λmax 207, 286 nm.
1H NMR (CD3OD, 600 MHz) δ 1.51 (3H, d, J = 1.6 Hz, H3-14), 1.60 (3H, d, J = 1.6 Hz, H3-15), 1.63 (3H, d, J = 1.3 Hz, H3-20), 1.63 (1H, overlapped, H-4ax), 1.69 (3H, d, J = 1.3 Hz, H3-19), 1.71 (1H, overlapped, H-3eq), 1.73 (6H, d, J = 1.3 Hz, H3-4″, H3-5″), 1.98 (1H, ddd, J = 12.9, 4.8, 1.8 Hz, H-4eq), 2.18 (1H, dd, J = 14.9, 7.2 Hz, H-11b), 2.25 (1H, td, J = 13.1, 4.8 Hz, H-3ax), 2.32 (1H, dd, J = 14.9, 7.2 Hz, H-11a), 2.46 (1H, dd, J = 14.3, 7.0 Hz, H-16b), 2.50 (1H, dd, J = 14.3, 7.0 Hz, 16a), 2.68 (1H, dd, J = 13.1, 4.0 Hz, H-2ax), 3.27 (2H, m, H2-1″), 3.73 (3H, s, 4′-OCH3), 4.89 (1H, overlapped, H-12), 4.98 (1H, thept, J = 7.0, 1.6 Hz, H-17), 5.24 (1H, thept, J = 7.2, 1.3 Hz, H-2″), 6.38 (1H, d, J = 2.2 Hz, H-2′), 6.47 (1H, d, J = 2.2 Hz, H-6′); 13C NMR (MeOD, 151 MHz) δ 18.0 (CH3-4″), 18.2 (CH3-14, CH3-19), 25.9 (CH3-5″), 26.1 (CH3-15), 26.1 (CH3-20), 28.2 (CH2-3), 29.4 (CH2-1″), 29.7 (CH2-11), 31.0 (CH2-16), 39.0 (CH2-4), 55.7 (CH-2), 60.7 (4′-OCH3), 116.0 (CH-6′), 121.6 (CH-17), 122.0 (CH-12), 122.9 (CH-2′), 124.5 (CH-2″), 132.9 (C-3″), 133.1 (C-13), 134.1 (C-18), 135.4 (C-3′), 136.6 (C-1′), 146.2 (C-4′), 150.4 (C-5′), 211.1 (C-9). Supplementary Figures S67–72. NP0332437. HRESIMS m/z 493.2947 [M + H]+ (calculated for C31H41O5, error −0.28 ppm); MS/MS CCMSLIB00011431732.
InChI = 1S/C31H40O5/c1-192)8-9-22-16-23(17-25(32)28(22)36-7)24-12-14-30(13-10-203)4)26(33)18-27(34)31(24,29(30)35)15-11-215)6/h8,10-11,16-18,24,32-33H,9,12-15H2,1-7H3/t24-,30+,31-/m1/s1.
Compound 12 (Hymenotamayonin F): (2S,8R,10R)-2-(5-hydroxy, 4-methoxy-3-(3-methylbut-2-en-1-yl)phenyl)-18,18-dimethyl-8-(3-methylbut-2-en-1-yl)-5-oxotricyclo[7.3.1.05,10]dodec-5-ene-7,9-dione. Amorphous pale yellow powder, [α]D20 + 6 (c 0.0004, MeOH); UV (c 0.0004, MeOH) λmax 205, 273 nm.
1H NMR (CD3OD, 600 MHz) δ 1.29 (3H, s, H3-20), 1.46 (3H, s, H3-19), 1.47 (3H, d, J = 1.3 Hz, H3-14), 1.54 (3H, d, J = 1.3 Hz, H3-15), 1.63 (1H, m, H-3eq), 1.71 (1H, dt, J = 14.4, 4.2 Hz, H-16eq), 1.73 (3H, d, J = 1.3 Hz, H3-4″), 1.78 (3H, d, J = 1.3 Hz, H3-5″), 1.86 (1H, dt, J = 14.3, 4.1 Hz, H-17eq), 1.96 (1H, td, J = 13.3, 4.5 Hz, H-4ax), 2.04 (1H, td, J = 14.3, 4.1 Hz, H-17ax), 2.06 (1H, dd, J = 14.7, 6.1 Hz, H-11b), 2.16 (1H, dd, J = 14.7, 7.8 Hz, H-11a), 2.23 (1H, m, H-3ax), 2.28 (1H, dd, J = 13.3, 4.5 Hz, H-4eq), 2.56 (1H, td, J = 14.4, 4.2 Hz, H-16ax), 3.04 (1H, d, J = 6.2 Hz, H-2eq), 3.28 (2H, m, H2-1″), 3.74 (3H, s, 4′-OCH3), 4.83 (1H, thept, J = 7.6, 1.3 Hz, H-12), 5.24 (1H, thept, J = 7.5, 1.3 Hz, H-2″), 5.82 (1H, s, H-6), 6.31 (1H, d, J = 2.3 Hz, H-2′), 6.41 (1H, d, J = 2.3 Hz, H-6′); 13C NMR (CD3OD, 151 MHz) δ 17.9 (CH3-14), 18.0 (CH3-4″), 24.2 (CH2-16), 26.0 (CH3-15), 26.1 (CH3-5″), 26.2 (CH3-20), 27.6 (CH2-3), 29.0 (CH2-1″), 30.1 (CH3-19), 30.3 (CH2-11), 31.2 (CH2-17), 33.2 (CH2-4), 51.0 (C-10), 54.7 (CH-2), 60.8 (4′-OCH3), 67.8 (C-8), 82.3 (C-18), 113.8 (CH-6), 115.9 (CH-6′), 121.3 (CH-12), 121.4 (CH-2′), 123.8 (CH-2″), 134.0 (C-3″), 136.3 (C-3′), 138.1 (C-1′), 145.9 (C-4′), 151.0 (C-5′), 176.8 (C-5), 200.4 (C-7), 210.3 (C-9). Supplementary Figures S73–S78. NP0332435. HRESIMS m/z 491.2747 [M + H]+ (calculated for C31H41O5, error −0.16 ppm); MS/MS CCMSLIB00011431734.
InChI = 1S/C31H40O5/c1-19(2)8-9-21-16-22(17-24(32)27(21)35-7)23-11-12-30-15-14-29(5,6)36-26(30)18-25(33)31(23,28(30)34)13-10-20(3)4/h8,10,16-18,23,32H,9,11-15H2,1-7H3/t23-,30+,31+/m0/s1.
Compound 13 (Hymenotamayonin E): (2S,8R,10R,17R)-2-(5-hydroxy, 4-methoxy-3-(3-methylbut-2-en-1-yl)phenyl)-8-(3-methylbut-2-en-1-yl)-17-(prop-1-en-2-yl-5-oxotricyclo[6.3.1.05,10]dodec-5-ene-7,9-dione. Amorphous pale yellow powder, [α]D20 + 0.4 (c 0.0005, MeOH); UV (c 0.0005, MeOH) λmax 204, 270 nm.
1H NMR (CD3OD, 600 MHz) δ 1.49 (3H, d, J = 1.4 Hz, H3-14), 1.53 (3H, d, J = 1.4 Hz, H3-15), 1.66 (1H, m, H-3eq), 1.73 (3H, d, J = 1.3 Hz, H3-4″), 1.77 (3H, d, J = 1.3 Hz, H3-5″), 1.78 (3H, t, J = 1.2 Hz, H3-19), 2.07 (1H, dd, J = 14.5, 6.0 Hz, H-11b), 2.12 (1H, dd, J = 13.0, 5.4 Hz, H-16b), 2.17 (1H, dd, J = 14.5, 7.7 Hz, H-11a), 2.23 (1H, brd, J = 9.4 Hz, H-4eq), 2.30 (1H, overlapped, H-4ax), 2.32 (1H, overlapped, H-3ax), 2.63 (1H, dd, J = 13.0, 11.2 Hz, 16a), 3.14 (1H, d, J = 3.8 Hz, H-2eq), 3.75 (3H, s, 4′-OCH3), 4.78 (1H, ddhept, J = 7.7, 6.0, 1.4 Hz, H-12), 5.05 (1H, p, J = 1.2 Hz, 20b), 5.17 (1H, q, J = 1.2 Hz, 20a), 5.25 (2H, thept, J = 7.5, 1.3 Hz, 2″), 5.32 (1H, dd, J = 11.2, 5.4 Hz, H-17), 5.80 (1H, s, H-6), 6.38 (1H, d, J = 2.3 Hz, H-2′), 6.47 (1H, d, J = 2.3 Hz, H-6′); 13C NMR (CD3OD, 151 MHz) δ 17.3 (CH3-19), 17.9 (CH3-14), 18.0 (CH3-4″), 26.0 (CH3-15), 26.1 (CH3-5″), 27.6 (CH2-3), 29.1 (CH2-1″), 30.5 (CH2-11), 32.6 (CH2-4), 35.4 (CH2-16), 55.3 (CH-2), 60.8 (4′-OCH3), 61.7 (C-10), 67.3 (C-8), 89.2 (CH-17), 104.2 (CH-6), 114.4 (CH2-20), 115.8 (CH-6′), 121.0 (CH-12), 121.6 (CH-2′), 123.9 (CH-2″), 133.5 (C-3″), 134.2 (C-13), 136.4 (C-3′), 137.9 (C-1′), 143.1 (C-18), 146.0 (C-4′), 151.1 (C-5′), 180.9 (C-5), 201.3 (C-7), 207.8 (C-9). Supplementary Figures S79–S84. NP0332432. HRESIMS m/z 491.2792 [M + H]+ (calculated for C31H39O5, error 0.08 ppm); MS/MS CCMSLIB00011431731.
InChI = 1S/C31H38O5/c1-182)8-9-21-14-22(15-24(32)28(21)35-7)23-11-12-30-17-25(205)6)36-27(30)16-26(33)31(23,29(30)34)13-10-193)4/h8,10,14-16,23,25,32H,5,9,11-13,17H2,1-4,6-7H3/t23-,25+,30+,31+/m0/s1.
The absolute configuration assigned for all compounds was based on a comparison between the calculated and experimental ECD. The calculations were based on the relative configuration determined through NMR 2D ROESY experiments. The structures were used to find the conformers through a random rotor search algorithm (number of conformers, 100) employing the MMFF94s force field in Avogrado v1.2.0 (Hanwell et al., 2012). The conformers were further optimized using PM3 and B3LYP/6-31G(d,p) basis sets in Gaussian 16 software (© 2015-2022, Gaussian Inc., Wallingford, CT, United States of America) with the SCRF model in methanol (Nugroho and Morita, 2014; Mándi and Kurtán, 2019). All optimized conformers were checked for imaginary frequencies. The conformers were subjected to ECD calculations using TD-DFT B3LYP/def2svp as a basis set and an SCRF model in methanol in Gaussian16 software. The calculated ECD spectrum was generated in SpecVis1.71 software (Berlin, Germany) based on a Boltzmann-weighted average. Supplementary Figure S6 shows the results. The ECD calculations were performed on the HPC Baoab cluster at the University of Geneva.
Analyses were performed with a Vanquish Horizon (Thermo Scientific, Germany) equiped with a binary pump H, a dual split sampler HT and a Diode Array detector FG coupled to an Orbitrap Exploris 120 mass spectrometer (Thermo Scientific, Germany) and a Corona Veo RS Charged Aerosol Detector (CAD, Thermo Scientific, Germany). The Orbitrap employes a heated electrospray ionization source (H-ESI) with the following parameters: spray voltage: +3.5 kV; ion transfer tube temperature: 320.00°C; vaporizer temperature: 320.00°C; S-lens RF: 45 (arb units); sheath gas flow rate: 35.00 (arb units); Sweep Gas (arb): 1, and auxiliary gas flow rate: 10.00 (arb. units).
The mass analyzer was calibrated using a mixture of caffeine, methionine−arginine−phenylalanine− alanine−acetate (MRFA), sodium dodecyl sulfate, sodium taurocholate, and Ultramark 1,621 in an acetonitrile/methanol/water solution containing 1% formic acid by direct injection. Control of the instruments was done using Thermo Scientific Xcalibur software v. 4.6.67.17. Full scans were acquired at a resolution of 30,000 fwhm (at m/z 200) and MS2 scans at 15,000 fwhm in the range of 100–1,000 m/z, with one microscan, time (ms): 200 m, an RF lens (%): 70; AGC target custom (Normalized AGC target (%): 300); maximum injection time (ms): 130; Microscans: 1; data type: profile; Use EASY-IC(TM): ON. The Dynamic exclusion mode: Custom; Exclude after n times: 1; Exclusion duration s): 5; Mass tolerance: ppm; low: 10, high: 10, Exclude isotopes: true. Apex detention: Desired Apex Window (%): 50. Isotope Exclusion: Assigned and unassigned with an exclusion window (m/z) for unassigned isotopes: 8. The Intensity threshold was set to 2.5E5. and a targeted mass exclusion list was used. The centroid data-dependent MS2 (dd-MS2) scan acquisition events were performed in discovery mode, triggered by Apex detection with a trigger detection (%) of 300 with a maximum injection time of 120 m, performing one microscan. The top three abundant precursors (charge states one and 2) within an isolation window of 1.2 m/z were considered for MS/MS analysis. For precursor fragmentation in the HCD mode, a normalized collision energy of 15, 30, 45% was used. Data was recorded in profile mode (Use EASY-IC(TM): ON).
The chromatographic separation was done on a Waters BEH C18 column (50 × 2.1 mm i. d., 1.7 μm, Waters, Milford, MA) using a gradient as follows (time (min), %B): 0.5, 8.2; 7,99; 8,99; 8.10,8.2; 9.75, 8.2. The mobile phases were A) water with 0.1% formic acid and B) acetonitrile with 0.1% formic acid. The flow rate was set to 600 μL/min, the injection volume was 1 μL, and the column was kept at 40 °C. The PDA detector was used from 210 to 400 nm with a resolution of 1.2 nm. The CAD was kept at 40°C, 5 bar N2, and power function one for a data collection rate of 20 Hz.
All raw data files were converted using ThermoRawFileParser v.1.4.0.101 (https://github.com/compomics/ThermoRawFileParser) (Hulstaert et al., 2020).
The converted files were processed with MZmine3 (Schmid et al., 2023). For mass detection at the MS1 level, the noise level was set to 1.0 E6. For MS2 detection, the noise level was set to 0.00. The ADAP chromatogram builder parameters were set as follows: Minimum consecutive scans, 5; Minimum intensity for consecutive scans, 1.0 E6; Minimum absolute height, 1.0 E6, and m/z tolerance of 0.0020 or 10.0 ppm. The Local minimum feature resolver algorithm was used for chromatogram deconvolution with the following parameters: Chromatographic threshold, 80; Minimum search range RT/Mobility (absolute), 0.10; Minimum relative height, 1%; Minimum absolute height, 1.0 E6; Min ratio of peak top/edge, 1.0; peak duration range, 0.01–1.0 min; Minimum scans, 5. Isotopes were detected using the 13C isotope filter with an m/z tolerance of 0.0050 or 8.0 ppm, a Retention Time tolerance of 0.05 min (absolute), the maximum charge set at 2, and the representative isotope used was the most intense. Each file was filtered to remove duplicates using the Duplicate peak filter with an m/z tolerance of 0.005 or 10 ppm and an RT tolerance of 0.10 min. The Feature list row filter was used to filter with the following parameters: Minimum features in an isotope pattern, 2; Retention time, 0.50–7.00 min; Feature duration range: 0.1–1.0 min; and only the ions with an associated MS2 spectrum were kept. The resulting filtered list was subjected to Ion Identity Networking (Schmid et al., 2021) starting with the metaCorrelate module (RT tolerance, 0.10 min; minimum height, 1.0 E5; Intensity correlation threshold 1.0 E5 and the Correlation Grouping with the default parameters). Followed by the Ion identity networking (m/z tolerance, 8.0 ppm; check: one feature; Minimum height: 1.0 E3, Ion identity library [maximum charge, 2; maximum molecules/cluster, 2; Adducts ([M + H]+, [M + Na]+, [M + K]+, [M + NH4]+, [M+2H]2+), Modifications ([M-H2O], [M-2H2O], [M-CO2], [M + HFA], [M + ACN])], Annotation refinement (Delete small networks without major ion, yes; Delete networks without monomer, yes), Add ion identities networks (m/z tolerance, 8 ppm; Minimum height, 1.0 E5; Annotation refinement (Minimum size, 1; Delete small networks without major ion, yes; Delete small networks: Link threshold, 4; Delete networks without monomer, yes)) and Check all ion identities by MS/MS (m/z tolerance (MS2)), 10 ppm; min-height (in MS2), 1.0 E3; Check for multimers, yes; Check neutral losses (MS1 - > MS2), yes) modules. The resulting aligned peak list was exported as a. mgf file for further analysis.
A molecular network for HPE was constructed from the. mgf file exported from MZmine3, using the FBMN workflow on the GNPS platform (Wang et al., 2016; Nothias et al., 2020). The precursor ion mass tolerance was set to 0.02 Da with an MS2 fragment ion tolerance of 0.02 Da. A network was created where edges were filtered to have a cosine score above 0.7 and more than six matched peaks. The spectra in the network were then searched against GNPS’ spectral libraries. All matches between network and library spectra were required to have a score above 0.6, and at least three matched peaks. Job link: https://gnps.ucsd.edu/ProteoSAFe/status.jsp?task=c9e133b094404c0ab373c991b8924fb0.
The.mgf file exported from MZmine3 was also annotated by spectral matching against an in silico database to obtain putative annotations (Allard et al., 2016). The resulting annotations were subjected to taxonomically informed metabolite scoring (https://taxonomicallyinformedannotation.github.io/tima-r/, v 2.8.2) and re-ranking (Rutz et al., 2019) from the chemotaxonomic information available on LOTUS (Rutz et al., 2022). The in silico database used for this process includes the combined records of the Dictionary of Natural Products (DNP, v30.2) and the LOTUS Initiative outputs.
The SIRIUS. mgf file exported from MZmine3 (using the SIRIUS export module) that contains MS1 and MS2 information was processed with SIRIUS (v5.6.3) (Dührkop et al., 2019). The parameters were set as follows: Possible ionizations: [M + H]+, [M + NH4]+, [M-H2O + H]+, [M + K]+, [M + Na]+, [M-4H2O + H]+; Instrument profile: Orbitrap; Mass accuracy: 5 ppm for MS1 and 7 ppm for MS2, the Database for molecular formulas and structures: BIO, Maximum m/z to compute: 1,000. ZODIAC was used to improve molecular formula prediction using a threshold filter of 0.99 (Ludwig et al., 2020). Metabolite structure prediction was made with CSI: FingerID (Dührkop et al., 2015) and the significance was computed with COSMIC (Hoffmann et al., 2022). The chemical class prediction was made with CANOPUS (Dührkop et al., 2021) using the NPClassifier chemical taxonomy (Kim et al., 2021).
The BT-20, HCC1395 and HEK293 cell lines were cultured and utilized in experimental conditions in Dulbecco’s Modified Medium (Thermo Fisher Scientific) supplemented with 10% Fetal Calf Serum and 1% penicillin-streptomycin at 37°C and 5% CO2.
Purified Wnt3a was obtained from mouse L-cells stably transfected with Wnt3a, as previously described (Willert et al., 2003), with our own modifications (Xu et al., 2020). The 3 cell lines, stably transfected with the M50 Super 8×TopFlash plasmid, were seeded at a density of 6,000 cells/well in white tissue-culture-treated 384-well plates in 20 µL/well maintenance medium. The cells were also transfected with the pCMV-RL plasmid to allow for constitutive expression of Renilla luciferase, using XtremeGENE nine reagent according to the manufacturer’s protocol. After 24 h post-transfection, the medium was replaced with 2-fold indicated concentrations of compounds in 10 µL/well maintenance medium. Following a 1-h preincubation, Wnt3a was added to a final concentration of 500 ng/mL in an additional 10 µL/well volume. After a further 24 h of incubation, the medium was removed and measurements were taken using a Tecan Infinite M200 PRO plate reader equipped with a two-channel dispensing unit by injecting sequentially 15 µL of each of the buffer solutions for activity measurements of firefly and Renilla luciferase, as described previously (Boudou et al., 2022). The resulting dose-response data for this and the MTT assay were fitted using GraphPad Prism nine software (v9.4.0, Boston, United States) to obtain IC50 values. Since the assay is designed to not use positive control compounds, an extract or compound is considered ‘toxic’ if the IC50 value against Renilla luciferase is less than 1.7-fold of estimated TopFlash one, indicating that the decrease observed in TopFlash response is affected by a strong toxic effect.
The findings of this study demonstrate the potential of combining Inventa’s structural novelty scores with bioactivity results for guiding the discovery of structurally novel bioactive NPs in collections of NEs. Through the evaluation of Wnt-regulation activity results and Inventa’s scores, a collection of 1,600 NEs was narrowed down to four active NEs with a high potential of containing structural novel NPs.
Inventa’s multifaceted approach to evaluating structural richness and dissimilarities among extracts proves instrumental in this process. By assessing individual features within each extract and comparing the overall spectral space, Inventa effectively identifies extracts with potentially unknown specialized metabolisms. Through the integration of data from these two levels and the incorporation of literature reports for the taxon, Inventa highlights extracts with high novelty potential. The priority score, derived from its four components provides a comprehensive evaluation of the NEs potential of containing novel NPs. While Inventa’s novelty scores may not directly correlate with observed bioactivity, they play a crucial role in prioritizing NEs and reducing selection prior to in-depth phytochemical study. This approach mitigates the risk of prioritizing known NPs and underscores the importance of employing comprehensive bioinformatics approaches in sample selection. Thus, Inventa empowers researchers to identify NEs harboring structurally novel NPs with potential therapeutic applications.
The subsequent phytochemical investigation of H. punctata leaves led to the isolation of ten novel bicyclo[3.3.1]non-3-ene-2,9-diones and three known prenylated flavones. Some of the newly isolated compounds exhibited appreciable IC50 values and showed no apparent cytotoxicity in three different cell lines, indicating their potential as Wnt inhibitory compounds. This work illustrates the utility of Inventa in assisting the efficient selection of active NEs from large sample collections for the identification of novel and bioactive NPs.
The mzML and raw UHPLC-HMRMS2 data for all the H. punctata de novo extract, can be accessed through MassIVE with the accession number MSV000092572. To access the molecular network follow the hyperlink: https://gnps.ucsd.edu/ProteoSAFe/status.jsp?task=c9e133b094404c0ab373c991b8924fb0 (PI). The ISDB and Sirius annotations (CSI:FingerID and CANOPUS), and the Cytoscape files for the molecular network in positive ionization pode are available here: https://massive.ucsd.edu/ProteoSAFe/dataset_files.jsp?task=ee8c8d92afd744c99ba0b6e1a53dfa0c#%7B%22table_sort_history%22%3A%22main.collection_asc%22%7D. The standard workflow used for processing and generating the Feature-Based Molecular Networking can be found in the GNPS documentation. The workflow for ISDB annotation and taxonomical re-weighting can be found here: https://taxonomicallyinformedannotation.github.io/tima-r/index.html. The script for cleaning and consolidating the annotations from GNPS can be found here: https://github.com/luigiquiros/inventa. The raw data files for the NMR and ECD (calculated and experimental) analysis are available at the following link: https://doi.org/10.26037/yareta:tnynbxbghrayrjqhnrzax4ijgi.
Ethical approval was not required for the studies on animals in accordance with the local legislation and institutional requirements because only commercially available established cell lines were used.
LQ-G: Conceptualization, Data curation, Formal Analysis, Investigation, Methodology, Software, Validation, Visualization, Writing–original draft, Writing–review and editing. LM: Data curation, Formal Analysis, Investigation, Writing–original draft, Writing–review and editing, Validation, Visualization. NC: Investigation, Methodology, Writing–review and editing. AK: Data curation, Formal Analysis, Investigation, Methodology, Validation, Visualization, Writing–original draft, Writing–review and editing. EQ: Writing–review and editing. BD: Resources, Writing–review and editing. AG: Resources, Writing–review and editing. VK: Resources, Supervision, Writing–review and editing. J-LW: Conceptualization, Funding acquisition, Project administration, Resources, Supervision, Writing–original draft, Writing–review and editing, Validation.
The author(s) declare that financial support was received for the research, authorship, and/or publication of this article. Swiss National Science Foundation (SNF N◦CRSII5_189921/1).
The authors thank the Green Mission Pierre Fabre, Pierre Fabre Research Institute, Toulouse, France for collaborating and sharing the extract collection.
The authors declare that the research was conducted in the absence of any commercial or financial relationships that could be construed as a potential conflict of interest.
All claims expressed in this article are solely those of the authors and do not necessarily represent those of their affiliated organizations, or those of the publisher, the editors and the reviewers. Any product that may be evaluated in this article, or claim that may be made by its manufacturer, is not guaranteed or endorsed by the publisher.
The Supplementary Material for this article can be found online at: https://www.frontiersin.org/articles/10.3389/fchem.2024.1371982/full#supplementary-material
Allard, P.-M., Gaudry, A., Quirós-Guerrero, L.-M., Rutz, A., Dounoue-Kubo, M., Walker, T. W. N., et al. (2023). Open and reusable annotated mass spectrometry dataset of a chemodiverse collection of 1,600 plant extracts. Gigascience 12, giac124. doi:10.1093/gigascience/giac124
Allard, P.-M., Péresse, T., Bisson, J., Gindro, K., Marcourt, L., Pham, V. C., et al. (2016). Integration of molecular networking and in-silico MS/MS fragmentation for natural products dereplication. Anal. Chem. 88, 3317–3323. doi:10.1021/acs.analchem.5b04804
Amado, N. G., Fonseca, B. F., Cerqueira, D. M., Neto, V. M., and Abreu, J. G. (2011). Flavonoids: potential Wnt/beta-catenin signaling modulators in cancer. Life Sci. 89, 545–554. doi:10.1016/j.lfs.2011.05.003
Amado, N. G., Predes, D., Moreno, M. M., Carvalho, I. O., Mendes, F. A., and Abreu, J. G. (2014). Flavonoids and wnt/β-catenin signaling: potential role in colorectal cancer therapies. Int. J. Mol. Sci. 15, 12094–12106. doi:10.3390/ijms150712094
Atanasov, A. G., Zotchev, S. B., Dirsch, V. M., and Supuran, C. T.International Natural Product Sciences Taskforce (2021). Natural products in drug discovery: advances and opportunities. Nat. Rev. Drug Discov. 20, 200–216. doi:10.1038/s41573-020-00114-z
Blagodatski, A., Klimenko, A., Jia, L., and Katanaev, V. L. (2020). Small molecule Wnt Pathway modulators from natural sources: history, state of the art and perspectives. Cells 9, 589. doi:10.3390/cells9030589
Boudou, C., Mattio, L., Koval, A., Soulard, V., and Katanaev, V. L. (2022). Wnt-pathway inhibitors with selective activity against triple-negative breast cancer: from thienopyrimidine to quinazoline inhibitors. Front. Pharmacol. 13, 1045102. doi:10.3389/fphar.2022.1045102
Cabral, R. S., Allard, P.-M., Marcourt, L., Young, M. C. M., Queiroz, E. F., and Wolfender, J.-L. (2016). Targeted isolation of indolopyridoquinazoline alkaloids from Conchocarpus fontanesianus based on molecular networks. J. Nat. Prod. 79, 2270–2278. doi:10.1021/acs.jnatprod.6b00379
Caesar, L. K., Montaser, R., Keller, N. P., and Kelleher, N. L. (2021). Metabolomics and genomics in natural products research: complementary tools for targeting new chemical entities. Nat. Prod. Rep. 38, 2041–2065. doi:10.1039/d1np00036e
Clark, A. M. (1996). Natural products as a resource for new drugs. Pharm. Res. 13, 1133–1144. doi:10.1023/a:1016091631721
Dat, N. T., Binh, P. T. X., Quynh, L. T. P., Van Minh, C., Huong, H. T., and Lee, J. J. (2010). Cytotoxic prenylated flavonoids from Morus alba. Fitoterapia 81, 1224–1227. doi:10.1016/j.fitote.2010.08.006
David, B., Wolfender, J.-L., and Dias, D. A. (2015). The pharmaceutical industry and natural products: historical status and new trends. Phytochem. Rev. 14, 299–315. doi:10.1007/s11101-014-9367-z
Dias, D. A., Urban, S., and Roessner, U. (2012). A historical overview of natural products in drug discovery. Metabolites 2, 303–336. doi:10.3390/metabo2020303
Dührkop, K., Fleischauer, M., Ludwig, M., Aksenov, A. A., Melnik, A. V., Meusel, M., et al. (2019). SIRIUS 4: a rapid tool for turning tandem mass spectra into metabolite structure information. Nat. Methods 16, 299–302. doi:10.1038/s41592-019-0344-8
Dührkop, K., Nothias, L.-F., Fleischauer, M., Reher, R., Ludwig, M., Hoffmann, M. A., et al. (2021). Systematic classification of unknown metabolites using high-resolution fragmentation mass spectra. Nat. Biotechnol. 39, 462–471. doi:10.1038/s41587-020-0740-8
Dührkop, K., Shen, H., Meusel, M., Rousu, J., and Böcker, S. (2015). Searching molecular structure databases with tandem mass spectra using CSI:FingerID. Proc. Natl. Acad. Sci. U. S. A. 112, 12580–12585. doi:10.1073/pnas.1509788112
Feher, M., and Schmidt, J. M. (2003). Property distributions: differences between drugs, natural products, and molecules from combinatorial chemistry. J. Chem. Inf. Comput. Sci. 43, 218–227. doi:10.1021/ci0200467
Fu, K.-L., Shen, Y.-H., Lu, L., Li, B., He, Y.-R., Li, B., et al. (2013). Two unusual rearranged flavan derivatives from Narcissus tazetta var. chinensis. Helv. Chim. Acta 96, 338–344. doi:10.1002/hlca.201200248
Fuentes, R. G., Arai, M. A., and Ishibashi, M. (2015). Natural compounds with Wnt signal modulating activity. Nat. Prod. Rep. 32, 1622–1628. doi:10.1039/c5np00074b
Fukai, T., Qing-Hua, W., and Nomura, T. (1991). Six prenylated phenols from Glycyrrhiza uralensis. Phytochemistry 30, 1245–1250. doi:10.1016/S0031-9422(00)95210-5
Gamache, P. H. (2017). Charged Aerosol detection for liquid chromatography and related separation techniques. John Wiley and Sons. doi:10.1002/9781119390725
Gaudry, A., Huber, F., Nothias, L.-F., Cretton, S., Kaiser, M., Wolfender, J.-L., et al. (2022). MEMO: mass spectrometry-based sample vectorization to explore chemodiverse datasets. Front. Bioinform 2, 842964. doi:10.3389/fbinf.2022.842964
Gaudry, A., Pagni, M., Mehl, F., Moretti, S., Quiros-Guerrero, L.-M., Rutz, A., et al. (2023). A sample-centric and knowledge-driven computational framework for natural products drug discovery. ChemRxiv. doi:10.26434/chemrxiv-2023-sljbt
Gu, J., Cui, C.-F., Yang, L., Wang, L., and Jiang, X.-H. (2019). Emodin inhibits colon cancer cell invasion and migration by suppressing epithelial-mesenchymal transition via the wnt/β-catenin pathway. Oncol. Res. 27, 193–202. doi:10.3727/096504018X15150662230295
Guillarme, D., Nguyen, D. T. T., Rudaz, S., and Veuthey, J.-L. (2008). Method transfer for fast liquid chromatography in pharmaceutical analysis: application to short columns packed with small particle. Part II: gradient experiments. Eur. J. Pharm. Biopharm. 68, 430–440. doi:10.1016/j.ejpb.2007.06.018
Hamburger, M. (2019). HPLC-based activity profiling for pharmacologically and toxicologically relevant natural products - principles and recent examples. Pharm. Biol. 57, 328–334. doi:10.1080/13880209.2019.1606261
Hanwell, M. D., Curtis, D. E., Lonie, D. C., Vandermeersch, T., Zurek, E., and Hutchison, G. R. (2012). Avogadro: an advanced semantic chemical editor, visualization, and analysis platform. J. Cheminform. 4, 17. doi:10.1186/1758-2946-4-17
Hoffmann, M. A., Nothias, L.-F., Ludwig, M., Fleischauer, M., Gentry, E. C., Witting, M., et al. (2022). High-confidence structural annotation of metabolites absent from spectral libraries. Nat. Biotechnol. 40, 411–421. doi:10.1038/s41587-021-01045-9
Hostettmann, K., and Terreaux, C. (2000). Search for new lead compounds from higher plants. Chimia 54, 652. doi:10.2533/chimia.2000.652
Houschyar, K. S., Tapking, C., Borrelli, M. R., Popp, D., Duscher, D., Maan, Z. N., et al. (2018). Wnt Pathway in bone repair and regeneration - what do we know so far. Front. Cell Dev. Biol. 6, 170. doi:10.3389/fcell.2018.00170
Huber, F., Ridder, L., Verhoeven, S., Spaaks, J. H., Diblen, F., Rogers, S., et al. (2021). Spec2Vec: improved mass spectral similarity scoring through learning of structural relationships. PLoS Comput. Biol. 17, e1008724. doi:10.1371/journal.pcbi.1008724
Huber, F., Verhoeven, S., Meijer, C., Spreeuw, H., Castilla, E., Geng, C., et al. (2020). Matchms - processing and similarity evaluation of mass spectrometry data. J. Open Source Softw. 5, 2411. doi:10.21105/joss.02411
Hubert, J., Nuzillard, J.-M., and Renault, J.-H. (2017). Dereplication strategies in natural product research: how many tools and methodologies behind the same concept? Phytochem. Rev. 16, 55–95. doi:10.1007/s11101-015-9448-7
Hulstaert, N., Shofstahl, J., Sachsenberg, T., Walzer, M., Barsnes, H., Martens, L., et al. (2020). ThermoRawFileParser: modular, scalable, and cross-platform RAW file conversion. J. Proteome Res. 19, 537–542. doi:10.1021/acs.jproteome.9b00328
Ibrahim, H., Sani, F. S., Danladi, B. H., and Ahmadu, A. A. (2007). Phytochemical and antisickling studies of the leaves of Hymenocardia acida Tul (Euphorbiaceae). Pak. J. Biol. Sci. 10, 788–791. doi:10.3923/pjbs.2007.788.791
Inestrosa, N. C., Montecinos-Oliva, C., and Fuenzalida, M. (2012). Wnt signaling: role in Alzheimer disease and schizophrenia. J. Neuroimmune Pharmacol. 7, 788–807. doi:10.1007/s11481-012-9417-5
Jiang, H., Zhang, Z., Yu, Y., Chu, H. Y., Yu, S., Yao, S., et al. (2022). Drug discovery of DKK1 inhibitors. Front. Pharmacol. 13, 847387. doi:10.3389/fphar.2022.847387
Khiari, R., Baaka, N., Ammar, M., and Saad, M. K. (2017). Properties of tannin-glyoxal resins prepared from lyophilized and condensed tannin. J. Text. Eng. Fash. Technol. 3, 62–65. doi:10.15406/jteft.2017.03.00110
Kim, H. W., Wang, M., Leber, C. A., Nothias, L.-F., Reher, R., Kang, K. B., et al. (2021). NPClassifier: a deep neural network-based structural classification tool for natural products. J. Nat. Prod. 84, 2795–2807. doi:10.1021/acs.jnatprod.1c00399
Koval, A. V., Vlasov, P., Shichkova, P., Khunderyakova, S., Markov, Y., Panchenko, J., et al. (2014). Anti-leprosy drug clofazimine inhibits growth of triple-negative breast cancer cells via inhibition of canonical Wnt signaling. Biochem. Pharmacol. 87, 571–578. doi:10.1016/j.bcp.2013.12.007
Landesman-Bollag, E., Song, D. H., Romieu-Mourez, R., Sussman, D. J., Cardiff, R. D., Sonenshein, G. E., et al. (2001). Protein kinase CK2: signaling and tumorigenesis in the mammary gland. Mol. Cell. Biochem. 227, 153–165. doi:10.1023/a:1013108822847
Ligor, M., Studzińska, S., Horna, A., and Buszewski, B. (2013). Corona-charged Aerosol detection: an analytical approach. Crit. Rev. Anal. Chem. 43, 64–78. doi:10.1080/10408347.2012.746134
Lim, H. Y., Ong, P. S., Wang, L., Goel, A., Ding, L., Li-Ann Wong, A., et al. (2021). Celastrol in cancer therapy: recent developments, challenges, and prospects. Cancer Lett. 521, 252–267. doi:10.1016/j.canlet.2021.08.030
Lin, M., Cai, P.-J., Zeng, Z., Lin, N., Shen, Y., Tang, B., et al. (2018). Conformational bias by a removable silyl group: construction of bicyclo[n.3.1]alkenes by ring closing metathesis. Chemistry 24, 2334–2338. doi:10.1002/chem.201705275
Lin, Y., Kuang, Y., Li, K., Wang, S., Ji, S., Chen, K., et al. (2017). Nrf2 activators from Glycyrrhiza inflata and their hepatoprotective activities against CCl4-induced liver injury in mice. Bioorg. Med. Chem. 25, 5522–5530. doi:10.1016/j.bmc.2017.08.018
Liu, J., Xiao, Q., Xiao, J., Niu, C., Li, Y., Zhang, X., et al. (2022). Wnt/β-catenin signalling: function, biological mechanisms, and therapeutic opportunities. Signal Transduct. Target Ther. 7, 3. doi:10.1038/s41392-021-00762-6
Lojk, J., and Marc, J. (2021). Roles of non-Canonical Wnt signalling pathways in bone biology. Int. J. Mol. Sci. 22, 10840. doi:10.3390/ijms221910840
Ludwig, M., Nothias, L.-F., Dührkop, K., Koester, I., Fleischauer, M., and Hoffmann, M. A. (2020). Database-independent molecular formula annotation using Gibbs sampling through ZODIAC. Nat. Mach. Intell. 2629–641. doi:10.1038/s42256-020-00234-6
Mali, R. G., and Wadekar, R. R. (2008). In vitro anthelmintic activity of Baliospermum montanum muell. Arg roots. Indian J. Pharm. Sci. 70, 131–133. doi:10.4103/0250-474X.40352
Mándi, A., and Kurtán, T. (2019). Applications of OR/ECD/VCD to the structure elucidation of natural products. Nat. Prod. Rep. 36, 889–918. doi:10.1039/c9np00002j
Nagoya Protocol on access to genetic resources and the fair and equitable sharing of benefits arising from their utilization to the convention of biological diversity (2011). Nagoya Protocol on access to genetic resources and the fair and equitable sharing of benefits arising from their utilization to the convention of biological diversity. Available at: https://treaties.un.org/pages/ViewDetails.aspx?src=IND&mtdsg_no=XXVII-8-b&chapter=27&clang=_en (Accessed October 29, 2022).
Najmi, A., Javed, S. A., Al Bratty, M., and Alhazmi, H. A. (2022). Modern approaches in the discovery and development of plant-based natural products and their analogues as potential therapeutic agents. Molecules 27, 349. doi:10.3390/molecules27020349
Nanna, U., Chularojmontri, L., Tingpej, P., Kaewamatawong, R., Homhual, S., Suwannaloet, W., et al. (2021). Effect of Aporosa villosa stem ethanolic extract on adipogenesis in 3T3-L1 adipocytes. Pharmacogn. J. 13, 1422–1427. doi:10.5530/pj.2021.13.180
Newman, D. J., and Cragg, G. M. (2020). Natural products as sources of new drugs over the nearly four decades from 01/1981 to 09/2019. J. Nat. Prod. 83, 770–803. doi:10.1021/acs.jnatprod.9b01285
Nothias, L.-F., Petras, D., Schmid, R., Dührkop, K., Rainer, J., Sarvepalli, A., et al. (2020). Feature-based molecular networking in the GNPS analysis environment. Nat. Methods 17, 905–908. doi:10.1038/s41592-020-0933-6
Nugroho, A. E., and Morita, H. (2014). Circular dichroism calculation for natural products. J. Nat. Med. 68, 1–10. doi:10.1007/s11418-013-0768-x
Nusse, R., and Clevers, H. (2017). Wnt/β-Catenin signaling, disease, and emerging therapeutic modalities. Cell 169, 985–999. doi:10.1016/j.cell.2017.05.016
Ogura, M., Koike, K., Cordell, G. A., and Farnsworth, N. R. (1978). Potential anticancer agents VIII. Constituents of Baliospermum montanum (Euphorbiaceae). Planta Med. 33, 128–143. doi:10.1055/s-0028-1097367
Olivon, F., Grelier, G., Roussi, F., Litaudon, M., and Touboul, D. (2017). MZmine 2 data-preprocessing to enhance molecular networking reliability. Anal. Chem. 89, 7836–7840. doi:10.1021/acs.analchem.7b01563
Pieters, L., and Vlietinck, A. J. (2005). Bioguided isolation of pharmacologically active plant components, still a valuable strategy for the finding of new lead compounds? J. Ethnopharmacol. 100, 57–60. doi:10.1016/j.jep.2005.05.029
Pooja, T., and Karunagaran, D. (2014). Emodin suppresses Wnt signaling in human colorectal cancer cells SW480 and SW620. Eur. J. Pharmacol. 742, 55–64. doi:10.1016/j.ejphar.2014.08.028
Qiu, Z.-C., Zhang, Y., Xiao, H.-H., Chui-Wa Poon, C., Li, X.-L., Cui, J.-F., et al. (2020). 8-prenylgenistein exerts osteogenic effects via ER α and Wnt-dependent signaling pathway. Exp. Cell Res. 395, 112186. doi:10.1016/j.yexcr.2020.112186
Queiroz, E. F., Alfattani, A., Afzan, A., Marcourt, L., Guillarme, D., and Wolfender, J.-L. (2019). Utility of dry load injection for an efficient natural products isolation at the semi-preparative chromatographic scale. J. Chromatogr. A 1598, 85–91. doi:10.1016/j.chroma.2019.03.042
Quiros-Guerrero, L.-M., Nothias, L.-F., Gaudry, A., Marcourt, L., Allard, P.-M., Rutz, A., et al. (2022). Inventa: a computational tool to discover structural novelty in natural extracts libraries. Front. Mol. Biosci. 9, 1028334. doi:10.3389/fmolb.2022.1028334
Rajaonarivelo, M., Rakotonandrasana, O. L., Martin, M.-T., Dumontet, V., and Rasoanaivo, P. (2016). A new polycyclic polyprenylated acylphloroglucinol derivative from Garcinia verrucosa. Nat. Prod. Commun. 11, 1934578X1601100–1007. doi:10.1177/1934578x1601100734
Rutz, A., Dounoue-Kubo, M., Ollivier, S., Bisson, J., Bagheri, M., Saesong, T., et al. (2019). Taxonomically informed scoring enhances confidence in natural products annotation. Front. Plant Sci. 10, 1329. doi:10.3389/fpls.2019.01329
Rutz, A., Sorokina, M., Galgonek, J., Mietchen, D., Willighagen, E., Gaudry, A., et al. (2022). The LOTUS initiative for open knowledge management in natural products research. Elife 11, e70780. 2021.02.28.433265. doi:10.7554/eLife.70780
Sarker, S. D., Latif, Z., and Gray, A. I. (2005). “Natural products isolation,” in Sarker zahid latif alexander I. Gray 999 riverview drive. Editor D. Satyajit (Totowa, New Jersey 07512: Springer Science and Business Media). Suite 208.
Sarker, S. D., and Nahar, L. (2012). An introduction to natural products isolation. Methods Mol. Biol. 864, 1–25. doi:10.1007/978-1-61779-624-1_1
Schmid, R., Heuckeroth, S., Korf, A., Smirnov, A., Myers, O., Dyrlund, T. S., et al. (2023). Integrative analysis of multimodal mass spectrometry data in MZmine 3. Nat. Biotechnol. 41, 447–449. doi:10.1038/s41587-023-01690-2
Schmid, R., Petras, D., Nothias, L.-F., Wang, M., Aron, A. T., Jagels, A., et al. (2021). Ion identity molecular networking for mass spectrometry-based metabolomics in the GNPS environment. Nat. Commun. 12, 3832. doi:10.1038/s41467-021-23953-9
Sears, K. D., Casebier, R. L., Hergert, H. L., Stout, G. H., and McCandlish, L. E. (1974). Structure of catechinic acid. Base rearrangement product of catechin. J. Org. Chem. 39, 3244–3247. doi:10.1021/jo00936a015
Seigler, D. S. (1994). Phytochemistry and systematics of the euphorbiaceae. Ann. Mo. Bot. Gard. 81, 380–401. doi:10.2307/2992104
Selegato, D. M., Zanatta, A. C., Pilon, A. C., Veloso, J. H., and Castro-Gamboa, I. (2023). Application of feature-based molecular networking and MassQL for the MS/MS fragmentation study of depsipeptides. Front. Mol. Biosci. 10, 1238475. doi:10.3389/fmolb.2023.1238475
Shaw, H. V., Koval, A., and Katanaev, V. L. (2019a). A high-throughput assay pipeline for specific targeting of frizzled GPCRs in cancer. Methods Cell Biol. 149, 57–75. doi:10.1016/bs.mcb.2018.08.006
Shaw, H. V., Koval, A., and Katanaev, V. L. (2019b). Targeting the Wnt signalling pathway in cancer: prospects and perils. Swiss Med. Wkly. 149, w20129. doi:10.4414/smw.2019.20129
Song, D. H., Sussman, D. J., and Seldin, D. C. (2000). Endogenous protein kinase CK2 participates in Wnt signaling in mammary epithelial cells. J. Biol. Chem. 275, 23790–23797. doi:10.1074/jbc.M909107199
Srikrishna, L. P., Vagdevi, H. M., Basavaraja, B. M., and Vaidya, V. P. (2008). Evaluation of antimicrobial and analgesic activities of Aporosa lindleyana (euphorbiaceae) bark extract. Int. J. Green Pharm. (IJGP) 2, 155. doi:10.4103/0973-8258.42733
Stevens, J. F. (2020). “Xanthohumol and structurally related prenylflavonoids for cancer chemoprevention and control,” in Natural products for cancer chemoprevention: single compounds and combinations. Editors J. M. Pezzuto,, and O. Vang (Cham: Springer International Publishing), 319–350. doi:10.1007/978-3-030-39855-2_10
Takashima, J., and Ohsaki, A. (2001). Acutifolins A-F, a new flavan-derived constituent and five new flavans from Brosimum acutifolium. J. Nat. Prod. 64, 1493–1496. doi:10.1021/np010389j
The Angiosperm Phylogeny Group (2009). An update of the Angiosperm Phylogeny Group classification for the orders and families of flowering plants: APG III. Bot. J. Linn. Soc. 161, 105–121. doi:10.1111/j.1095-8339.2009.00996.x
Traven, V. F., Negrebetsky, V. V., Vorobjeva, L. I., and Carberry, E. A. (1997). Keto–enol tautomerism, NMR spectra, and H–D exchange of 4-hydroxycoumarins. Can. J. Chem. 75, 377–383. doi:10.1139/v97-043
van Welzen, P. C. (2016). Bischofia and Hymenocardia (Phyllanthaceae) in malesia. Blumea - Biodivers. Evol. Biogeogr. Plants 61, 272–279. doi:10.3767/000651916X694337
Venkataraman, R., Gopalakrishnan, S., and Thyagarajan, S. P. (2010). Antiviral activities of Aporosa lindleyana Baill. Ann. Biol. Res. 1, 68–70.
Wang, M., Carver, J. J., Phelan, V. V., Sanchez, L. M., Garg, N., Peng, Y., et al. (2016). Sharing and community curation of mass spectrometry data with global natural products social molecular networking. Nat. Biotechnol. 34, 828–837. doi:10.1038/nbt.3597
Willert, K., Brown, J. D., Danenberg, E., Duncan, A. W., Weissman, I. L., Reya, T., et al. (2003). Wnt proteins are lipid-modified and can act as stem cell growth factors. Nature 423, 448–452. doi:10.1038/nature01611
Xu, J., Koval, A., and Katanaev, V. L. (2020). Beyond TNBC: repositioning of Clofazimine against a broad range of Wnt-dependent cancers. Front. Oncol. 10, 602817. doi:10.3389/fonc.2020.602817
Yazaki, K., Sasaki, K., and Tsurumaru, Y. (2009). Prenylation of aromatic compounds, a key diversification of plant secondary metabolites. Phytochemistry 70, 1739–1745. doi:10.1016/j.phytochem.2009.08.023
Zhang, H., Tao, L., Fu, W.-W., Liang, S., Yang, Y.-F., Yuan, Q.-H., et al. (2014). Prenylated benzoylphloroglucinols and xanthones from the leaves of Garcinia oblongifolia with antienteroviral activity. J. Nat. Prod. 77, 1037–1046. doi:10.1021/np500124e
Zhang, Y., Zhou, L.-P., Li, X.-L., Zhao, Y.-J., Ho, M.-X., Qiu, Z.-C., et al. (2018). 8-Prenylgenistein, a prenylated genistein derivative, exerted tissue selective osteoprotective effects in ovariectomized mice. Oncotarget 9, 24221–24236. doi:10.18632/oncotarget.24823
Keywords: natural products, Wnt-pathway, Wnt-pathway modulators, structural novelty discovery, ‘Inventa’ scoring, Hymenocardia punctata, metabolomics (LC-MS), structural elucidation
Citation: Quiros-Guerrero L-M, Marcourt L, Chaiwangrach N, Koval A, Ferreira Queiroz E, David B, Grondin A, Katanaev VL and Wolfender J-L (2024) Integration of Wnt-inhibitory activity and structural novelty scoring results to uncover novel bioactive natural products: new Bicyclo[3.3.1]non-3-ene-2,9-diones from the leaves of Hymenocardia punctata. Front. Chem. 12:1371982. doi: 10.3389/fchem.2024.1371982
Received: 17 January 2024; Accepted: 14 March 2024;
Published: 04 April 2024.
Edited by:
Yu Tang, Zhejiang University, ChinaReviewed by:
Boshi Fu, New York Genome Center, United StatesCopyright © 2024 Quiros-Guerrero, Marcourt, Chaiwangrach, Koval, Ferreira Queiroz, David, Grondin, Katanaev and Wolfender. This is an open-access article distributed under the terms of the Creative Commons Attribution License (CC BY). The use, distribution or reproduction in other forums is permitted, provided the original author(s) and the copyright owner(s) are credited and that the original publication in this journal is cited, in accordance with accepted academic practice. No use, distribution or reproduction is permitted which does not comply with these terms.
*Correspondence: Jean-Luc Wolfender, amVhbi1sdWMud29sZmVuZGVyQHVuaWdlLmNo
Disclaimer: All claims expressed in this article are solely those of the authors and do not necessarily represent those of their affiliated organizations, or those of the publisher, the editors and the reviewers. Any product that may be evaluated in this article or claim that may be made by its manufacturer is not guaranteed or endorsed by the publisher.
Research integrity at Frontiers
Learn more about the work of our research integrity team to safeguard the quality of each article we publish.