 M. Aminul Islam
 Ishtiaque M. Syed
 M. Al Mamun
 S. Manjura Hoque
- 1Materials Science Division, Atomic Energy Centre Dhaka, Bangladesh Atomic Energy Commission, Dhaka, Bangladesh
- 2Department of Physics, University of Dhaka, Dhaka, Bangladesh
- 3Department of Physics, Magura Govt. Mahila College, Magura, Bangladesh
In this study, Mg1−xCoxFe2O4 (0≤x ≤ 1 with ∆x = 0.1) or MCFO nanoparticles were synthesized using a chemical co-precipitation method and annealed at 200, 400, 600, and 800°C respectively to investigate the structural properties of the materials by X-ray diffractometer (XRD), transmission electron microscopy (TEM), and Fourier-transform infrared spectroscopy (FTIR). Controlled annealing increased particle size for each value of x. The aim was to investigate how specific loss power (SLP) and maximum temperature (Tmax) during local magnetic hyperthermia were affected by structural alterations associated with particle size and composition. The lattice parameter, X-ray density, ionic radius, hopping length, bond length, cation-cation distance, and cation-anion distance increase with an increase in Co2+ content. Raman and FTIR spectroscopy reveal changes in cation distribution with Co2+ content and particle size. Magnetic properties measured by the physical property measurement system (PPMS) showed saturation magnetization (Ms), coercivity (Hc), remanent magnetization (Mr/Ms), and anisotropy constant (K1) of the Mg1−xCoxFe2O4 nanoparticles increase with Co2+ content and particle size. When exposed to an rf magnetic field, the nanohybrids experienced an increase in both the SLP (specific loss power) and Tmax (maximum temperature) as the particle size initially increased. However, these values reached their peak at critical particle size and subsequently decreased. This occurs since a modest increase in anisotropy, resulting from the presence of Co2+ and larger particle size, facilitates Néel and Brownian relaxation. However, for high anisotropy values and particle size, the Néel and Brownian relaxations are hindered, leading to the emergence of a critical size. The critical size increases as the Co2+ content decreases, but it decreases as the Co2+ content increases, a consequence of higher anisotropy with the increase in Co2+. Additionally, it is noteworthy that the maximum temperature (Tmax) rises as the concentration of nanohybrids grows, but the specific loss power (SLP) decreases. An increased concentration of chitosan-MCFO nanohybrids inhibits both the Néel and Brownian relaxation processes, reducing specific loss power.
1 Introduction
Magnetic nanoparticles demonstrate promise for biomedical applications that need smaller particle sizes with superparamagnetic or ferromagnetic behavior. Magnetic nanoparticles are injected intravenously or directly into the malignant cell after appropriate functionalization. Incompatibility is a grave concern for biomedical applications for any physiological implant (Tran and Webster, 2010; Bao et al., 2015; Rajan and Sahu, 2020). Magnesium ferrite is biocompatible because the tolerable limit of magnesium and iron in the human body is higher. According to the Food and Drug Administration of the United States, the reference Daily Intake RDI of Fe and Mg is 18 and 420 mg, respectively. In the case of local magnetic hyperthermia, the temperature range that destroys malignant cells is around 42°C–46°C (Liu et al. 2020). Magnetic nanoparticles with a higher magnetic moment and anisotropy constant increase the efficiency of hyperthermia treatment (Liu et al., 2000; Darwish et al., 2019; Mohapatra et al., 2019). The substitution of magnesium by cobalt in magnesium ferrite and heat treatment can optimize the particle size, magnetic moment, and anisotropy constant, which makes it suitable for hyperthermia application (Nlebedim et al., 2010; Abenojar et al., 2016; Kafrouni and Savadogo, 2016). A higher surface-to-volume ratio of the nanoparticle may adhere them to the walls of the blood vessel, which needs appropriate coating for rolling the particles, transport to a targeted region, and attaining biocompatibility (Fang et al., 2018; Li et al., 2018).
The magnetic properties of ferrite nanoparticles, such as saturation magnetic moment and magnetic anisotropy, are highly structurally sensitive. Therefore, a detailed study of the structure by X-ray diffraction with composition and particle size is worthwhile. Cation distributions of the tetrahedral (A) and octahedral (B) sites play a determining role in controlling the magnetic properties of ferrites (Vijaya and Thyagarajan 2015; Tatarchuk et al. 2017). By substituting non-magnetic magnesium ions with cobalt, one can optimize the structure-property relationship, especially saturation magnetic moment, coercive field, and anisotropy constant, which contribute to the Néel and Brownian relaxation mechanism responsible for particle heating in case of local magnetic hyperthermia treatment (Nemala et al., 2015; Martinez-Boubeta et al., 2013).
In magnetic particle hyperthermia, the particles flow with blood to the targeted region either for the purpose of drug delivery, local magnetic hyperthermia, or in situ chemotherapy/hyperthermia or radiotherapy/hyperthermia to kill localized or deeply seeded tumors (Mcbain et al., 2008; Sensenig et al., 2012). In the case of magnetic hyperthermia, magnetic nanoparticles generate heat by the Brownian and Néel relaxation processes when subjected to an alternating magnetic field. The heat is generated by all three mechanisms of the Néel relaxation process, the Brownian relaxation process, and hysteresis loss. However, which mechanism will dominate depends on the particle size and composition of the particles. Consequently, each composition of the nanoparticles would have a critical diameter, which would bear an optimum magnetic moment and anisotropy of the particle (Sensenig et al. 2014; Torres et al., 2019). Therefore, strict control of particle size to optimize magnetization and anisotropy is of utmost importance to tune Tmax and SLP.
Magnesium is a biocompatible cation that is essential for the human body. For adults, the recommended daily allowances for magnesium are 420 and 320 mg for men and women, respectively. Magnesium is a cofactor for more than 300 enzymes. It plays the most vital role in muscle contraction, neuromuscular conduction, glycemic control, myocardial contraction, bone development, and blood pressure (Alawi et al., 2018). Cobalt is also an essential element for humans. It is present in the human body as cobalamin (vitamin B12). Approximately 1 mg/mL of cobalt is present in the adult human body, where 85% of it is in the form of vitamin B12. The human daily allowable intake of cobalt is 5–50 µg (Chen and Lee 2023). Though cobalt is more toxic than magnesium, a small amount of magnesium replaced with cobalt would enhance the magnetic properties of Mg1−xCoxFe2O4, which reduces the required dosage of the magnetic particle in hyperthermia treatment. A small number of nanoparticles as implant alone could reduce the toxicity significantly. Surface coating with chitosan also remarkably reduces the toxicity of the nanoparticle. Considering all these facts, optimization of the parameters of hyperthermia by tuning composition and particle size is crucial, where the combination of cobalt- and magnesium-mixed ferrite with the variation of particle size bears promise for tailoring the structure-property relationship.
In this study, we will synthesize Mg1−xCoxFe2O4 (where 0 ≤x ≤ 1 with ∆x = 0.1), i.e., MCFO and chitosan nanohybrids by chemical co-precipitation and vary the core size of the MCFO by heat treatment at the temperatures of 200, 400, 600, and 800°C. We will study the tailoring effect on the efficiency of hyperthermia by estimating the specific loss power, SLP, and maximum temperature, Tmax, for each composition and core particle size.
2 Materials and methods
2.1 Synthesis technique
In this study, a series of Mg1−xCoxFe2O4 (where x = 0 to 1.0 with ∆x = 0.1) were synthesized by the wet chemical co-precipitation method using NaOH as the co-precipitating agent. Analytical grade of Mg(NO3)2 6H2O, CoCl2.6H2O, and FeCl3 were mixed in the required molar ratio under continuous stirring using a magnetic stirrer at a speed of 400 rpm. Then, 8 M of NaOH solution was added dropwise to the solution and the solution was left until the pH was stable. An extra 6 M NaOH was added dropwise to maintain the pH of the solution to a value of 11–13. The mixture was heated to 353 K for 1 h for the completion of the ferritization reaction. We added highly concentrated NaOH to coprecipitate hydroxides to keep the volume of the solvent at a minimum. The following reaction and side reactions took place while adding NaOH:
Combining the above four reactions, the key reaction was
The solvent was cooled to room temperature and the ferrite nanoparticles precipitated. The particles were washed 10 times by centrifugation at 13,000 rpm for 20 min to remove extra NaOH. The removal of NaOH was confirmed by the AgNO3 test. The particles were then heated at 343 K for 72 h for complete ferritization. The as-dried MCFO nanoparticles were collected from the petri dish, pelletized, and annealed at 200, 400, 600, and 800°C, respectively.
2.2 Coating technique
The annealed samples were ground and coated with a 2% (w/v) chitosan solution. The 2% (w/v) chitosan solution was prepared firstly by adding 2 gm chitosan in 70 mL de-ionized water under continuous stirring at 400 rpm for 72 h. During this process, 7 mL acetic acid was added four times to the solution to dissolve chitosan in water. Then the solution was centrifuged two times at 13,000 rpm to ensure that the solution was free from any impurity. We added 20 mg of annealed MCFO nanoparticles to 1 mL 2% chitosan solution, followed by vortexing and sonication several times to get 20 mg/mL chitosan-MCFO nanohybrid colloidal suspension as a stock. Finally, the other concentrations were prepared by diluting from the stock of the colloid.
Coating/surface functionalization of Mg1−xCoxFe2O4 ferrite nanoparticles by chitosan occurs because of the bonding between the oxygen of ferrite and the hydrogen of the amine group (-NH2) of chitosan. The -OH group remains free, which leads to the net charge of chitosan-Mg1−xCoxFe2O4 nanohybrid (Rhee et al., 2010) (Figure 1).
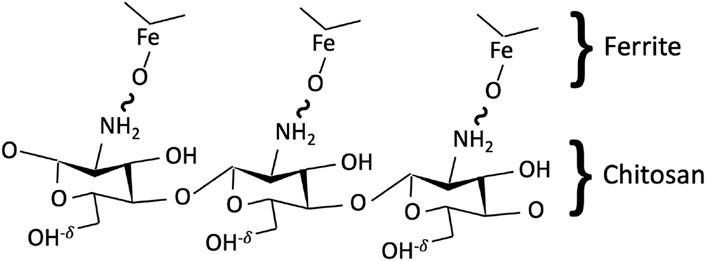
FIGURE 1. Schematic representation of the bonding between a chitosan polymer chain and Mg1−xCoxFe2O4 ferrite. The bonding occurs between the oxygen ion of ferrite and hydrogen of the amine group of chitosan, while the hydroxyl group remains free with a slight positive charge, leading to overall particles being positively charged.
2.3 Characterization technique
To determine the structural properties of MCFO nanoparticles, X-ray diffraction analysis was performed using a PW 3040 X-ray diffractometer, X’Pert PRO PANalytical model, Philips, Netherlands. A powder sample was subjected to X-ray diffraction (XRD) analysis, with the 2θ angles set between 15 and 70°. The XRD scan was conducted using CuKα radiation, with a voltage of 40 kV and a current of 30 mA. The wavelength of the radiation (λ) was 1.54059 Å. We conducted transmission electron microscopy investigations using a TALOS 200X, manufactured by Thermofisher, United States, operating at a voltage of 200 kV. In order to conduct a TEM investigation, we dispersed the samples in ethanol and dropped them over a carbon-coated Cu grid that is electron-transparent. We dried the drop-cast samples and acquired TEM and HRTEM images and selected area diffraction (SAED) patterns. The Raman spectroscopy measurements were conducted using a CRS+ 500/BX53, MonoVista, S & I Instrument, Germany. A diode laser system operating at a wavelength of 785 nm and with a power of 100 mW was utilized. The laser line was filtered using an edge filter with a width of 60 cm−1. Raman spectra were obtained using pellets of samples within the wavelength range of 200–3,500 cm−1. The scan step size was set to 0.0167°. The FTIR spectroscopy measurements were acquired using the PerkinElmer machine, United Kingdom, with the attenuated total reflection (ATR) attachment. The powder sample was combined with potassium bromide (KBr) to make pellets and the FTIR spectra was obtained within the range of 350–3,000 cm−1. The magnetic properties of all the samples were assessed using the Physical Property Measurement (PPMS) System, Quantum Design, United States, which has a maximum magnetic field strength of 9 T. The time-dependent temperature profiles were obtained using a hyperthermia set-up, namely, the EASY HEAT 5060LI model manufactured by Ambrell in the United States. The hyperthermia set-up comprises a sample coil with eight turns and a diameter of 4 cm. Throughout the hyperthermia experiment, the coil maintained a current of 283 A and a signal frequency of 343 kHz, resulting in a magnetic field of 26 mT at the center of the sample coil. For each test, 600 µL of chitosan-MCFO nanohybrid with varying concentrations was poured in an Eppendorf tube. The tube was then placed at the center of the sample coil and subjected to induction heating for different time intervals under a magnetic field of 26 mT. The temperature was promptly measured with a thermometer right after the power was turned off.
3 Results and discussion
3.1 Structural characterizations
3.1.1 X-ray diffraction (XRD)
We conducted rigorous studies by X-ray diffraction of the MCFO nanoparticles in the entire range of composition to understand the structure-property relationship, which in turn affected the efficiency of hyperthermia of the nanoparticles. Nanoparticles’ size, shape, and magnetic characteristics affect specific loss power (SLP) and maximum attainable temperature (Tmax) of hyperthermia, the ultimate engineering parameters for hyperthermia efficiency. The relaxation phenomena that incur self-heating properties are the Néel and Brownian relaxations and hysteresis loss. Néel relaxation is directly proportional to the volume and anisotropy of the nanoparticles. On the other hand, Brownian motion is directly proportional to the size of the nanoparticles. Nanoparticle size, cation distribution, and magnetic state (ferro/superparamagnetic) affect hysteresis loss. The structure of Co-Mg mixed-spinel ferrites undergoes considerable change throughout the whole spectrum of composition of MCFO due to the nano-magnetism of MgFe2O4 and CoFe2O4 at an ultrasmall scale, which again changes with particle size. Hence, acquiring an in-depth understanding of the structure of MCFO nanoparticles at different compositions would contribute to perceiving structure-property relationship, which would affect SLP and Tmax of hyperthermia.
At an annealing temperature of 200°C and when x = 0 to 0.3, the XRD pattern exhibits a broad diffuse hump at the 35° position. We delineated in the TEM section that the existence of lattice fringes within the x = 0 to 0.3 range indicates ultra-small particle size. The peaks corresponding to the spinel structure are observable at the annealing temperature of 200°C for the composition, x ≥ 0.4. Peak shift occurs as x increases due to the difference in the ionic radii of Co2+ (0.072 nm) and Mg2+ (0.065 nm) (Islam et al., 2022; Anjum et al., 2017). At an annealing temperature of 400°C, similar variations occur, although all six peaks are noticeable for x ≥ 0.3. At the annealing temperatures of 600°C and 800°C, all the peaks are clearly visible with narrower peak widths, indicating grain growth and higher crystallinity right from x = 0. The peaks have shifted towards the lower angle side, indicating an increase in lattice spacing due to the grain growth. The nanoparticles possess a high ratio of surface area to volume. As the particle size increases, the core of the particles increases, and the surface atoms reduce. Consequently, the ordered phase increases, replacing an incomplete coordination of disordered surface atoms. This results in a peak shift as the crystallinity and grain growth increase (Fouad et al., 2019).
The peak width of the diffraction peaks estimates the crystallite size. The kinematical theory of x-ray diffraction reveals that the total intensity of each diffraction peak from a single crystal, which relates to the scattering angle, 2θ, is directly proportional to the volume of the crystal (Valério and Morelhao 2019). As the volume of the crystallites increases, the peak area also increases while the peak width (FWHM) β decreases. The width of the peak is inversely proportional to the size of the crystallite. The width of each peak ascertains the mean particle size of the crystallites. It is common practice to utilize the width of the maximum intensity peak, which has the highest multiplicity factor. In the current study, the peak of Miller indices (311) exhibits the highest multiplicity factor, resulting in the maximum intensity we used to determine the crystallite size. Figure 2 demonstrates that the peak width decreases as the crystallinity increases due to a concurrent rise in Co concentration and annealing temperature. Crystallinity and grain growth also result in a displacement of the peaks. This is because smaller particle size results in larger surface areas. When the crystallinity increases, the surface area decreases due to the coalescing of smaller grains and the increased coordination number, while the lattice strain decreases. By altering the lattice spacing, d, the position of the peak changes following Bragg’s Law.
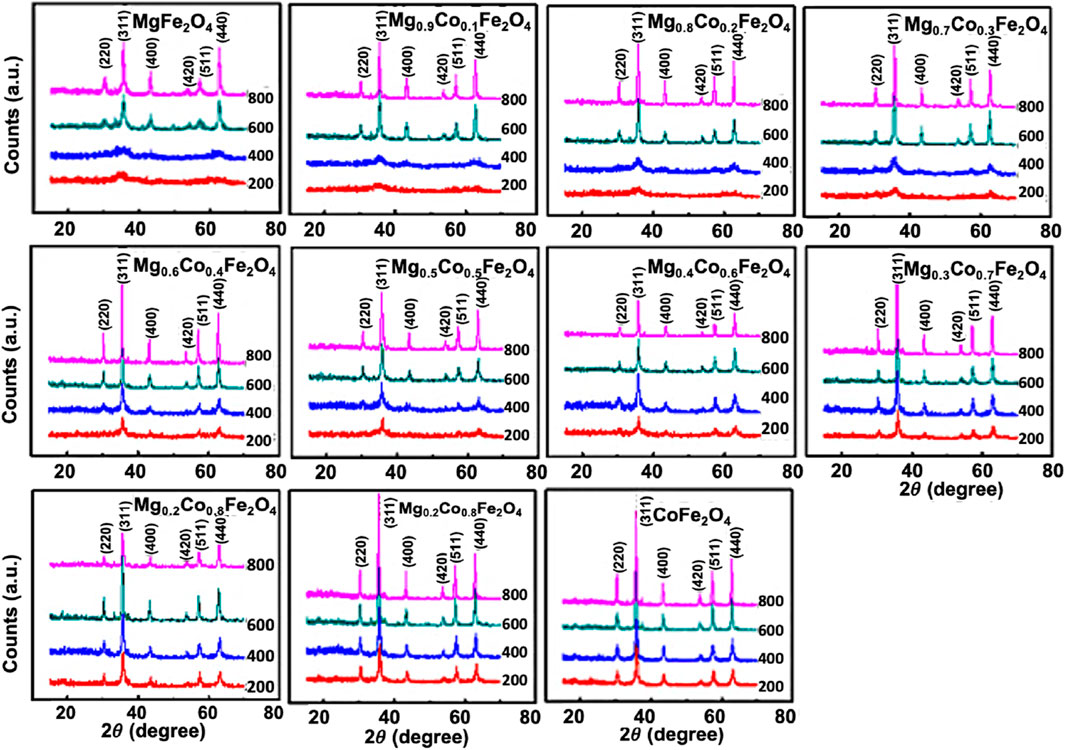
FIGURE 2. X-ray diffraction pattern of Mg1−xCoxFe2O4 (where 0 ≤ x ≤ 1; ∆x = 0.1) nanoparticles annealed at 200°C, 400°C, 600°C, and 800°C. The XRD scan was performed on the powder samples, 2θ angle ranging from 15°–70° with a scan step size of 0.0167o.
We used Eq. 1 to determine the grain size where D is the average crystallite size, λ is the X-ray wavelength, β is the full width at half maximum value of the highest intensity (311) peak in radians, and θ is the Bragg angle (Kumar et al., 2013).
Figure 3 presents the variations of (a) the particle size D, (b) the observed lattice parameter a, (c) the X-ray density, (d) the specific surface area of the particles S, (e) the ionic radius of the tetrahedral site rA, (f) the ionic radius of octahedral site rB, (g) the theoretical lattice parameter ath, (h) the hopping length for tetrahedral site dA, (i) the hopping length for octahedral site dB, (j) the bond length of tetrahedral site dAX, (k) the bond length of octahedral site dBX, (l) the tetrahedral edge dAXE, (m) the shared octahedral edge dBXE, and (n) the unshared octahedral edge dBXEU of MCFO nanoparticles at different values of x and annealed samples. Supplementary Table S1–S4 present the relevant data.
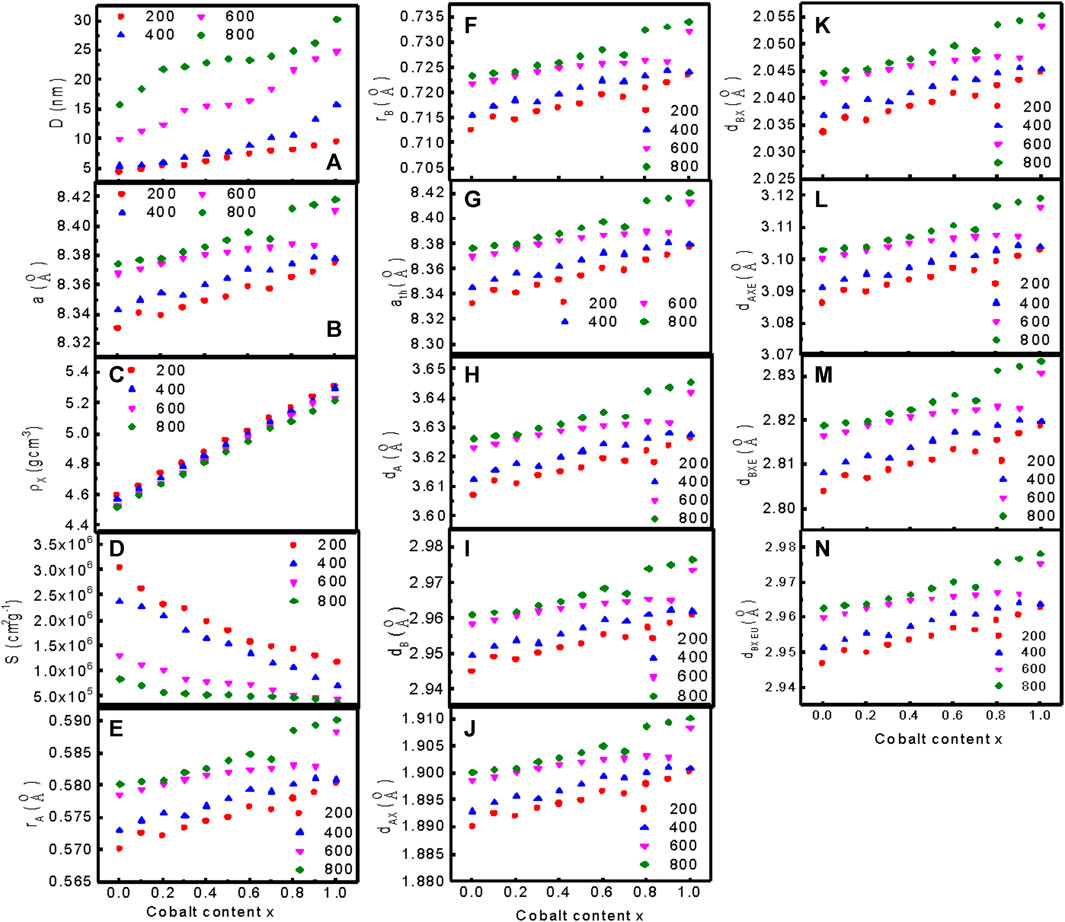
FIGURE 3. Variation of (A) the particle size D, (B) the observed lattice parameter a, (C) the X-ray density, (D) the specific surface area of the particles S, (E) the ionic radius of the tetrahedral site rA, (F) the ionic radius of octahedral site rB, (G) the theoretical lattice parameter ath, (H) the hopping length for tetrahedral site dA, (I) the hopping length for octahedral site dB, (J) the bond length of tetrahedral site dAX, (K) the bond length of octahedral site dBX, (L) the tetrahedral edge dAXE, (M) the shared octahedral edge dBXE, and (N) the unshared octahedral edge dBXEU of MCFO nanoparticles at different values of x annealed at 200°C, 400°C, 600°C, and 800°C.
Figure 3A represents the variation of particle size with Co2+ content, x of MCFO ferrite nanoparticles annealed at different temperatures. Particle size increases with an increase in x and annealing temperature. The observed lattice parameter for each plane was calculated using Bragg’s law presented in Eq. 2 Kumar et al. (2013).
Figure 3A presents the precise values of the lattice parameters determined using the Nelson-Riley function, F (θ). The intercept of the linear extrapolation of a vs. F (θ) for each plane gives the precise value of the lattice parameter (Cullity 2014; Chintala et al., 2021).
Figure 3B shows that the lattice parameter increases linearly with the increase in x and annealing temperature, which indicates that the dependence of the lattice parameter with composition follows Vegard’s Law (Denton and Ashcroft, 1991; Yadav et al., 2017). The lattice parameter increases with an increase in Co2+ content because the ionic radius of the Mg2+ (0.065 nm) ion is smaller than that of the Co2+ (0.072 nm) ion (Islam et al., 2022; Abraham et al., 2018). The lattice parameter also increases with an increase in annealing temperature because the core of the grains increases, replacing the disordered surface atoms with an increase in annealing temperature, and surface tension decreases (Li et al., 2020).
Figure 3C represents the variation of X-ray density with Co2+ content, x of MCFO nanoparticles annealed at different annealing temperatures. The X-ray density increases with an increase in x and annealing temperature. We calculated the specific surface area of the particles (S), the radius of the tetrahedral site (rA), the radius of the octahedral site (rB), the theoretical lattice parameter (ath), the hopping length for the tetrahedral site (dA), hopping length for the octahedral site (dB), the tetrahedral and the octahedral bond length(dAX and dBX), the tetrahedral edge (dAXE), and the shared and unshared octahedral edge (dBXE and dBXEU) for cubic spinel ferrite nanoparticles using the equation given in the literature (Satalkar and Kane, 2016). We used the equations in the supplementary section and Supplementary Table S1–S4 present all data at different compositions and annealing temperatures. Figures 3D–N shows the variation of S, rA, rB, dA, dB, dAX, dBX,dAXE, dBXE, and dBXEU with Co2+ content, x of MCFO nanoparticles annealed at different annealing temperatures. The value of specific surface area, S, decreases with Co2+ content, x, and annealing temperature. This is expected because, when particle size increases with x and annealing temperatures, the specific surface area decreases since the core of the nanoparticles grows at the expense of disordered surface atoms. The value of rA, rB, dA, dB, dAX, dBX, dAXE, dBXE, and dBXEU increases with an increase in Co2+ content and annealing temperature because particle size increases with an increase in Co2+ content and annealing temperature, which is associated with cation redistribution with grain growth. Co2+ has a tendency to occupy B-site, while Mg2+ ion has the tendency to occupy A-site. Changes in composition and annealing temperatures cause changes in cation distribution, which lead to the change in tetrahedral and octahedral radii, hopping length at the tetrahedral and octahedral sites, the bond length, and shared and unshared tetrahedral and octahedral edges.
Figures 4A–E presents the variation of the interionic distances between the cations, (f–i) the cation-anion distance, and (j–n) the bond angle of Mg1−xCoxFe2O4 nanoparticles annealed at 200°C, 400°C, 600°C, and 800°C. Figures 4A–E presents the interionic distances between cations b, c, d, e, and f obtained using the equation presented in the literature by (Satalkar and Kane, 2016). We presented all the equations in the supplementary section and the deduced data in Supplementary Table S5–S8. Figures 4F–I present the spaces between cations and anions p, q, r, and s using the equations in the supplementary section and the deduced data in Supplementary Table S5–S8. The cation-cation distances and cation-anion distances increase with an increase in Co2+ content and annealing temperature because the ionic radius of Co2+ (0.072 nm) is higher than that of Mg2+ (0.065 nm). Figures 4J–N show the variations in bond angles θ1, θ2, θ3, θ4, and θ5 at different compositions and annealing temperatures. Change in cation distribution with composition and annealing temperature also leads to change in the cation-cation, cation-anion distances, and the bond angles.
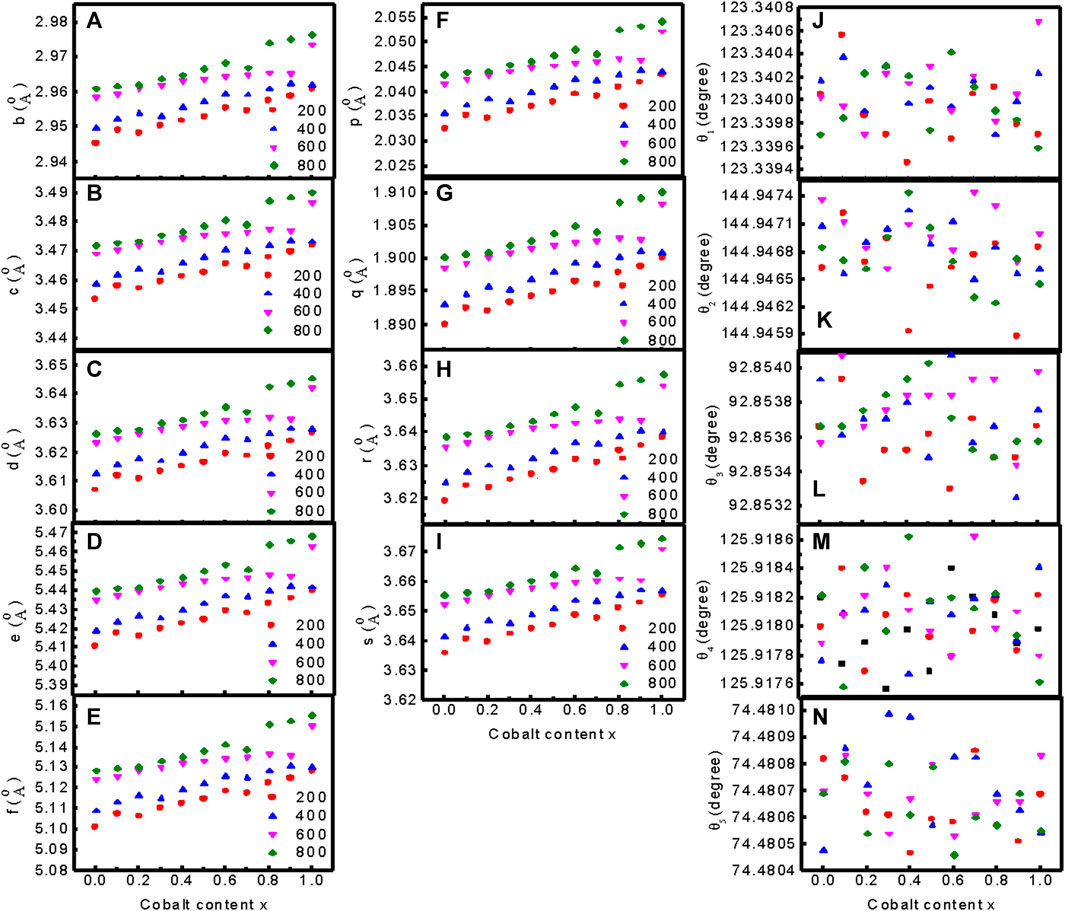
FIGURE 4. Variation of (A–E) the interionic distances between the cations b, c, d, e, and f, (F–I) the cation-anion distance p, q, r, and s, and (J–N) the bond angles θ1, θ2, θ3, θ4, and θ5 of Mg1−xCoxFe2O4 nanoparticles annealed at 200°C, 400°C, 600°C, and 800°C.
3.1.2 Transmission electron microscopy (TEM)
Figures 5A,B displays transmission electron microscopy (TEM) images of Mg1−xCoxFe2O4 nanoparticles, where x ranges from 0 to 1 with an increment of 0.1. The nanoparticles were annealed at temperatures of 200, 400C, 600, and 800°C. The inset displays selected area diffraction (SAED) patterns, exhibiting the most prominent peak (311) as well as additional planes such as (220), (400), (420), (511), and (440). The dhkl values in the SAED patterns were determined using Velox software, and the corresponding diffractograms were indexed accordingly. In addition, SAED patterns also indicate that the Debye rings are wide for smaller particle sizes. The sharpness of the rings increases as the crystallinity and particle size increase. The TEM images exhibit semi-spherical particles that exhibit grain growth as the cobalt concentration x and annealing temperatures increase. The particle size distributions for all annealing temperatures and compositions were determined by analyzing the histogram of the size distribution, which exhibits a log-normal distribution. Figures 6A–D displays the log-normal distribution of MCFO nanoparticles and Figure 6E presents the relationship between particle size and composition, as obtained from the histogram. The data also indicates that the particle size tends to rise as the cobalt content and annealing temperature increase. Figure 3A depicts the relationship between the size of crystallite and x, obtained by X-ray diffraction, at various annealing temperatures. The particle sizes measured by X-ray diffraction (XRD) in Figure 3A and transmission electron microscopy (TEM) in Figure 6E are in good agreement.
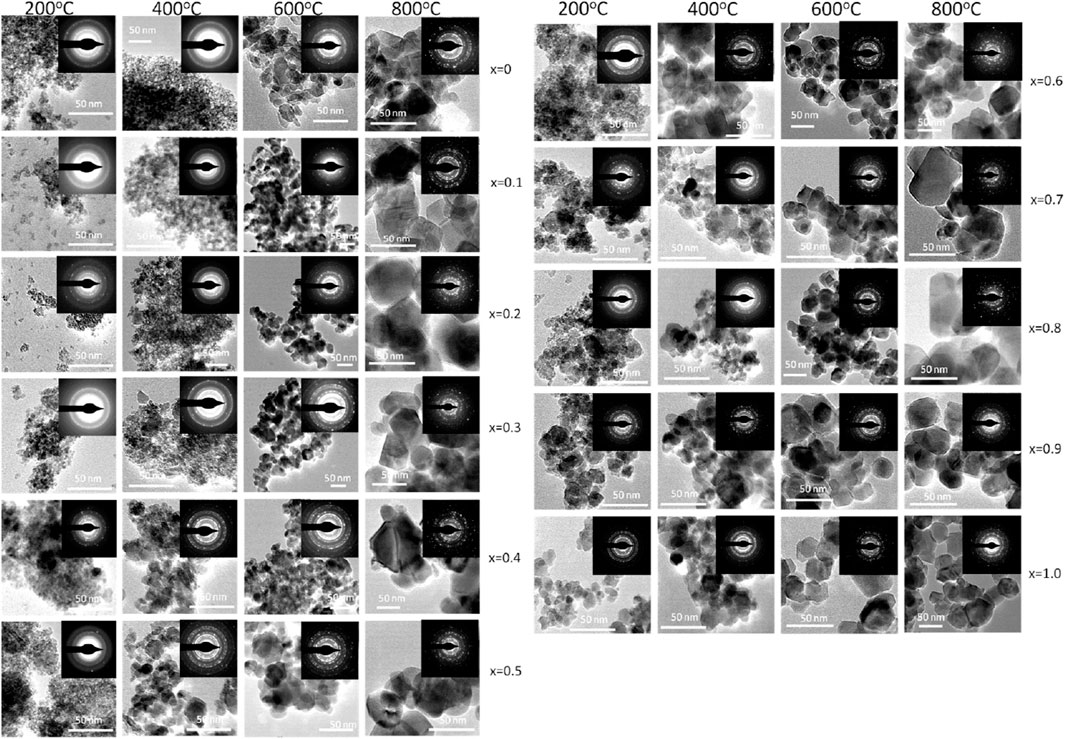
FIGURE 5. TEM image of Mg1−xCoxFe2O4 nanoparticles (where 0 ≤ x ≤ 1; ∆x = 0.1) annealed at 200°C, 400°C, 600°C, and 800°C. TEM images were acquired from drop cast samples on carbon-coated Cu grid. Particle size increases with increasing cobalt content x and annealing temperature. In the inset, selected area electron diffraction patterns (SAED) are presented.
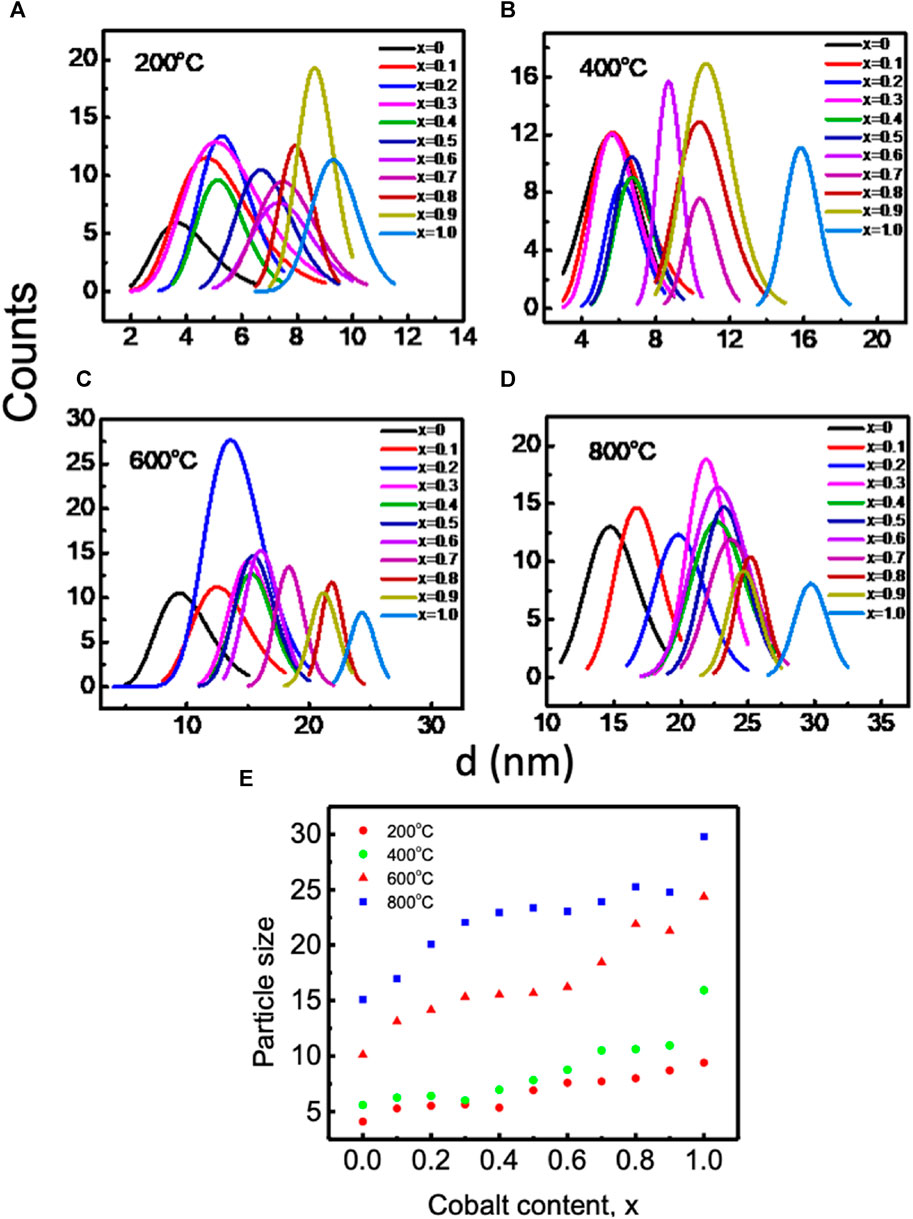
FIGURE 6. Lognormal distribution of Mg1-xCoxFe2O4 (where 0 ≤ x ≤ 1; ∆x = 0.1) nanoparticles annealed at (A) 200°C, (B) 400°C, (C) 600°C, and (D) 800°C and (E) variations of average particle size acquired from (A) to (D) with cobalt content and annealing temperatures. Particle size increases with increasing cobalt content and annealing temperature.
Figure 7 displays high-resolution transmission electron microscopy (HRTEM) images of MCFO nanoparticles subjected to different annealing temperatures: 200, 400, 600, and 800°C. The HRTEM images indicate that all the samples under investigation possess a nanocrystalline structure, with the degree of crystallinity being directly proportional to both the x and the annealing temperatures. MCFO with higher cobalt concentration and higher annealing temperatures exhibited distinctive lattice fringes in the HRTEM image, which result in a significant enhancement of crystallinity.
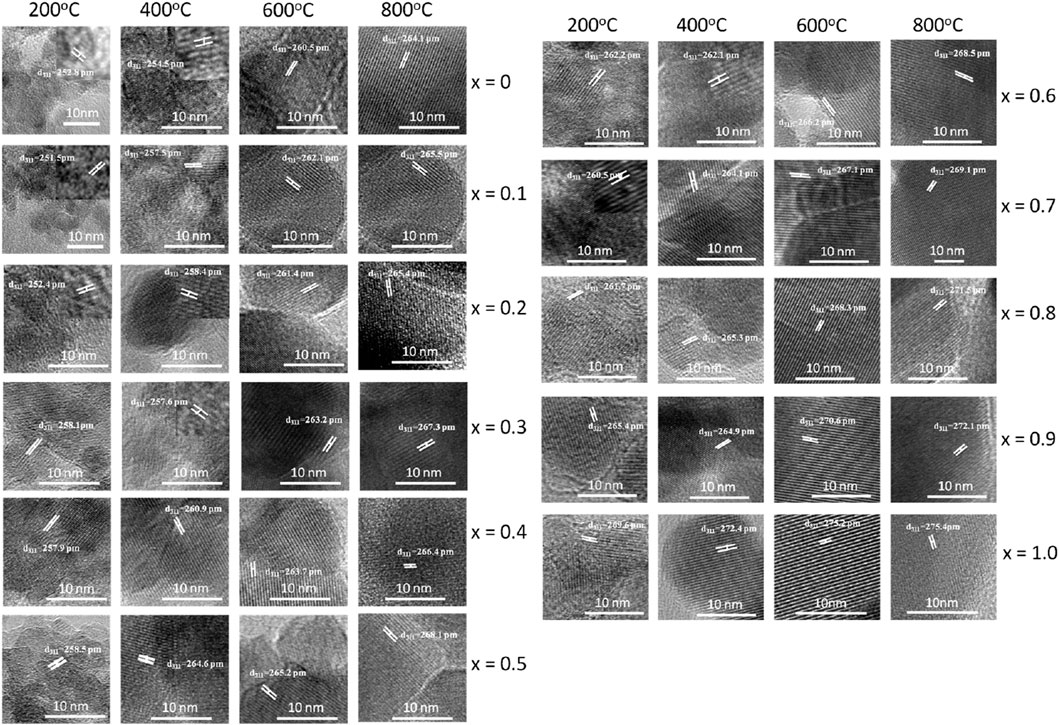
FIGURE 7. HRTEM images of Mg1-xCoxFe2O4 nanoparticles (0≤x ≤ 1; ∆x = 0.1) annealed at 200°C, 400°C, 600°C, and 800°C. In the figure, lattice spacings of the lattice fringes are marked. Lattice fringes are more pronounced with the increase of x and annealing temperature. Particle size increases with increasing cobalt content x and annealing temperature.
Figure 8 displays chitosan-MCFO nanohybrids with varying compositions (0 ≤ x ≤ 1; ∆x = 0.1) that have been subjected to annealing at a temperature of 200°C. The illustration demonstrates that the particles exhibit a higher degree of dispersion when they are coated with chitosan. These figures can be compared with the images depicted in Figure 5 of uncoated samples annealing at the same temperature of 200°C. The samples annealed at other temperatures are anticipated to exhibit a more comparable dispersion of chitosan-MCFO nanohybrid than the MCFO nanoparticles.
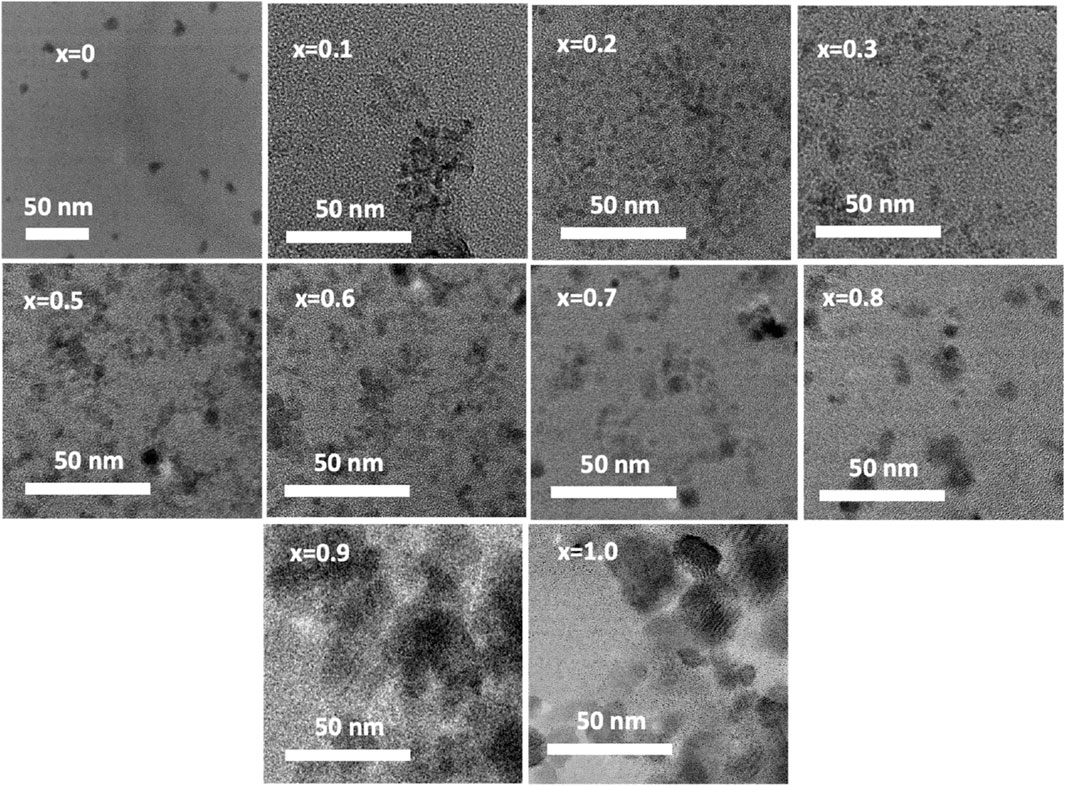
FIGURE 8. TEM images of chitosan-MCFO nanohybrids (Mg1-xCoxFe2O4; 0≤x ≤ 1; ∆x = 0.1). In this figure, MCFO nanoparticles were annealed at 200°C. The nanohybrids in this figure are more disperse compared with the images of the uncoated MCFO nanoparticles annealed at the same temperature in Figure 5. Uncoated samples are more agglomerated than the coated nanohybrids.
3.1.3 Raman spectroscopy
To conduct a more detailed structure analysis, we employed Raman spectroscopy to examine MCFO nanoparticles subjected to annealing at 200°C–800°C to find vibrational modes. Figure 9 displays the Raman spectra of MCFO nanoparticles of annealed samples. The spectra were acquired in the range 190–1,000 cm−1 at room temperature. It was well-established in the literature that MCFO ferrites possess a partially inverse spinel structure belonging to the Fd−3m space group. The vibrational modes associated with this space group are A1g (R), Eg (R), F1g, 3F2g (R), 2A2u, 2Eu, 4F1u (IR), and 2F2u. The notation “R" indicates Raman active vibrational modes, “IR” represents infrared–active vibrational modes, and the other modes are silent. The Raman spectrum would exhibit the Raman active modes A1g, Eg, F2g(3), F2g(2), and F2g(1) (Soler et al., 2004; Galinetto et al., 2018).
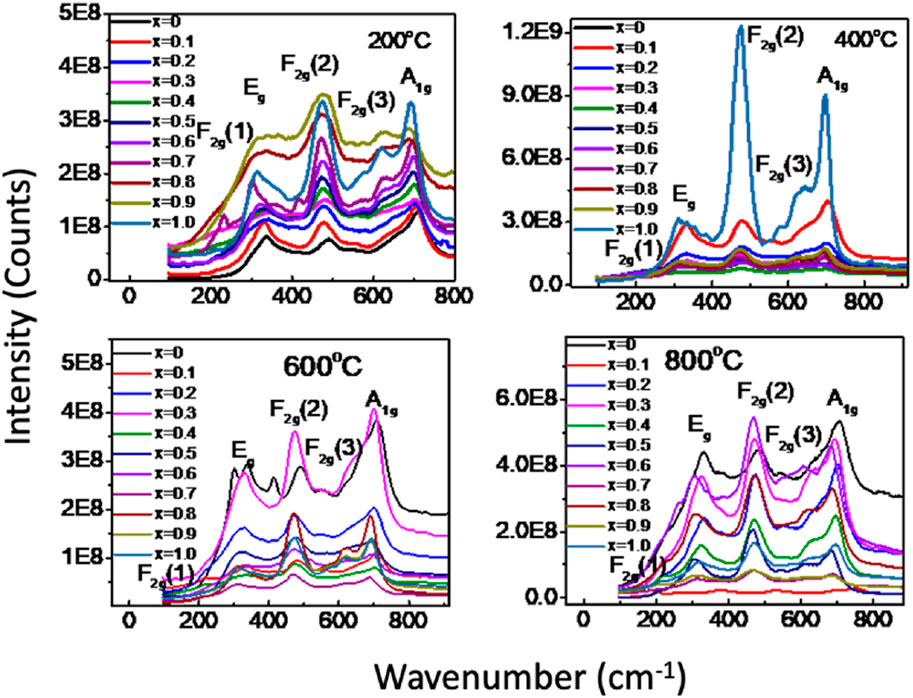
FIGURE 9. (a) Room temperature Raman spectra of Mg1-xCoxFe2O4 nanoparticles (0≤x ≤ 1; ∆x = 0.1) annealed at 200°C, 400°C, 600°C, and 800°C in the range of 190–1,000 cm−1 using the pelletized solid samples. Five Raman active modes A1g, Eg, F2g(1),F2g(2), and F2g(3) are assigned in the Raman spectra according to the previous work.
Figure 10 illustrates the rendition of the Raman spectra of annealed nanoparticles achieved by applying the Gaussian function after subtracting the background and performing deconvolution. Gaussian function yielded the validation between the experimental and theoretical data. The A1g modes correspond to the symmetric stretching of MeO4 (where Me represents Co and Mg) and FeO4 at the A-site. The Eg modes correspond to the bending of oxygen atoms with respect to the iron atom at the B-site. The F2g(3) modes correspond to the antisymmetric bending of oxygen in the presence of Fe while the F2g(2) modes depict the asymmetric stretching of Fe in conjunction with O. The F2g(1) modes exhibit the translational movement of both Fe and O. The Raman peaks within the range of 660–720 cm−1 correspond to the vibrational modes of the A-site, while the Raman peaks within the range of 460–660 cm−1 correspond to the vibrational modes of the B-site in the ferrites (Soler et al., 2004; Galinetto et al., 2018; Baig et al., 2021).
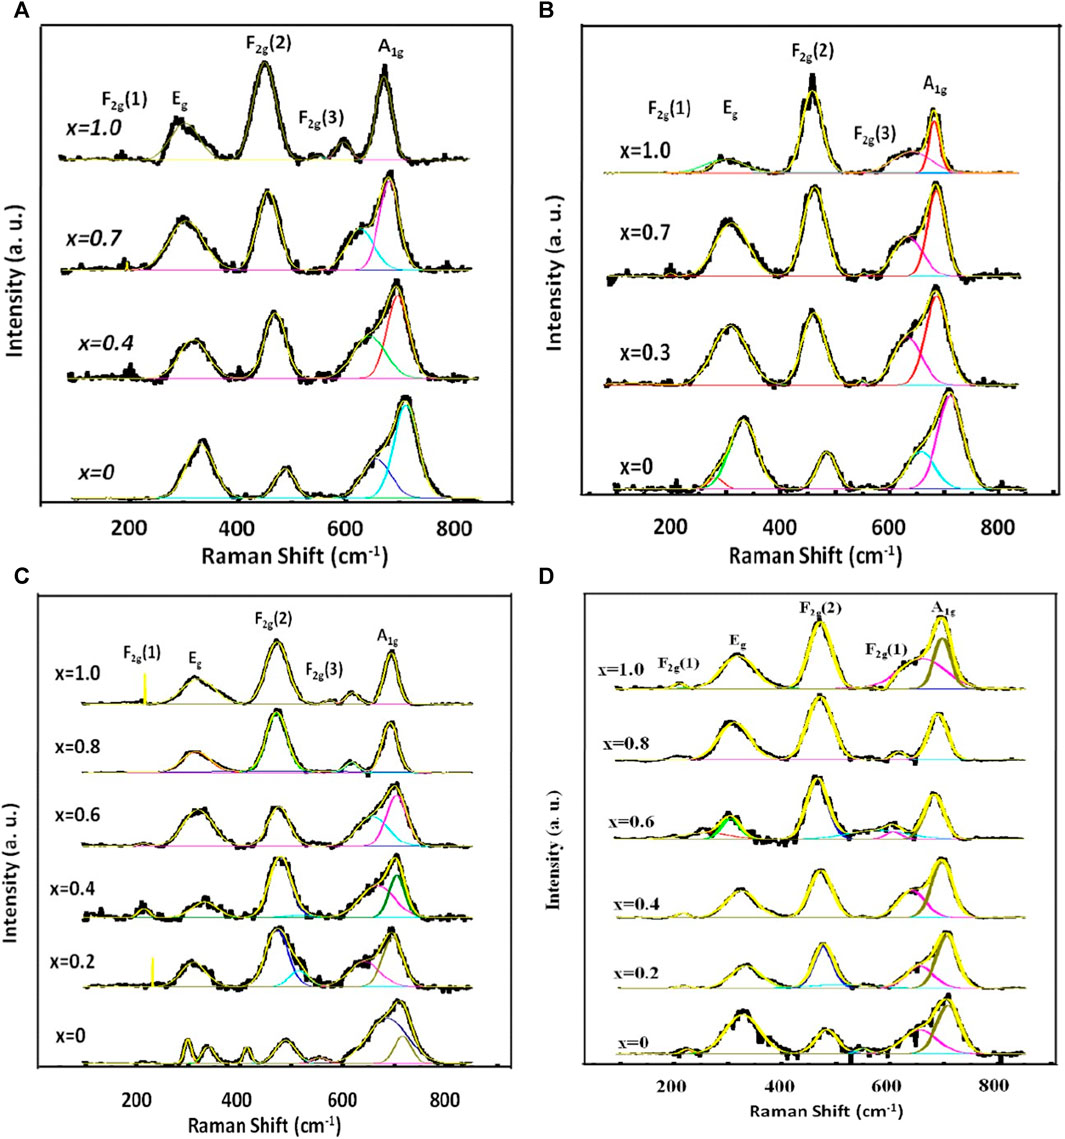
FIGURE 10. Representative curves that demonstrate the best Gaussian fitting of the experimental Raman spectra of Mg1-xCoxFe2O4 nanoparticle (0 ≤ x ≤ 1; ∆x = 0.1) annealed at (A) 200, (B) 400, (C) 600 and (D) 800°C. The Gaussian fitting was performed with background subtraction and deconvolution operation.
Figures 11A–D illustrate the relationship between the area integral and composition at the annealing temperatures ranging from 200 to 800°C. The largest A-site occupancy for both Me and Fe in Figure 11A is observed for MgFe2O4 at an annealing temperature of 200°C, corresponding to a particle size range of 4.3–9.6 nm. The rise in Co content leads to a decrease in the occupancy of both Me (Mg and Co) and Fe on the A-site, while Eg and F2g(2) increase due to the increase in B-site occupancy. These findings indicate that for 4.3–9.6 nm particle size, compositions with a higher concentration of magnesium tend to favor the normal spinel structure, while compositions with a higher concentration of cobalt tend to favor the inverse spinel structure. The area integral of additional small intensity peaks, F2g(1) and F2g(3), remain constant regardless of the composition.
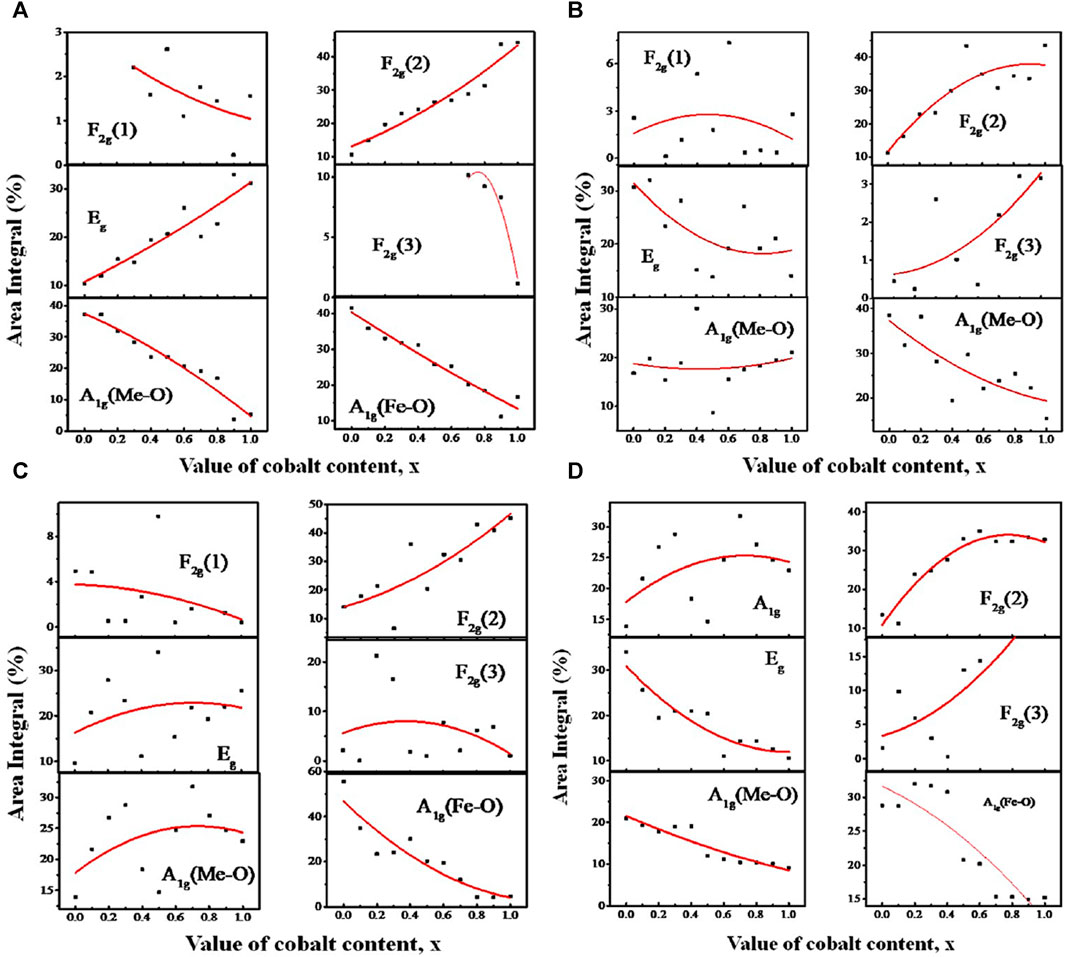
FIGURE 11. Variation of area integral with Co concentration x of the A1g, Eg, F2g(1), F2g(2), and F2g(3) peaks assigned to the Raman spectra of MCFO nanoparticles in the previous figure, obtained by Gaussian fitting and deconvolution operation. In the Figure, the variation of the area integral for the samples annealed at (A) 200, (B) 400, (C) 600, and (D) 800°C are presented.
At 400°C, for particle size range 5.5–15.8 nm in Figure 11B, the relationship between the area integral A1g and F2g(2) becomes relatively random with x. Nevertheless, there is a noticeable tendency of decreased A1g and increased F2g(2) with x. This reflects a transformation of the spinel structure from normal to inverse spinel structure. In Figure 11C, the scattered nature of the area integral with composition is more pronounced for the particle size range of 10.1–24.9 nm at an annealing temperature of 600°C. Nevertheless, it was seen that the area integral of A1g for Fe ions is dropping (A-site occupancy), while the area integral of F2g(2) is growing (B-site occupancy). This indicates a decrease in A-site occupancy and an increase in B-site occupancy with the increase of Co, resulting in a transition from a normal to an inverse spinel structure with x. At 800°C, specifically for particle sizes ranging from 15.9 to 30.3 nm, the occupancy of A-sites declines while B-sites increase with the increase of Co. This indicates a transition in the spinel structure from normal to inverse spinel with x. The Raman shift values for the Raman-active modes A1g, Eg, F2g(1), F2g(2), and F2g(3) of the Mg1−xCoxFe2O4 composition annealed at temperatures ranging from 200°C to 800°C are provided in Tables 1, Table 2, Table 3, and Table 4. These values were obtained using Gaussian fitting and deconvolution of the spectra shown in Figure 10. The frequencies of A1g vibrational modes decrease when the cobalt content, x, increases in all samples. This is due to the substitution of lighter magnesium (24.3050 emu) ions with heavier cobalt (58.9332 amu) ions with the increase of Co2+. The Raman shift of F2g(2) also exhibits a reduction as the Co2+ increases. In this case also, magnesium (24.3050 amu) ions are replaced with the heavier cobalt (58.9332 amu) ions, which have a greater atomic mass. To summarize, particles with higher magnesium content have a more pronounced normal spinel structure. Conversely, particles containing higher amounts of cobalt display a more pronounced inverse spinel structure. Raman shift basically decreases at all values of x for both A and B sites because of the greater atomic mass Co2+ than Mg2+.
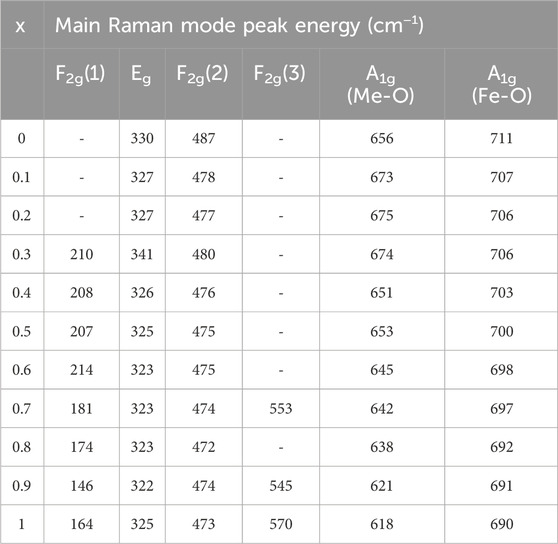
TABLE 1. Wavenumbers of the five Raman active modes A1g, Eg, F2g(1),F2g(2), and F2g(3) of nanoparticles annealed at 200°C assigned to the Raman spectra.
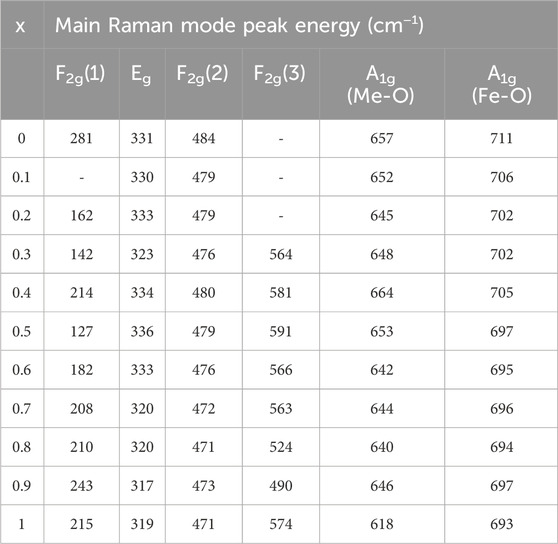
TABLE 2. Wavenumbers of the five Raman active modes A1g, Eg, F2g(1), F2g(2), and F2g(3) of nanoparticles annealed at 400°C assigned to the Raman spectra.
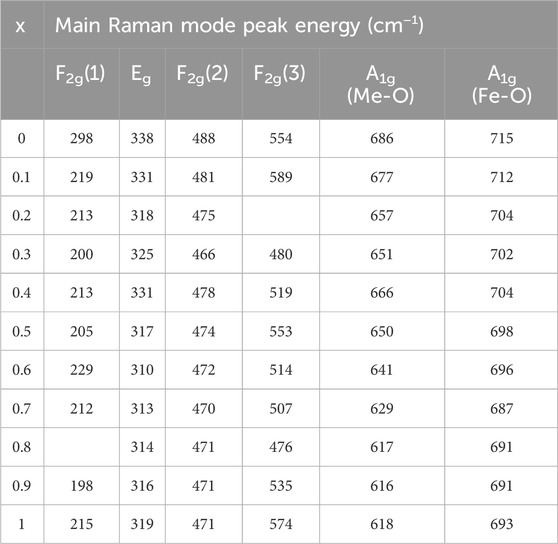
TABLE 3. Wavenumbers of the five Raman active modes A1g, Eg, F2g(1),F2g(2), and F2g(3) of nanoparticles annealed at 600°C assigned to the Raman spectra.
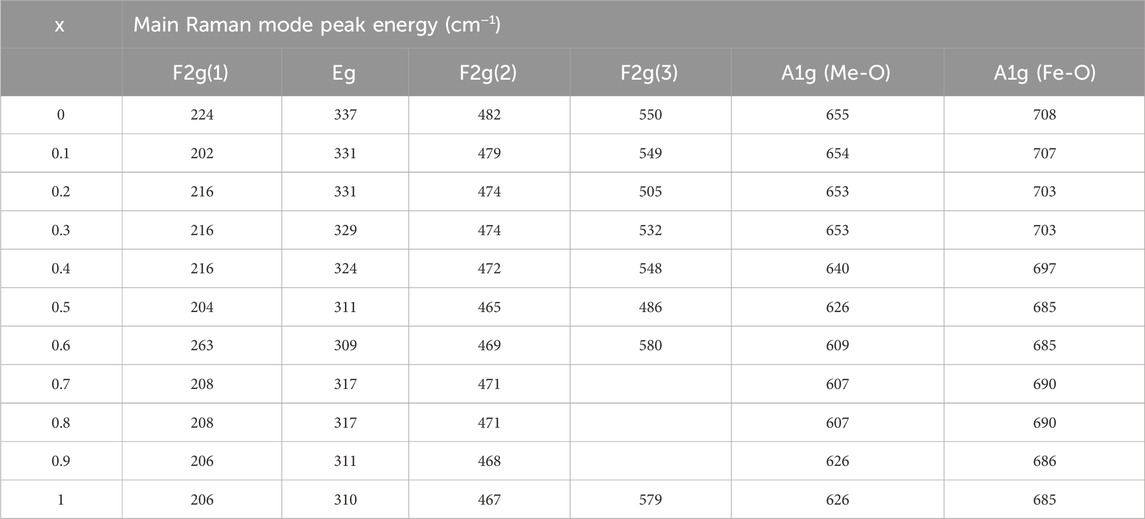
TABLE 4. Wavenumbers of the five Raman active modes A1g, Eg, F2g(1),F2g(2), and F2g(3) of nanoparticles annealed at 800°C assigned to the Raman spectra.
3.1.4 Fourier-transform infrared spectroscopy (FTIR)
Fourier-transform infrared spectroscopy (FTIR) of MCFO nanoparticles annealed at 200°C, 400°C, 600°C, and 800°C are presented in Figure 12. Absorption peaks at 3,430–3,493 cm−1 were observed due to the stretching vibration of the O-H group (Zeeshan et al., 2018). Two characteristic peaks of spinel ferrite of the cubic structure at the lower frequency region were observed. The higher frequency band is related to the stretching vibration of a metal-oxide bond at the tetrahedral (A) site and the lower frequency band is related to the stretching vibration of a metal-oxide bond at the octahedral (B) site because the bond length of the A site is shorter than the bond length of the B site (Zeeshan et al., 2018; Naseri et al., 2014; Gadkari et al., 2009; Pawlak and Mucha, 2003; Josyulu and Sobhanadri, 1981; Mund and Ahuja, 2016; Sharma et al., 2016). The frequency of both the higher frequency band and the lower frequency band shifted towards the higher frequency region with an increase in Co2+ content because Co2+ (0.072 nm) replaces Mg2+ (0.065 nm) at the A site and Fe2+ (0.0645 nm) at the B site which extends the covalent bond. Both the frequency bands shifted toward the higher frequency region with increasing annealing temperatures because particle size increases with an increase in annealing temperature.
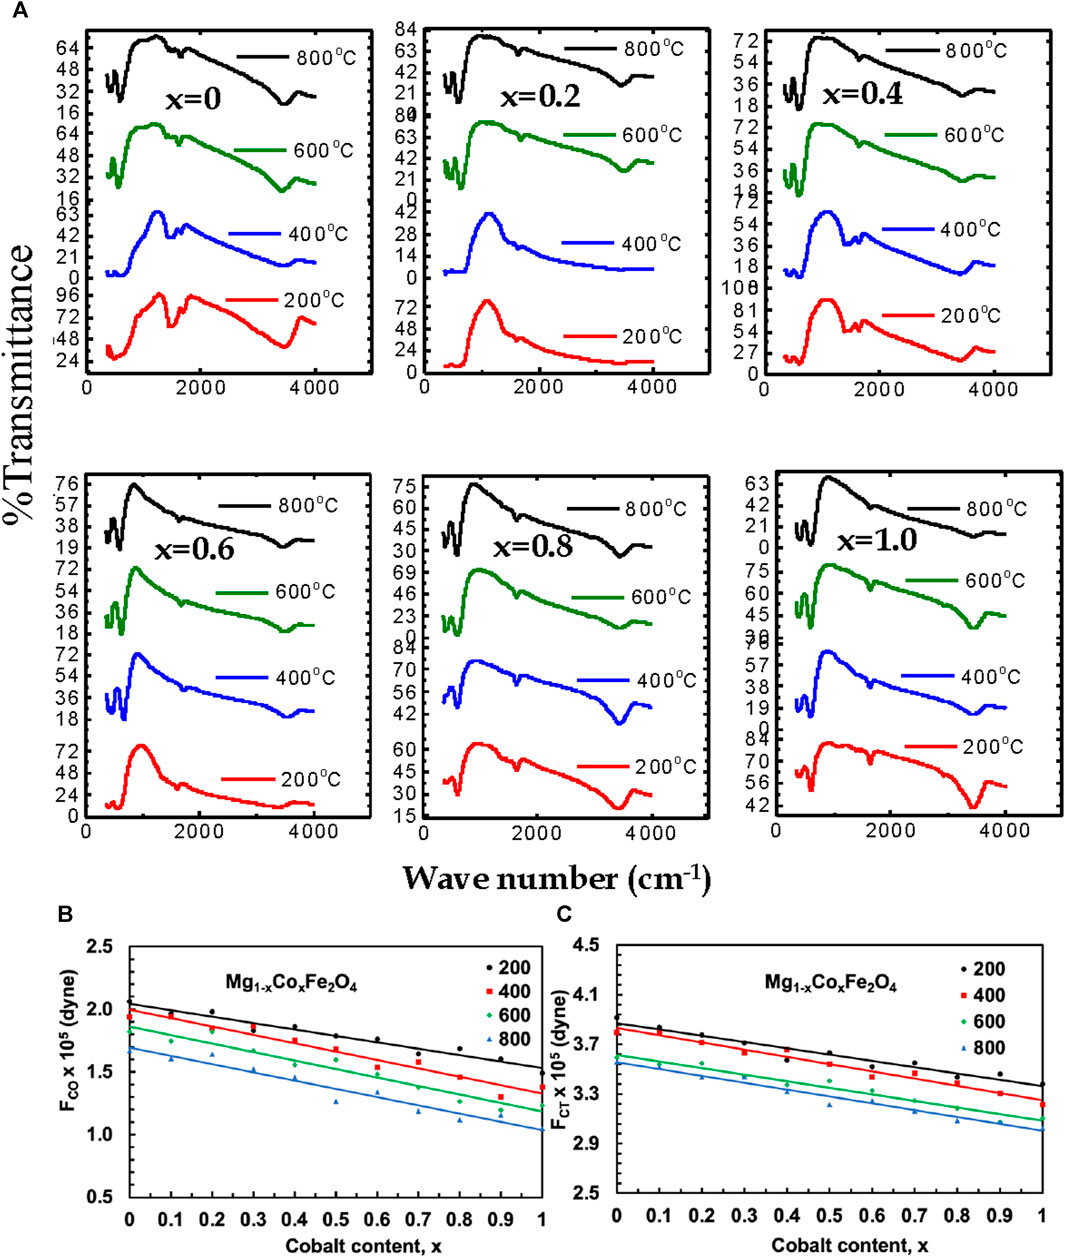
FIGURE 12. (A) The FTIR spectra of Mg1-xCoxFe2O4 nanoparticles (0 ≤ x ≤ 1; ∆x = 0.1) annealed at 200°C, 400°C, 600°C, and 800°C, (B) the variation of the octahedral force constant FCO, and (C) the variation of tetrahedral force constant FCT with cobalt content x are presented for the annealed samples.
Magnesium-rich compositions prefer normal spinel structures in their Raman spectroscopy, whereas cobalt-rich compositions demonstrate a preference for mixed spinel structures. Raman and FTIR spectroscopy produce similar outcomes. The reason is that the vibrational modes of the inverse spinel structure exhibit more clarity compared to those of the normal spinel structure, making them more readily detectable using Raman spectroscopy. FTIR spectroscopy can detect a wider variety of vibrational modes, which allows it to accurately identify both inverse and normal spinel structures. Consequently, these two methods can be employed in conjunction to discern and distinguish various spinel configurations. Additionally, they aid in the characterization of the vibrational modes of A-site and B-site at different compositions and annealing temperatures. At a temperature of 200°C, an absorption band with a lower frequency (v1) was detected in the range of 403–418 cm−1, while an absorption band with a higher frequency (ν2) was found in the range of 603–622 cm−1 for various compositions. The lower frequency absorption band (ν1) was detected at a temperature of 400°C, with a range of 398–415 cm−1. Similarly, the higher frequency absorption band (ν2) was identified within the range of 597–618 cm−1. The absorption band (ν1) with lower frequency, ranging from 395 to 412 cm−1, was seen at a temperature of 600°C. Additionally, the absorption band (ν2) with higher frequency, ranging from 593 to 610 cm−1, was also observed at the same temperature. Finally, at a temperature of 800°C, the absorption band with a lower frequency (ν1) was detected in the range of 391–408 cm−1, while the absorption band with a higher frequency (ν2) was seen in the range of 580–600 cm−1. The frequency band changed towards the lower frequency region as the particle size (annealing temperature) increased, due to the contraction of the covalent bond with larger particle sizes (annealing temperatures). Smaller particles exhibit a greater surface-to-volume ratio, which leads to incomplete coordination. In contrast, larger particles have a smaller surface area, resulting in more complete coordination and causing covalent bonds to decrease.
The force constants (FC) for the A site (FCT) and B site (FCO) are obtained using the following relation:
where c is the speed of light, v is the vibration frequency of the A site and B site, and m is the reduced mass for the Fe2+and O2− ions (Yadav et al., 2017). Variations of FCT and FCO of Mg1−xCoxFe2O4 ferrites annealed at 200°C, 400°C, 600°C, and 800°C with Co2+ content, x are presented in Figure 12B,C. The data are presented in Supplementary Table S9. The FCT and FCO increases with increasing Co2+ content x because the bond length of the A site and the B site decreases with an increase in Co2+content (Rana et al., 2010). In our previous study, Islam et al. (2022), FTIR spectra of uncoated and chitosan-coated MCFO in the as-dried condition are presented. The good bond of chitosan and MCFO is manifested from the peak shift of A and B-site bonding. FTIR spectra of uncoated and chitosan-coated MCFO in the as-dried condition are presented. The chitosan and MCFO bonded well, which was manifested in the peak shift of A and B-site bonding before and after coating. We expect a similar situation in the present study also.
3.1.5 Magnetization measurements
The variation of magnetization (M) with an applied magnetic field (H) of MCFO ferrite nanoparticles annealed at 200°C–800°C are presented in Figure 13. The magnetization increases with an increase in Co2+ content because Co2+ replaces Mg2+, and the magnetic moment of Co2+ (3.88µB) is higher than Mg2+ (0µB) (Mund and Ahuja 2016; Anis-Ur-Rehman et al., 2011). The magnetization also increases with an increase in annealing temperature because of the increase in the ordered core replacing disordered surface atoms. The saturation magnetizations (Ms) were determined by using Law of Approach to Saturation Jr. and Silva (2011). The anisotropy constants (K) were obtained by using the relation
where Hc is the coercive field (Yadav et al., 2017). Figure 14 shows the variation of (Ms), anisotropy constant (K), coercivity (Hc), and remanence ratio (Mr/Ms) with particle size of MCFO ferrite nanoparticles with compositions and annealing temperatures. The data are presented in Supplementary Table S10. The values of Ms and Mr/Ms increase with the particle size because of the increase of ferrimagnetic core at the expense of the disordered surface. Further, we observed from Raman and FTIR spectroscopy that B-site occupancy of Fe tends to increase rather than the A-site occupancy, which increases the A-B exchange interaction. The values of K and Hc increase because, with the increase of particle size, the particles become multidomain and there is an increased amount of Co. However, with the increase of Co2+, all the values of Ms, Mr/Ms, K, and Hc increase because of the higher magnetic moment of Co2+ (3.88µB) than Mg2+ (0µB). The values of K and Hc increase with an increase in Co2+ content because of the higher anisotropy of CFO (Mund and Ahuja, 2016).
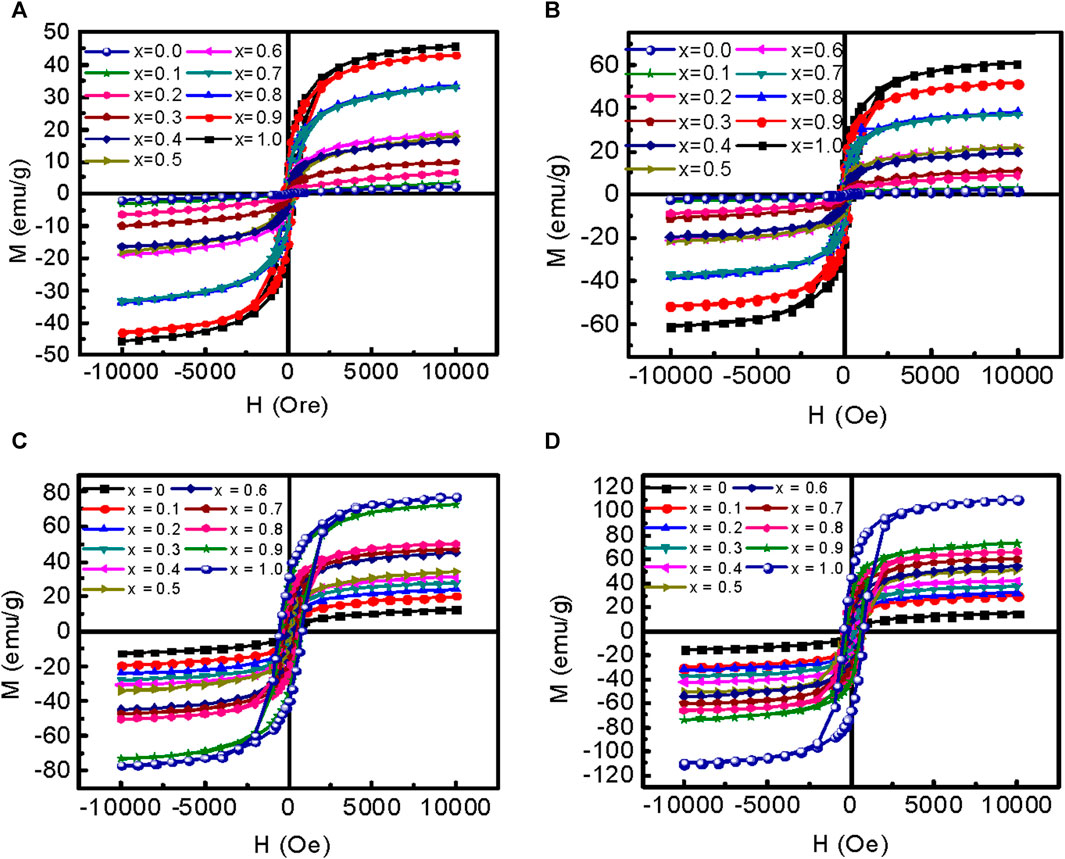
FIGURE 13. Variation of magnetization with an applied magnetic field of 10 kOe of Mg1-xCoxFe2O4 nanoparticle (0 ≤ x ≤ 1; ∆x = 0.1) annealed at (A) 200°C, (B) 400°C, (C) 600°C, and (D) 800°C are presented.
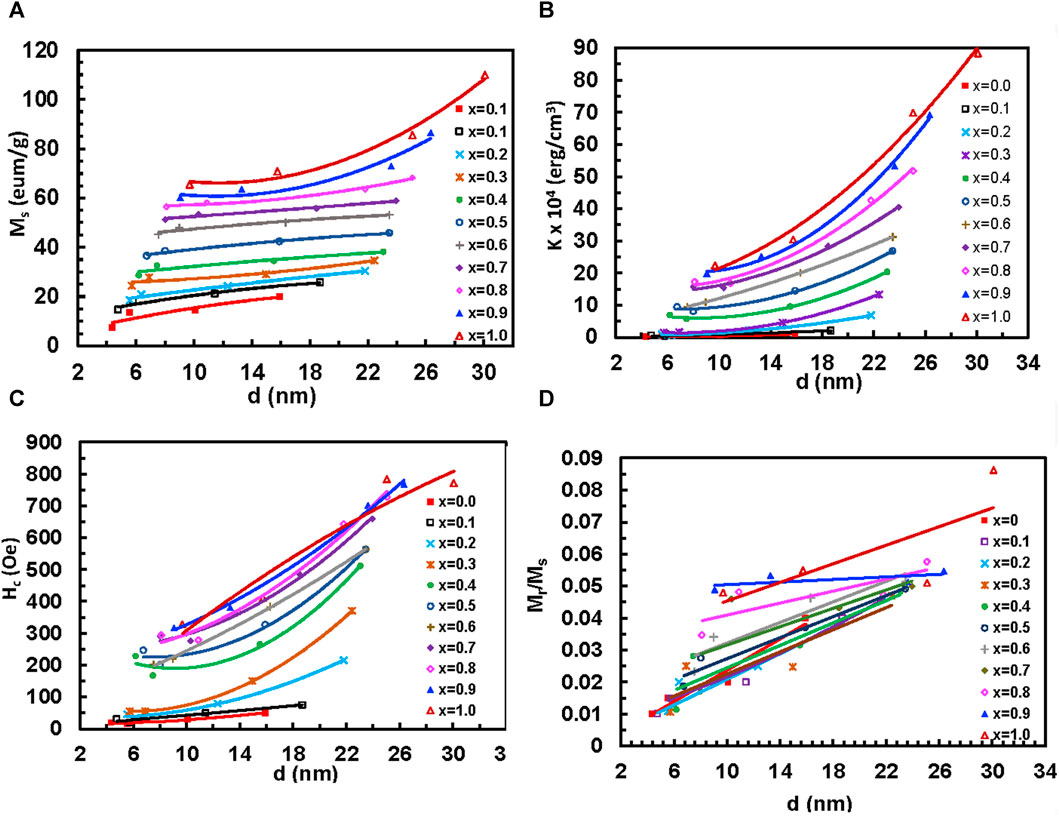
FIGURE 14. Variation of the (A) Coercive field, Hc, (B) saturation magnetization, Ms, (C) remnant ratio, Mr/Ms, and (D) anisotropy constant, K with cobalt content x of Mg1-xCoxFe2O4 nanoparticle (0 ≤ x ≤ 1; ∆x = 0.1) annealed at (A) 200°C, (B) 400°C, (C) 600°C, and (D) 800°C.
3.1.6 Hyperthermia properties
Figure 15 shows the time-dependence temperature evolution of chitosan-MCFO nanohybrids with different particle sizes for the entire range of composition for the concentration of 4 mg/mL. Similar experiments were also carried out for three more concentrations of 0.5, 1, and 2 mg/mL, which show similar heating profile. The temperature increases with time linearly first and then it reaches a plateau value. The temperature evolution of chitosan-MCFO nanohybrid increase with the particle size for all compositions. The temperature at the plateau region also increases with the Co2+ content because of the increase in magnetic moment with Co2+. Habib et al. (2008) reported similar behavior for Fe-Co alloy, magnetite, and maghemite nanoparticles.

FIGURE 15. (A–K) The temperature evolution with time of chitosan-MCFO nanohybrids (Mg1-xCoxFe2O4 nanoparticle; 0 ≤ x ≤ 1; ∆x = 0.1). The heating profiles show the evolution of temperature with particle size for the concentration of 4 mg/mL. The hyperthermia set-up consists of a sample coil of eight turns that has a 4 cm diameter. The rf magnetic field amplitude was 26 mT and the frequency 343 kHz. In each test, 600 µL of nanohybrid suspension of different concentrations were transferred in an Eppendorf tube and placed inside the sample coil. The temperature was measured with a digital thermometer immediately after switching off the power supply in each case.
Figures 16, 17 represent the variation of Tmax and specific loss power (SLP) with the particle size of chitosan-MCFO nanohybrid of different concentrations. The data are presented in Supplementary Table S11, S12. Initially, the value of Tmax and SLP increases with particle size for each sample, reaches a maximum, and then decreases. It is intriguing to note that both Tmax and SLP exhibit similar behaviors with x and particle size. However, with the increase of nanoparticle concentration in water from 0.5 to 4 mg/mL, specific loss power decreases while Tmax increases. This might be because, with the increase of concentration, Brownian relaxation will be impaired because of agglomeration of the particles at the initial stage of particle heating. This is because the initial slope of time-dependence temperature curve determines SLP. With time, when the particles get sufficient energy, this hindrance of Brownian relaxation is overcome. By the time the temperature reaches the plateau value, particles gain sufficient energy to increase Tmax with concentration.
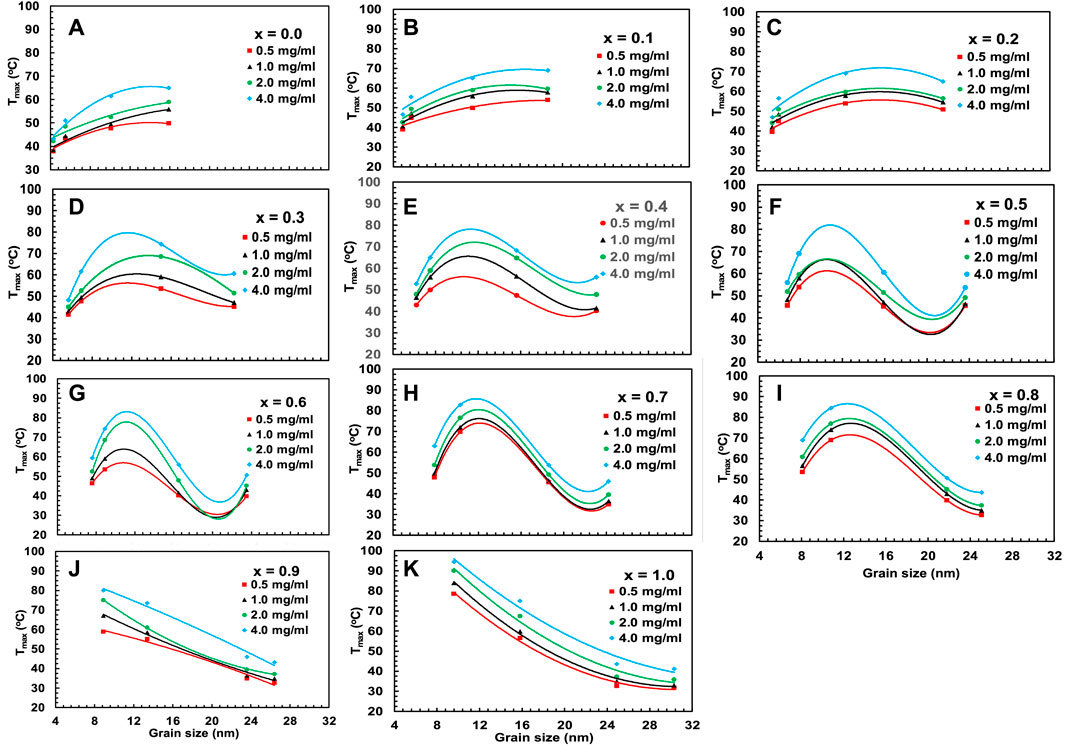
FIGURE 16. (A–K) Variation of maximum temperature Tmax acquired from Figure 15 for chitosan-MCFO nanohybrids (Mg1-xCoxFe2O4 nanoparticle; 0 ≤ x ≤ 1; ∆x = 0.1) of different concentrations of 0.5, 1, 2, and 4 mg/mL.
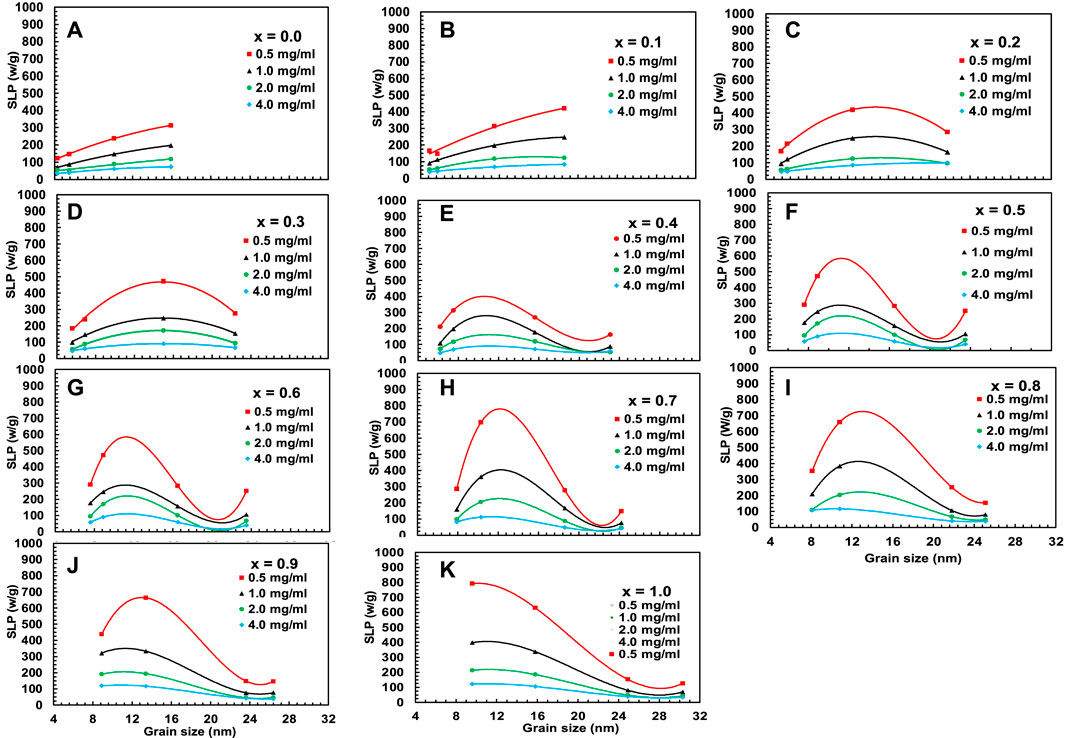
FIGURE 17. (A–K) Variation of specific loss power, SLP, acquired from Figure 15 for chitosan-MCFO nanohybrids (Mg1-xCoxFe2O4 nanoparticle; 0 ≤ x ≤ 1; ∆x = 0.1) of different concentrations of 0.5, 1, 2, and 4 mg/mL.
It will be interesting to revisit the expressions responsible for the self-heating properties of the nanoparticles and the dependence on the particle size and magnetic anisotropy with an alternating magnetic field. The self-heating properties of the nanoparticles are affected by the Néel and Brownian relaxations and hysteresis loss (Torres et al., 2019; Barati et al., 2014; Reeves and Weaver, 2014; Ferguson et al., 2013). By definition, specific loss power is the energy absorbed by the nanoparticles per unit volume and time and can be expressed as,
Where,
P is the mean volumetric dissipation power, ρ is the density of the magnetic material, χo is the initial magnetic susceptibility, H is the magnetic field amplitude, f is the frequency, and µo is the permeability of the vacuum (Ota and Takemura, 2019). The τeff is the weighted average of the Néel and Brownian relaxations and related to the Néel and Brownian relaxations by the following formula
The Néel and Brownian relaxations are very effective for the self-heating properties of nanoparticles up to small anisotropy and particle size, which can be expressed as,
and
where K is the anisotropy of the magnetic nanoparticle, V is the volume of the magnetic core, η is the viscosity of the solvent, rH is the hydrodynamic radius of the magnetic nanoparticle, kB is the Boltzmann’s constant, and T is the temperature. The above equations show that the Néel relaxation is directly proportional to the anisotropy and the particle size, while the Brownian relaxation is directly proportional to the hydrodynamic diameter, which is again related to the particle size. There exists a critical diameter above which hysteresis loss comes into play for the self-heating properties of the nanoparticles (Barati et al., 2014; Islam et al., 2020),
The critical diameter can be expressed using the following relation:
Where, K is the anisotropy constant of MCFO, fo is the frequency, kB the Boltzmann’s constant, T the temperature, and tm the measurement time (Barati et al., 2014). The given expression shows an inverse relationship between magnetic anisotropy and critical diameter. The anisotropy constant causes the critical diameter to decrease as the Co2+ concentration increases. Beyond the critical diameter, anisotropy exceeds the threshold for Néel relaxation. For lower Co2+ content and smaller particle sizes, Néel relaxation dominates the effective relaxation time, τeff. However, Brownian relaxation dominates the relaxation mechanism beyond the critical diameter. Figure 18 depicts the particle size dependence of Néel and Brownian relaxation time, as well as the effective relaxation time. It is observed in the figure that the Néel relaxation, τN, is faster while Brownian relaxation, τB, is slower. Up to x = 0.5, the Néel relaxation time, τN, and the effective relaxation time, τeff, coincide fully. For x = 0.6, τN and τeff starts separating beyond 16 nm particle size. For x = 0.7 and above there is crossover at a certain particle diameter below which τN is faster and in this range τeff coincides with τN. Above the crossover, τB is faster and in this range τeff coincides with τB. The magnetic domain’s influence on anisotropy is widely recognized. Particles are monocrystalline and monodomain, having minimal anisotropy at small sizes. However, as particle size grows, they become multidomain, resulting in the presence of anisotropy. Anisotropy rises with particle size. As the Co2+ content increases, particle size and critical diameters reduce further because of the intrinsic increase of anisotropy. In Figures 16, 17, the SLP and Tmax increase up to the critical diameter, reach a maximum, and then decrease with particle size. The foregoing rationale illustrates how anisotropy and average particle size affect these parameters.
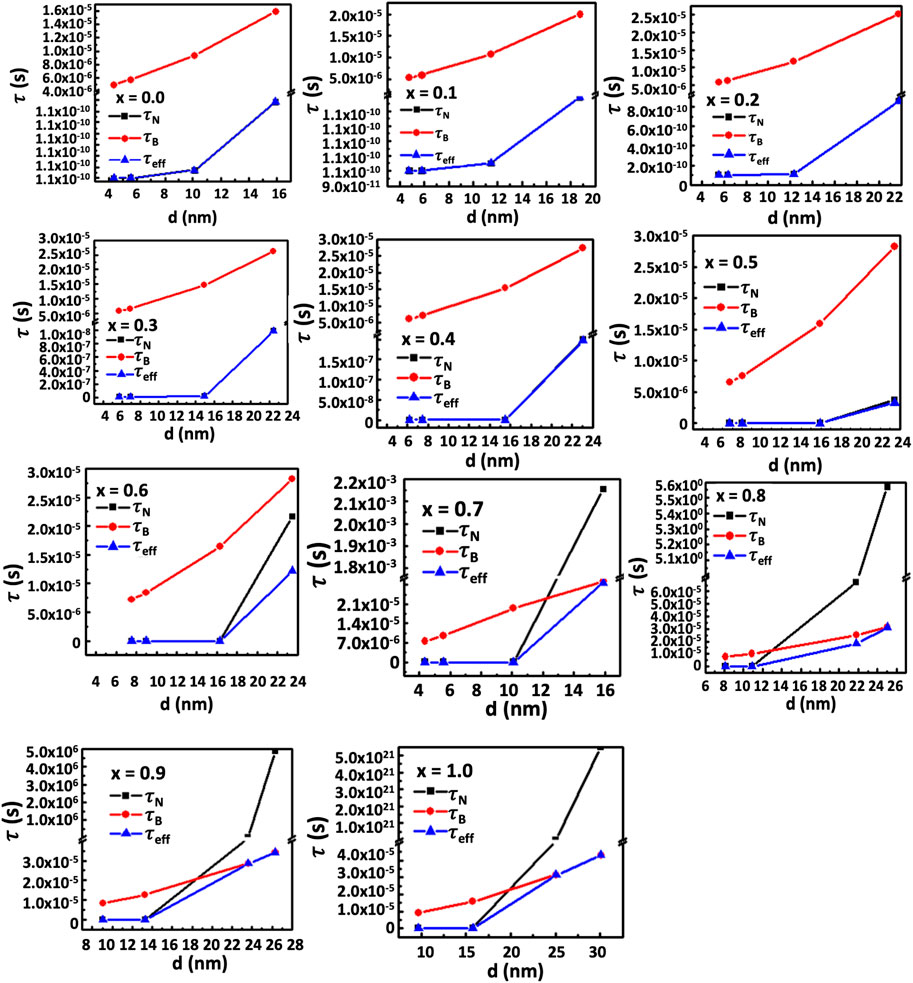
FIGURE 18. (A–K) The contribution of Néel relaxation time, τN, Brownian relaxation time, τB, to the effective relaxation time, τeff, of chitosan-MCFO nanohybrids (Mg1-xCoxFe2O4 nanoparticle; 0 ≤ x ≤ 1; ∆x = 0.1) with the particle size. It is interesting to note that up to x = 0.5, τeff coincides with τN and is faster in this range of composition and particle size than τB because of the limited anisotropy. For x > 0.6, there exists a crossover below which τeff coincides with τN. The τN is faster than τB in this range of particle size. Above the crossover, the τB is faster than τN and, therefore, τeff coincides with τB.
The range of Tmax and SLP obtained in this study can be efficiently used for the annihilation of cancer cells as we observed in our previous studies (Hoque et al., 2016; Hoque et al., 2021; Hyder and Hoque., 2017). We observed above 98% annihilation of 9L Gliosarcoma cancer cells by using CoFe2O4 and FexCo1-xFe2O4 and chitosan nanohybrid as the thermotherapeutic agent for 15 min exposure to an rf magnetic field. We expect similar annihilation of cancer cells by the chitosan-MCFO nanohybrids for comparable specific loss power and Tmax.
4 Conclusion
The lattice parameter, the particle size, the X-ray density, the ionic radius of the tetrahedral and octahedral site, the hopping length of the tetrahedral and octahedral site, the bond length of the octahedral and tetrahedral site, cation-cation distance, and cation-anion distance of the MCFO nanoparticles increases with an increase in Co2+ content and annealing temperature. The TEM, HRTEM, and SAED patterns clearly demonstrate grain growth and increased crystallinity with the Co2+ content and annealing temperature. The FTIR and Raman spectra demonstrates strong dependence of cation distribution with x, with the spinel becoming increasingly inverse with the increase of Co2+. The above structural transformation causes A-B exchange interaction to be stronger, facilitating an increase in the saturation magnetization. With the increase of Co2+ content, x, and particle size, anisotropy also increases. A limited increase of anisotropy and particle diameter help increase Néel and Brownian relaxations, facilitating effective relaxation, which increases the efficiency of hyperthermia. Beyond a critical diameter where anisotropy exceeds the threshold for Néel relaxation, the effective relaxation is dominated by the Brownian relaxation.
Data availability statement
The original contributions presented in the study are included in the article/Supplementary Material, further inquiries can be directed to the corresponding author.
Author contributions
SH: Conceptualization, Funding acquisition, Investigation, Methodology, Project administration, Resources, Supervision, Validation, Visualization, Writing–review and editing. MI: Conceptualization, Data curation, Formal Analysis, Investigation, Methodology, Software, Validation, Visualization, Writing–original draft, Writing–review and editing. MM: Methodology, Resources, Writing–review and editing. IS: Project administration, Resources, Supervision, Validation, Writing–review and editing.
Funding
The author(s) declare that no financial support was received for the research, authorship, and/or publication of this article.
Acknowledgments
The authors would like to offer their sincere gratitude to the Annual Development Project (ADP) of the Planning Commission, Government of Bangladesh, the project ID 5003 of Nano Project; Semiconductor Research Program, Department of Physics, University of Dhaka; Ministry of Science and Technology, Bangladesh; Bangladesh Atomic Energy Commission, and the International Science Program, Uppsala University, Sweden for the support to perform this research.
Conflict of interest
The authors declare that the research was conducted in the absence of any commercial or financial relationships that could be construed as a potential conflict of interest.
Publisher’s note
All claims expressed in this article are solely those of the authors and do not necessarily represent those of their affiliated organizations, or those of the publisher, the editors and the reviewers. Any product that may be evaluated in this article, or claim that may be made by its manufacturer, is not guaranteed or endorsed by the publisher.
Supplementary material
The Supplementary Material for this article can be found online at: https://www.frontiersin.org/articles/10.3389/fchem.2024.1347423/full#supplementary-material
References
Abenojar, E. C., Wickramasinghe, S., Bas-Concepcion, J., and Samia, A. C. S. (2016). Structural effects on the magnetic hyperthermia properties of iron oxide nanoparticles. Prog. Nat. Sci. Mater. Int. 26, 440–448. doi:10.1016/j.pnsc.2016.09.004
Abraham, A. G., Manikandan, A., Manikandan, E., Vadivel, S., Jaganathan, S. K., Baykal, A., et al. (2018). Enhanced magneto-optical and photo-catalytic properties of transition metal cobalt (Co2+ions) doped spinel MgFe2O4 ferrite nanocomposites. J. Magn. Magn. Mat. 452, 380–388. doi:10.1016/j.jmmm.2018.01.001
Alawi, A. M. A., Majoni, S. W., and Falhammar, H. (2018). Magnesium and human health: perspectives and research directions. Int. J. Endocrinol. 2018, 9041694. doi:10.1155/2018/9041694
Anis-Ur-Rehman, M., Malik, M. A., Khan, M., and Maqsood, K. (2011). Structural, electrical and magnetic properties of nanocrystalline Mg-Co ferrites prepared by Co-precipitation. J. Nano Res. 14, 1–9. doi:10.4028/www.scientific.net/jnanor.14.1
Anjum, S., Tufail, R., Rashid, K., Zia, R., and Riaz, S. (2017). Effect of cobalt doping on crystallinity, stability, magnetic and optical properties of magnetic iron oxide nano-particles. J. Magnetism Magnetic Mater. 432, 198–207. doi:10.1016/j.jmmm.2017.02.006
Baig, N., Kammakakam, I., and Falath, W. (2021). Nanomaterials: a review of synthesis methods, properties, recent progress, and challenges. Mat. Adv. 2, 1821–1871. doi:10.1039/d0ma00807a
Bao, Y., Wen, T., Samia, A. C., Khandhar, A., and Krishnan, K. M. (2015). Magnetic nanoparticles: material engineering and emerging applications in lithography and biomedicine. J. Mat. Sci. 51, 513–553. doi:10.1007/s10853-015-9324-2
Barati, M. R., Selomulya, C., and Suzuki, K. (2014). Particle size dependence of heating power in MgFe2O4 nanoparticles for hyperthermia therapy application. J. Appl. Phys. 115. doi:10.1063/1.4867751
Chintala, J. N. P. K., Kaushik, S. D., Varma, M. C., Choudary, G. S. V. R. K., and Rao, K. H. (2021). An accurate low temperature cation distribution of nano ni-zn ferrite having a very high saturation magnetization. J. Supercond. Nov. Magn. 34, 149–156. doi:10.1007/s10948-020-05728-3
Cullity, B. D. (2014). Elements of X-ray diffraction. United States of America: Addison-Wesley Publishing Company Inc.
Darwish, M. S. A., Kim, H., Lee, H., Ryu, C., Lee, J. Y., and Yoon, J. (2019). Synthesis of magnetic ferrite nanoparticles with high hyperthermia performance via a controlled co-precipitation method. J. Nanomater. (Basel) 16, 1176. doi:10.3390/nano9081176
Denton, A. R., and Ashcroft, N. W. (1991). Vegard’s law. Phys. Rev. A 43, 3161–3164. doi:10.1103/physreva.43.3161
Fang, R. H., Kroll, A. V., Gao, W., and Zhang, L. (2018). Cell membrane coating nanotechnology. Adv. Mat. 30, e1706759. doi:10.1002/adma.201706759
Ferguson, R. M., Khandhar, A. P., Jonasson, C., Blomgren, J., Johansson, C., and Krishnan, K. M. (2013). Size-dependent relaxation properties of monodisperse magnetite nanoparticles measured over seven 465 decades of frequency by AC susceptometry. IEEE Trans. Magn. 7, 3441–3444.
Fouad, D. E., Zhang, C., El-Didamony, H., Yingnan, L., Mekuria, T. D., and Shah, A. H. (2019). Improved size, morphology and crystallinity of hematite (α-Fe2O3) nanoparticles synthesized via the precipitation route using ferric sulfate precursor. Results Phys. 12, 1253–1261. doi:10.1016/j.rinp.2019.01.005
Gadkari, A. B., Shinde, T. J., and Vasambekar, P. N. (2009). Structural analysis of Y3+-doped Mg - Cd ferrites prepared by oxalate co-precipitation method. Mater. Chem. Phys. 114, 505–510. doi:10.1016/j.matchemphys.2008.11.011
Galinetto, P., Albini, B., Bini, M., and Mozzati, M. C. (2018). “Raman spectroscopy in zinc ferrites nanoparticles,” in Raman spectroscopy. Editor G. M. do Nascimento, (IntechOpen), 223–251. doi:10.5772/intechopen.72864
Habib, A. H., Ondeck, C. L., Chaudhary, P., Bockstaller, M. R., and Mchenry, M. E. (2008). Evaluation of iron-cobalt/ferrite core-shell nanoparticles for cancer thermotherapy. J. Appl. Phys. 103, 7–10. doi:10.1063/1.2830975
Hoque, S. M., Huang, Y., Cocco, E., Maritim, S., Santin, A. D., Shapiro, E. M., et al. (2016). Improved specific loss power on cancer cells by hyperthermia and MRI contrast of hydrophilic FexCo1-xFe2O4 nanoensembles. Contrast Media Mol. Imaging 11, 514–526. doi:10.1002/cmmi.1713
Hoque, S. M., Islam, M. K., Hoq, A., Haque, M. M., Maritim, S., Coman, D., et al. (2021). Comparative study of specific loss power and transverse relaxivity of spinel ferrite nanoensembles coated with chitosan and polyethylene glycol. Front. Nanotechnol. 3, 644080. doi:10.3389/fnano.2021.644080
Hyder, F., and Hoque, S. M. (2017). Brain tumor diagnostics and therapeutics with superparamagnetic ferrite nanoparticles. Contrast Media Mol. Imaging 2017, 6387217. doi:10.1155/2017/6387217
Islam, K., Haque, M., Kumar, A., Hoq, A., Hyder, F., and Hoque, S. M. (2020). Manganese ferrite nanoparticles (MnFe2O4): size dependence for hyperthermia and negative/positive contrast enhancement in MRI. Nanomaterials 10, 2297. doi:10.3390/nano10112297
Islam, M. A., Hasan, M. R., Haque, M. M., Rashid, R., Syed, I. M., and Hoque, S. M. (2022). Efficacy of surface-functionalized Mg1– xCoxFe2O4 (0≤ x≤ 1; ∆ x= 0.1) for hyperthermia and in vivo MR imaging as a contrast agent. RSC Adv. 12, 7835–7849. doi:10.1039/d2ra00768a
Josyulu, O. S., and Sobhanadri, J. (1981). The far-infrared spectra of some mixed cobalt zinc and magnesium zinc ferrites. Phys. Stat. Sol. (a) 65, 479–483. doi:10.1002/pssa.2210650209
Kafrouni, L., and Savadogo, O. (2016). Recent progress on magnetic nanoparticles for magnetic Hyperthermia. Prog. Biomater. 5, 147–160. doi:10.1007/s40204-016-0054-6
Kumar, G., Rani, R., Sharma, S., Batoo, K. M., and Singh, M. (2013). Electric and dielectric study of cobalt substituted MgMn nanoferrites synthesized by solution combustion technique. Ceram. Int. 39, 4813–4818. doi:10.1016/j.ceramint.2012.11.071
Li, J., Cai, C., Li, J., Li, J., Li, J., Sun, T., et al. (2018). Chitosan-Based nanomaterials for drug delivery. Molecules 23, 2661. doi:10.3390/molecules23102661
Li, X., Sun, Y., Zong, Y., Wei, Y., Liu, X., Li, X., et al. (2020). Size-effect induced cation redistribution on the magnetic properties of well-dispersed CoFe2O4 nanocrystals. J. Alloys Compd. 841, 155710. doi:10.1016/j.jallcom.2020.155710
Liu, C., Zou, B., Rondinone, A. J., and Zhang, Z. J. (2000). Chemical control of superparamagnetic properties of magnesium and cobalt spinel ferrite nanoparticles through atomic level magnetic couplings. J. Am. Chem. Soc. 122, 6263–6267. doi:10.1021/ja000784g
Liu, X., Zhang, Y., Wang, Y., Zhu, W., Li, G., Ma, X., et al. (2020). Comprehensive understanding of magnetic hyperthermia for improving antitumor therapeutic efficacy. Theranostics 10, 3793–3815. doi:10.7150/thno.40805
Martinez-Boubeta, C., Simeonidis, K., Makridis, A., Angelakeris, M., Iglesias, O., Guardia, P., et al. (2013). Learning from nature to improve the heat generation of iron-oxide nanoparticles for magnetic hyperthermia applications. Sci. Rep. 3, 1652. doi:10.1038/srep01652
Mcbain, S. C., Yiu, H. H., and Dobson, J. (2008). Magnetic nanoparticles for gene and drug delivery. Int. J. Nanomedicine 3, 169–180. doi:10.2147/ijn.s1608
Mohapatra, J., Xing, M., and Liu, J. P. (2019). Inductive thermal effect of ferrite magnetic nanoparticles. Materials 12, 3208. doi:10.3390/ma12193208
Mund, H. S., and Ahuja, B. L. (2016). Structural and magnetic properties of Mg doped cobalt ferrite nanoparticles prepared by sol-gel method. Mat. Res. Bull. 85, 228–233. doi:10.1016/j.materresbull.2016.09.027
Naseri, M. G., Ara, M. H. M., Saion, E. B., and Shaari, A. H. (2014). Superparamagnetic magnesium ferrite nanoparticles fabricated by a simple, thermal-treatment method. J. Magn. Magn. Mat. 350, 141–147. doi:10.1016/j.jmmm.2013.08.032
Nemala, H., Thakur, J. S., Naik, V. M., Vaishnava, P. P., Lawes, G., and Naik, R. (2015). Investigation of temperature dependent magnetic hyperthermia in Fe3O4 ferrofluids. J. Appl. Phys. 116, 034309. doi:10.1063/1.4890456
Nlebedim, I. C., Ranvah, N., Williams, P. I., Melikhov, Y., Snyder, J. E., Moses, A. J., et al. (2010). Effect of heat treatment on the magnetic and magnetoelastic properties of cobalt ferrite. J. Magn. Magn. Mat. 322, 1929–1933. doi:10.1016/j.jmmm.2010.01.009
Ota, S., and Takemura, Y. (2019). Characterization of Néel and Brownian relaxations isolated from complex dynamics influenced by dipole interactions in magnetic nanoparticles. J. Phys. Chem. C 123, 28859–28866. doi:10.1021/acs.jpcc.9b06790
Pawlak, A., and Mucha, M. (2003). Thermogravimetric and FTIR studies of chitosan blends. Thermochim. Acta 396, 153–166. doi:10.1016/s0040-6031(02)00523-3
Rajan, A., and Sahu, N. K. (2020). Review on magnetic nanoparticle-mediated Hyperthermia for cancer therapy. J. Nanoparticle Res. 22, 319. doi:10.1007/s11051-020-05045-9
Rana, S., Philip, J., and Raj, B. (2010). Micelle based synthesis of cobalt ferrite nanoparticles and its characterization using Fourier Transform Infrared Transmission Spectrometry and Thermogravimetry. Mat. Chem. Phys. 124, 264–269. doi:10.1016/j.matchemphys.2010.06.029
Reeves, D. B., and Weaver, J. B. (2014). Approaches for modeling magnetic nanoparticle dynamics. Crit. Rev. Biomed. Eng. 42, 85–93. doi:10.1615/critrevbiomedeng.2014010845
Rhee, S., Hong, S., and Chang, Y. (2010). Chitosan-coated ferrite (Fe3O4) nanoparticles as a T2 contrast agent for magnetic resonance imaging. J. Korean Phys. Soc. 56, 868–873. doi:10.3938/jkps.56.868
Satalkar, M., and Kane, S. N. (2016). On the study of Structural properties and Cation distribution of Zn0.75-xNixMg0.15Cu0.1Fe2O4 nano ferrite: effect of Ni addition. J. Phys. Conf. Ser. 755, 012050. doi:10.1088/1742-6596/755/1/012050
Sensenig, R., Sapir, Y., MacDonald, C., Cohen, S., and Polyak, B. (2012). Magnetic nanoparticle-based approaches to locally target therapy and enhance tissue regeneration in vivo. Nanomedicine (Lond) 7, 1425–1442. doi:10.2217/nnm.12.109
Sensenig, R., Sapir, Y., MacDonald, C., Cohen, S., and Polyak, B. (2014). Heating efficiency in magnetic nanoparticle hyperthermia. J. Magn. Magn. Mat. 354, 163–172. doi:10.1016/j.jmmm.2013.11.006
Sharma, R., Thakur, P., Kumar, M., Thakur, N., Negi, N. S., Sharma, P., et al. (2016). Improvement in magnetic behaviour of cobalt doped magnesium zinc nano-ferrites via co-precipitation route. J. Alloys Compd. 684, 569–581. doi:10.1016/j.jallcom.2016.05.200
Soler, M. A. G., Melo, T. F. O., da Silva, S. W., Lima, E. C. D., Pimenta, A. C. M., Garg, V. K., et al. (2004). Structural stability study of cobalt ferrite-based nanoparticle using micro Raman spectroscopy. J. Magn. Magn. Mat. 272–276, 2357–2358. doi:10.1016/j.jmmm.2003.12.582
Tatarchuk, T., Bououdina, M., Vijaya, J. J., and Kennedy, L. J. (2017). “Spinel ferrite nanoparticles: synthesis, crystal structure, properties, and perspective applications,” in Nanophysics, nanomaterials, interface studies, and applications. NANO 2016. Springer proceedings in Physics, O. Fesenko, and L. Yatsenko, (Cham: Springer), 195. doi:10.1007/978-3-319-56422-7_22
Torres, T. E., Lima, E., Calatayud, M. P., Sanz, B., Ibarra, A., Fernández-Pacheco, R., et al. (2019). The relevance of Brownian relaxation as power absorption mechanism in Magnetic Hyperthermia. Sci. Rep. 9, 3992. doi:10.1038/s41598-019-40341-y
Tran, N., and Webster, T. J. (2010). Magnetic nanoparticles: biomedical applications and challenges. J. Mat. Chem. 20, 8760–8767. doi:10.1039/c0jm00994f
Valério, A., and Morelhao, S. L. (2019). Usage of Scherrer’s formula in X-ray diffraction analysis of size distribution in systems of monocrystalline nanoparticles. arXiv , arXiv:1911.00701.
Vijaya, M. L. K., and Thyagarajan, K. K. (2015). An investigation of structural and magnetic properties of Cr - Zn ferrite nanoparticles prepared by a sol - gel process. J. Nanostructure Chem. 5, 365–373. doi:10.1007/s40097-015-0168-8
Yadav, R. S., Kurtka, I., Vilcakova, J., Havlica, J., Masilko, J., Kalina, L., et al. (2017). Impact of grain size and structural changes on magnetic, dielectric, electrical, impedance and modulus spectroscopic characteristics of CoFe2O4 nanoparticles synthesized by honey mediated sol-gel combustion method. Adv. Nat. Sci. Nanosci. Nanotechnol. 8, 045002. doi:10.1088/2043-6254/aa853a
Keywords: hyperthermia, specific loss power, magnesium ferrite, cobalt ferrite, Raman spectra
Citation: Islam MA, Syed IM, Mamun MA and Hoque SM (2024) Effect of particle size and composition on local magnetic hyperthermia of chitosan-Mg1−xCoxFe2O4 nanohybrid. Front. Chem. 12:1347423. doi: 10.3389/fchem.2024.1347423
Received: 30 November 2023; Accepted: 07 February 2024;
Published: 07 March 2024.
Edited by:
R. M. G. Rajapakse, University of Peradeniya, Sri LankaReviewed by:
Shashiprabha Dunuweera, TCG GreenChem, Inc., United StatesSanjitha Rajapakshe, University of Kansas, United States
Copyright © 2024 Islam, Syed, Mamun and Hoque. This is an open-access article distributed under the terms of the Creative Commons Attribution License (CC BY). The use, distribution or reproduction in other forums is permitted, provided the original author(s) and the copyright owner(s) are credited and that the original publication in this journal is cited, in accordance with accepted academic practice. No use, distribution or reproduction is permitted which does not comply with these terms.
*Correspondence: S. Manjura Hoque, bWFuanVyYV9ob3F1ZUB5YWhvby5jb20=