 A. Abdeshahi1
 M. Habibi Zare
94% of researchers rate our articles as excellent or good
Learn more about the work of our research integrity team to safeguard the quality of each article we publish.
Find out more
ORIGINAL RESEARCH article
Front. Chem. , 06 December 2023
Sec. Inorganic Chemistry
Volume 11 - 2023 | https://doi.org/10.3389/fchem.2023.1292620
In this research, the recovery of uranium from the phosphate ore of the Sheikh Habil-Iran mine using flotation/calcination-leaching processes has been investigated. A 75–150 μm phosphate ore particle size, sodium oleate as a collector with a concentration of 2,000 g/ton of rock, pH = 10, and 5 min flotation time were obtained as the optimum parameters of flotation using the reverse method, leading to phosphate ore with a grade of 180 ppm UO2, 36.1% P₂O₅, 7.22% SiO2, and CaO/P₂O₅ = 1.23. The optimum calcination parameters were selected as 100 μm phosphate ore particles size at D80, 900°C temperature, and 2 h heating time, which resulted in phosphate ore with a grade of 173 ppm UO2 and 31.9% P₂O₅. An L/S (liquid to solid ratio) = 5, 3 M sulfuric acid concentration, 80°C temperature, and 5 h leaching time were obtained as the optimum leaching parameters using the response surface methodological approach. The efficiency of uranium recovery from phosphate ore pre-treated by flotation and calcination methods was 84.2% and 75.2%, respectively. The results indicated that flotation has superiority over calcination as a pre-treatment method of phosphate ore in the Sheikh Habil-Iran mine.
1) Recovery of uranium from phosphate ore of Sheikh Habil-Iran mine
2) Implementation of RSM approach for optimization of uranium extraction
3) Leaching process select for uranium recovery from phosphate ore
4) Complex experiments were performed with four parameters (L/S, Concentration, Time and Temperature) of effective
Today, uranium is mainly obtained from primary resources (Fatemi et al., 2019; Fatemi et al., 2020a; Fatemi et al., 2020b; Sadeghi et al., 2020; Sadeghi et al., 2021). Due to the depletion of primary resources, the world has turned to secondary resources such as phosphate ores, sea water, petroleum coke, etc. Approximately 9,700 tpa uranium oxide can be extracted from phosphoric acid (Beltrami et al., 2013; Kawatra and Carlson, 2013; Beltrami et al., 2014; Arhouni et al., 2023; Lammers et al., 2023).
The amount of phosphate reserves in the world is estimated to be 71 billion tons. Phosphate ores are mainly divided into sedimentary and igneous, where the amount of sedimentary phosphates is close to 95% (Pufahl and Groat, 2017). Phosphorite deposits are chemically formed in a relatively deep marine environment under calm conditions. The phosphorus and uranium content in marine phosphorite horizons, such as those found in a formation like the Pabdeh Formation, do not show significant variations over distances of several kilometers. Sedimentary phosphorite deposits contain uranium-bearing fluorapatite (francolite) concretions, where uranium replaces calcium during the formation stages, forming uranium-containing complexes. Therefore, only sedimentary phosphorites, based on their sedimentary nature and origin, contain uranium. Sedimentary phosphate ores with a low phosphate grade (less than 30%) require some pre-treatment to remove tailings before producing phosphoric acid. The type of pre-treatment depends on ore properties such as density, particle size, morphology, surface chemistry, magnetic properties, electrical conductivity, color, and porosity of particles (Ptacek, 2016). Today, most (more than 75%) phosphate ores are processed using the wet-phosphoric acid (WPA) process, with sulfuric acid as the digestive acid. Prior to this process, the phosphate ore needs to be beneficiated or pre-concentrated, which is mostly performed using flotation or calcination (Kawatra and Carlson, 2013; Zhang et al., 2023).
A schematic of phosphoric acid production from phosphate ore is shown in Figure 1 (Beltrami et al., 2014; Haneklaus et al., 2017; Steiner et al., 2020). After ore preparation, the ore is leached to produce a phosphoric acid solution. As mentioned above, approximately 75% of the global phosphoric acid industries use sulfuric acid for leaching phosphate rocks, as shown in reaction 1, where the sulfuric acid attacks the carbonate minerals to precipitate calcium sulfate and produce phosphoric acid (Beltrami et al., 2013; Beltrami et al., 2014).
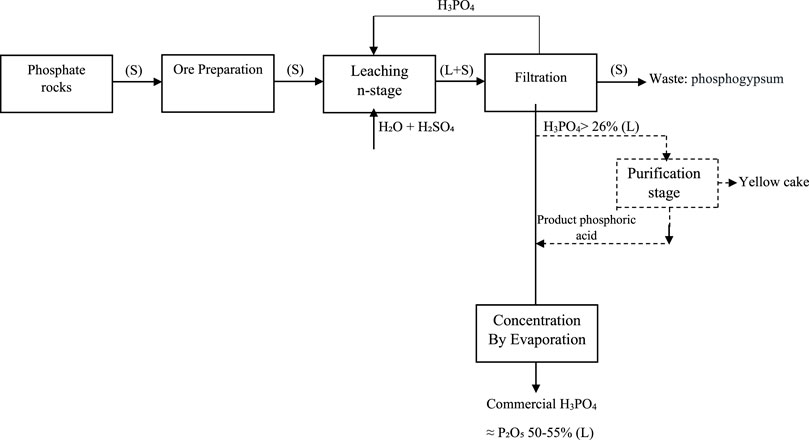
FIGURE 1. Schematic of phosphoric acid production from phosphate ore.
Another method for producing phosphoric acid is the dry method. To produce food-grade phosphoric acid, the phosphate ore is first reduced with coke in an electric arc furnace to give elemental phosphorus. Silica is also added, resulting in the production of calcium silicate slag. Elemental phosphorus is distilled out of the furnace and burned with air to produce high-purity phosphorus pentoxide, which is dissolved in water to give phosphoric acid.
Finally, phosphoric acid produced with an approximate concentration of 24%–28% P2O5 is considered a feed for the recovery of uranium from WPA using various methods such as solvent-extraction, ion-exchange, and membrane separation (Bautista, 1993; Kabay et al., 1998; Beltrami et al., 2014).
One of the most famous and widely used methods is solvent extraction (SX), which is an efficient process for the recovery of hexavalent uranium from a phosphoric acid medium (Yan-Zhao et al., 2002; Beltrami et al., 2013). In this regard, different organic solvents have been tested to date, among which the synergistic mixture of di-2-ethylhexyl phosphoric acid (D2HEPA) and tri-octyl-phosphine oxide (TOPO) are the typical solvents used to separate uranium, see reaction 2 (Ali et al., 2012; Beltrami et al., 2012; Beltrami et al., 2013; Beltrami et al., 2014). The molecular formulas of D2EHPA and TOPO are displayed in Figure 2.
where HL and L are the monomeric and deprotonated forms of D2EHPA, respectively.
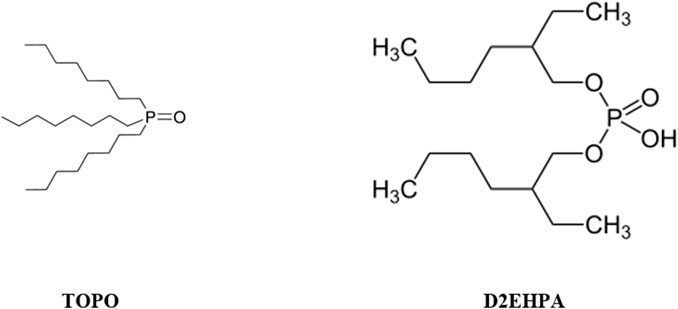
FIGURE 2. Molecular schematics of D2EHPA and TOPO solvents.
The extraction of other metallic elements using solvent extraction complexes, such as D2EHPA + TOPO, depends on specific conditions such as the concentration of metallic elements and operational parameters. These elements are typically considered side impurities, with iron (Fe), nickel (Ni), aluminum (Al), and cobalt (Co) the most commonly known. However, generally, there is a much greater inclination toward extracting uranium (U) in these complexes compared to other metallic elements. This high preference is based on the different physicochemical properties of the metallic elements and the formation of various complexes with D2EHPA + TOPO.
Furthermore, various separation techniques can be employed for the separation of these side metallic elements. These techniques include the use of dual-extraction solvents, ion exchange technologies, adsorption processes, and utilization of electrochemical methods.
In this research, the production of phosphoric acid and the recovery of uranium from the phosphate ore of the Sheikh Habil-Iran mine has been investigated. Flotation and calcination as pre-treatment processes for the phosphate ore are used and optimized separately. The pre-treated phosphate ore was leached using sulfuric acid. The leaching parameters were optimized to produce a suitable grade of phosphoric acid and to maximize the uranium recovery using a response surface methodological approach (RSM). The solvent extraction of uranium from phosphoric acid and the precipitation of ammonium uranyl carbonate are described in the second part of the research, published separately.
The Sheikh Habib phosphate deposit is composed of fluorapatite (62%), occurring as well-rounded and moderately sorted phosphate pellets. Phosphate is also found as apatite in echinoid fragments and phosphate-rich nodules. Additionally, a secondary process called cementation has occurred in the deposit, resulting in particle bonding and the formation of cement. The cement includes carbonate cement (calcite and some dolomite) and minor amounts of anhydrite cement.
According to the results of XRD analysis, the major gangue minerals in the deposit include calcite (27%–30%), quartz (6%–9%), and clay minerals such as illite and muscovite (1%).
The geological origin of the Sheikh Habib phosphate deposit can be attributed to various geological factors and processes that have contributed to its formation and evolution.
Sodium oleate (C18H33NaO2), sodium sulfate (Na2SO4), potassium hydroxide (KOH), hydrochloric acid (HCl), soda (NaOH), sodium silicate (Na2SiO3), citric acid (C6H8O7), methyl isobutyl carbinol (MIBC), and starch (C6H10O5)n were purchased from Sigma-Aldrich. Sulfuric acid (98 wt%) was purchased from Kimia Tehran Acid Co. Phosphoric acid (H3PO4) was obtained from the Razi factory.
X-ray fluorescence spectrometry (XRF, Hitachi SEA 1000A) was used to determine the composition of the phosphate ore. The Hitachi SEA 1000A XRF device is an X-ray fluorescence analyzer used for the analysis of chemical elements and compounds in samples. This device offers high precision, a wide range of analyzable elements, high analysis speed, and user-friendliness. X-ray fluorescence technology can detect various elements and chemical compounds in samples, providing analysis results with ppm levels of accuracy. The Hitachi SEA 1000A device is suitable for applications that require rapid and accurate analysis of different chemical elements and compounds in samples.
The uranium concentration was measured using inductively coupled plasma spectrometry (ICP-OES, PerkinElmer 2000 DV). The PerkinElmer 2000DV is a laboratory instrument used for the analysis of chemical elements in samples. It utilizes ICP-OES technology, combining inductively coupled plasma and optical emission spectroscopy, to identify the elements present in a sample and determine their concentrations. The PerkinElmer 2000DV offers high precision, sensitivity, a broad range of analyzable elements, fast analysis speed, and automation capabilities. It finds applications in various fields, including analytical chemistry, earth sciences, environmental chemistry, food and pharmaceutical industries, agriculture, and mining. The crystalline phase structure of the phosphate ore was characterized by X-ray diffraction (XRD, Philips PW1800), with a Cu-kα radiation source filtered through a nickel sheet. The Philips PW1800 XRD device utilizes X-ray radiation to analyze the crystal structure of samples. By exposing the sample to X-ray radiation, a diffraction pattern is formed, revealing the structural characteristics of the sample. This device offers high precision and resolution, enabling the analysis of complex patterns. Additionally, it can investigate structural changes in response to varying experimental conditions. The Philips PW1800 device finds applications in various fields such as materials science, chemistry, physics, metallurgy, environmental science, and earth sciences.
A rod mill (Taifazarin TA-12000 RAB) and a ball mill (NARYA–PGM 800) were used to crush the ore. A mechanical sieve shaker (MG Scientific Ro-Tap) was used to grind the crushed ore. A sampler (Taifazarin RSD-500) was applied to take 500 g samples of the sieved ore. A laboratory thermal furnace (Nabertherm LT9 12 B410) was used for ore calcination. A 4 L mechanical flotation system (Metso D12 VFD) was used for the flotation process. A three-necked glass flask equipped with a mechanical agitator, a glass reflux condenser, and a thermometer was used as a leaching reactor. The reactor was heated using an electric heater.
The mineral ore was initially crushed by a rod mill in an open-air environment at a speed of 350 rpm for 60 min. This process reduces the dimensions of the ore to below 10 mm. Then, the mineral ore was ground using a ball mill at a speed of 150 rpm for 15 min and eventually undergoes sieving processes. This process generates particles with intermediate sizes in the range of 75–150 μm (Gallala et al., 2016) and 100 μm (Abouzeid, 1980; Abouzeid, 2008) to facilitate the flotation and calcination processes. In the sieving process, the mineral particles are separated based on their physical and chemical properties, to be used as the final product or transferred to subsequent stages of mineral processing.
The milled sample (100 μm) was calcined in a thermal furnace at 900°C for 1–3 h (Abouzeid, 1980; Abouzeid, 2008). The calcined sample was naturally cooled to ambient temperature. The operating conditions, such as temperature, size, and time for the calcination process are similar to industrial practices; however, the process is conducted in batch mode rather than continuous.
At first, 500 g milled sample (75–150 μm) was mixed with 1,500 mL distilled water in the chamber of the flotation machine at a stirring speed of 1,200 rpm (Al-Fariss et al., 1993). Then, the pH of the solution was adjusted using HCl (32 wt%) and NaOH (Clifford et al., 1998). After adjusting the pH, 250 mL depressant was poured into the solution. After 5 min, 250 mL collector was poured into the solution. After another 5 min, an MIBC solution at a rate of 2,000 g. ton−1 of rock was added to the solution to make a froth. After 4 min, aeration was performed at a flow rate of 200 cm3 min−1 for 5 min. The floated part was removed from the top of the column and the residue remained (Al-Fariss et al., 1993). The floated and tail phases were filtered, dried, and weighed. Moreover, the conditions and materials used in the mentioned flotation process are similar to industrial practices. However, the process conducted in the laboratory setting is carried out in batch mode rather than continuous.
The leaching process was carried out in the laboratory as a batch implementation, which is depicted in Figure 3. At first, sulfuric acid (2–6 M) was charged into the reaction vessel. Next, the vessel was heated to approximately 40°C–100°C and the pre-treated ore sample was added to the solution. The liquid-to-solid ratio was set at 2–6 mL/g. The agitation speed of the reactor was 400 rpm.
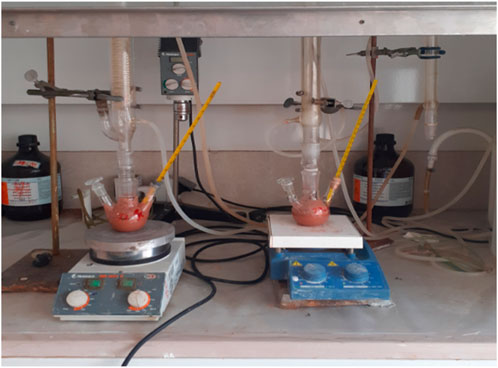
FIGURE 3. Image of the phosphate ore leaching process in the laboratory and on a batch scale.
Several leaching stages were conducted to produce phosphoric acid with a grade of 26% P2O5. To increase the efficiency of the leaching stages, the intermediate gypsums were washed with 12 wt% sulfuric acid. The washing solution and fresh pre-treated ore were fed into the reactor for the next step.
The leaching efficiency (E) was calculated using Equation (3):
where VL is the leach liquor volume (l), CL is the uranium concentration of the leach liquor (mg/L), ms is the ore mass (kg), CS is the uranium concentration of the ore (g/ton), VL1 is the initial solution volume (l), and CL1 is the uranium concentration of the initial solution (mg/L).
The chemical compositions of the Sheikh Habil-Iran ore are tabulated in Table 1. The results indicate that the calcium, silicon, iron, aluminum, and manganese oxides are the main impurities in the ore. The fraction of UO2 was 159 ppm, which is attractive as a secondary resource of uranium. The XRD analysis of the phosphate ore shown in Table 2 indicates that Ca5(PO4)3F (Fluorapatite), CaCO3 (Calcite), and SiO2 (Quartz) formed the crystalline phase of the ilmenite concentrate. Ilmenite is a mineral that consists of a mixture of fluorapatite, calcite, and quartz. Fluorapatite is a chemical compound that contains calcium, phosphate, and fluorine. Calcite is a mineral composed of calcium carbonate, while quartz is a mineral made up of silicon dioxide. These three substances are commonly found in ilmenite and are present as small crystals within the structure of ilmenite.

TABLE 1. XRF analysis of the chemical composition of the Sheikh Habil-Iran ore.
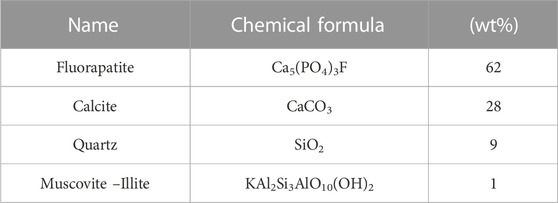
TABLE 2. XRD analysis of the Sheikh Habil-Iran ore.
The effect of calcination temperature on P2O5 and UO2 is displayed in Figures 4, 5, respectively. The results indicated that an increase in calcination temperature increased the percentage of P2O5 and UO2 in the ore. From energy consumption and environmental standpoints, a temperature of 900°C was considered economical (Abouzeid, 1980).
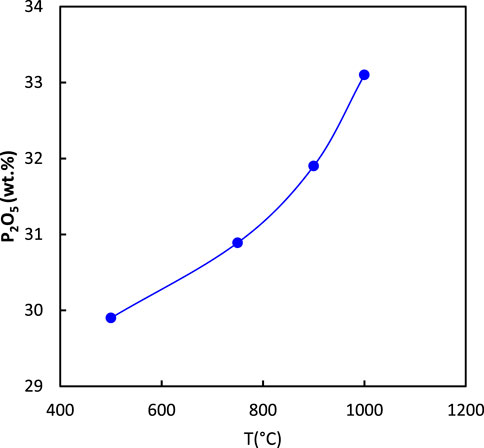
FIGURE 4. Effect of calcination temperature on the percentage of P2O5 in the ore (2 h calcination).
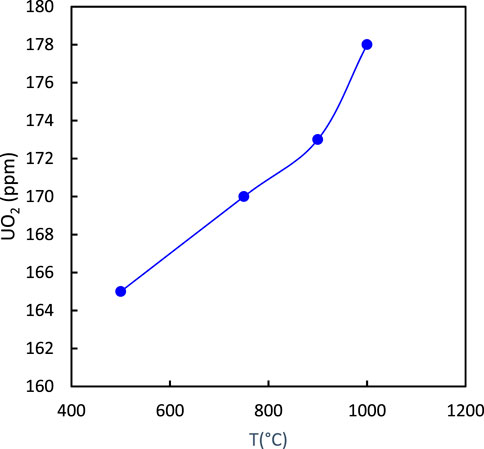
FIGURE 5. Effect of calcination temperature on the percentage of UO2 in the ore (2 h calcination).
The effect of calcination time on P2O5 and UO2 are shown in Figures 6, 7, respectively. The results indicated that an increase in calcination time increased the percentage of P2O5 and UO2 in the ore. From energy consumption and environmental standpoints, a time of 2 h was considered economical.
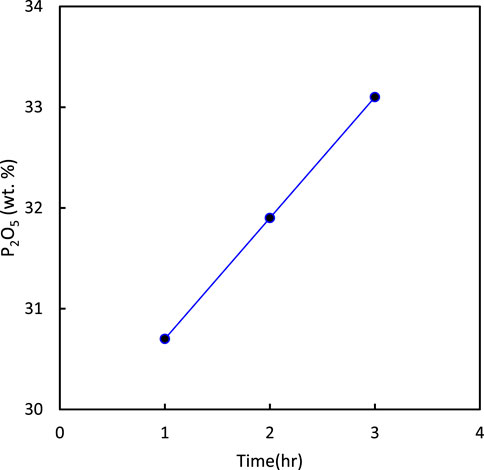
FIGURE 6. Effect of calcination time on the percentage of P2O5 in the ore (at 900°C).
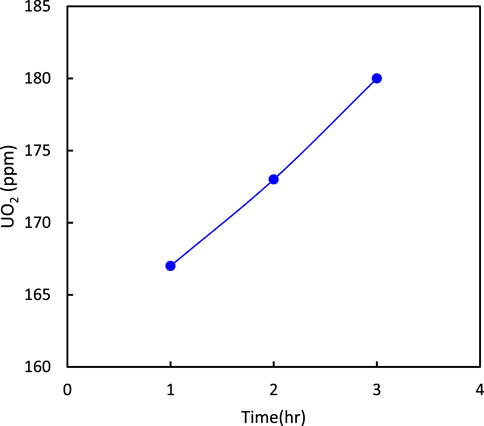
FIGURE 7. Effect of calcination time on the percentage of UO2 in the ore (at 900°C).
The effect of pH (range 6–10) on the recovery of P2O5 and UO2 in the flotation process was evaluated, see Table 3. The CaO/P2O5 ratio in the tailing is a very important parameter in the flotation process. The lowest value of this parameter was found at pH = 10. The highest value of UO2, P2O5, and P2O5 recovery in the tailing part were detected at pH = 10, which is a sign of reverse flotation process. The terms “concentrate” and “tail” were used for the sink fraction and the froth phase, respectively.
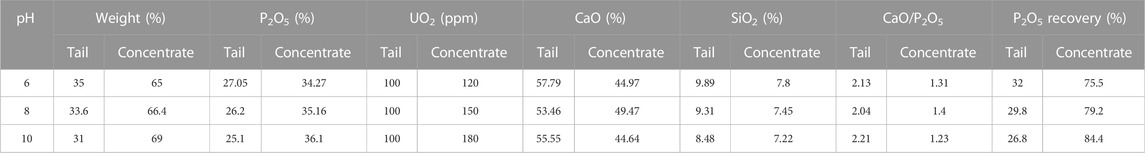
TABLE 3. Effect of pH on the recovery of P2O5 and UO2 in the flotation process (sodium oleate concentrations = 2,000 g. ton−1 of rock).
The effect of sodium oleate concentrations (range 500–2,500 g. ton−1 of rock), as a selective collector, on the recovery of P2O5 and UO2 in the flotation process was investigated, see Table 4. By increasing the collector concentration to 2,000 g/ton, the concentration of P2O5 and the efficiency of P2O5 recovery in the concentrated part increased, while the CaO/P2O5 ratio decreased, which indicated reverse flotation. For a collector concentration of 2,500 g/ton, the P2O5 concentration and its recovery efficiency in the concentrated part decreased, while the CaO/P2O5 ratio increased. The concentration of SiO2 in the concentrated phase was a little less than in the tail part.
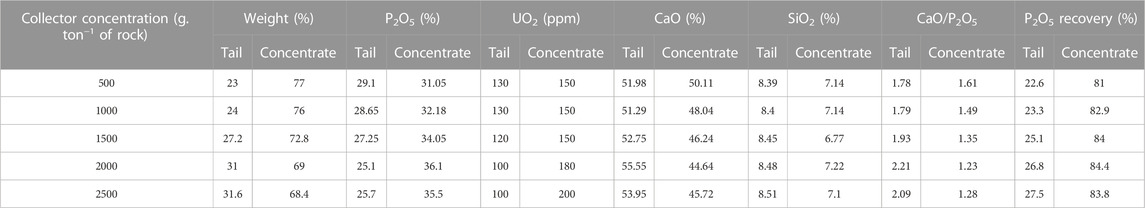
TABLE 4. Effect of collector (sodium oleate) concentrations on the recovery of P2O5 and UO2 in the flotation process (pH = 10).
Depressants play a vital role in the uranium flotation process by inhibiting the flotation of undesired materials, thereby improving the efficiency and effectiveness of uranium extraction. These substances form a protective layer on the surface of non-desirable particles, preventing their flotation and allowing for a higher concentration of uranium during the separation process. The appropriate selection and utilization of depressants contribute to cost reduction and lead to improved separation quality in uranium flotation. Overall, depressants are essential for optimizing the performance and productivity of uranium extraction operations. Sodium sulfate, phosphoric acid, citric acid, starch, and sodium silicate were examined as depressants in the flotation process, see Table 5. The results indicated that the weight of concentrated parts was higher than the tail parts. The recovery efficiency of P2O5 in the concentrated parts was higher than in the tail parts, indicative of the reverse flotation process. The CaO/P2O5 ratio of the concentrated parts was higher than 1.45. The P2O5 content in the concentrated parts was under acceptable values. The CaO content in the tail parts was acceptable. For some depressants (such as phosphoric acid), the CaO/P2O5 ratio was over acceptable values. The best results, shown in Table 5, were obtained using phosphoric acid at pH 5 and the highest P2O5 recovery with the second highest P2O5 grade in concentrated parts. However, P2O5 and UO2 were not achieved in significantly high contents in these tests.
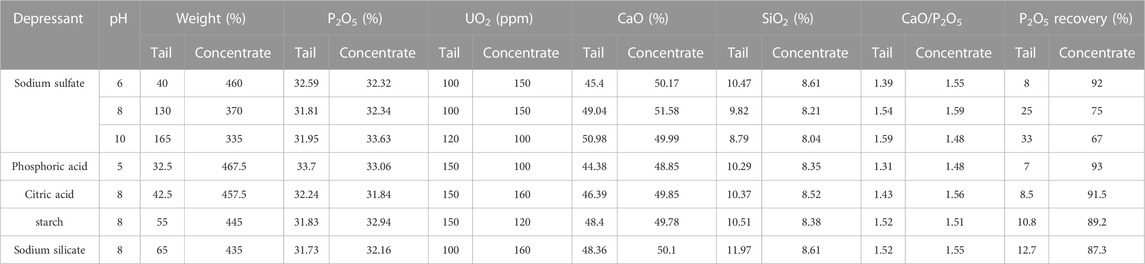
TABLE 5. Effect of depressant on the recovery of P2O5 and UO2 in the flotation process (collector concentrations = 2,000 g. ton−1 of rock).
The effect of flotation time (2–10 min) on the recovery of P2O5 and UO2 was evaluated, see Table 6. By increasing the flotation time, the recovery of P2O5 in the tail parts increased and decreased in the concentrated parts. The highest P2O5 content and the lowest CaO/P2O5 ratio in the concentrated parts were obtained for 5 min flotation. The UO2 content in the tail and concentrated parts was almost constant for all flotation times.
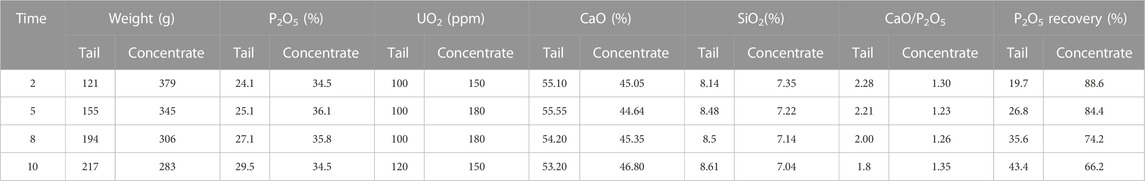
TABLE 6. Effect of flotation time on the recovery of P2O5 and UO2 (collector concentrations = 2,000 g. ton−1 of rock and pH = 10).
The effect of the liquid to solid ratio (L/S), sulfuric acid concentration, time, and temperature on the leaching process were evaluated. The optimization of these parameters was performed using the response surface method (RSM) with Design Expert 13 software, employing a central composite design (CCD) approach.
The RSM usually consists of three steps: 1) design and experiments, 2) modeling the response surface through regression, and 3) optimization. The independent parameters and the response are related as follows:
where, f is the answer function, y is the answer, e is the test error, and Xn is an independent variable. The CCD layout for the optimization of the leaching independent variables is tabulated in Table 7. An empirical relationship between the independent variables and the efficiency of leaching was determined using the RSM, given as:
where A is L/S, B is sulfuric acid concentration, C is leaching time, and D is temperature. The statistical results of the RSM are given in Table 8. The predicted and adjusted R2 values were almost one. The results of the quadratic model in the form of analysis of variance (ANOVA) are given in Table 9. The p-value of the model was less than 0.0001, indicating that the model is statistically acceptable.
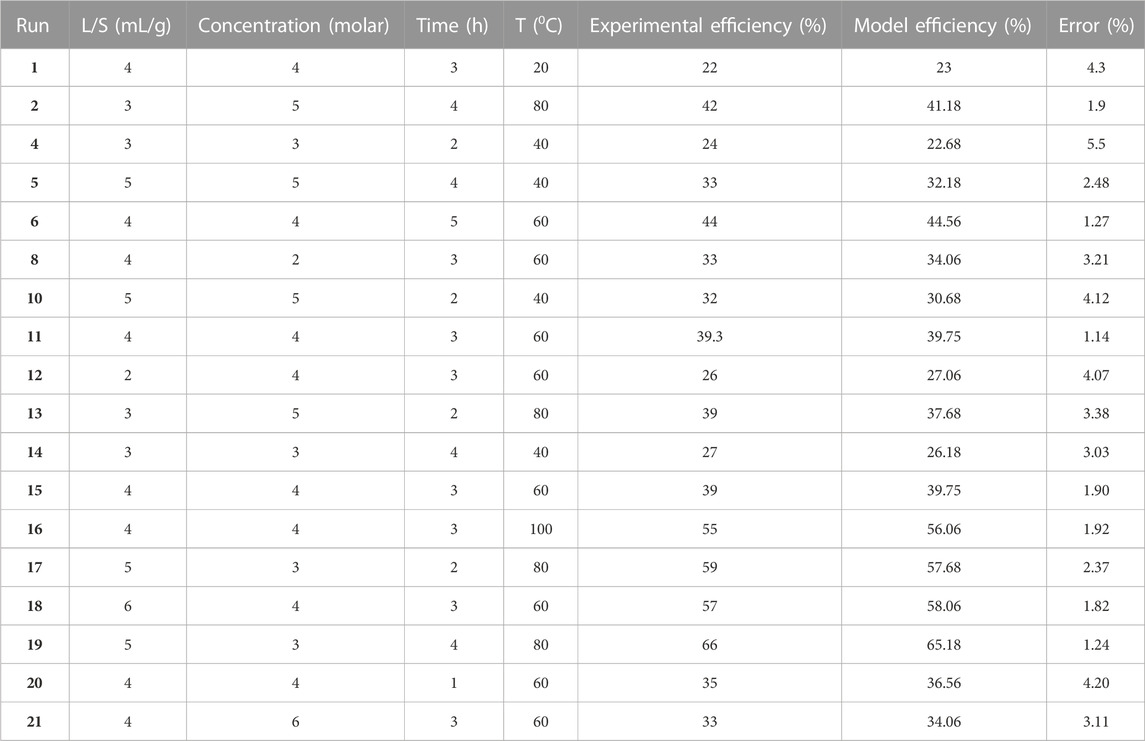
TABLE 7. CCD layout for optimization of leaching independent variables.
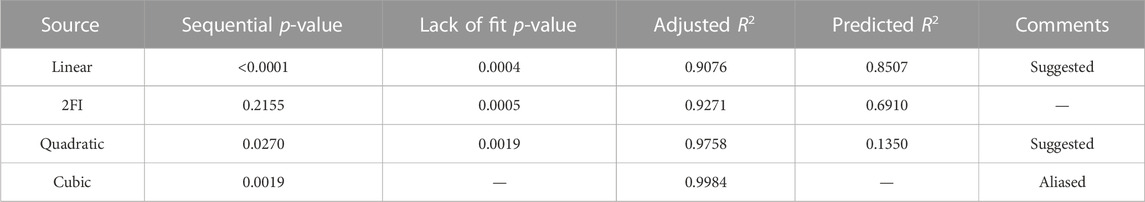
TABLE 8. Statistical results of fit summary in CCD.
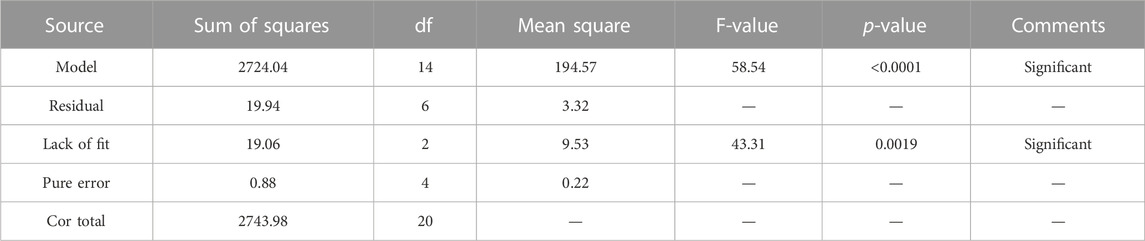
TABLE 9. Analysis of variance (ANOVA) for the quadratic model.
The RSM was used to investigate the simultaneous effect of the L/S ratio (2–6 mL/g) and sulfuric acid concentration (1–6 M) on the leaching efficiency. As shown in Figures 8A, B, for 3–4 M sulfuric acid concentration, with an increase in the L/S ratio, the uranium extraction efficiency increased.
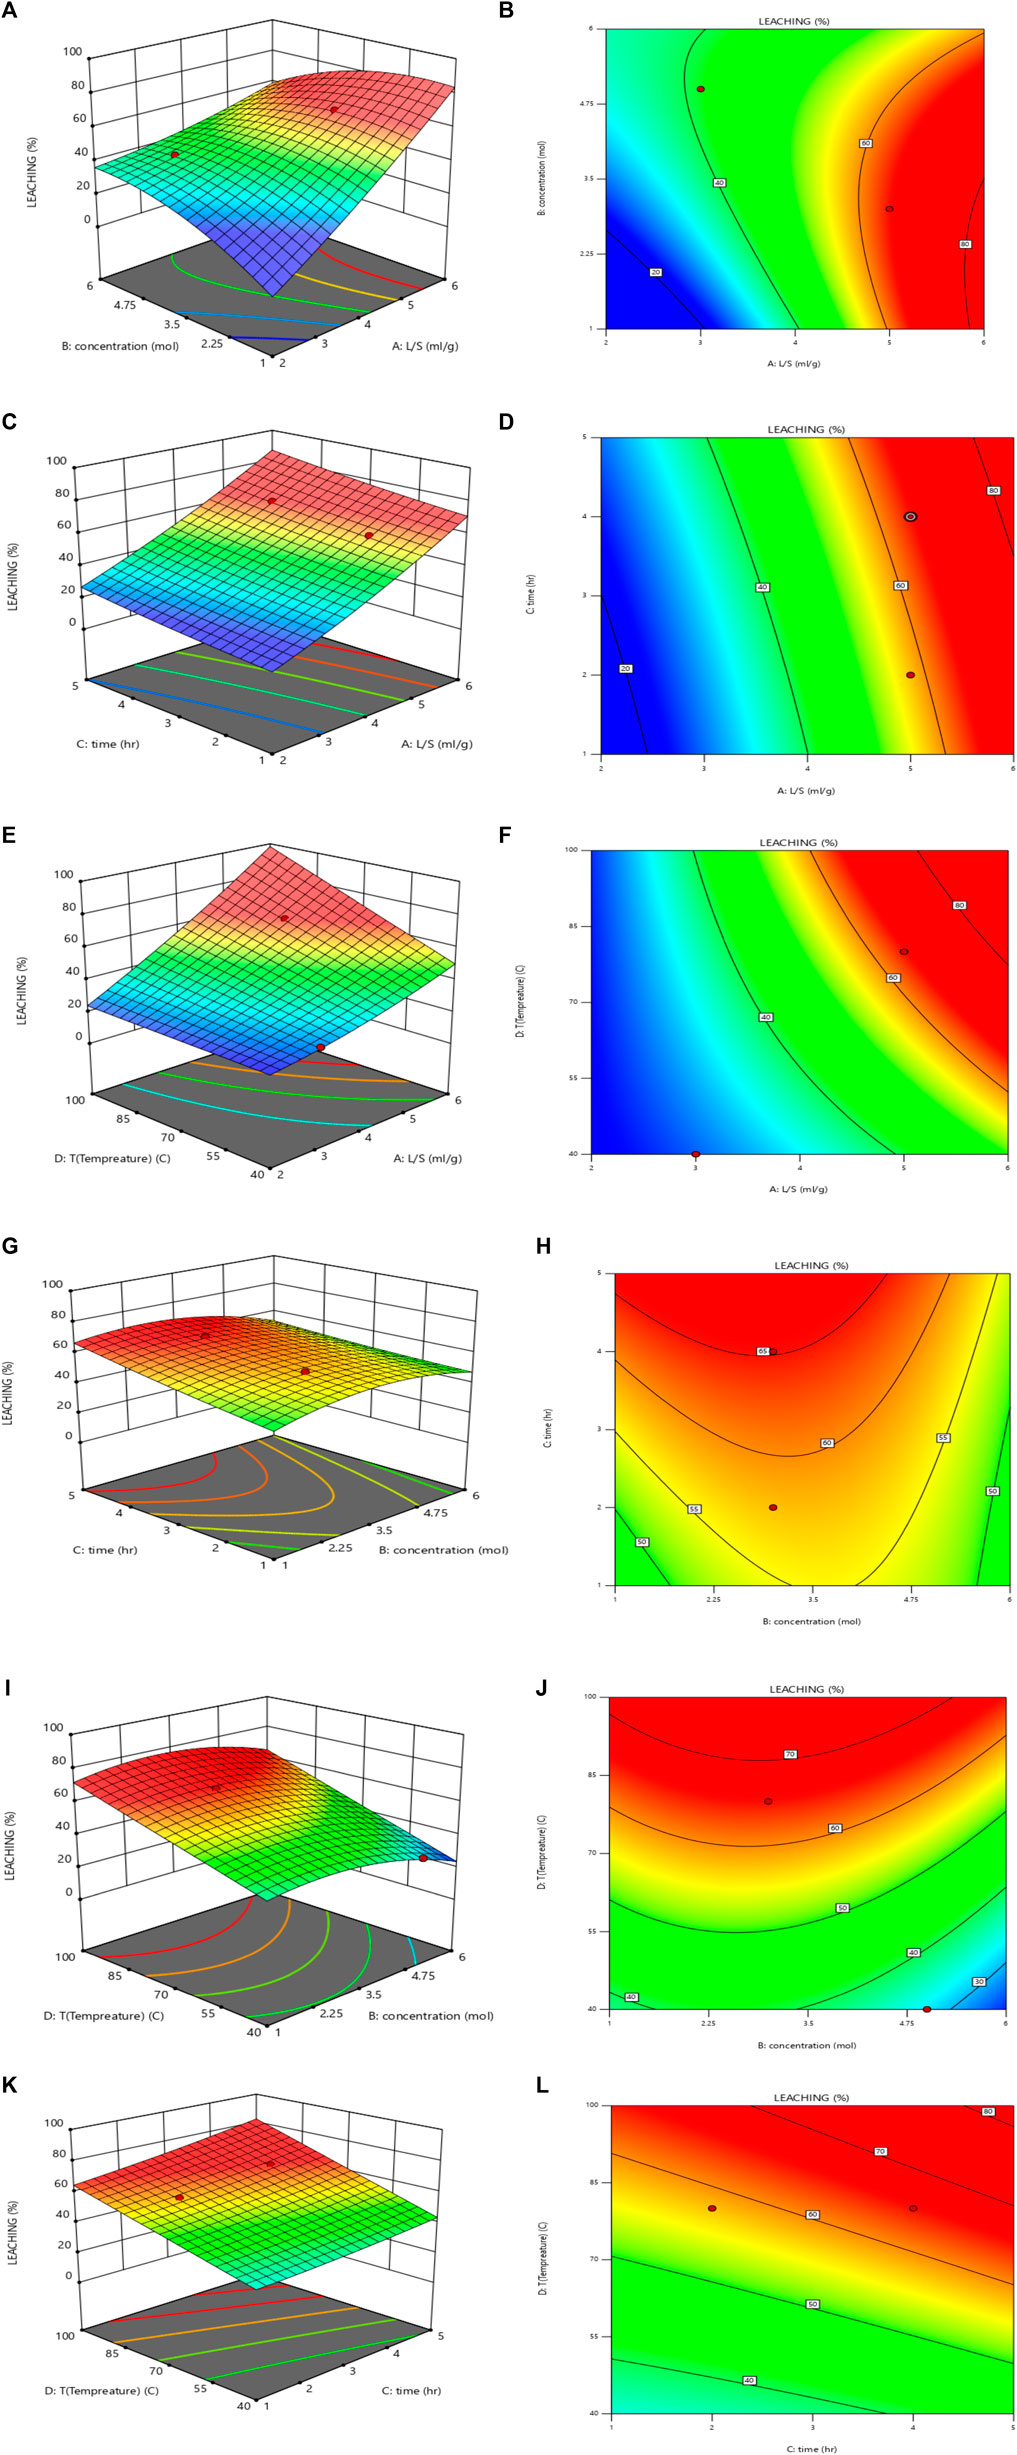
FIGURE 8. Effect of L/S ratio and sulfuric acid concentration on the leaching efficiency (T = 80°C, time = 4 h): (A) 3D plot and (B) contour plot, Effect of the L/S ratio and time on the leaching efficiency (T = 80°C, sulfuric acid concentration = 3 M): (C) 3D plot and (D) contour plot, Effect of L/S ratio and temperature on the leaching efficiency (time = 4 h, sulfuric acid concentration = 3 M): (E) 3D plot and (F) contour plot, Effect of sulfuric acid concentration and time on the leaching efficiency (T = 80°C, L/S = 5): (G) 3D plot and (H) contour plot, Effect of sulfuric acid concentration and temperature on the leaching efficiency (time = 4 h, L/S = 5): (I) 3D plot and (J) contour plot and Effect of time and temperature on the leaching efficiency (sulfuric acid concentration = 3 M, L/S = 5): (K) 3D plot and (L) contour plot.
The simultaneous effect of the L/S ratio (2–6 mL/g) and time (1–6 h) on the leaching efficiency was examined using the RSM. As shown in Figures 8C, D, with a simultaneous increase in the L/S ratio and time, the uranium leaching efficiency increased. The result indicated that the optimum values of the L/S ratio and time are 5 mg/L and 4 h, respectively.
The simultaneous effect of the L/S ratio (2–6 mL/g) and temperature (20°C–100°C) on the leaching efficiency is shown in Figures 8E, F. The uranium leaching efficiency increased with the simultaneous increase in the L/S ratio and temperature. 80°C was determined as the optimum temperature.
The simultaneous effect of sulfuric acid concentration (1–6 M) and time (1–6 h) on the leaching efficiency is shown in Figures 8G, H. For 1–4 M sulfuric acid concentration, the uranium leaching efficiency increased with an increase in the sulfuric acid concentration. For 4–6 M sulfuric acid concentration, by increasing the sulfuric acid concentration, uranium was co-precipitated with gypsum, and the uranium leaching efficiency decreased. The uranium leaching efficiency increased with an increase in time, and 4 h was determined to be the optimum leaching time.
The simultaneous effect of sulfuric acid concentration (1–6 M) and temperature (20°C–100°C) on the leaching efficiency is shown in Figures 8I, J. For 3–4 M sulfuric acid concentration, with an increase in temperature, the uranium extraction efficiency increased. As a confirmation of the results presented in Section 3.4.3, 80°C was determined to be the optimum temperature.
The simultaneous effect of time (1–6 h) and temperature (20°C–100°C) on the leaching efficiency is shown in Figures 8K, L). The uranium leaching efficiency increased with a simultaneous increase in the time and temperature.
To confirm the presented RSM model, leaching experiments were performed. The uranium leaching efficiency predicted by the RSM model, experimental efficiency, and error rate are given in Table 10. The errors of the model response were less than 10%, which indicate the accuracy of the presented RSM model.
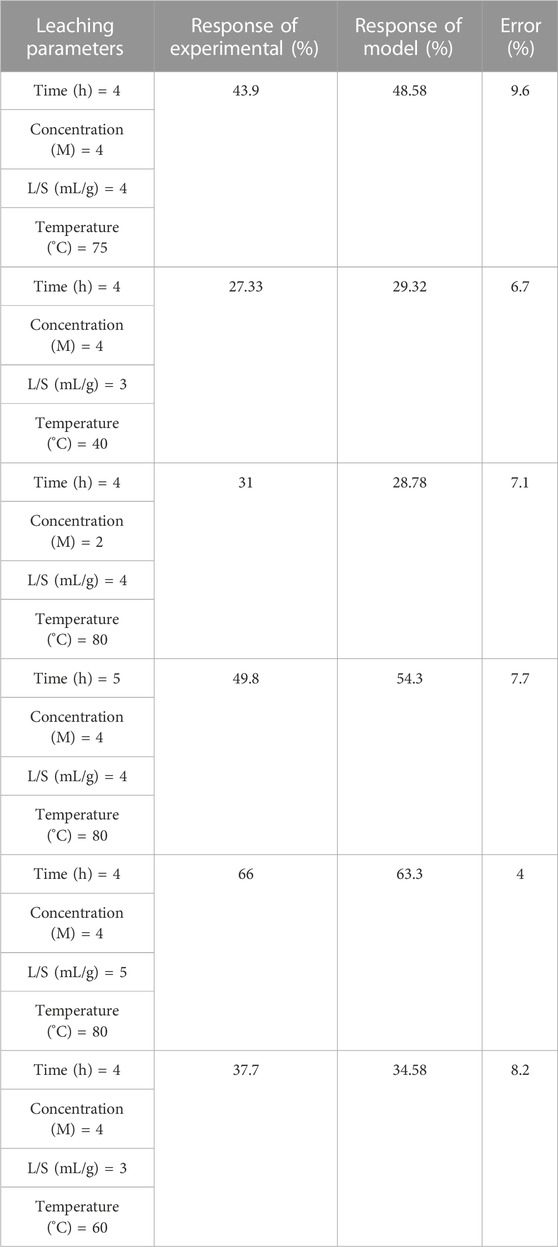
TABLE 10. Uranium leaching efficiency predicted by RSM model in comparison with the experimental efficiency.
According to the RSM modeling and experimental results, the optimum parameters of uranium leaching from Sheikh Habil-Iran phosphate ore are presented in Table 11. The experimental results confirmed the optimum leaching parameters determined by the RSM model.
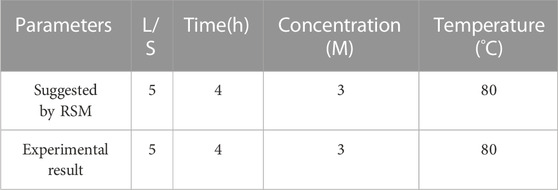
TABLE 11. Optimum value of leaching parameters.
The UO2 and P2O5 extraction efficiencies from pre-treated ores by flotation and calcination leached under optimum leaching parameters are shown in Figure 9. The uranium extraction efficiency from ore pre-treated by flotation was higher than that for ore pre-treated by calcination.
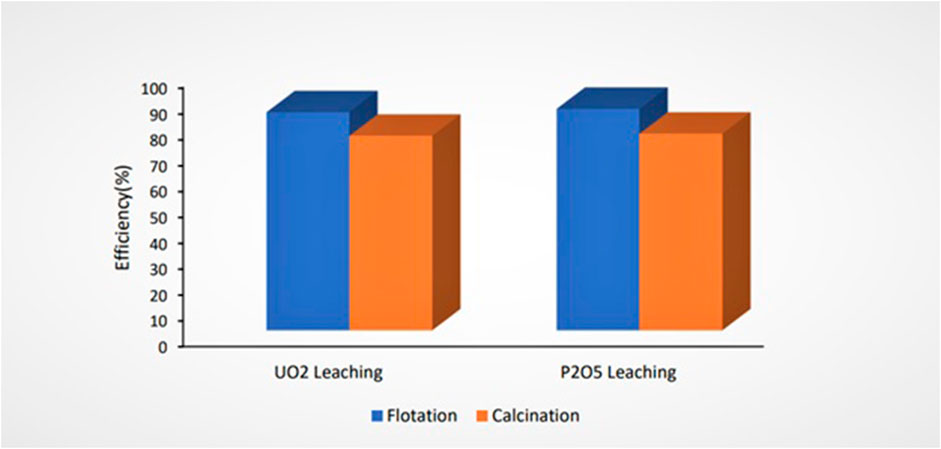
FIGURE 9. Effect of pre-treatment methods on uranium leaching efficiency (L/S = 5, time = 4 h, sulfuric acid concentration = 3 M, and T = 80°C).
In order to produce phosphoric acid with a concentration exceeding 55%, which is achieved through the evaporation process, it is necessary to produce intermediate phosphoric acid with a concentration greater than 26%. Such a process consisting of three sequential leaching steps, under optimum parameters determined by the RSM model, was designed, see Figure 10. At the end of steps 1 and 2, the remaining gypsum was washed with 12 wt% sulfuric acid. The leach liquor and washing solution of these two steps was fed into the next step. The characteristics of the three leaching steps are given in Table 12. The UO2 and H3PO4 extraction efficiencies of this process were 88.3% and 91.4%, respectively. The uranium and H3PO4 concentrations of the produced phosphoric acid were 70 ppm and 28.2 wt%, respectively.
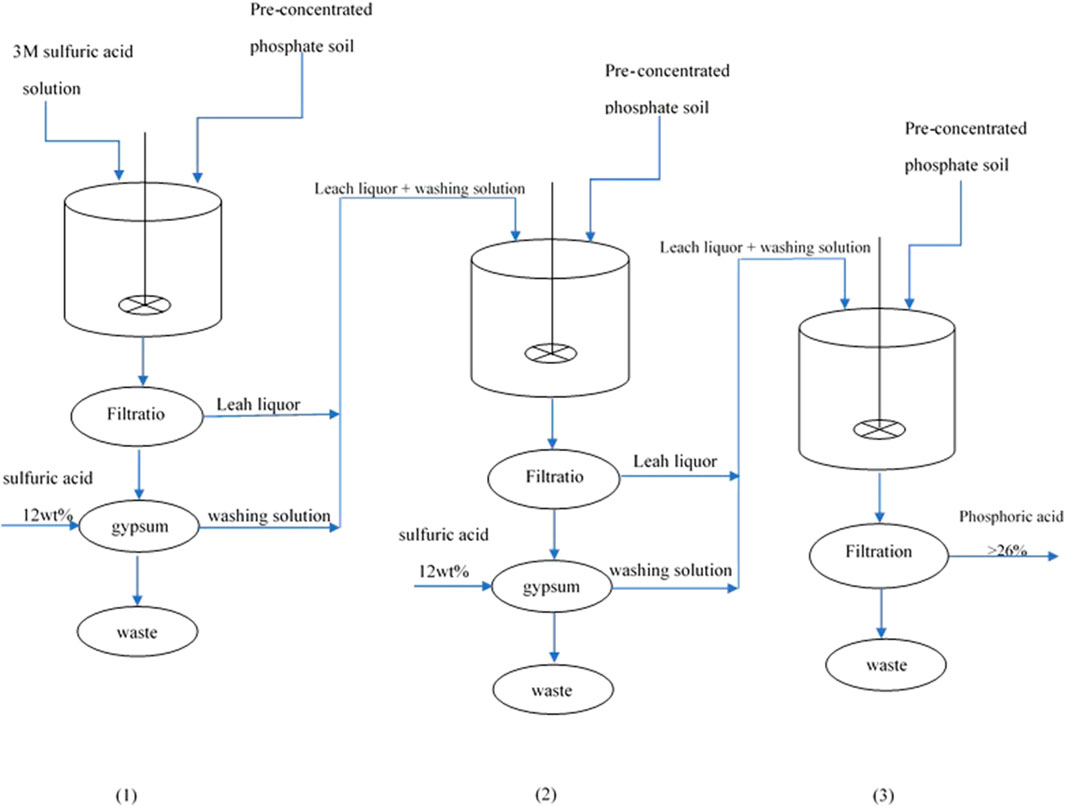
FIGURE 10. Schematic of the three sequential leaching steps for the production of phosphoric acid with a grade of 26 wt% P2O5.
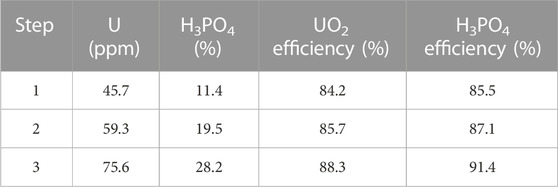
TABLE 12. Characteristics of the three leaching steps for phosphoric acid production.
In the present study, the concentration process for phosphate ore of the Sheikh Habil-Iran mine was investigated using flotation and calcination methods, and the process parameters were optimized. Next, the pre-treated phosphate ore was leached using sulfuric acid. The leaching parameters were optimized to produce a suitable grade of phosphoric acid and to maximize uranium recovery using the response surface methodological approach (RSM). According to the RSM modeling and experimental results, the optimum parameters for uranium leaching from the Sheikh Habil-Iran phosphate ore were an L/S = 5 mL/g, sulfuric acid concentration = 3 M, time = 4 h, and temperature = 80°C. The optimized efficiencies of uranium recovery from phosphate ore pre-treated by flotation and calcination methods were 84.2% and 75.2%, respectively. The results indicated that flotation has superiority over calcination as a pre-treatment method for phosphate ore of the Sheikh Habil-Iran mine. For the production of phosphoric acid with a grade of 26 wt% P2O5, a process consisting of three sequential leaching steps was designed. The UO2 and H3PO4 extraction efficiencies of this process were 88.3% and 91.4%, respectively. The uranium and H3PO4 concentrations of the produced phosphoric acid were 70 ppm and 28.2 wt%, respectively.
The datasets presented in this study can be found in online repositories. The names of the repository/repositories and accession number(s) can be found in the article/supplementary material.
MZ: Conceptualization, Methodology, Writing–original draft, Writing–review and editing. AA: Conceptualization, Investigation, Methodology, Writing–original draft. MO: Supervision, Validation, Writing–original draft. DN: Conceptualization, Investigation, Writing–original draft. MS: Conceptualization, Investigation, Methodology, Software, Writing–review and editing.
The authors declare that no financial support was received for the research, authorship, and/or publication of this article.
The authors declare that the research was conducted in the absence of any commercial or financial relationships that could be construed as a potential conflict of interest.
All claims expressed in this article are solely those of the authors and do not necessarily represent those of their affiliated organizations, or those of the publisher, the editors and the reviewers. Any product that may be evaluated in this article, or claim that may be made by its manufacturer, is not guaranteed or endorsed by the publisher.
Abouzeid, A.-Z. M. (2008). Physical and thermal treatment of phosphate ores—an overview. Int. J. mineral Process. 85 (4), 59–84. doi:10.1016/j.minpro.2007.09.001
Al-Fariss, T. F., Ozbelge, H., and Abdulrazik, A. (1993). Optimum flotation conditions for Al-jalamid phosphate rock. Dev. Chem. Eng. Mineral Process. 1 (1), 56–62. doi:10.1002/apj.5500010107
Ali, H. F., Ali, M. M., Taha, M. H., and Abdel-Magied, A. F. (2012). Uranium extraction mechanism from analytical grade phosphoric acid using D2EHPA and synergistic D2EHPA-TOPO mixture. Int. J. Nucl. Energy Sci. Eng. 2, 57–61.
Arhouni, F. E., Hakkar, M., Ouakkas, S., Haneklaus, N., Boukhair, A., Nourreddine, A., et al. (2023). Evaluation of the physicochemical, heavy metal and radiological contamination from phosphogypsum discharges of the phosphoric acid production unit on the coast of El Jadida Province in Morocco. J. Radioanalytical Nucl. Chem. 332, 4019–4028. doi:10.1007/s10967-023-09079-w
Bautista, R. G. (1993). Liquid membrane separations of metals in aqueous solutions. Emerg. Sep. Technol. Metals Fuels, 257–287.
Beltrami, D., Chagnes, A., Haddad, M., Varnek, A., Mokhtari, H., Courtaud, B., et al. (2013). Recovery of uranium (VI) from concentrated phosphoric acid by mixtures of new bis (1, 3-dialkyloxypropan-2-yl) phosphoric acids and tri-n-octylphosphine oxide. Hydrometallurgy 140, 28–33. doi:10.1016/j.hydromet.2013.08.008
Beltrami, D., Cote, G., Mokhtari, H., Courtaud, B., and Chagnes, A. (2012). Modeling of the extraction of uranium (VI) from concentrated phosphoric acid by synergistic mixtures of bis-(2-ethylhexyl)-phosphoric acid and tri-n-octylphosphine oxide. Hydrometallurgy 129, 118–125. doi:10.1016/j.hydromet.2012.09.005
Beltrami, D., Cote, G., Mokhtari, H., Courtaud, B., Moyer, B. A., and Chagnes, A. (2014). Recovery of uranium from wet phosphoric acid by solvent extraction processes. Chem. Rev. 114 (24), 12002–12023. doi:10.1021/cr5001546
Clifford, P., Lloyd, G., and Zhang, P. (1998). Technology research improves phosphate economics. Min. Eng. 50 (2), 46–51.
Fatemi, K., Taghinejad kord, M., Zare, M. H., et al. (2019). Recovery and purification of uranium from rejected-prototype fuel plates with use innovative method. J. Nucl. Sci. Technol. (JonSat) 39 (4), 85–92. doi:10.24200/nst.2019.239
Fatemi, K., Habibi Zare, M., and Vakili, H. (2020a). Uranium recovery from laboratory wastewater in phosphoric acid medium. J. Nucl. Sci. Technol. (JonSat) 41 (4), 28–35. doi:10.24200/nst.2021.1164
Fatemi, K., Nejhadkord, M., and Habibi Zare, M. (2020b). Recovery and purification of uranium from slags produced in UF6 production reactor. J. Nucl. Sci. Technol. (JonSat) 40 (4), 11–20. doi:10.24200/nst.2020.1065
Gallala, W., Herchi, F., Ali, I. B., Abbassi, L., Gaied, M. E., and Montacer, M. (2016). Beneficiation of phosphate solid coarse waste from Redayef (Gafsa Mining Basin) by grinding and flotation techniques. Procedia Eng. 138, 85–94. doi:10.1016/j.proeng.2016.02.065
Haneklaus, N., Sun, Y., Bol, R., Lottermoser, B., and Schnug, E. (2017). To extract, or not to extract uranium from phosphate rock, that is the question. Washington, D.C.: ACS Publications. doi:10.1021/acs.est.6b05506
Kabay, N., Demircioǧlu, M., Yaylı, S., Günay, E., Yüksel, M., Saǧlam, M., et al. (1998). Recovery of uranium from phosphoric acid solutions using chelating ion-exchange resins. Industrial Eng. Chem. Res. 37 (5), 1983–1990. doi:10.1021/ie970518k
Kawatra, S. K., and Carlson, J. (2013). Beneficiation of phosphate ore. Englewood, Colorado: Society for Mining, Metallurgy, and Exploration.
Lammers, L. N., Duan, Y., Anaya, L., Koishi, A., Lopez, R., Delima, R., et al. (2023). Electrolytic sulfuric acid production with carbon mineralization for permanent carbon dioxide removal. ACS Sustain. Chem. Eng. 11 (12), 4800–4812. doi:10.1021/acssuschemeng.2c07441
Ptacek, P. (2016). Mining and beneficiation of phosphate ore, apatites and their synthetic analogues—synthesis, structure, properties and applications. London: IntechOpen. doi:10.5772/62215
Pufahl, P. K., and Groat, L. A. (2017). Sedimentary and igneous phosphate deposits: formation and exploration: an invited paper. Econ. Geol. 112 (3), 483–516. doi:10.2113/econgeo.112.3.483
Sadeghi, M. H., Outokesh, M., Sharifi, M., and Zare, M. H. (2021). Recovery of uranium from carbonaceous radioactive waste of the UF6 production line in a uranium conversion plant: laboratory and pilot plant studies. Hydrometallurgy 205, 105747. doi:10.1016/j.hydromet.2021.105747
Sadeghi, M. H., Outokesh, M., and Zare, M. H. (2020). Production of high quality ammonium uranyl carbonate from “uranyl nitrate + carbonate” precursor solution. Prog. Nucl. Energy 122, 103270. doi:10.1016/j.pnucene.2020.103270
Steiner, G., Geissler, B., and Haneklaus, N. (2020). Making uranium recovery from phosphates great again? Washington, D.C.: ACS Publications. doi:10.1021/acs.est.9b07859
Yan-Zhao, Y., Si-Xiu, S., and Sheng-Yu, F. (2002). Liquid-liquid extraction of uranium (VI) with 2-ethylhexyltolylsulfoxide (EHTSO). J. radioanalytical Nucl. Chem. 251, 503–506. doi:10.1023/a:1014858914778
Keywords: uranium recovery, phosphate ore, optimization, leaching process, Sheikh Habil-Iran mine, flotation, calcination of phosphate ores
Citation: Abdeshahi A, Outokesh M, Nejad DG, Zare MH and Sadeghi MH (2023) Recovery of uranium from phosphate ore in the Sheikh Habil-Iran mine: part I— multivariable optimization of leaching process using the response surface method. Front. Chem. 11:1292620. doi: 10.3389/fchem.2023.1292620
Received: 11 September 2023; Accepted: 14 November 2023;
Published: 06 December 2023.
Edited by:
Ahmet Turgut Bilgicli, Sakarya University, TürkiyeReviewed by:
Nils Haneklaus, University for Continuing Education Krems, AustriaCopyright © 2023 Abdeshahi, Outokesh, Nejad, Zare and Sadeghi. This is an open-access article distributed under the terms of the Creative Commons Attribution License (CC BY). The use, distribution or reproduction in other forums is permitted, provided the original author(s) and the copyright owner(s) are credited and that the original publication in this journal is cited, in accordance with accepted academic practice. No use, distribution or reproduction is permitted which does not comply with these terms.
*Correspondence: M. Outokesh, b3V0b2tlc2hAc2hhcmlmLmly; M. Habibi Zare, bWFzb3VkLmhhYmliaUBjZS5pdXQuYWMuaXI=
Disclaimer: All claims expressed in this article are solely those of the authors and do not necessarily represent those of their affiliated organizations, or those of the publisher, the editors and the reviewers. Any product that may be evaluated in this article or claim that may be made by its manufacturer is not guaranteed or endorsed by the publisher.
Research integrity at Frontiers
Learn more about the work of our research integrity team to safeguard the quality of each article we publish.