 Xiao-Ying Yu
 Cuiyun Yang1†
 Yuchen Zhang
95% of researchers rate our articles as excellent or good
Learn more about the work of our research integrity team to safeguard the quality of each article we publish.
Find out more
ORIGINAL RESEARCH article
Front. Chem. , 06 October 2023
Sec. Analytical Chemistry
Volume 11 - 2023 | https://doi.org/10.3389/fchem.2023.1253685
This article is part of the Research Topic Chemical Sensing and Emerging Analysis of Environmental Contaminants View all 6 articles
Detection of per- and polyfluoroalkyl substances (PFASs) is crucial in environmental mitigation and remediation of these persistent pollutants. We demonstrate that time-of-flight secondary ion mass spectrometry (ToF-SIMS) is a viable technique to analyze and identify these substances at parts per trillion (ppt) level in real field samples without complicated sample preparation due to its superior surface sensitivity. Several representative PFAS compounds, such as perfluorooctanesulfonic acid (PFOS), perfluorobutanoic acid (PFBA), perfluoropentanoic acid (PFPeA), perfluoheptanoic acid (PFHpA), and perfluorononanoic acid (PFNA), and real-world groundwater samples collected from monitoring wells installed around at a municipal wastewater treatment plant located in Southern California were analyzed in this work. ToF-SIMS spectral comparison depicts sensitive identification of pseudo-molecular ions, characteristic of reference PFASs. Additionally, principal component analysis (PCA) shows clear discrimination among real samples and reference compounds. Our results show that characteristic molecular ion and fragments peaks can be used to identify PFASs. Furthermore, SIMS two-dimensional (2D) images directly exhibit the distribution of perfluorocarboxylic acid (PFCA) and PFOS in simulated mixtures and real wastewater samples. Such findings indicate that ToF-SIMS is useable to determine PFAS compounds in complex environmental water samples. In conclusion, ToF-SIMS provides simple sample preparation and high sensitivity in mass spectral imaging, offering an alternative solution for environmental forensic analysis of PFASs in wastewater in the future.
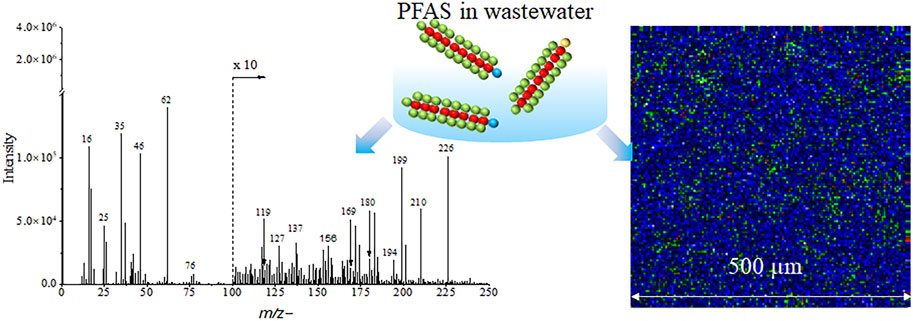
GRAPHICAL ABSTRACT |
Per- and polyfluoroalkyl substances (PFASs) are a group of manmade synthetic organic fluorinated substances. They have been widely used in industrial and commercial applications for more than 50 years. Representative examples of PFASs applications include surfactants, flame retardants, food packaging, and non-stick coating for cooking utensils (Rahman et al., 2014; Ciccotelli et al., 2016; Monge Brenes et al., 2019; Alves et al., 2020; Clarity et al., 2021). PFASs are ubiquitous in the environment and they have become a global pollution problem, especially perfluorooctanoate (PFOA) and perfluorooctanoate sulfonate (PFOS) due to their persistence, bio-accumulative properties, and toxicities even at low concentrations in the environment (Ciccotelli et al., 2016; Kucharzyk et al., 2017). More than 5,000 individual PFASs have been found in waters, solids, and fish; and many of them are potential precursor compounds of PFOA and PFOS (Chan et al., 2009; Llorca et al., 2009; Xiao, 2017; Dauchy, 2019; Abunada et al., 2020; Chohan et al., 2021; Lassalle et al., 2021). Therefore, studies on PFASs, including PFOA and PFOS, are extremely important to understand the distribution, transformation, and ultimately removal of these persistent organic pollutants from the natural water environment.
PFASs are found in different aqueous matrices including surface water, groundwater, drinking water, lake and costal water, or sea waters (Rayne and Forest, 2009; Crone et al., 2019). Pre-treatment methods, such as filtration and centrifugation, were used for analysis (Nzeribe et al., 2019; Vu and Wu, 2022). At present, the main techniques used to analyze the distribution and compositions of PFASs in the natural environment, food, animal’s blood, or tissue are gas chromatography mass spectrometry (GC-MS) or tandem mass spectrometry (GC-MS/MS), high performance liquid chromatography mass spectrometry or tandem mass spectrometry (HPLC-MS or HPLC-MS/MS), and ultra-high performance liquid chromatography mass spectrometry or tandem mass spectrometry (UPLC-MS or UPLC-MS/MS) (Capriotti et al., 2013; Bach et al., 2016; Mulabagal et al., 2018; Groffen et al., 2021; Qi et al., 2021). These methods are quantitative; however, sample preparation can be challenging. PFAS identification depends heavily on standards and reference chemicals. For example, fluorotelomer alcohols (FTOHs) were often determined by GC-MS, and trace levels of FTOHs are detectable in river water, influent and effluent wastewater samples using silica normal-phase solid phase extraction (SPE) (Portoles et al., 2015; Bach et al., 2016). HPLC and UPLC-MS/MS are currently widely used to determine PFASs (Capriotti et al., 2013; Mulabagal et al., 2018). In addition to these methods, LC-MS/MS is recommended by the United States Environmental Protection Agency (EPA) for PFAS analysis (Benskin et al., 2007; Stramenga et al., 2021). Specifically, Liquid Chromatography Quadrupole Time of Flight tandem Mass Spectrometry (LC-QToF/MS) is used to analyze and identify PFAS in serum samples of firefighters who are exposed to fire extinguishing agents containing PFASs (Rotander et al., 2015). However, these methods need a complex pretreatment procedure to extract or transfer PFASs as derivatives before analysis. Therefore, new analytical approaches that offer easy sample preparation and sensitive detection are attractive to the community of PFAS research and environmental protection and restoration.
Unlike the commonly used MS tools as a bulk analysis approach, time-of-flight secondary ion mass spectrometry (ToF-SIMS) is a powerful, high-resolution surface analysis tool. It provides sensitive spectral mapping of molecular, elemental, and isotopic characteristics of solid samples (Fu et al., 2017; Čižinauskas et al., 2017). Because SIMS measurements have superior surface sensitivity, only a minute amount of sample like microgram or less is needed. Therefore, it does not demand huge amount of mass to perform an analysis, and it often used in trace analysis almost nondestructively. Another attractive feature of SIMS is high mass resolution, often several thousand or ten thousand of relative mass accuracy of detected peaks could be obtained compared to other bulk MS approaches (Gilmore and Seah, 2000; Gilmore et al., 2005). Thus, it offers comprehensive information and sensitive analysis of specimens with spatial distribution in one-dimensional (1D) spectra as well as 2D and 3D mass spectral images (Yu, 2020). Although ToF-SIMS is semi-quantitative, the sample preparation and analysis are simple and fast, yet offering high mass accuracy and high mass resolving power of organic molecules (Touboul et al., 2005; Vickerman and Winograd, 2015; Wei et al., 2017; Zhang et al., 2019b). Full spectral (i.e., elemental, molecular, isotopic) information is available due to the parallel collection nature of ToF-SIMS (Sodhi, 2004; Smentkowski et al., 2007; Fisher et al., 2016). Moreover, ToF-SIMS is known for its applications in forensic analysis, namely, sensitive detection of spectral signatures in minute specimens due to its superior surface sensitivity (Szynkowska et al., 2013; Terlier et al., 2020; Szynkowska-Jóźwik et al., 2021). Also, the contrast in PFASs between surface and deeper soil samples could be more pronounced in long-chain congers than shorter chains (Washington et al., 2010), which presents opportunities for applications of SIMS. Amendment materials such as clay and resin have been developed and used to treat PFAS pollution (Nzeribe et al., 2019; Anderson et al., 2021; Kurwadkar et al., 2022). Once loaded, the fate and transformation of PFAS need investigation (DOD, 2022). These are the primary drivers of knowing the spatial resolution of PFAS in a material. ToF-SIMS potentially provides a new imaging solution to addressing the PFAS challenges.
In this work, we demonstrate that ToF-SIMS can be used for rapid analysis and identification of PFASs using several representative PFAS compounds as examples, and their corresponding pseudo-molecular ion and fragment peaks are observable in this work. Limit of detections (LODs) of representative PFAS molecules, namely, PFPeA and PFOS, were determined. Additionally, 2D imaging offers the possibility to visualize PFASs spatial distribution in a mixture, identifying short-chain and long-chain components in a mixture. Moreover, real-world groundwater samples collected in a wastewater treatment plant (WWTP) were analyzed to demonstrate the sensitive ToF-SIMS detection and identification of PFAS compounds. Our results present the first experimental evidence that ToF-SIMS can be a useful tool for analysis of trace level of PFASs pollutants in laboratory-prepared simulated mixtures as references and in field collected groundwater samples as validation.
Four perfluorocarboxylic acid (PFCA) compounds including perfluorobutanoic acid (PFBA, 95%), perfluoropentanoic acid (PFPeA, 97%), perfluoheptanoic acid (PFHpA, 99%), perfluorononanoic acid (PFNA, 97%), and perfluorooctane sulfonate (PFOS, ∼40% in H2O) were acquired from Sigma-Aldrich and they were used as reference materials. Additional descriptions of all chemical reagents and the sample preparation protocol were summarized in Supplementary Table S1.
The field samples were collected from a municipal WWTP located in Southern California. The MW-6 and MW-5 groundwater samples were collected from two groundwater monitoring wells installed around the WWTP, using dedicated Groundfos submersible pumps, stored in polypropylene sample bottles with Teflon®-free caps, and in compliance with the PFAS sampling guidance document published by the California State Water Resources Control Board (SWRCB). The PFASs of the field samples were determined to be at the ppt level using the EPA recommended Draft Method 1633 (EPA, 2022) by a commercial certified by the Department of Defense laboratory.
Several reference PFAS chemicals, including PFOS, and groundwater samples were prepared by simply drying the liquid mixtures on clean 1 × 1 cm2 silicon (Si) wafer chips after depositing 25 µL of the liquid containing PFAS chemicals on the clean Si chip under ambient conditions (Wei et al., 2017; Fu et al., 2018; Sui et al., 2018). Samples were dried in a laminar flow and protected under Parafilm prior to analysis.
A ToF-SIMS V spectrometer (IONTOF GmbH, Münster, Germany) was used to analyze representative PFAS reference chemicals and PFAS-containing groundwater samples. The SIMS analysis was performed using a 25 keV pulsed bismuth (Bi3+) primary beam ion under high vacuum of 10–8 mbar during measurements. The Bi3+ primary ion beam scanned over a 500 × 500 μm2 area for field water samples and 200 × 200 μm2 area for reference chemicals, respectively, with a resolution of 128 by 128 pixels. The pulsed current of Bi3+ was set at 0.54 pA at a repeating frequency of 10 kHz. Each spectrum was acquired for 100 scans. The primary ion doses in all measurements were lower than the static limit, and the damage artifacts resulting from the Bi3+ primary ion beam was negligible. Mass resolution was in the range of 3000–7000, varying from sample to sample depending on the sample roughness. At least five positive and five negative ion replicate spectra were collected at various locations randomly for each sample including groundwater samples.
ToF-SIMS spectral analysis and 2D image reconstruction were performed using the IONTOF SurfaceLab 7 software. Mass spectra were calibrated using CH+, CH2+, CH3+, C2H5+, C3H5+, Si2C5H15O+, and Si3C7H21O2+ in the positive ion mode and CH−, C2−, C2H−, C3H−, and SiO2− in the negative ion mode, respectively. Results were exported and plotted in Igor 8.0. Interference peaks such as Si were removed before running principal component analysis (PCA). Peaks were selected using spectral overlay. Selected peaks were used in PCA using Matlab (R2020a, Math Works, Inc., United States). SIMS spectral data were treated by normalization to the total ion intensity of selected peaks, square root transformation, and mean-centering prior to performing spectral PCA. More details were available in previous reports (Ding et al., 2016; Zhang et al., 2019a; Wei et al., 2020).
It is assumed that the instrument response counts (y) are linearly related to the standard concentration (x) for a limited range of concentration when there is a linear calibration curve (Armbruster and Pry, 2008). This model is used to compute the LOD. The LOD can be expressed as
The LOD can be calculated as
The LODs can be improved by increasing the secondary ion yields via either wider pulse width or longer analysis frames. Recent results have shown at least an order of magnitude increase in LODs using this approach (Coullerez et al., 2003; Klump et al., 2018). Sample properties, such as cohesive energy and density, could influence the LOD or surface sensitivity of the primary ion source due to the amount of surface erosion (Muramoto et al., 2012). Method development and optimization is needed to improve the LOD of the target PFAS analytes using ToF-SIMS in the future.
The estimated LODs does not seem to be low as what the more developed LC-MS/MS methods could offer. However, real field water sample analysis results, to be discussed below in more details, show that the SIMS LODs are equivalent to the ppt level LODs from LC-MS/MS. The surface sensitivity of ToF-SIMS has been widely used in forensic analysis (Lee et al., 2016; Cai et al., 2017; Terlier et al., 2020), such sensitivity is not easily translatable to an equivalent LODs in terms of the conventional definition of bulk samples. Regardless, because the forensic surface analysis capabilities inherent of ToF-SIMS, trace PFASs can be detected using simple sample preparation and a small amount (i.e., microliter) of water samples.
During SIMS spectral analysis, relative mass accuracy, defined as Δm = Abs (106 × (m/z—obs − m/z—the)/m/z—the) in ppm, and measurement repeatability shown as standard deviation (S.D.) are key factors for obtaining reliable peak identifications. Peak identifications of analyzed PFAS compounds are summarized in Table 1 and Supplementary Table S2. The relative standard deviation (RSD%) is calculated as peak area S.D. divided by the mean peak area. The RSD% results of representative peaks based on the PFBA and PFOS samples are listed in Supplementary Tables S3–S5, respectively. The RSDs% are generally less than 2.5% for PFOS and PFBA, indicating good reproducibility.
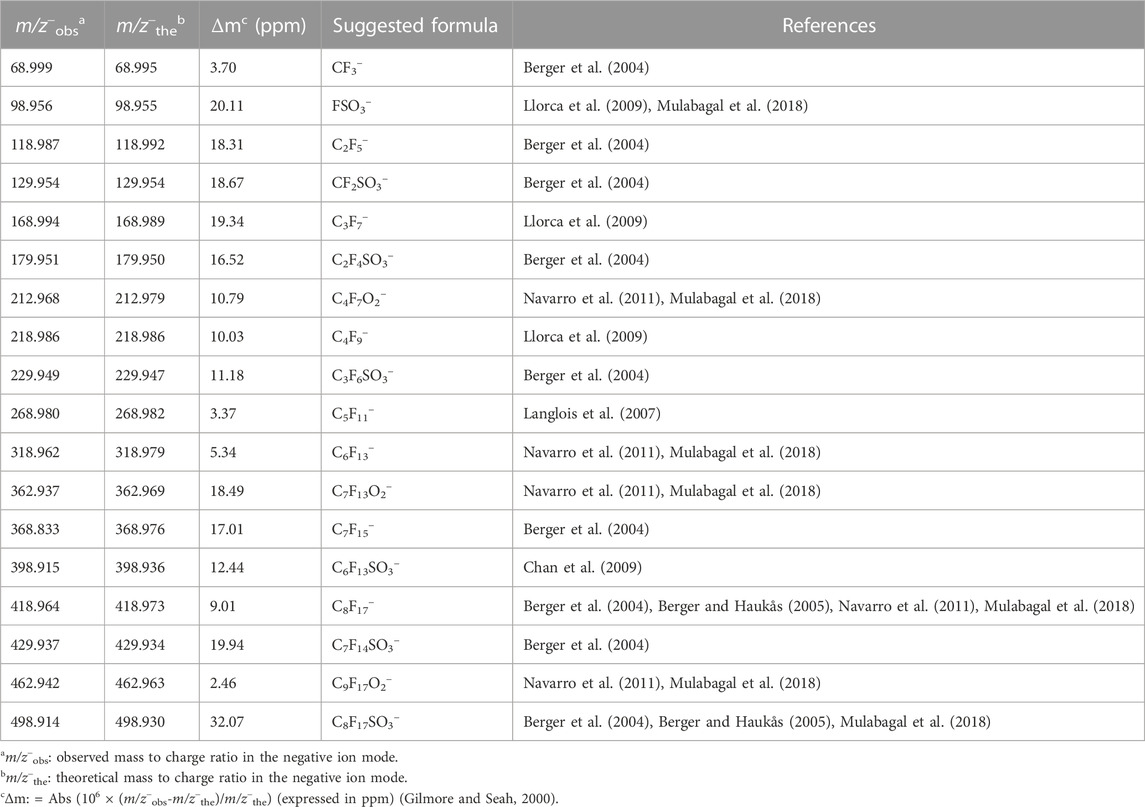
TABLE 1. Possible peak assignment of PFOS and PFBA using ToF-SIMS in the negative mode.
The values of relative mass accuracy of most peaks are less than 30 ppm in the negative mode and less than 100 ppm in the positive mode, suggesting that the peak identification is dependable. The standard deviations of most peak areas are between 10% and 20% among all parallel samples. The standard deviations of peak height are larger than those of peak areas. Using peak area for peak identification would be more dependable in measurement evaluation because the intensity is spread over the mass scale due to imperfect energy compensation and topography effects for a specific ion. Therefore, the peak height consequently gives a smaller value with poorer repeatability. Thus, the peak area standard deviation is better to describe SIMS spectral repeatability. The PFAS measurement repeatability results shown in this work are satisfactory for static ToF-SIMS as a semi-quantitative analysis technique (Gilmore and Seah, 2000; Gilmore et al., 2005; Gilmore et al., 2007). Most importantly, SIMS offers sensitive and reproducible detection of characteristic ions and ion fragments of PFAS readily as shown in Supplementary Figures S3, S4.
The schematic of spectral and 2D image analysis using ToF-SIMS is depicted in Figure 1. The volume of PFAS reference and groundwater samples is 25 μL and the sample can be easily prepared followed with analysis in ToF-SIMS without additional sample treatment. This method is simple in comparison with other techniques such as GC-MS/MS and LC-MS/MS. The latter requires extraction with organic solvents or pretreatment before analysis (Bach et al., 2016; Dauchy, 2019). ToF-SIMS is a mass spectral imaging technique, and both spectra and images are acquired during measurements. Characteristic peaks for each PFAS reference materials are observed in ToF-SIMS mass spectra (See Table 1 and Supplementary Table S2). Moreover, 2D images give direct visualization of the distribution of PFAS components, like the m/z− 268.980 C5F11− and m/z− 218.986 C4F9− in a mixture. This feature of spatial distribution of different components is especially appealing in studying complex PFAS mixtures.
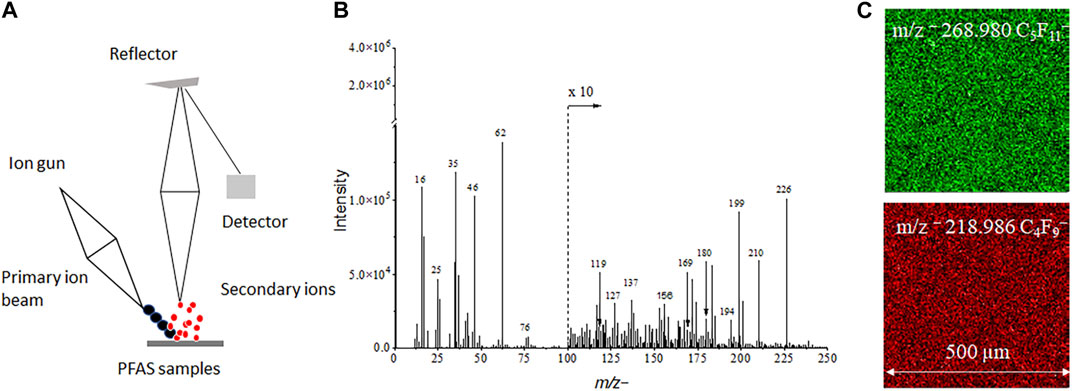
FIGURE 1. (A) A ToF-SIMS schematic showing PFAS analysis in mass spectral (B) and 2D imaging (C) mode.
To assure the precision of SIMS spectral measurements, at least five repetitions were acquired for every PFAS reference material and real-world samples in the positive and negative mode, respectively. Good repeatability is illustrated in Supplementary Figures S3, S4. Figure 2 depicts ToF-SIMS spectral comparison of long-chain and short-chain PFASs, including PFBA, PFPeA, PFHpA, PFNA, PFOS, two mixtures containing PFBA and PFOS as well as PFPeA and PFOS, and the Si wafer control in the mass range of m/z− 0–500 in the negative mode. Additionally, the positive spectral comparisons are depicted in Supplementary Figure S5.
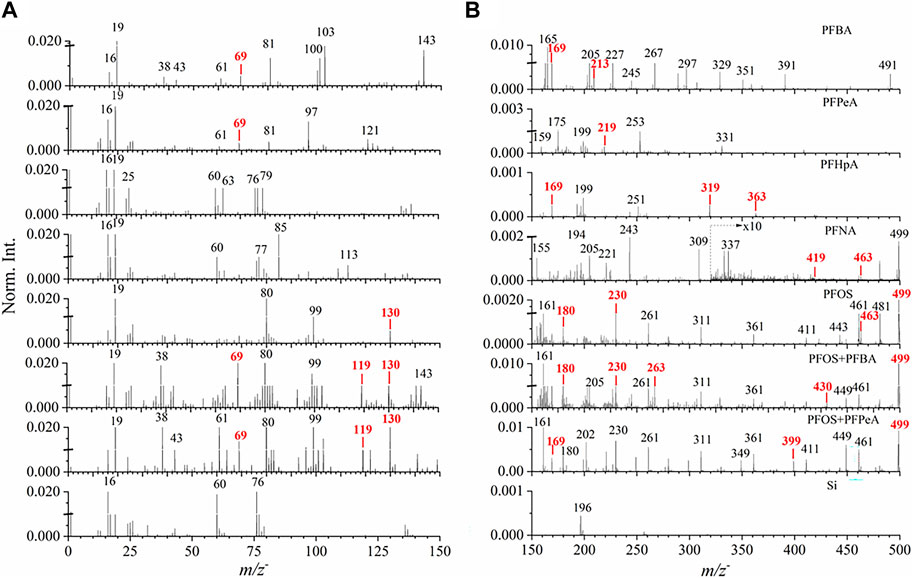
FIGURE 2. ToF−SIMS spectral comparison of seven reference PFASs samples and clean Si wafer in the mass range of (A) m/z− 0–150 and (B) m/z− 150–500 in the negative ion mode. Red color mark indicates main fragment ion peaks and pseudo-molecular peaks in each spectrum. Norm. Int. stands for Normalized Intensity. The peaks are marked in integers for visual convenience. More details are seen in Table 1 and Supplementary Table S2.
Three main spectral results are shown in Figure 2. First, PFASs, including several representative PFCA compounds and PFOS, are fluorinated compounds. The fluoride ion peak, m/z− 18.999 F−, was observed with much higher intensities in all samples, indicating the detection of fluorine fragments. This finding shows the convenience of direct fluoride detection using SIMS compared to other bulk conversion methods (McDonough et al., 2019; Schultes et al., 2019). Second, typical pseudo-molecular ions [M-H]− peaks were observed and identified for each PFAS reference compound in the negative mode (Table 1). Specifically, these ions are m/z− 212.968 C4F7O2− for PFBA, 262.894 C5F9O2− for PFPeA, 362.937 C7F13O2− for PFHpA, 462.942 C9F17O2− for PFNA, and 498.914 C8F17SO3− for PFOS (Figure 2), respectively. As to the two mixtures consisting of PFBA and PFOS and PFPeA and PFOS, the corresponding molecular ions peaks (i.e., m/z− 212.968 C4F7O2− and 498.914 C8F17SO3−; 262.894 C5F9O2− and 498.914 C8F17SO3−) are observed in Figure 2B, respectively.
Additionally, characteristic PFASs fragment ion peaks were observed and identified (Table 1). Figure 2A shows that the main fragment ion peaks for PFBA are m/z− 68.999 CF3−, 118.987 C2F5−, and 168.994 C3F7. Some higher intensity mass peaks (i.e., m/z− 81.020, 99.983, 169.034) belong to the fragments of PFBA according to the NIST WebBook reference mass spectra (Linstrom, 1997; NIST, 2023). However, they cannot be identified according to present literature. The pseudo-molecular peak m/z− 212.979 of PFBA is evident in the spectrum. PFPeA, PFHpA, and PFNA share common fragments peaks with PFBA, including m/z− 68.999 CF3−, 118.987 C2F5−, and 168.994 C3F7−, because of similar molecular structures. In contrast, some peaks show relatively lower intensity possibly due to fragmentation difference among compounds. With the increase of molecular weight of reference PFAS chemicals, a series of fragments were observed, such as m/z− 218.986 C4F9− (Figure 2B), 318.962 C6F13− (Figure 2B), and 368.883 C7F15− (Figure 2B). Similarly, some unidentified peaks (e.g., m/z− 81.020, 96.979, 120.952) are representative in PFPeA fragments. Peaks, such as m/z− 61.001, 76.974, 85.001, 112.992, 155.016, 220.933, and 242.943, come from PFNA fragments according to the NIST WebBook (Linstrom, 1997).
From the SIMS spectral comparison, representative fragment ion peaks from PFOS were observed and identified in Figure 2, such as m/z− 79.969 SO3−, 98.956 FSO3−, 129.954 CF2SO3−, 179.951 C2F4SO3−, and 229.949 C3F6SO3−. In the lab-prepared mixture samples, these peaks have significant occurrences with higher mass counts due to the presence of PFOS. Previous analyses using HPLC-MS/MS also report these characteristic peaks from PFOS (Berger et al., 2004). Higher intensity peaks, such as m/z− 310.954, 361.023, and 460.923, without identification might be related to PFOS, because these peaks appear in the spectra of PFOS and the two-component mixtures containing PFOS. The signal to noise ratios (SNRs) for the labeled ions with low relative abundance in the spectra, such as m/z− 118.987, 212.986, 268.980, 362.937, 368.833, and 419.984, are 3970, 124, 206, 71, 323 and 27, respectively, which indicate that these ions exist in the PFAS samples with reasonable signal intensities.
Spectral PCA was conducted to confirm the observation of spectral analysis of representative two-component mixtures, including PFBA and PFOS and PFPeA and PFOS, respectively, and to further elucidate characteristic PFAS peaks. Figs. S6a − S6b depict the scores plots of principal component one (PC1), PC2, and PC3; and Figs. S6c − S6d give the corresponding loadings plots in the negative ion mode. Representative pseudo−molecular ion peaks of PFBA, PFPeA, and PFOS have high loadings in the loadings plots. They act as key contributors separating selected PFASs as expected. For example, PFBA, PFHpA, and PFNA are situated in the PC1 positive score quadrant (Supplementary Figure S6A), suggesting that their molecular peaks should have positive PC1 loadings. The PCA results also demonstrate that molecular peaks, such as m/z− 212.968 C4F7O2−, 362.937 C7F13O2− and 462.942 C9F17O2− corresponding to PFBA, PFHpA, and PFNA in positive PC1 loadings, respectively, are main contributors in the separation among different samples (Supplementary Figure S6C). PC1 cannot separate PFPeA from other samples, while PC2 and PC3 can with PFPeA residing in the PC2 positive scores plot (Supplementary Figure S6A) and PC3 negative scores plot (Supplementary Figure S6B). The molecular peak of PFPeA m/z− 262.894 C5F9O2− is situated in PC2 positive (Supplementary Figure S6D) and PC3 negative loading plots (Supplementary Figure S6E). The mixture substances and PFOS are only separated from other samples by PC1 due to the common component PFOS, and PC1 loadings plots (Supplementary Figure S6C), and the molecular peak of m/z− 498.914 C8F17SO3− is situated in PC1 negative.
Figure 3 depicts the normalized 2D image comparison of the spatial distribution of molecular ion peaks among the single components and mixtures in the negative ion mode. The dark sub-regions in Figures 3B,C indicate low ion counts. Detection of PFAS mixture compounds without further sample treatment shows selectivity of ToF-SIMS as a technique to analyze PFASs. Figures 3A−C represents the 2D normalized images and distributions of key peaks of the single components and the two-component mixture consisting of PFOS and PFBA. Representative molecular ion peaks of m/z− 212.968 PFBA are in red and m/z− 498.914 PFOS in green. PFOS shows a higher molecular ion peak intensity than PFBA. It is not surprising that the PFOS is predominant in the mixture, in agreement with findings in the spectral analysis. Similarly, the second mixture of PFPeA and PFOS (Figures 3D−F) shows consistent results as the other mixture in Figures 3A–C. The normalized intensity of the molecular ion peak m/z− 498.914 PFOS is higher than that of m/z− 262.894 PFPeA. 2D SIMS images give direct visualization of main components as an attractive feature in mass spectral imaging, showing long-chain and short-chain PFASs spatial distribution. This is a unique SIMS feature that bulk MS analysis could not provide.
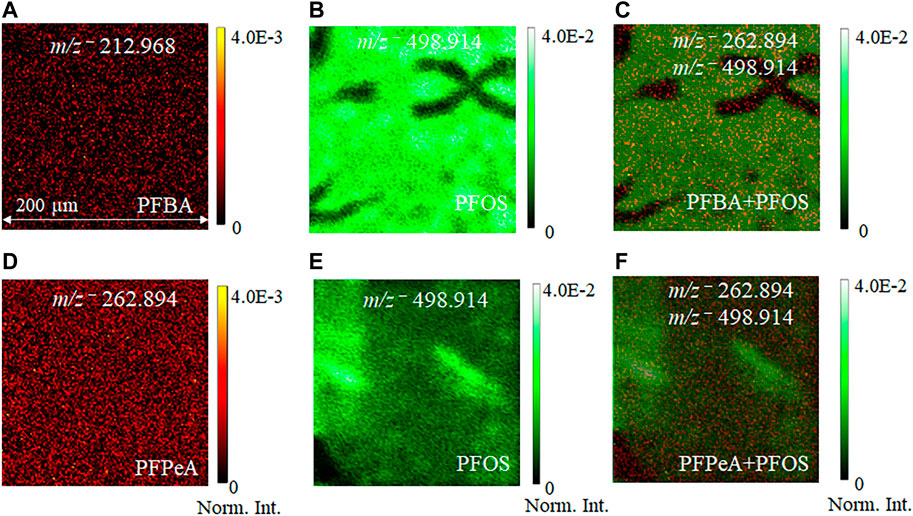
FIGURE 3. Comparison of normalized 2D ToF-SIMS images of pseudo−molecular ion distributions from the single component PFAS sample and the two−component mixture: (A) PFBA m/z− 212.968, (B) PFOS m/z− 498.914, (C) PFBA + PFOS m/z− 212.968, 498.914; (D) PFPeA m/z− 262.894; (E) PFOS m/z− 498.914; and (F) PFPeA + PFOS m/z− 262.942 and 498.914, respectively. 2D images are normalized to the total ion counts for ease of comparisons.
Figure 4A−b show the spectral comparison plots of real groundwater samples. Fluorinated compounds, such as m/z− 168.994 C3F−, 268.980 C5F11−, and 368.833 C7F15−, can be detected in two groundwater samples named MW-5 and MW-6, respectively. In addition, characteristic pseudo-molecular ions [M-H]− peaks were observed and identified for the groundwater samples in the negative mode, such as m/z− 262.894 C5F9O2− and m/z− 362.937 C7F13O2−. Furthermore, fragment ion peaks with relatively higher masses from PFOS, like m/z− 179.951 C2F4SO3−, were observed in groundwater samples. This finding indicates that ToF-SIMS is an extremely sensitive technique for the PFPeA and PFOS detection from the environmental water sample. Interestingly, the representative normalized 2D images of the PFASs related peaks, including m/z− 218.986 C4F9−, m/z− 268.980 C5F11−, m/z− 318.962 C6F13−, and m/z− 368.833 C7F15−, were observed (Figure 4C), giving direct evidence of PFAS detection. The polluted ground water containing PFAS was in the form of a slurry. Dilution was used to dissipate the particles more evenly on the Si substrate. The mass ion spatial distribution depicted in Figure 4 gives a representation of ions of interest in the complex mixture and their relative abundance to each other in a small volume, namely, several microliters were used to prepare the sample. The relative abundances of the selected ions are different between MW5 and MW6, which were collected from different wells in a polluted site.
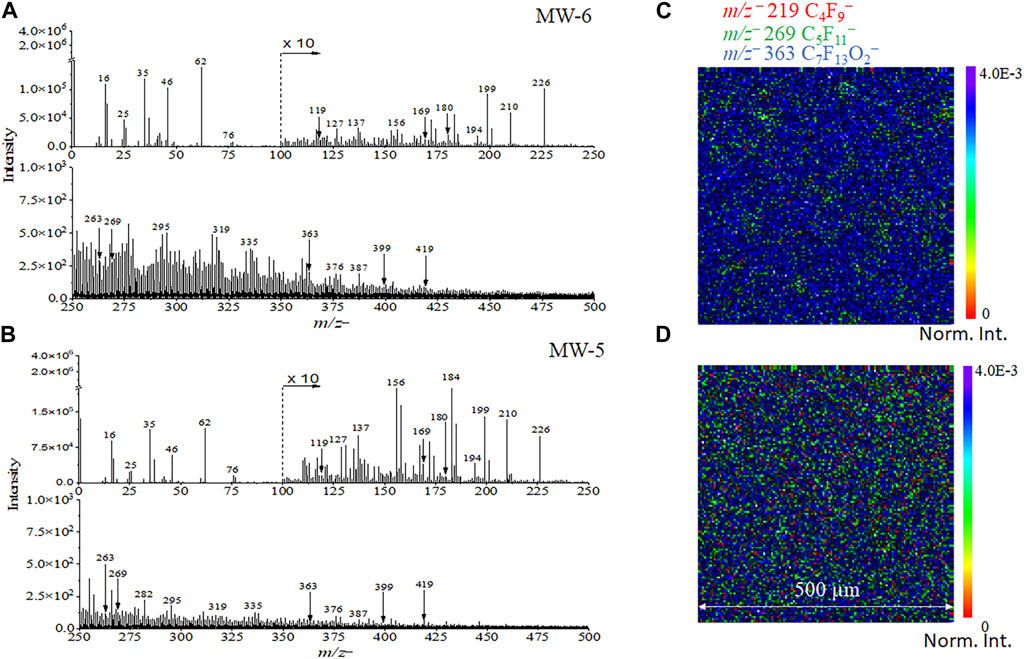
FIGURE 4. ToF−SIMS spectral results of (A) MW-6 and (B) MW-5 real world groundwater samples from the field. Normalized 2D SIMS images of selected ions of MW-6 (C) and MW-5 (D) containing PFASs. 2D images are normalized to the total ion counts for ease of comparisons.
Supplementary Figure S8 depicts the comparisons of SIMS 2D images of m/z− 219, 269, and 363 between the Si substrate (a–c) and the ground water sample MW-6 (d–f), respectively. Unlike the 2D normalized images in Figure 3, 4 in the main text, these results are shown in the measurement counts. The counts of the real-world sample MW-6 are on the order of 104 for peaks of interest. Such intensity indicates that the detected peaks are real and not noise. Comparable results of MW-5 are depicted in Supplementary Figure S9. Spatial distribution of PFAS is important because there is a huge interest to understand the PFAS laden materials to address grand challenges in understanding the fate PFAS degradation and environmental restoration. First, having the PFAS distribution will help answer the question of where PFAS compounds reside in the PFAS-laden materials, e.g., clay or resin as amendment. Liquid extraction can tell you the amount of PFAS but not the location. Also, the ability to offer chemical maps of PFAS and its PFAS degradation products in the PFAS loaded amendments would be attractive to decipher the reaction pathways. Again, liquid extraction and bulk LC-MS or GC-MS analyses could tell you how much not where and how relative to the original location of the PFAS.
Selected peak spectral PCA was conducted to confirm the observation of spectral analysis of laboratory prepared mixtures and real-world groundwater samples. As shown in Figure 5A, PC1 and PC2 can explain more than 66% of all data. PFPeA, PFBA, PFOS, mixture of PFOS and PFBA, and mixture of PFOS with PFPeA are situated in the PC1 positive score quadrant, suggesting the molecular peaks have high positive PC1 loadings, including m/z− 68.999 CF3−, m/z− 98.956 FSO3−, m/z− 129.954 CF2SO3−, m/z− 229.949 C3F6SO3−, and m/z− 498.914 C8F17SO3−. PC2 separates the PFHpA, PFNA, and PFOS from the two groundwater samples (i.e., MW-5 and MW-6), PFPeA, PFBA, PFOS + PFBA, and PFOS + PFPeA. The characteristic peaks in the PC2 negative loadings are m/z− 268.980 C5F11−, m/z− 368.833 C7F15−, and m/z− 429.937 C7F14SO3−. This finding is consistent with the spectral analysis results as discussed before. In addition, Figure 5B shows the PCA results of PC2 vs. PC5. PC5 separates the two groundwater samples containing PFASs, and the relevant characteristic peaks are shown in the loadings plots, for example, the peak m/z− 262.894 C5F9O2− has a higher loading in PC5 positive, and m/z− 362.937 C7F13O2− has a higher loading in PC5 negative. Loadings plots of PC1, PC2, and PC5 are shown in Figures 5C–E respectively.
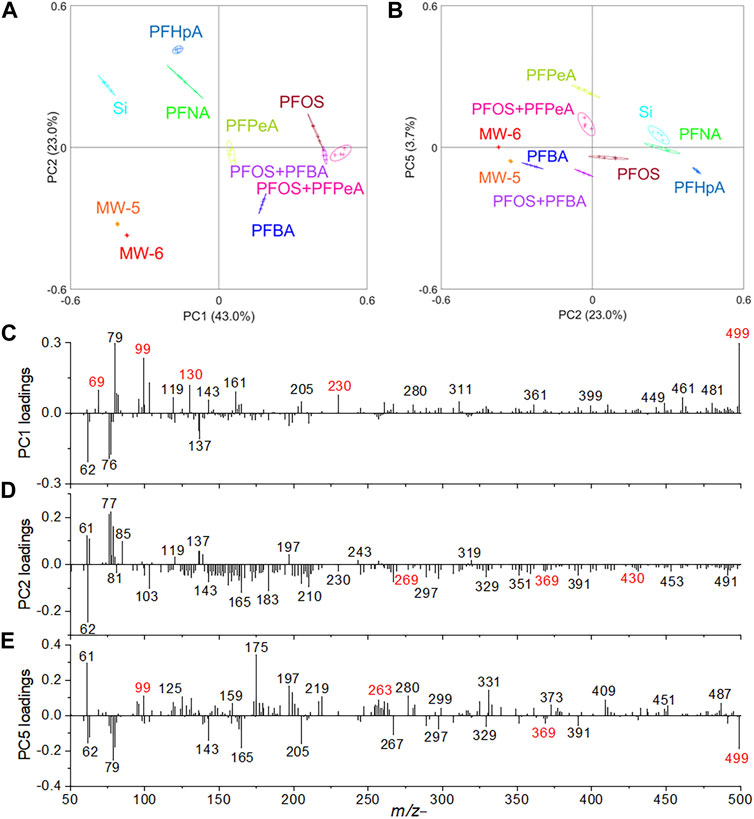
FIGURE 5. Selected peak spectral PCA results in the negative mode: (A) scores plot of PC1 vs. PC2, (B) scores plot of PC2 vs. PC5, (C) PC1, (D) PC2, and (E) PC5 loadings plots.
The ppt level concentrations of approximately 20 ppb of PFASs in the field groundwater samples were verified based on the commercial laboratory analysis using LC-MS/MS. Additional comparison and quantification will be investigated in the next step. Thus, our results demonstrate that ToF-SIMS can detect PFAS at concentrations in ppt level using micrometer of real water samples, i.e., significantly lower than the estimated LODs. Furthermore, our finding show that ToF-SIMS has the potential to tackle with the challenge of determining PFAS contamination in drinking water and groundwater using the forensic analysis (Zhou et al., 2016; Terlier et al., 2020) and source tracking capabilities (Kempson et al., 2003; Héberger, 2008; Kind and Fiehn, 2010). The latter is a topic that is worth of additional investigation.
PFAS contamination in groundwater and soil is a major concern in the environment (Nzeribe et al., 2019; Anderson et al., 2021; Kurwadkar et al., 2022). Concerns over investigation-derived waste (IDW) continues to grow (Singh et al., 2019; Lenka et al., 2021; Longendyke et al., 2022). IDW refers to water, soil and drill cuttings produced during well installations and sampling activities performed during contaminated site investigations. Recently, the memorandum of Temporary Prohibition on Incineration of Materials Containing PFASs calls for a better understanding of PFAS-laden materials (DOD, 2022). Our results show that ToF-SIMS can provide mass spectra in one-dimension and 2D maps of PFAS as well as PFAS dissociation products. Therefore, ToF-SIMS, as an imaging technique, offers a unique and much needed solution to analyzing and imaging PFAS compounds directly on the surface or substrate of the PFAS laden materials, unlike the bulk LC-MS/MS or GC-MS/MS approaches. The latter methods require sample preparation and extraction, which destroys the PFAS-laden materials.
In conclusion, we demonstrate that ToF-SIMS can be used to analyze persistent PFAS pollutants with simple sample preparation due to its superior surface sensitivity. Characteristic pseudo-molecular ion peaks of several representative PFASs were observed. In both simulated mixture samples and real groundwater samples, 2D visualization of PFASs, including PFOS, component distributions are possible. Overall, our results show that ToF-SIMS is viable to detect PFASs in groundwater using a minute amount of liquid sample with easy sample preparation. SIMS as a mass spectral imaging technique is attractive due to its simplicity in sample preparation, small volume of samples, and efficiency of sample analysis. More importantly, the forensic potential of ToF-SIMS in detecting trace amount of PFASs in wastewater is appealing in understanding PFAS contamination in drinking water and groundwater and pollutant source tracking. More environmental water samples are warranted for analysis in ToF-SIMS to provide a rich reference library of data for its future applications to better determine PFASs in the environmental water.
The original contributions presented in the study are included in the article/Supplementary Material, further inquiries can be directed to the corresponding author.
X-YY: Conceptualization, Data curation, Formal Analysis, Funding acquisition, Investigation, Methodology, Project administration, Resources, Supervision, Validation, Writing–original draft, Writing–review and editing. CY and JG: Data curation, Formal Analysis, Writing–review and editing. JX: Data curation, Methodology, Resources, Validation, Writing–review and editing. XS: Writing–review and editing. LZ: Data curation, Formal Analysis, Writing–review and editing, Resources. YZ: Data curation, Writing–review and editing, Formal Analysis. JS: Writing–review and editing, Data curation.
X-YY is indebted to the support of the strategic Laboratory Directed Research and Development of the Physical Sciences Directorate of the Oak Ridge National Laboratory (ORNL). CY is grateful for support from the Chinese National Scholarship and Laboratory for Marine Ecology and Environmental Science, Qingdao National Laboratory for Marine Science and Technology (LMEES2010809). JX thanks Department of Defense Environmental Security Technology Certification Program (project number ER21-5153) for support. X-YY thanks the SERDP WP 18-1660 for partial support of initial analysis. Pacific Northwest National Laboratory is operated for the U.S. Department of Energy (DOE) by Battelle Memorial Institute under Contract No. DE-AC05-76RL01830. ORNL is managed by UT-Battelle, LLC, for the U. S. DOE under contract number DE-AC05-00OR22725. This manuscript has been authored by UT-Battelle, LLC under Contract No. DE-AC05-00OR22725 with the U.S. DOE. The United States Government retains and the publisher, by accepting the article for publication, acknowledges that the United States Government retains a non-exclusive, paid-up, irrevocable, worldwide license to publish or reproduce the published form of this manuscript, or allow others to do so, for United States Government purposes. The DOE will provide public access to these results of federally sponsored research in accordance with the DOE Public Access Plan (http://energy.gov/downloads/doe-public-access-plan).
Author JX was employed by Haley & Aldrich Inc.
The remaining authors declare that the research was conducted in the absence of any commercial or financial relationships that could be construed as a potential conflict of interest.
All claims expressed in this article are solely those of the authors and do not necessarily represent those of their affiliated organizations, or those of the publisher, the editors and the reviewers. Any product that may be evaluated in this article, or claim that may be made by its manufacturer, is not guaranteed or endorsed by the publisher.
The Supplementary Material for this article can be found online at: https://www.frontiersin.org/articles/10.3389/fchem.2023.1253685/full#supplementary-material
Abunada, Z., Alazaiza, M. Y. D., and Bashir, M. J. K. (2020). An overview of per- and polyfluoroalkyl substances (PFAS) in the environment: source, fate, risk and regulations. Water 12, 3590. doi:10.3390/w12123590
Alves, A. V., Tsianou, M., and Alexandridis, P. (2020). Fluorinated surfactant adsorption on mineral surfaces: implications for PFAS fate and transport in the environment. Surfaces 3, 516–566. doi:10.3390/surfaces3040037
Anderson, R. H., Thompson, T., Stroo, H. F., and Leeson, A. (2021). US department of defense–funded fate and transport research on per- and polyfluoroalkyl substances at aqueous film–forming foam–impacted sites. Environ. Toxicol. Chem. 40, 37–43. doi:10.1002/etc.4694
Armbruster, D. A., and Pry, T. (2008). Limit of blank, limit of detection and limit of quantitation. Clin. Biochem. Rev. 29 (1), S49–S52.
Bach, C., Boiteux, V., Hemard, J., Colin, A., Rosin, C., Munoz, J. F., et al. (2016). Simultaneous determination of perfluoroalkyl iodides, perfluoroalkane sulfonamides, fluorotelomer alcohols, fluorotelomer iodides and fluorotelomer acrylates and methacrylates in water and sediments using solid-phase microextraction-gas chromatography/mass spectrometry. J. Chromatogr. A 1448, 98–106. doi:10.1016/j.chroma.2016.04.025
Benskin, J. P., Bataineh, M., and Martin, J. W. (2007). Simultaneous characterization of perfluoroalkyl carboxylate, sulfonate, and sulfonamide isomers by liquid chromatography−Tandem mass spectrometry. Anal. Chem. 79, 6455–6464. doi:10.1021/ac070802d
Berger, U., and Haukås, M. (2005). Validation of a screening method based on liquid chromatography coupled to high-resolution mass spectrometry for analysis of perfluoroalkylated substances in biota. J. Chromatogr. A 1081, 210–217. doi:10.1016/j.chroma.2005.05.064
Berger, U., Langlois, I., Oehme, M., and Kallenborn, R. (2004). Comparison of three types of mass spectrometer for high-performance liquid chromatography/mass spectrometry analysis of perfluoroalkylated substances and fluorotelomer alcohols. Eur. J. Mass Spectrom. (Chichester) 10, 579–588. doi:10.1255/ejms.679
Cai, L., Xia, M.-C., Wang, Z., Zhao, Y.-B., Li, Z., Zhang, S., et al. (2017). Chemical visualization of sweat pores in fingerprints using GO-enhanced TOF-SIMS. Anal. Chem. 89, 8372–8376. doi:10.1021/acs.analchem.7b01629
Capriotti, A. L., Cavaliere, C., Cavazzini, A., Foglia, P., Lagana, A., Piovesana, S., et al. (2013). High performance liquid chromatography tandem mass spectrometry determination of perfluorinated acids in cow milk. J. Chromatogr. A 1319, 72–79. doi:10.1016/j.chroma.2013.10.029
Chan, E., Sandhu, M., Benskin, J. P., Ralitsch, M., Thibault, N., Birkholz, D., et al. (2009). Endogenous high-performance liquid chromatography/tandem mass spectrometry interferences and the case of perfluorohexane sulfonate (PFHxS) in human serum; are we overestimating exposure? Rapid Commun. Mass Spectrom. 23, 1405–1410. doi:10.1002/rcm.4012
Chohan, A., Petaway, H., Rivera-Diaz, V., Day, A., Colaianni, O., and Keramati, M. (2021). Per and polyfluoroalkyl substances scientific literature review: water exposure, impact on human health, and implications for regulatory reform. Rev. Environ. Health 36, 235–259. doi:10.1515/reveh-2020-0049
Ciccotelli, V., Abete, M. C., and Squadrone, S. (2016). PFOS and PFOA in cereals and fish: development and validation of a high performance liquid chromatography-tandem mass spectrometry method. Food Control 59, 46–52. doi:10.1016/j.foodcont.2015.05.023
Čižinauskas, V., Elie, N., Brunelle, A., and Briedis, V. (2017). Fatty acids penetration into human skin ex vivo: A TOF-SIMS analysis approach. Biointerphases 12, 011003. doi:10.1116/1.4977941
Clarity, C., Trowbridge, J., Gerona, R., Ona, K., Mcmaster, M., Bessonneau, V., et al. (2021). Associations between polyfluoroalkyl substance and organophosphate flame retardant exposures and telomere length in a cohort of women firefighters and office workers in San Francisco. Environ. Health 20, 97. doi:10.1186/s12940-021-00778-z
Coullerez, G., Lundmark, S., Malmström, E., Hult, A., and Mathieu, H. J. (2003). ToF-SIMS for the characterization of hyperbranched aliphatic polyesters: probing their molecular weight on surfaces based on principal component analysis (PCA): ToF-SIMS of hyperbranched aliphatic polyesters. Surf. Interface Analysis 35, 693–708. doi:10.1002/sia.1592
Crone, B. C., Speth, T. F., Wahman, D. G., Smith, S. J., Abulikemu, G., Kleiner, E. J., et al. (2019). Occurrence of per- and polyfluoroalkyl substances (PFAS) in source water and their treatment in drinking water. Crit. Rev. Environ. Sci. Technol. 49, 2359–2396. doi:10.1080/10643389.2019.1614848
Dauchy, X. (2019). Per- and polyfluoroalkyl substances (PFASs) in drinking water: current state of the science. Curr. Opin. Environ. Sci. Health 7, 8–12. doi:10.1016/j.coesh.2018.07.004
Ding, Y., Zhou, Y., Yao, J., Szymanski, C., Frdrickson, J., Shi, L., et al. (2016). In situ molecular imaging of the biofilm and its matrix. Anal. Chem. 88, 11244–11252. doi:10.1021/acs.analchem.6b03909
DOD (2022). Temporary prohibition on incineration of materials containing per- and polyfluoroalkyl substances (PFAS). United States: EPA.
EPA (2022). 3rd Draft method 1633. Analysis of per- and polyfluoroalkyl substances (PFAS) in aqueous, solid, biosolids, and tissue samples by LC-MS/MS. United States: EPA.
Fisher, G. L., Bruinen, A. L., Ogrinc Potočnik, N., Hammond, J. S., Bryan, S. R., Larson, P. E., et al. (2016). A new method and mass spectrometer design for TOF-SIMS parallel imaging MS/MS. Anal. Chem. 88, 6433–6440. doi:10.1021/acs.analchem.6b01022
Fu, W., Shigetou, A., Shoji, S., and Mizuno, J. (2017). Low-temperature direct heterogeneous bonding of polyether ether ketone and platinum. Mater. Sci. Eng. C 79, 860–865. doi:10.1016/j.msec.2017.05.058
Fu, Y., Zhang, Y., Zhang, F., Chen, J., Zhu, Z., and Yu, X.-Y. (2018). Does interfacial photochemistry play a role in the photolysis of pyruvic acid in water? Atmos. Environ. 191, 36–45. doi:10.1016/j.atmosenv.2018.07.061
Gilmore, I. S., Green, F. M., and Seah, M. P. (2007). Static TOF-SIMS. A VAMAS interlaboratory study. Part II - accuracy of the mass scale and G-SIMS compatibility. Surf. Interface Analysis 39, 817–825. doi:10.1002/sia.2596
Gilmore, I. S., Seah, M. P., and Green, F. M. (2005). Static TOF-SIMS — A VAMAS interlaboratory study. Part I. Repeatability and reproducibility of spectra. Surf. Interface Analysis 37, 651–672. doi:10.1002/sia.2061
Gilmore, I. S., and Seah, M. P. (2000). Static SIMS inter-laboratory study. Surf. Interface Analysis 29, 624–637. doi:10.1002/1096-9918(200009)29:9<624::aid-sia908>3.0.co;2-f
Groffen, T., Bervoets, L., Jeong, Y., Willems, T., Eens, M., and Prinsen, E. (2021). A rapid method for the detection and quantification of legacy and emerging per- and polyfluoroalkyl substances (PFAS) in bird feathers using UPLC-MS/MS. J. Chromatogr. B 1172, 122653. doi:10.1016/j.jchromb.2021.122653
Héberger, K. (2008). “Chemoinformatics—multivariate mathematical–statistical methods for data evaluation,” in Medical applications of mass spectrometry (Netherlands: Elsevier), 141–169.
Kempson, I. M., Skinner, W. M., Kirkbride, P. K., Nelson, A. J., and Martin, R. R. (2003). Time-of-Flight secondary ion mass spectrometry analysis of hair from archaeological remains. Eur. J. Mass Spectrom. 9, 589–597. doi:10.1255/ejms.584
Kind, T., and Fiehn, O. (2010). Advances in structure elucidation of small molecules using mass spectrometry. Bioanal. Rev. 2, 23–60. doi:10.1007/s12566-010-0015-9
Klump, A., Zhou, C., Stevie, F. A., Collazo, R., and Sitar, Z. (2018). Improvement in detection limit for time-of-flight SIMS analysis of dopants in GaN structures. J. Vac. Sci. Technol. B, Nanotechnol. Microelectron. 36, 03F102. doi:10.1116/1.5013001
Kucharzyk, K. H., Darlington, R., Benotti, M., Deeb, R., and Hawley, E. (2017). Novel treatment technologies for PFAS compounds: A critical review. J. Environ. Manage 204, 757–764. doi:10.1016/j.jenvman.2017.08.016
Kurwadkar, S., Dane, J., Kanel, S. R., Nadagouda, M. N., Cawdrey, R. W., Ambade, B., et al. (2022). Per- and polyfluoroalkyl substances in water and wastewater: A critical review of their global occurrence and distribution. Sci. Total Environ. 809, 151003. doi:10.1016/j.scitotenv.2021.151003
Langlois, I., Berger, U., Zencak, Z., and Oehme, M. (2007). Mass spectral studies of perfluorooctane sulfonate derivatives separated by high-resolution gas chromatography. Rapid Commun. Mass Spectrom. 21, 3547–3553. doi:10.1002/rcm.3241
Lassalle, J., Gao, R., Rodi, R., Kowald, C., Feng, M., Sharma, V. K., et al. (2021). Degradation of PFOS and PFOA in soil and groundwater samples by high dose Electron Beam Technology. Radiat. Phys. Chem. 189, 109705. doi:10.1016/j.radphyschem.2021.109705
Lee, J., Nam, Y. S., Min, J., Lee, K.-B., and Lee, Y. (2016). TOF-SIMS analysis of red color inks of writing and printing tools on questioned documents. J. Forensic Sci. 61, 815–822. doi:10.1111/1556-4029.13047
Lenka, S. P., Kah, M., and Padhye, L. P. (2021). A review of the occurrence, transformation, and removal of poly- and perfluoroalkyl substances (PFAS) in wastewater treatment plants. Water Res. 199, 117187. doi:10.1016/j.watres.2021.117187
Linstrom, P. (1997). NIST Chemistry WebBook, NIST standard reference database 69. United States: National Institute of Standards and Technology.
Llorca, M., Farre, M., Pico, Y., and Barcelo, D. (2009). Development and validation of a pressurized liquid extraction liquid chromatography-tandem mass spectrometry method for perfluorinated compounds determination in fish. J. Chromatogr. A 1216, 7195–7204. doi:10.1016/j.chroma.2009.06.062
Longendyke, G. K., Katel, S., and Wang, Y. (2022). PFAS fate and destruction mechanisms during thermal treatment: a comprehensive review. Environ. Sci. Process. Impacts 24, 196–208. doi:10.1039/d1em00465d
Mcdonough, C. A., Guelfo, J. L., and Higgins, C. P. (2019). Measuring total PFASs in water: the tradeoff between selectivity and inclusivity. Curr. Opin. Environ. Sci. Health 7, 13–18. doi:10.1016/j.coesh.2018.08.005
Médard, N., Poleunis, C., Eynde, X. V., and Bertrand, P. (2002). Characterization of additives at polymer surfaces by ToF-SIMS: ToF-SIMS characterization of additives at polymer surfaces. Surf. Interface Analysis 34, 565–569. doi:10.1002/sia.1361
Monge Brenes, A. L., Curtzwiler, G., Dixon, P., Harrata, K., Talbert, J., and Vorst, K. (2019). PFOA and PFOS levels in microwave paper packaging between 2005 and 2018. Food Addit. Contam. 12, 191–198. doi:10.1080/19393210.2019.1592238
Mulabagal, V., Liu, L., Qi, J., Wilson, C., and Hayworth, J. S. (2018). A rapid UHPLC-MS/MS method for simultaneous quantitation of 23 perfluoroalkyl substances (PFAS) in estuarine water. Talanta 190, 95–102. doi:10.1016/j.talanta.2018.07.053
Muramoto, S., Brison, J., and Castner, D. G. (2012). Exploring the surface sensitivity of TOF-secondary ion mass spectrometry by measuring the implantation and sampling depths of Bi n and C 60 ions in organic films. Anal. Chem. 84, 365–372. doi:10.1021/ac202713k
Navarro, I., Sanz, P., and Martinez, M. A. (2011). Analysis of perfluorinated alkyl substances in Spanish sewage sludge by liquid chromatography-tandem mass spectrometry. Anal. Bioanal. Chem. 400, 1277–1286. doi:10.1007/s00216-011-4655-6
Nzeribe, B. N., Crimi, M., Mededovic Thagard, S., and Holsen, T. M. (2019). Physico-chemical processes for the treatment of per- and polyfluoroalkyl substances (PFAS): A review. Crit. Rev. Environ. Sci. Technol. 49, 866–915. doi:10.1080/10643389.2018.1542916
Portoles, T., Rosales, L. E., Sancho, J. V., Santos, F. J., and Moyano, E. (2015). Gas chromatography-tandem mass spectrometry with atmospheric pressure chemical ionization for fluorotelomer alcohols and perfluorinated sulfonamides determination. J. Chromatogr. A 1413, 107–116. doi:10.1016/j.chroma.2015.08.016
Qi, Y., Ma, C., Chen, S., Ge, J., Hu, Q., Li, S.-L., et al. (2021). Online liquid chromatography and FT-ICR MS enable advanced separation and profiling of organosulfates in dissolved organic matter. ACS ES&T Water 1, 1975–1982. doi:10.1021/acsestwater.1c00162
Rahman, M. F., Peldszus, S., and Anderson, W. B. (2014). Behaviour and fate of perfluoroalkyl and polyfluoroalkyl substances (PFASs) in drinking water treatment: a review. Water Res. 50, 318–340. doi:10.1016/j.watres.2013.10.045
Rayne, S., and Forest, K. (2009). Perfluoroalkyl sulfonic and carboxylic acids: A critical review of physicochemical properties, levels and patterns in waters and wastewaters, and treatment methods. J. Environ. Sci. Health, Part A 44, 1145–1199. doi:10.1080/10934520903139811
Rotander, A., Karrman, A., Toms, L. M., Kay, M., Mueller, J. F., and Gomez Ramos, M. J. (2015). Novel fluorinated surfactants tentatively identified in firefighters using liquid chromatography quadrupole time-of-flight tandem mass spectrometry and a case-control approach. Environ. Sci. Technol. 49, 2434–2442. doi:10.1021/es503653n
Szynkowska, M. I., Parczewski, A., Szajdak, K., and Rogowski, J. (2013). Examination of gunshot residues transfer using ToF-SIMS: examination of gunshot residues transfer using ToF-SIMS. Surf. Interface Analysis 45, 596–600. doi:10.1002/sia.5142
Schultes, L., Peaslee, G. F., Brockman, J. D., Majumdar, A., Mcguinness, S. R., Wilkinson, J. T., et al. (2019). Total fluorine measurements in food packaging: how do current methods perform? Environ. Sci. Technol. Lett. 6, 73–78. doi:10.1021/acs.estlett.8b00700
Shrivastava, A., and Gupta, V. (2011). Methods for the determination of limit of detection and limit of quantitation of the analytical methods. Chronicles Young Sci. 2, 21. doi:10.4103/2229-5186.79345
Singh, R. K., Multari, N., Nau-Hix, C., Anderson, R. H., Richardson, S. D., Holsen, T. M., et al. (2019). Rapid removal of poly- and perfluorinated compounds from investigation-derived waste (IDW) in a pilot-scale plasma reactor. Environ. Sci. Technol. 53, 11375–11382. doi:10.1021/acs.est.9b02964
Smentkowski, V. S., Ostrowski, S. G., Braunstein, E., Keenan, M. R., Ohlhausen, J. T., and Kotula, P. G. (2007). Multivariate statistical analysis of three-spatial-dimension TOF-SIMS raw data sets. Anal. Chem. 79, 7719–7726. doi:10.1021/ac071019o
Sodhi, R. N. S. (2004). Time-of-flight secondary ion mass spectrometry (TOF-SIMS): versatility in chemical and imaging surface analysis. Analyst 129, 483–487. doi:10.1039/b402607c
Stramenga, A., Tavoloni, T., Stecconi, T., Galarini, R., Giannotti, M., Siracusa, M., et al. (2021). Perfluoroalkyl and polyfluoroalkyl substances (PFASs): an optimized LC-MS/MS procedure for feed analysis. J. Chromatogr. B 1186, 123009. doi:10.1016/j.jchromb.2021.123009
Sui, X., Zhou, Y., Zhang, F., Zhang, Y., Chen, J., Zhu, Z., et al. (2018). ToF-SIMS characterization of glyoxal surface oxidation products by hydrogen peroxide: A comparison between dry and liquid samples. Surf. Interface Analysis 50, 927–938. doi:10.1002/sia.6334
Szynkowska-Jóźwik, M. I., Maćkiewicz, E., Rogowski, J., Gajek, M., Pawlaczyk, A., De Puit, M., et al. (2021). Visualisation of amphetamine contamination in fingerprints using TOF-SIMS technique. Materials 14, 6243. doi:10.3390/ma14216243
Terlier, T., Lee, K.-B., and Lee, Y. (2020). Chemical recognition based on high-accuracy matching factors as per time-of-flight–secondary-ion mass spectrometry: application to trace cosmetic residues in human forensics. Microchem. J. 159, 105446. doi:10.1016/j.microc.2020.105446
Touboul, D., Kollmer, F., Niehuis, E., Brunelle, A., and Laprévote, O. (2005). Improvement of biological time-of-flight-secondary ion mass spectrometry imaging with a bismuth cluster ion source. J. Am. Soc. Mass Spectrom. 16, 1608–1618. doi:10.1016/j.jasms.2005.06.005
Vickerman, J. C., and Winograd, N. (2015). SIMS—a precursor and partner to contemporary mass spectrometry. Int. J. Mass Spectrom. 377, 568–579. doi:10.1016/j.ijms.2014.06.021
Vu, C. T., and Wu, T. (2022). Recent progress in adsorptive removal of per- and poly-fluoroalkyl substances (PFAS) from water/wastewater. Crit. Rev. Environ. Sci. Technol. 52, 90–129. doi:10.1080/10643389.2020.1816125
Washington, J. W., Yoo, H., Ellington, J. J., Jenkins, T. M., and Libelo, E. L. (2010). Concentrations, distribution, and persistence of perfluoroalkylates in sludge-applied soils near decatur, Alabama, USA. Environ. Sci. Technol. 44, 8390–8396. doi:10.1021/es1003846
Wei, W., Plymale, A., Zhu, Z., Ma, X., Liu, F., and Yu, X.-Y. (2020). In vivo molecular insights into syntrophic geobacter aggregates. Anal. Chem. 92, 10402–10411. doi:10.1021/acs.analchem.0c00653
Wei, W., Zhang, Y., Komorek, R., Plymale, A., Yu, R., Wang, B., et al. (2017). Characterization of syntrophic Geobacter communities using ToF-SIMS. Biointerphases 12, 05G601. doi:10.1116/1.4986832
Xiao, F. (2017). Emerging poly- and perfluoroalkyl substances in the aquatic environment: A review of current literature. Water Res. 124, 482–495. doi:10.1016/j.watres.2017.07.024
Yu, X.-Y. (2020). In situ, in vivo, and in operando imaging and spectroscopy of liquids using microfluidics in vacuum. J. Vac. Sci. Technol. A 38, 040804. doi:10.1116/1.5144499
Yu, X. Y., Yao, J., Buck, E. C., and Zhu, Z. (2020). In situ liquid SIMS analysis of uranium oxide. Surf. Interface Analysis 52, 454–459. doi:10.1002/sia.6799
Zhang, F., Yu, X., Chen, J., Zhu, Z., and Yu, X.-Y. (2019a). Dark air–liquid interfacial chemistry of glyoxal and hydrogen peroxide. NPJ Clim. Atmos. Sci. 2, 28. doi:10.1038/s41612-019-0085-5
Zhang, F., Yu, X., Sui, X., Chen, J., Zhu, Z., and Yu, X.-Y. (2019b). Evolution of aqSOA from the air–liquid interfacial photochemistry of glyoxal and hydroxyl radicals. Environ. Sci. Technol. 53, 10236–10245. doi:10.1021/acs.est.9b03642
Keywords: PFAS, PFOs, molecular identification, ToF-SIMS, groundwater, wastewater
Citation: Yu X-Y, Yang C, Gao J, Xiong J, Sui X, Zhong L, Zhang Y and Son J (2023) Molecular detection of per- and polyfluoroalkyl substances in water using time-of-flight secondary ion mass spectrometry. Front. Chem. 11:1253685. doi: 10.3389/fchem.2023.1253685
Received: 05 July 2023; Accepted: 22 September 2023;
Published: 06 October 2023.
Edited by:
Shengshui Hu, Wuhan University, ChinaReviewed by:
Abhishek Mandal, Indian Agricultural Research Institute (ICAR), IndiaCopyright © 2023 Yu, Yang, Gao, Xiong, Sui, Zhong, Zhang and Son. This is an open-access article distributed under the terms of the Creative Commons Attribution License (CC BY). The use, distribution or reproduction in other forums is permitted, provided the original author(s) and the copyright owner(s) are credited and that the original publication in this journal is cited, in accordance with accepted academic practice. No use, distribution or reproduction is permitted which does not comply with these terms.
*Correspondence: Xiao-Ying Yu, eXV4aWFveWluZ0Bvcm5sLmdvdg==
†These authors have contributed equally to this work
Disclaimer: All claims expressed in this article are solely those of the authors and do not necessarily represent those of their affiliated organizations, or those of the publisher, the editors and the reviewers. Any product that may be evaluated in this article or claim that may be made by its manufacturer is not guaranteed or endorsed by the publisher.
Research integrity at Frontiers
Learn more about the work of our research integrity team to safeguard the quality of each article we publish.