 Giulia Melchiorre
 Giuseppe Pileio
- School of Chemistry, University of Southampton, Southampton, United Kingdom
In this study, long-lived nuclear singlet order methods are combined with diffusion tensor imaging with the purpose of characterizing the full diffusion tensor of molecules diffusing freely in large pores of up to a millimeter in size. Such sizes are out of reach in conventional diffusion tensor imaging because of the limitations imposed by the relaxation decay constant of the longitudinal magnetization. A singlet-assisted diffusion tensor imaging methodology able to circumvent such limitations is discussed, and the new possibilities that it offers are demonstrated through simulation and experiments on plastic phantoms containing cylindrical channels of 1 mm in diameter.
1 Introduction
Brownian diffusion is a form of molecular translational motion in which molecules travel through space in a random way as dictated by intermolecular collisions, thermal energy, and the structural boundaries of the space they travel within. Measurements of such motion can be used to make important deductions concerning both the diffusing species itself and its surroundings (Price, 2009; Callaghan, 2011). The most basic value that can be measured to characterize this form of motion is the molecular self-diffusion coefficient, a quantity that measures the extent of molecular translation through Brownian motion in an isotropic space. Molecular diffusion (the prefix “self-” is dropped hereafter, but is implied in all instances in which we refer to diffusion in this paper), however, is not always isotropic; this is the case, for example, when the size and shape of a container impose confinement on molecules that move within it, or when molecules retain some sort of positional order, as in a liquid crystalline phase. To characterize those situations, two quantities, namely, the structural length
Molecular diffusion can be encoded in nuclear magnetic resonance (NMR) experiments (Callaghan, 2011), and NMR measurements of diffusion have already been used to obtain a plethora of molecular and structural information on a variety of systems, spanning from the domain of material sciences (rocks, bones, etc.) to medicine (blood cells, intercellular space, and brain fibers) (Hurlimann et al., 1994; Kuchel et al., 1997; Price et al., 1997; Price et al., 1999; Bullitt et al., 2003; Thorat et al., 2009; Park et al., 2012; Gobel et al., 2017). In particular, and with relevance to this paper, the full diffusion tensor can be measured using the magnetic resonance technique known as diffusion tensor imaging (DTI) (Mori and Tournier, 2013). In DTI, the full diffusion tensor is reconstructed after measurement of molecular diffusion along a minimum of six directions, chosen so as to evenly probe the space around the molecule (Basser et al., 1994; Momot et al., 2011; Mori and Tournier, 2013). There are many spectacular applications of the DTI technique in vivo in the medical field, and the most striking of these is perhaps brain tractography (Basser et al., 1994; Pierpaoli et al., 1996; Basser and Jones, 2002).
All magnetic resonance-based diffusion methods (the most famous of which are based on the pulsed-gradient spin echo (PGSE) or pulsed-gradient stimulated spin echo (PGSTE) pulse sequences) have a common approach: a pulsed magnetic field gradient (PFG) imposes a difference in the Larmor frequency of spins along a given direction, thus marking the positions of molecules along that dimension of space; subsequently, molecules (and the spins they carry) undergo Brownian motion for a given time interval, referred to as the diffusion time; finally, a further PFG “reads out” the new molecular positions, revealing the extent of diffusive motion they have undertaken, reflected by a change in signal intensity. It is, therefore, evident that the positional information encoded by the first PFG must survive throughout the diffusion time in order to be decoded by the second PFG. Most typically, NMR-encoded information persists for a maximum time that is of the order of T1, the relaxation decay constant of longitudinal spin order. Therefore, T1 sets a limit on the diffusion timescale and, hence, on the diffusion space-scale. Important structural information remains hidden, or incorrect conclusions can be drawn, if molecules are not allowed to properly explore the surrounding space. In DTI, for example, diffusion would still appear isotropic (having the same diffusion coefficient in all directions) even when molecules diffused in a highly anisotropic structure made by long and narrow channels if T1 only allowed for molecules to move an average distance that is much smaller than the smallest spatial dimension of the space they were filling. With a typical T1 value of seconds and a diffusion coefficient of the order of 10–9 m2 s−1, molecules usually travel an average of 10–200 μm during a conventional NMR diffusion experiment. This distance specifies the maximum dimension of the structures that can be accurately studied with conventional NMR diffusion techniques.
In systems consisting of two coupled spin-1/2 nuclei, spin order can be prepared in the form of singlet order, which is a form of nuclear spin order that survives longer than T1, most typically by an order of magnitude or more (Pileio, 2020). Molecules containing such a spin system can therefore be used as probes of molecular diffusion in systems where motions occur on a long timescale or over large distances. Indeed, singlet order has already been combined with NMR diffusion experiments to measure very slow flow (Pileio et al., 2015), to image diffusion over a macroscopic scale or probe millimeter-sized confinements with q-space diffraction techniques (Pileio and Ostrowska, 2017), and to measure tortuosity in porous media (Tourell et al., 2018). We group all these methods, in which long-lived spin order is exploited in diffusion experiments, under the acronym SAD-NMR, which stands for singlet-assisted diffusion nuclear magnetic resonance.
In this paper, we discuss a further application of SAD-NMR, with the aim of extending the scope of conventional DTI techniques to allow measurements of the diffusion tensor in porous structures containing pores and channels with sizes on the order of millimeters.
With the intention of discussing the technique and assessing its novel limitations, we present experimental results obtained on 3D-printed model structures containing channels of 1-mm ID.
2 Methodology
2.1 Basics of DTI
In diffusion tensor imaging studies, molecular diffusion in anisotropic environments is described by a diffusion tensor
The diffusion tensor is symmetric (
Diffusion coefficients along any given direction are routinely measured in NMR using one of the many pulse sequences developed over the years, the most basic of these being the pulsed-gradient spin echo cited above. Modifications of this experiment introduced in order to prolong the diffusion time (PGSTE), correct for eddy currents (PGSTEbp), and compensate for thermal convection (PGdSTE and PGdSTEbp) have been available for some years and are widely used by the NMR community (Callaghan, 2011). The results obtained in this work should be compared with those obtained using the PGSTEbp pulse sequence (see Figure 1A), which provides access to the longest diffusion time among all conventional (i.e., non-singlet-based) DTI techniques. As derived by Stejskal and Tanner (1965), PGSTEbp experiments produce an NMR signal whose intensity follows the equation:
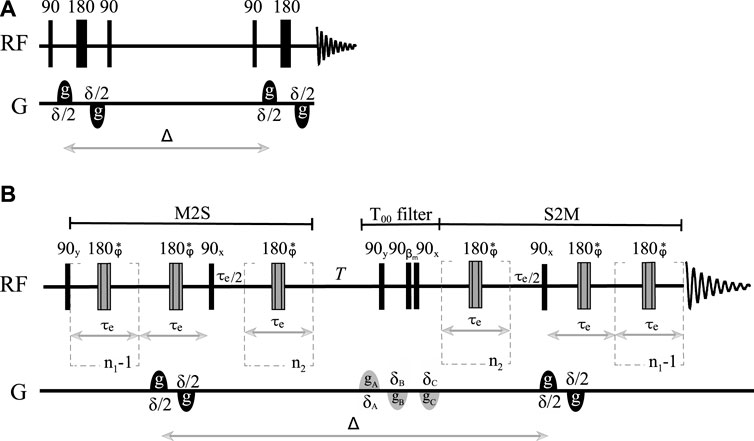
FIGURE 1. Sketch of (A) the pulsed field gradient stimulated echo pulse sequence with bipolar gradients (PFG-STEbp) and (B) the singlet-assisted diffusion pulse sequence with bipolar gradients and singlet order filter.
The signal is a function of the direction (
To reconstruct the whole diffusion tensor, the PGSTEbp experiment (or any alternative) is run along (at least)
where
Note that the choice of the six directions along which diffusion is measured and from which the diffusion tensor is reconstructed is arbitrary so long as they are independent of each other. However, it is best if these directions are chosen to sample the 3D space as uniformly as possible (Jones et al., 1999). The number of directions can also be increased to more than six; this improves accuracy at the expense of experimental time. If the gradient strength is incremented in
The diffusion tensor is diagonalized to obtain its principal values (Dx, Dy, Dz) and principal axes (
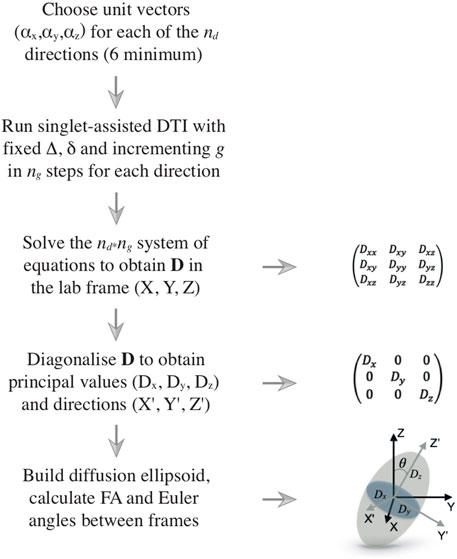
FIGURE 2. Flow diagram illustrating the DTI procedure. The left column shows the logical flow of operations, starting from the choice of the directions along which the diffusion is measured and ending with the processing of the results, which are typically rendered in terms of a diffusion ellipsoid and its fractional anisotropy. The right column shows several details of the various steps.
If diffusion is identical in all directions of the space, the diagonal diffusion tensor has three identical eigenvalues and its associated ellipsoid is, in fact, a sphere. If diffusion is equal in two directions and faster in the third, the ellipsoid is prolate, with its main axis pointing along the direction of faster diffusion. Similar reasoning can be used for other cases. A crucial point to take into consideration is that the shape of the ellipsoid is connected to the shape of the container inside which diffusion is happening (the pores or channels inside a porous medium, for example). However, for the confinement to become influential and its structural features to be correctly reflected by the diffusion ellipsoid, molecules need to diffuse far enough to feel the restrictions of the container. Recalling the structural and diffusion length previously introduced, the diffusion ellipsoid would appear spherical whenever
Finally, information about the shape of the diffusion tensor is often conveyed in the form of a single index known as fractional anisotropy (FA), calculated as follows (Basser and Pierpaoli, 1996):
The fractional anisotropy value ranges from 0 to 1, with 0 obtained in the case of isotropic diffusion and 1 in a fully anisotropic structure such as a long, thin channel.
2.2 Singlet-assisted DTI
As briefly introduced above, long-lived spin order can provide access to very long diffusion times. This form of order has already been exploited in this respect to measure small diffusion coefficients (Sarkar et al., 2008; Ahuja et al., 2009) or slow flow (Pileio et al., 2015). Here, we aim to combine the latest methodologies for the manipulation of this form of spin order with the more conventional DTI technique discussed earlier. Our proposed methodology is based on the pulse sequence illustrated in Figure 1B (pulse sequence code, in the Bruker TopSpin language, is available upon request) and has been labeled as SAD-TI (singlet-assisted diffusion tensor imaging). In our approach, as in PGSE and PGSTE, the well-studied (Pileio, 2017) singlet preparation (M2S) and reading (S2M) pulse sequence blocks have been sensitized to molecular diffusion with the introduction of a bipolar pulsed field gradient. Specifically, two opposite-in-sign field gradients are placed before and after the 180° radiofrequency pulse within the first echo train of the M2S block. From that time point onwards, molecular position is encoded until a second identical bipolar gradient is applied after the diffusion time
It is worth noting that the minimum
2.3 Errors on diffusion tensors and related quantities
In order to estimate the errors on the principal values and direction of the diffusion tensor, as well as on fractional anisotropy and all other quantities, we used a Monte Carlo approach implemented in a custom-made Mathematica notebook. Note that an analytic approach is also available (Poonawalla and Zhou, 2004) but here not used because unfamiliar to us. Our procedure runs as follows:
1. The standard deviation of each of the six independent diffusion coefficients is extracted from the fitting routine (we use the NonlinearModelFit routine in Mathematica).
2. A new diffusion tensor is built by randomly choosing a value for each of its six components using a normal distribution centered at the parameter’s best-fit value; its standard deviation is derived in step 1.
3. The new diffusion tensor is diagonalized, and eigenvalues and eigenvectors are stored in separate arrays.
4. The fractional anisotropy value and the angle between the eigenvector corresponding to the larger eigenvalue and the z-laboratory axis are calculated and stored in separate arrays (any other quantity of interest can be derived in the same way).
5. Steps 1–4 are repeated N times (50,000 in this paper).
6. The average and the standard deviation of the arrays derived via steps 3–5 (containing N sets of eigenvalues, eigenvectors, fractional anisotropies, and Euler angles) are computed and reported.
3 Materials and methods
3.1 The molecular probe
The SAD-TI method requires a molecular probe that supports long-lived spin states so that it can travel for long durations and long distances within the large channels and pores of the structure to probe its anisotropy. In our laboratory, we have custom-designed a variety of probes that suit this purpose, and for the current investigations, we used the molecule of 1-(ethyl-d5),4-(propyl-d7)(Z)-but-2-enedioate (EPM) sketched in Figure 3.
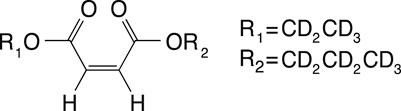
FIGURE 3. Molecular scheme of 1-(ethyl-d5) 4-(propyl-d7) (Z)-but-2-enedioate, used in this study as a singlet-bearing molecular probe for singlet-assisted DTI experiments.
The two protons on the double bond constitute the singlet pair, whereas all the other protons have been substituted by deuterons to minimize out-of-pair dipolar relaxation contributions and prolong the singlet lifetime. The difference in chemical shift frequency between the two protons is 3.1 ppb (0.93 Hz in our 7.04 T magnet), and their mutual scalar coupling constant is 11.9 Hz. These values qualify the magnetic properties of the molecular probe as a nearly equivalent spin system. In such systems, singlet order is a good eigenvalue of the high-field spin Hamiltonian and remains long-lived without the need for singlet-locking irradiation, which would not be compatible with diffusion experiments because it can generate heat and related convective flow. The isotropic diffusion coefficient for this molecule, measured in an isotropic liquid sample prepared as a 0.25 M solution of EPM in acetone-d6 in a 10-mm OD NMR tube, is
3.2 Structures under investigation
To demonstrate the potential of the SAD-TI methodology, we measured the diffusion tensor of our probe molecule dissolved in a low-viscosity liquid and contained in the long, narrow cylindrical channels cut into the plastic structures shown in Figure 4. Both structures were machined in-house from a rod of polyoxymethylene (POM; this was chosen because it has good resistance to many common organic solvents and is easy to machine). The outer diameter of each structure was 7.65 mm, and the length was 20 mm. Structure 00D (Figure 4A) contained 13 cylindrical channels of 1 mm diameter. The total volume of the 13 channels was 204 mm3. The long axis of the channels was oriented along the long axis of the rod, a fact that we indicate as
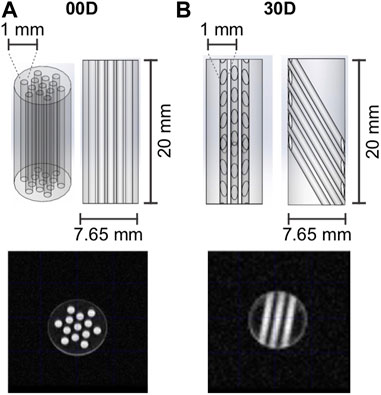
FIGURE 4. Geometry and dimensions of channel structures (A) 00D and (B) 30D, which were used in the experiments reported in this paper. The MRI images were generated with a multi-slice multi-echo (MSME) sequence (FOV 2 × 2 cm2, 128 × 128 matrix, slice thickness 1 cm, TE = 5.08 ms). Sagittal slices (not shown) were taken to confirm that all channels were fully filled with the EPM solution.
Structures 00D and 30D were imbibed in 350 μL of a 0.25 M solution of EPM in acetone-d6. The NMR tubes were then degassed through 10 cycles of freeze–pump–thaw to minimize the O2 content and hence prolong relaxation times. MRI images of the tubes were taken to confirm that all channels were properly filled with the EPM solution (see Figure 4).
3.3 Instrumentation
All experiments were run on an Oxford Inst. 7.04 T Magnet coupled to an Avance III Bruker NMR console. This instrument is equipped with a Bruker MIC5 microimaging probe carrying a 10-mm 1H/13C resonator and a 3-axis gradient system able to deliver pulsed field gradients of up to 1.5 T m−1. The samples were maintained at room temperature (21°C), and the probe’s temperature controller was turned off in order to achieve a more uniform sample temperature and minimize convection flow, although thermal convection is here negligible given the relatively small diameter of the channels.
3.4 Numerical simulations
In this paper, we present numerical simulations for comparison with experimental data. The routines developed to calculate the diffusion tensor in the structures discussed in Section 3.1 were written in Mathematica (simulation code available upon request). Simulations were based on a simple random-walk approach comprising the following steps (for each structure and each value of diffusion time):
1. The actual sample shape and geometry are reconstructed using the concept of Region in Mathematica.
2. The experimentally measured isotropic diffusion coefficient D0 and the diffusion time Δ used in the experiment are entered.
3. The total number of molecules is set to NM = 10,000.
4. The total number of random steps is set to NJ = 10,000. This represents the number of steps that each molecule takes during the diffusion time Δ; hence, the time step (how long a step lasts) is derived as ts = Δ/NJ.
5. An array of NM initial molecular positions ri = (xi, yi, zi) is randomly generated such that all molecules lie within the voids of the structure (i.e., within the channels or the annular cylinder formed between the inner wall of the tube and the outer wall of the plastic rod).
6. Starting from ri, the molecular position of each of the NM molecules is propagated for NJ steps, each step taking a length ls = (6 D0 ts)1/2. At each step, the new molecular positions are checked to verify that they fall within the voids of the structure, and if not, a new random step is taken. This process results in an array containing all final positions rf = (xf, yf, zf) for each of the NM molecules.
7. The
with
8. Once the six independent
4 Results and discussion
Before proceeding with the measurement of the diffusion tensor, we measured the decay constant of the longitudinal and singlet orders, T1 and TS, respectively, for the two structures investigated here. T1 was measured with a standard saturation recovery technique, and TS was measured with the M2S/S2M pulse sequence (Pileio et al., 2010; Tayler and Levitt, 2011). The results are summarized in Table 1. The small differences in these parameters across the two structures were within errors and are most likely due to differences in the quality of the degassing procedure.
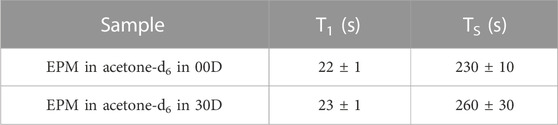
TABLE 1. Longitudinal and singlet order decay constants measured in the sample investigated in this study.
The lifetime of singlet order is, therefore, approximately 13 times longer than that of longitudinal order, in this particular case. Lifetime enhancement factors of up to 140-fold have been observed (Stevanato et al., 2015).
To demonstrate the advantages of the SAD-TI procedure and define its limits, we ran the pulse sequence shown in Figure 1B on both 00D and 30D structures. For each structure, experiments were repeated at four different values of diffusion time
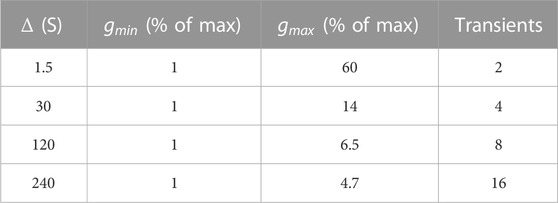
TABLE 2. Minimum and maximum values of gradient strength for the pulse sequence in Figure 1B, expressed as a percentage of the maximum gradient strength available (1.5 T m−1). The last column indicates the number of transients acquired and summed upon acquisition.
The unit vectors for the six directions were chosen from those suggested by Jones et al. (1999) and are summarized in Table 3.
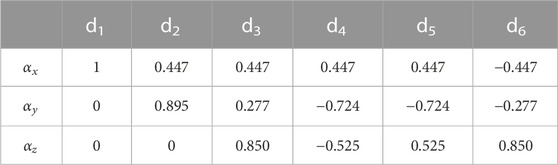
TABLE 3. Unit vectors for each of the six directions used in all experiments.
The values of the parameters in the M2S/S2M blocks in the pulse sequence were experimentally optimized around the theoretical values and found to be
The results of the SAD-TI procedure are reported in Table 4. Instrumental differences in the gradient performances along different directions were corrected by independently calibrating the gradients along each direction, such that the SAD-TI experiment with
where
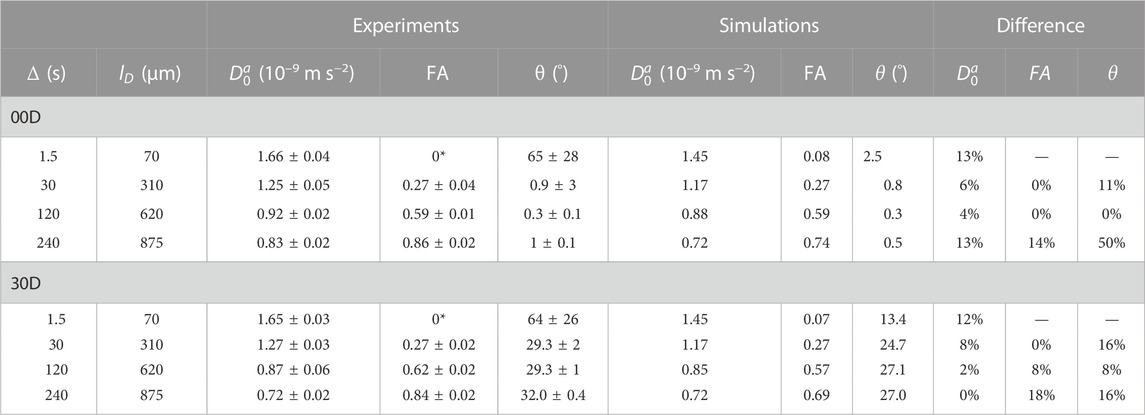
TABLE 4. Experimental and simulated results of the SAD-TI procedure on 00D and 30D at different values of diffusion time. The diffusion length
As expected, at very short diffusion times (of the order of a few seconds), it was not possible to measure either the correct fractional anisotropy or the orientation of the channels with respect to the magnetic field. At modestly long diffusion times (of the order of ∼3T1), the channel orientation was correctly obtained, although the measured fractional anisotropy was quite far from the expected value of ∼0.95 for a cylinder of 1 mm radius and 20 mm length. Our numerical simulations of the diffusion tensor in the actual geometries were in good agreement with the experimental values, despite the low level of sophistication of the model used to simulate the random walks and the relatively low number of random steps and molecules employed. To obtain a correct value for FA, a diffusion time of several minutes was required. This can be explained as follows: in order to track the channel orientation, it is sufficient merely to identify the direction associated with the largest eigenvalue of the diffusion tensor, no matter the exact value of the diffusion coefficients along each principal direction. For this reason, the channel orientation was correctly measured even at relatively short diffusion times (note that this still required diffusion times of tens of seconds). To properly characterize the FA, the limiting value of the diffusion coefficient along each principal direction must be correctly measured, and for this to happen, a diffusion time that allows for a diffusion length of the order of the characteristic length of the structure must be used. To further highlight the importance of the technique, we plotted the diffusion constant measured for structure 00D along each principal direction at different values of diffusion time, normalized to the isotropic diffusion constant (Figure 5). The plot shows that diffusion is essentially free along the z-direction (coinciding with the long axis of the channels) and restricted, to an equivalent extent, along the two perpendicular directions. In a structure with connected pores, the value of
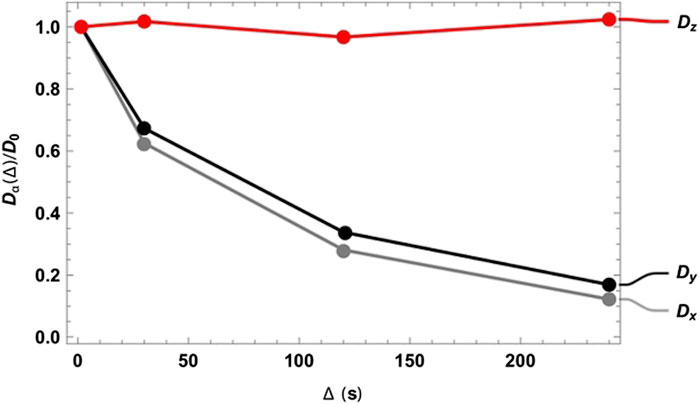
FIGURE 5. Diffusion constant measured for structure 00D along the three principal directions normalized to the isotropic diffusion constant and plotted against the diffusion time
Although tortuosity is not explicitly addressed in this paper, Figure 5 demonstrates how the singlet-assisted DTI technique presented here can provide easy access to the value of tortuosity along the three principal directions of a porous medium with large pores.
To make a fair comparison with other techniques, this same information can be accessed through conventional DTI (PGSTE-based) if a molecule with very long T1 or a larger diffusion constant is available. Assuming that relaxation is dominated by a dipole–dipole interaction, as is often the case for small molecules in non-viscous liquids, minutes-long T1 values are rare and usually linked to nuclei with a low gyromagnetic ratio, whose NMR sensitivity is often the limiting factor in diffusion studies within porous media. The use of gases, whose self-diffusion coefficients are 4–5 orders of magnitude greater than those of liquids, is a good alternative, since the molecules can move much further, even within a short diffusion time. The use of hyperpolarized-Xe has indeed been proposed for diffusion studies of a similar nature (Mair et al., 2001), but again, the low sensitivity requires hyperpolarization, which adds a level of complication and requires specific expertise and relatively costly equipment. Our technique can easily be implemented using conventional high-resolution NMR hardware, and this constitutes a clear advantage over other techniques.
5 Conclusion
We have presented a singlet-assisted version of the well-known diffusion tensor imaging technique that provides access to measurements of the full diffusion tensor of molecules diffusing within porous media with large pores. The diffusion tensor can be used to access structural information such as fractional anisotropy, pore geometry, and orientation, as well as tortuosity, an important parameter that has so far been inaccessible to NMR, since conventional DTI fails to accurately measure it in structures with pores above 50–100 microns in size. Structures containing such large pores include battery electrodes, scaffoldings for tissue engineering, and certain rocks.
Data availability statement
The raw data supporting the conclusions of this article will be made available by the authors, without undue reservation.
Author contributions
GM: methodology development, investigation, and formal analysis. FG: methodology development, investigation, and resources. SR: investigation and formal analysis. GP: conceptualization, methodology development, supervision, validation, funding acquisition, and writing—review and editing. All authors contributed to the article and approved the submitted version.
Funding
This research was supported by the EPSRC UK (grant no: EP/N033558/1) and the Leverhulme Trust Research Project (grant no: RPG-2019-298).
Acknowledgments
The authors would like to thank Monique C. Tourell for useful discussions.
Conflict of interest
The authors declare that the research was conducted in the absence of any commercial or financial relationships that could be construed as a potential conflict of interest.
Publisher’s note
All claims expressed in this article are solely those of the authors and do not necessarily represent those of their affiliated organizations, or those of the publisher, the editors, and the reviewers. Any product that may be evaluated in this article, or claim that may be made by its manufacturer, is not guaranteed or endorsed by the publisher.
References
Ahuja, P., Sarkar, R., Vasos, P. R., and Bodenhausen, G. (2009). Diffusion coefficients of biomolecules using long-lived spin states. J. Am. Chem. Soc. 131 (22), 7498–7499. doi:10.1021/ja902030k
Basser, P. J., and Jones, D. K. (2002). Diffusion-tensor MRI: Theory, experimental design and data analysis - a technical review. NMR Biomed. 15 (7-8), 456–467. doi:10.1002/nbm.783
Basser, P. J., Mattiello, J., and LeBihan, D. (1994). MR diffusion tensor spectroscopy and imaging. Biophysical J. 66 (1), 259–267. doi:10.1016/s0006-3495(94)80775-1
Basser, P. J., and Pierpaoli, C. (1996). Microstructural and physiological features of tissues elucidated by quantitative-diffusion-tensor MRI. J. Magn. Reson B 111 (3), 209–219. doi:10.1006/jmrb.1996.0086
Bullitt, E., Gerig, G., Pizer, S. M., Lin, W. L., and Aylward, S. R. (2003). Measuring tortuosity of the intracerebral vasculature from MRA images. Ieee Trans. Med. Imaging 22 (9), 1163–1171. doi:10.1109/Tmi.2003.816964
Callaghan, P. T. (2011). Translational dynamics & magnetic resonance. Oxford: Oxford University Press.
Gobel, M., Godehardt, M., and Schladitz, K. (2017). Multi-scale structural analysis of gas diffusion layers. J. Power Sources 355, 8–17. doi:10.1016/j.jpowsour.2017.03.086
Hurlimann, M. D., Helmer, K. G., Latour, L. L., and Sotak, C. H. (1994). Restricted diffusion in sedimentary rocks. Determination of surface-area-to-volume ratio and surface relaxivity. J. Magnetic Reson. Ser. A 111 (2), 169–178. doi:10.1006/jmra.1994.1243
Jones, D. K., Horsfield, M. A., and Simmons, A. (1999). Optimal strategies for measuring diffusion in anisotropic systems by magnetic resonance imaging. Magn. Reson Med. 42 (3), 515–525. doi:10.1002/(sici)1522-2594(199909)42:3<515::aid-mrm14>3.0.co;2-q
Kuchel, P. W., Coy, A., and Stilbs, P. (1997). NMR ''diffusion-diffraction'' of water revealing alignment of erythrocytes in a magnetic field and their dimensions and membrane transport characteristics. Magnetic Reson. Med. 37 (5), 637–643. doi:10.1002/mrm.1910370502
Latour, L. L., Mitra, P. P., Kleinberg, R. L., and Sotak, C. H. (1993). Time-Dependent diffusion-coefficient of fluids in porous-media as a probe of surface-to-volume ratio. J. Magnetic Reson. Ser. A 101 (3), 342–346. doi:10.1006/jmra.1993.1056
Mair, R. W., Hurlimann, M. D., Sen, P. N., Schwartz, L. M., Patz, S., and Walsworth, R. L. (2001). Tortuosity measurement and the effects of finite pulse widths on xenon gas diffusion NMR studies of porous media. Magn. Reson. Imaging 19 (3-4), 345–351. doi:10.1016/S0730-725x(01)00247-8
Momot, K. I., Pope, J. M., and Wellard, R. M. (2011). “Digital processing of diffusion-tensor images of avascular tissues,” in Medical image processing. Biological and medical Physics, biomedical engineering. Editor G. Dougherty (New York: Springer).
Mori, S., and Tournier, J. D. (2013). Introduction to diffusion tensor imaging: And higher order models. Second edition. Amsterdam, Netherlands: Elsevier Inc. doi:10.1016/C2011-0-07607-X
Park, S., Lee, J.-W., and Popov, B. N. (2012). A review of gas diffusion layer in PEM fuel cells: Materials and designs. Int. J. Hydrogen Energy 37 (7), 5850–5865. doi:10.1016/j.ijhydene.2011.12.148
Pierpaoli, C., Jezzard, P., Basser, P. J., Barnett, A., and DiChiro, G. (1996). Diffusion tensor MR imaging of the human brain. Radiology 201 (3), 637–648. doi:10.1148/radiology.201.3.8939209
Pileio, G., Carravetta, M., and Levitt, M. H. (2010). Storage of nuclear magnetization as long-lived singlet order in low magnetic field. Proc. Natl. Acad. Sci. U. S. A. 107 (40), 17135–17139. doi:10.1073/pnas.1010570107
Pileio, G., Dumez, J.-N., Pop, I.-A., Hill-Cousins, J. T., and Brown, R. C. D. (2015). Real-space imaging of macroscopic diffusion and slow flow by singlet tagging MRI. J. Magnetic Reson. 252, 130–134. doi:10.1016/j.jmr.2015.01.016
Pileio, G. Ed. (2020). “Long-lived nuclear spin order: Theory and applications” in New Developments in NMR (London: Royal Society of Chemistry). doi:10.1039/9781788019972
Pileio, G., and Ostrowska, S. (2017). Accessing the long-time limit in diffusion NMR: The case of singlet assisted diffusive diffraction q-space. J. Magn. Reson 285, 1–7. doi:10.1016/j.jmr.2017.10.003
Pileio, G. (2017). Singlet NMR methodology in two-spin-1/2 systems. Prog. Nucl. Magn. Reson Spectrosc. 98-99, 1–19. doi:10.1016/j.pnmrs.2016.11.002
Poonawalla, A. H., and Zhou, X. J. (2004). Analytical error propagation in diffusion anisotropy calculations. J. Magnetic Reson. Imaging 19 (4), 489–498. doi:10.1002/jmri.20020
Price, W. S., Nara, M., and Arata, Y. (1997). A pulsed field gradient NMR study of the aggregation and hydration of parvalbumin. Biophys. Chem. 65 (2-3), 179–187. doi:10.1016/s0301-4622(97)00003-3
Price, W. S., Tsuchiya, F., Suzuki, C., and Arata, Y. (1999). Characterization of the solution properties of Pichia farinosa killer toxin using PGSE NMR diffusion measurements. J. Biomol. NMR 13 (2), 113–117. doi:10.1023/a:1008394716710
Sarkar, R., Ahuja, P., Vasos, P. R., and Bodenhausen, G. (2008). Measurement of slow diffusion coefficients of molecules with arbitrary scalar couplings via long-lived spin states. ChemPhysChem 9 (16), 2414–2419. doi:10.1002/cphc.200800476
Stejskal, E. O., and Tanner, J. E. (1965). Spin diffusion measurements: Spin echoes in the presence of a time-dependent field gradient. J. Chem. Phys. 42 (1), 288–292. doi:10.1063/1.1695690
Stevanato, G., Hill-Cousins, J. T., Hakansson, P., Roy, S. S., Brown, L. J., Brown, R. C. D., et al. (2015). A nuclear singlet lifetime of more than one hour in room-temperature solution. Angew. Chemie-International Ed. 54 (12), 3740–3743. doi:10.1002/anie.201411978
Tayler, M. C. D., and Levitt, M. H. (2011). Singlet nuclear magnetic resonance of nearly-equivalent spins. Phys. Chem. Chem. Phys. 13 (13), 5556–5560. doi:10.1039/c0cp02293d
Thorat, I. V., Stephenson, D. E., Zacharias, N. A., Zaghib, K., Harb, J. N., and Wheeler, D. R. (2009). Quantifying tortuosity in porous Li-ion battery materials. J. Power Sources 188 (2), 592–600. doi:10.1016/j.jpowsour.2008.12.032
Keywords: diffusion NMR, diffusion tensor imaging, long-lived spin order, singlet spin order, nuclear magnetic resonance
Citation: Melchiorre G, Giustiniano F, Rathore S and Pileio G (2023) Singlet-assisted diffusion-NMR (SAD-NMR): extending the scope of diffusion tensor imaging via singlet NMR. Front. Chem. 11:1224336. doi: 10.3389/fchem.2023.1224336
Received: 17 May 2023; Accepted: 03 July 2023;
Published: 04 August 2023.
Edited by:
Daniel Abergel, École Normale Supérieure, FranceReviewed by:
Flavio Kock, University of Toronto Scarborough, CanadaWilliam S. Price, Western Sydney University, Australia
Copyright © 2023 Melchiorre, Giustiniano, Rathore and Pileio. This is an open-access article distributed under the terms of the Creative Commons Attribution License (CC BY). The use, distribution or reproduction in other forums is permitted, provided the original author(s) and the copyright owner(s) are credited and that the original publication in this journal is cited, in accordance with accepted academic practice. No use, distribution or reproduction is permitted which does not comply with these terms.
*Correspondence: Giuseppe Pileio, Zy5waWxlaW9Ac290b24uYWMudWs=