
95% of researchers rate our articles as excellent or good
Learn more about the work of our research integrity team to safeguard the quality of each article we publish.
Find out more
ORIGINAL RESEARCH article
Front. Chem. , 06 July 2023
Sec. Medicinal and Pharmaceutical Chemistry
Volume 11 - 2023 | https://doi.org/10.3389/fchem.2023.1222560
This article is part of the Research Topic Novel Compounds from Chemistry to Druggable Candidates View all 10 articles
 Lulu Yu1†
 Xunjia Qian1†Yiheng Feng1Yujian Yin1Xiao-Dan Zhang1Qianqian Wei1Liyun Wang1
 Weiwei Rong1,2Jie-Jia Li3Jun-Xu Li1*
 Qing Zhu1,2*
N- Demethylsinomenine (NDSM), the in vivo demethylated metabolite of sinomenine, has exhibited antinociceptive efficacy against various pain models and may become a novel drug candidate for pain management. However, no reported analytical method for quantification of N- Demethylsinomenine in a biological matrix is currently available, and the pharmacokinetic properties of N- Demethylsinomenine are unknown. In the present study, an ultra-high performance liquid chromatography with tandem mass spectrometry (UPLC-MS/MS) method for quantification of N- Demethylsinomenine in rat plasma was developed and utilized to examine the preclinical pharmacokinetic profiles of N- Demethylsinomenine. The liquid-liquid extraction using ethyl acetate as the extractant was selected to treat rat plasma samples. The mixture of 25% aqueous phase (0.35% acetic acid-10 mM ammonium acetate buffer) and 75% organic phase (acetonitrile) was chosen as the mobile phases flowing on a ZORBAX C18 column to perform the chromatographic separation. After a 6-min rapid elution, NDSM and its internal standard (IS), metronidazole, were separated successfully. The ion pairs of 316/239 and 172/128 were captured for detecting N- Demethylsinomenine and IS, respectively, using multiple reaction monitoring (MRM) under a positive electrospray ionization (ESI) mode in this mass spectrometry analysis. The standard curve met linear requirements within the concentration range from 3 to 1000 ng/mL, and the lower limit of quantification (LLOQ) was 3 ng/mL. The method was evaluated regarding precision, accuracy, recovery, matrix effect, and stability, and all the results met the criteria presented in the guidelines for validation of biological analysis method. Then the pharmacokinetic profiles of N- Demethylsinomenine in rat plasma were characterized using this validated UPLC-MS/MS method. N- Demethylsinomenine exhibited the feature of linear pharmacokinetics after intravenous (i.v.) or intragastric (i.g.) administration in rats. After i. v. bolus at three dosage levels (0.5, 1, and 2 mg/kg), N- Demethylsinomenine showed the profiles of rapid elimination with mean half-life (T1/2Z) of 1.55–1.73 h, and extensive tissue distribution with volume of distribution (VZ) of 5.62–8.07 L/kg. After i. g. administration at three dosage levels (10, 20, and 40 mg/kg), N- Demethylsinomenine showed the consistent peak time (Tmax) of 3 h and the mean absolute bioavailability of N- Demethylsinomenine was 30.46%. These pharmacokinetics findings will aid in future drug development decisions of N- Demethylsinomenine as a potential candidate for pain analgesia.
Chronic pain usually refers to pain that persists or relapses for more than 3 months (Treede et al., 2019), which affects the physical and psychological health of patients in their daily life (Attal et al., 2018). Conventional oral analgesics are often chosen as the primary treatment for their fast action, low cost, and relative safety (Hylands-White et al., 2017). Although there are many analgesics available for clinical use, they all have some shortcomings such as limited efficacy or unexpected effects. Non-steroidal anti-inflammatory drugs (NSAIDs) are usually used as a starting medicine in treating pain, but they have limited efficacy against neuropathic pain and have a range of adverse effects related to the gastrointestinal, renal, and cardiovascular systems (Harirforoosh et al., 2013). Opioids are the most effective analgesics, but their broad unexpected effects can be serious and even lethal (Szigethy et al., 2018). Therefore, there is an urgent clinical need to discover new and effective analgesics with fewer side effects for the control of pain.
Traditional Chinese medicine (TCM) has a long history of human use and medicinal plants have been the sources of many successful modern medicines. Modern research on TCM has mostly focused on extracting and studying the pharmacology and mechanisms of ingredient compounds in TCM. Previous studies have found that sinomenine, a morphinan alkaloid, has significant analgesic properties in multiple chronic pain models (Zhao et al., 2012; Gao et al., 2013; Gao et al., 2014; Pertovaara, 2014; Zhu et al., 2016). However, clinical use of sinomenine is limited by its unexpected effects such as allergic and gastrointestinal reactions caused by strong histamine release and sedative effects (Zhang et al., 2018). N-Demethylsinomenine (NDSM), the demethylated derivative of sinomenine, is one of the bioactive ingredients of traditional Chinese herb Sinomenium acutum, and also an active metabolite of sinomenine (Cheng et al., 2007; Yi et al., 2012). Previous studies in our laboratory have shown that NDSM has analgesic effects against postoperative pain (Ou et al., 2018) and chronic pain (Zhou et al., 2021) without a sinomenine-like peripheral allergic reaction, and its sedative effect is far less than sinomenine (see Supplementary Figure S1 and Supplementary Table S1), suggesting that NDSM may be more advantageous than sinomenine for pain management.
Given the importance of pharmacokinetic profiling in preclinical drug development (Singh, 2006; Zheng et al., 2022), we aimed to continue our research into NDSM by extending the understanding of its pharmacokinetic profiles to rats. In the present study, a fast, accurate, and sensitive ultra-high performance liquid chromatography with tandem mass spectrometry (UPLC-MS/MS) method was established and certified to quantitatively detect NDSM in rat plasma. This method was utilized to investigate pharmacokinetics of NDSM after successful intravenous or oral administration.
NDSM (purity >98.0% by HPLC purity analysis) was synthesized in-house and confirmed by NMR spectroscopy, which conformed to a previous report (Cheng et al., 2007). The internal standard (IS) metronidazole (purity >98.0%) was purchased from Beijing InnoChem Science and Technology Co., Ltd. (Beijing, China). Methanol and acetonitrile provided by Tedia (Fairfield, OH, United States) meet the requirements for mass spectrometry analysis. Chromatographic grade acetic acid, ammonium acetate, and ethyl acetate were purchased from Aldrich-Sigma (St Louis, MO, United States of America). Deionized water was provided by a Milli-Q ultrapure water preparation system (Millipore, MA, United States). Other reagents were all analytical grades.
Male and female Sprague-Dawley rats, weighing 200–250 g, were obtained from the Laboratory Animal Center of Nantong University (Nantong, China). Animals were acclimated under a controlled environment including humidity between 50%–70%, temperature of 25°C, and a 12-h light/dark cycle. All rats were subjected to overnight fasting with free access to water prior to the experiments. The animal protocols were approved by the Institution for Animal Care and Use Committee of Nantong University and followed the United States National Institutes of Health Guide for the Care and Use of Laboratory Animals (eighth edition).
The UPLC-MS/MS system comprised an Agilent 1290 series UPLC system (Agilent Technologies, CA, United States) and a SCIEX 5500 QTrap triple quadrupole/linear ion trap hybrid mass spectrometer outfitted with an electrospray ionization (ESI) source (Applied Biosystems/MDS Sciex, ON, Canada). Equipment control, data, and analysis were acquired and manipulated by the Analyst 1.6.2 software (Applied Biosystems/MDS Sciex, ON, Canada).
Chromatography was conducted on an Agilent Eclipse XDB-C18 column (5 μm, 4.6 × 150 mm) attached to a guard column, Agilent Eclipse XDB-C18 (5 μm, 4.6 × 12.5 mm). The temperature of the chromatographic column was kept at 30°C, and a 6-min isocratic elution program was conducted under aqueous phase A (10 mM ammonium acetate containing 0.35% acetic acid) and organic phase B (acetonitrile): 0–6 min (75% B). The flow rate was set as 0.3 mL/min, and 2 µL of analyte was injected into the analysis system. Mass spectrometry under ESI positive ion mode was conducted under the settings optimized as follows: nitrogen as the nebulizer gas, gas ion source 1 (50 psi), gas ion source 2 (50 psi), source temperature (350°C), and ion spray voltage (4000 V). Collision energy (CE), declustering potential (DP), collision exit potential (CXP), and entrance potential (EP) were optimized at 27, 160, 12, and 10 V for NDSM and 19, 103, 9, and 10 V for IS, respectively.
Quantitative detection was conducted based on multiple reaction monitoring (MRM) mode with parent-daughter ion transitions of m/z 316→239 for NDSM and m/z 172→128 for IS, respectively.
Stock solutions of NDSM (1 mg/mL) and IS (1 mg/mL) were prepared accurately in methanol and stored at −20°C. The standard working solutions (0.03, 0.1, 0.3, 1, 3, and 10 μg/mL) and QC solutions (0.06, 0.6, and 8 μg/mL) were acquired by serially diluting the stock solution of NDSM in methanol. The plasma standard samples (3, 10, 30, 100, 300, and 1000 ng/mL) used for the calibration curve were prepared by mixing 90 μL of blank rat plasma and 10 μL of standard working solutions. QC samples (6, 60, and 800 ng/mL, respectively) were prepared in the same way. The IS working solution was prepared in methanol to yield an ultimate concentration of 30 ng/mL.
Ethyl acetate was selected as the extractant for liquid-liquid extraction (LLE). First, 100 µL of plasma samples spiked with 10 µL of IS working solution and 10 µL of 1M NaOH were vortexed for 1 min to mix. Subsequently, 1000 µL of ethyl acetate were added in two batches, each swirled for 8 min, followed by being centrifuged at 10,000 rpm for 10 min. The supernatant was transferred into a new centrifuge tube and then dried under nitrogen stream with water bath at 30°C. The residue was redissolved with 110 µL of 75% acetonitrile/water and then was centrifuged (12,000 rpm for 12 min) again. Finally, 80 µL of the supernatant was moved into an autosampler vial for analysis.
To demonstrate the rationality of the UPLC-MS/MS method, the sensitivity, specificity, linearity, precision and accuracy, matrix effects, extraction recovery, and stability of NDSM in rat plasma were validated following the regulations and standards outlined by the Food and Drug Administration (FDA) in the United States (Kadian et al., 2016).
The chromatograms of mixed blank plasma from six different healthy rats and six replicated standard plasma samples at the lower limit of quantification (LLOQ) spiked with IS (at final concentration of 30 ng/mL) was compared to assess the specificity and sensitivity of this method. In addition, the in vivo plasma samples after an oral dosage of NDSM (20 mg/kg) were also detected to assess whether this method with validated LLOQ was sensitive enough to cover all the in vivo plasma samples.
In order to evaluate the linearity, six NDSM concentrations (3–1000 ng/mL) were calibrated and detected for six uninterrupted days. The linear equation was built up using least squares linear regression by plotting the peak area ratios of NDSM to IS on the ordinate (Y-axis) versus the concentration of NDSM on the abscissa (X-axis). Plasma samples spiked with NDSM at a final concentration of 3 ng/mL (LLOQ) represented the sensitivity of this method with the signal/noise (S/N) ≥ 10. The detection limit of NDSM was determined as 1 ng/mL (S/N ≥ 3).
To evaluate the precision and accuracy of the UPLC-MS/MS method, simulated plasma samples were analyzed at LLOQ and QC levels (3, 6, 60, and 800 ng/mL) with five replicates in each level on the same day and on three consecutive days, respectively. For LLOQ level, the precision (expressed as percent form of relative standard deviation, %RSD) must be within ±20%, and the accuracy (expressed as percent form of relative error, %RE) must be within ±20%. For QC levels, the precision should be within 15%, and the accuracy should range between −15% and 15%.
The extraction recovery was tested by comparing the peak areas of NDSM from the extracted QC samples with those from the extracted blank plasma samples spiked with standard solutions at equivalent QC levels (6, 60, and 800 ng/mL). The matrix effect was investigated by comparing the peak areas from the extracted blank plasma samples spiked with standard solutions to those from methanol standard solutions at equivalent QC levels (6, 60, and 800 ng/mL). All QC samples were run in five replicates. The evaluation method for matrix effect and recovery of IS (30 ng/mL) was consistent with NDSM.
The stability of NDSM in the biological matrix was analyzed at QC levels under various storage conditions: untreated samples preserved at room temperature for 6 h (short-term stability), or in the −20°C for 30 d (long-term stability), or after three freeze-thaw cycles from −20°C to 25°C (freeze-thaw stability), and processed samples in the 4°C autosampler for 24 h (autosampler stability). Five independent samples were prepared for each concentration, and the %RSD and %RE were calculated. The judgment that samples were stable could be made if the deviation between the measured concentration and the nominal concentration was within 15.0%.
Simulated plasma samples were prepared at a concentration of 2000 ng/mL, which was higher than the upper limit of quantification (ULOQ). The simulated plasma samples were diluted with blank rat plasma. The precision and accuracy of the diluted samples were not affected.
To evaluate the bioavailability and pharmacokinetic profiles of NDSM, the plasma concentration of NDSM was measured after a single oral or intravenous administration at different dose levels. Six groups of rats were allocated randomly, each consisting of six rats, three male and three female, by oral gavage (10, 20, 40 mg/kg) or intravenous injection (0.5, 1, 2 mg/kg), respectively. Blood samples (approximately 0.4 mL) were collected from the tail vein into anticoagulant tubes at 0.083, 0.167, 0.333, 0.75, 1, 2, 3, 4, 6, 8, 12, and 24 h after intragastric administration (i.g.), and at 0.033, 0.116, 0.25, 0.5, 0.75, 1, 1.5, 2, 4, 6, and 8 h after intravenous administration (i.v.). According to the results from the concentration-dependent time curves obtained from our preliminary experiment, we designed this blood collection schedule to include all the absorption, distribution, and elimination phases. During the blood collection, the internal blood volume of rats was maintained by intravenously injecting 1 mL of normal saline to rats every three sampling intervals. Blood samples were centrifuged at 4000 rpm for 10 min, and then plasma supernatants were stored at −20°C.
The pharmacokinetics parameters were calculated by the PKSolver software with a non-compartmental model (Zhang et al., 2010). The oral absolute bioavailability was calculated according to a previous report (Zheng et al., 2022). Statistical analyses were performed by one-way analysis of variance (ANOVA) followed by Tukey’s post hoc analysis using GraphPad Prism 8.4 Software (San Diego, CA).
In this study, metronidazole, which also has nitrogen-containing heterocycles, was selected as the IS to avoid the interference of NDSM metabolites. The quasi-molecular ion (Q1 scan mode) and the major product ion fragments (MS2 scan mode) of NDSM and IS were obtained by injecting their net standard solution in methanol into the mass spectrometer coupled with electrospray ion source (Figure 1). The MRM with the transitions at m/z of 316→239 and 172→128 were selected for quantification of NDSM and IS, respectively, owing to their good separation and better peak intensity. Better peak shape and suitable retention time were obtained while the mobile phase was 10 mM ammonium acetate containing 0.35% acetic acid and acetonitrile. The total running time was 6 min, which was relatively quick and could be suitable for the detection of a large number of samples.
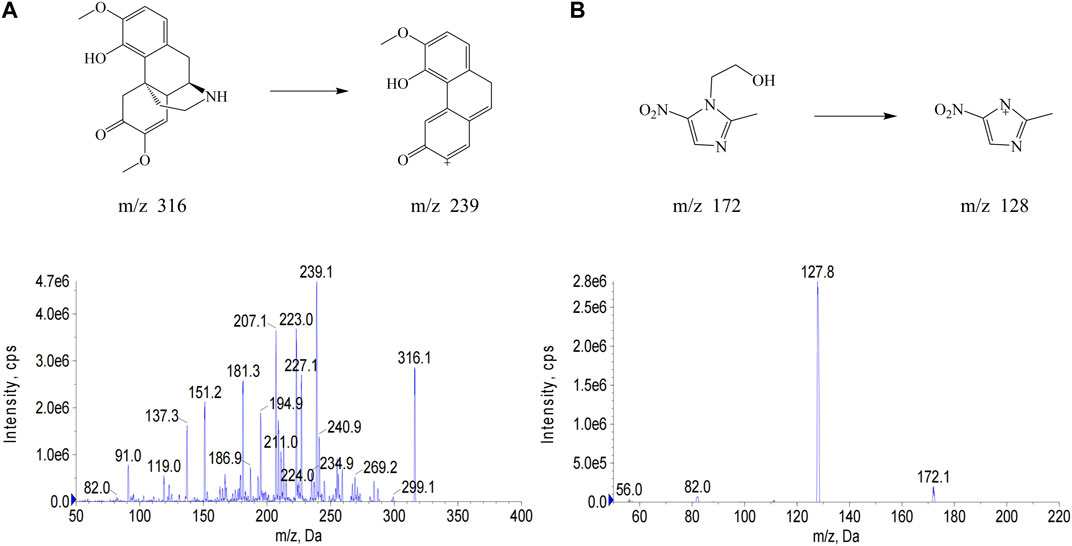
FIGURE 1. The chemical structure and full scan product ion mass spectra of N-demethylsinomenine (NDSM) (A) and the internal standard (IS) metronidazole (B) with monitoring at m/z 316→239 for NDSM and m/z 172→128 for IS.
Endogenous compounds present in the biological matrix, such as phospholipids, proteins, and salts, can co-elute with the target analytes, and can interfere with mass spectrometric ionization, leading to ion enhancement or suppression (Desfontaine et al., 2018). We compared protein precipitation methods with methanol or acetonitrile (Wawrzyniak et al., 2018), salting-out assisted liquid-liquid extraction with ammonium acetate (Li et al., 2021), liquid-liquid extraction with ethyl acetate (Bao et al., 2017; Kanu, 2021), and solid-phase extraction (SPE) with C18 column (Lin et al., 2021).
After protein precipitation by adding three times the volume of methanol or twice the volume of acetonitrile to the simulated plasma sample containing IS, the extraction recovery rates of NDSM were higher than 95%, but both showed obvious suppressive matrix effect (4.68%), which led to poor sensitivity and so could not meet the requirements.
SPE is one of the key technologies for purifying complex biological fluids that can achieve good matrix effects (Lin et al., 2021). Acetonitrile containing 0.35% acetic acid was chosen as the eluent for C18 SPE column (Welch, Shanghai, China) to improve the elution capacity. Under a vacuum solid-phase extraction device (Merck, United States), we found that slowing down the elution rate and increasing the elution capacity of eluent could be beneficial for improvement of recovery, but it still could not achieve good extraction recovery (<60%).
Liquid-liquid extraction is a simple method with excellent extraction performance. In recent years, water-soluble solvent-assisted LLE methods, in which salts or sugars rather than hydrophobic solvents are used to treat biological samples, have been developed (Zhang et al., 2009). However, corrosion and clogging of mass spectrometry equipment caused by salt or sugar crystallization cannot be ignored. Compared to nonvolatile salts such as phosphate, this experiment used mass spectrometry-friendly ammonium acetate salting out assisted liquid-liquid extraction, but it was not effective in improving the recovery and matrix effect.
Previous studies have indicated that the addition of NaOH to plasma samples can slightly enhance the recovery of alkaloids (Xu et al., 2013). In this paper, 10 µL or 20 µL of 1 M NaOH was added into 100 µL plasma samples plus 10 µL IS solution to yield the ultimate concentration of 0.083 M or 0.154 M NaOH, then under these cases the recovery rates and matrix effects of NDSM were measured and compared. Finally, the results showed that twice liquid-liquid extraction using ethyl acetate to extract solvent when the plasma sample contained about 0.083 M NaOH can simultaneously achieve great recovery rate (78.98%) with no obvious matrix effect (93.43%), which met the requirements of detection (Figure 2).
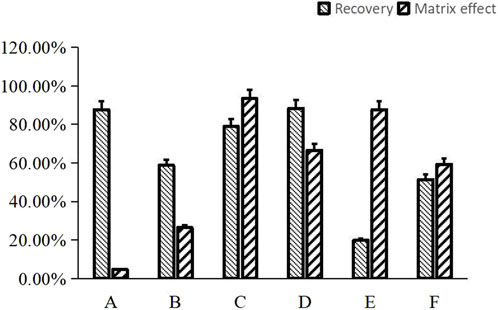
FIGURE 2. Comparison of the effect of different sample preparation approaches on matrix effect and recovery for NDSM. (A), protein precipitation with acetonitrile showed high recovery rate (87.65% ± 19.10%), but matrix effect (4.68% ± 0.14%) did not meet the requirements; (B), salting-out assisted liquid-liquid extraction with ammonium acetate showed poor recovery rate (58.75% ± 5.30%) and matrix effect (26.45% ± 3.07%); (C), liquid-liquid extraction with ultimate concentration of 0.083M NaOH and ethyl acetate met the requirements for recovery rate (78.98% ± 2.74%) and matrix effect (93.43% ± 6.32%); (D), liquid-liquid extraction with ultimate concentration of 0.154M NaOH and ethyl acetate exhibited high recovery rate (88.32% ± 5.42%), but the matrix effect (66.56% ± 1.88%) was not as good as method (C); (E), solid-phase extraction (SPE) of plasma sample anticoagulated by heparin exhibited low recovery rate (19.84% ± 1.65%); (F), SPE of plasma sample anticoagulated by EDTA showed higher recovery rate (51.40% ± 14.80%) than method (E) but still did not meet the standard.
The chromatograms of blank plasma, blank plasma spiked with NDSM at the LLOQ level and IS, and rat plasma samples after oral administration of NDSM (20 mg/kg) were demonstrated in Figure 3. No endogenous interference in the plasma was observed at the retention time of NDSM and IS, and the peak area of the blank signal recorded at abovementioned retention times was less than 5% that of NDSM (LLOQ level) and IS (30 ng/mL), showing good selectivity and specificity. So, the LLOQ was validated at 3 ng/mL, which was sensitive enough for the detection of the last time-point sample concentration.
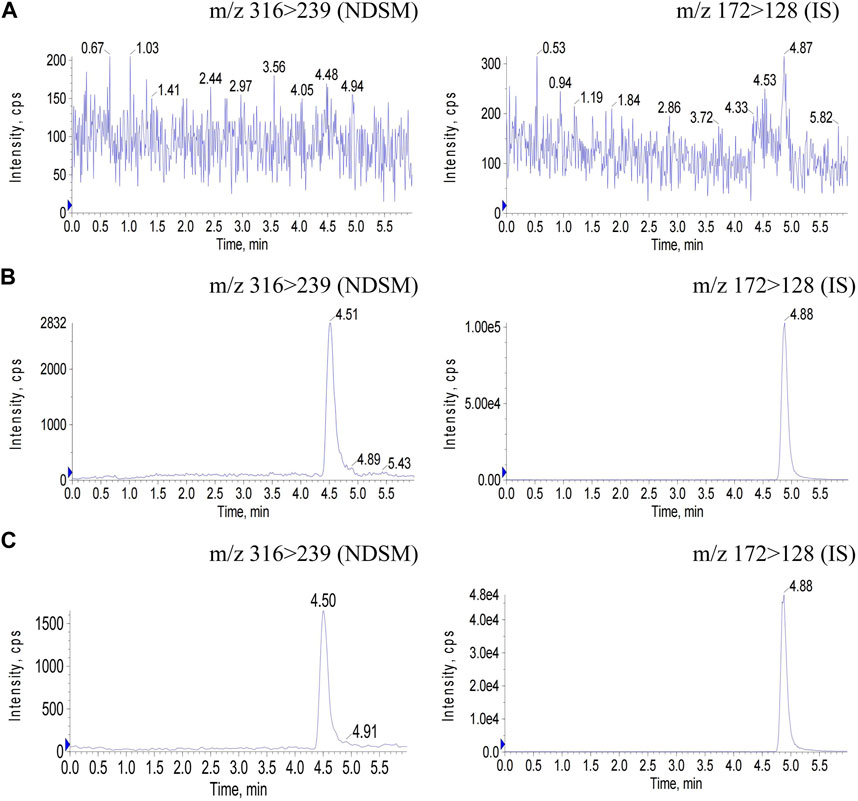
FIGURE 3. Chromatograms of NDSM (MRM 316/239) and IS (MRM 172/128) in rat plasma samples. (A) blank plasma sample; (B) blank plasma spiked with NDSM at the LLOQ level and IS; (C) plasma sample at 24 h after oral administration of NDSM (20 mg/kg). No interference peak in blank plasma samples was observed at the retention time of NDSM (4.5 min) and IS (4.8 min).
The standard curve exhibited superb linearity over the concentration range of 3–1000 ng/mL. The typical regression equation of the standard curve was Y = 0.00827X - 0.00652 (the correlation coefficient: 0.99955, weighting: 1/x).
Table 1 summarized the results of intra-day and inter-day precision and accuracy of NDSM at the LLOQ and QC sample levels. The precision was expressed by %RSD, and the accuracy was represented by %RE. Both the %RSD and %RE values were below 15%, suggesting the outcomes were satisfactory.
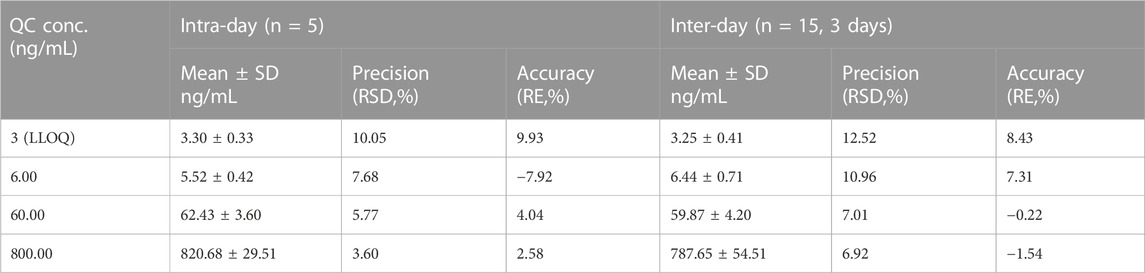
TABLE 1. Precision and accuracy of NDSM in rat plasma.
The matrix effect and extraction recovery for three QC samples of NDSM and IS were shown in Table 2. The findings demonstrated that the mean extraction recovery rate ranged from 73.55% to 81.88% for NDSM and was 94.19% for IS, suggesting that a high rate of extraction recovery was achieved. Importantly, the extraction efficiency was independent of concentration and the precision was 2.41%–7.59% for NDSM and 2.38% for IS, suggesting it was stable and reproducible. Meanwhile, the mean matrix effect ranged from 92.95% to 103.96% for NDSM and was 89.73% for IS, which suggested no notable matrix effect on the determination.
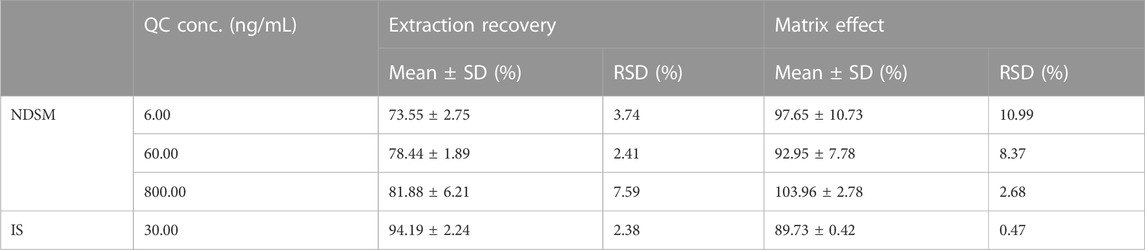
TABLE 2. Extraction recovery and matrix effect of NDSM (n = 5).
The stability of short-term, long-term, freeze-thaw, and autosampler conditions was shown in Table 3. The accuracy (%RE) and precision (%RSD) of the stabilities were well within the acceptable limit (±15%), suggesting that there are no obvious problems in stability under the test conditions.
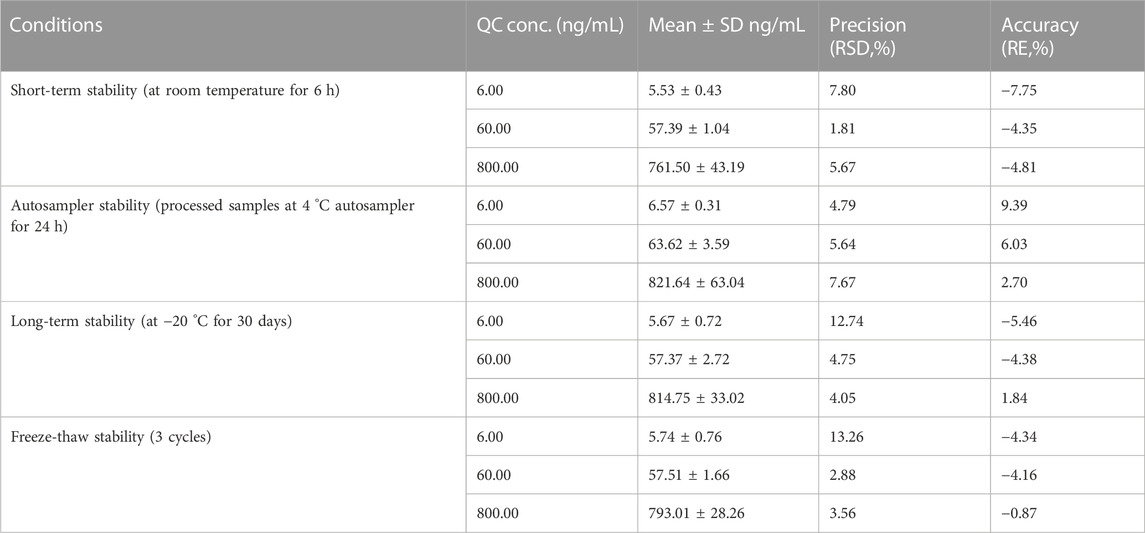
TABLE 3. Stability data of NDSM in rat plasma (n = 5).
The dilution integrity was measured when the plasma concentration of the in vivo sample was higher than the upper limit of quantification (ULOQ, 1000 ng/mL) of this method. The accuracy (%RE) and precision (%RSD) of the dilution integrity both were less than 15%, which met the requirements of quantitation. Furthermore, no obvious residue effect was observed when a blank sample was loaded after the calibration sample with the highest concentration.
The UPLC-MS/MS method was developed and applied to study the pharmacokinetics of NDSM after intragastric administration (i.g.) and intravenous administration (i.v.) in rats. In our previous reports, intraperitoneal injection (i.p.) of 20 mg/kg NDSM exhibited significant antinociceptive effects against postoperative pain (Ou et al., 2018) and neuropathic pain (Zhou et al., 2021). In this study, three dosage levels of 10, 20, and 40 mg/kg were selected for i. g. administration. In a preliminary study, we found that the plasma concentration of many in vivo samples exceeded ULOQ (1000 ng/mL) if intravenous dosage was higher than 2 mg/kg. Thus, we chose three dosage levels at 0.5, 1, and 2 mg/kg for intravenous pharmacokinetic study.
Figure 4 presented the average plasma concentration-time profiles and Table 4 summarized the main pharmacokinetic parameters of the non-compartment model for NDSM. In these concentration-time curves, the ratio of AUC0-t to AUC0-∞ was greater than 90% and the concentration of the last time point sample was under 1/10 of Cmax, denoting that sampling schedule was appropriate and AUC0-∞ was reliable.
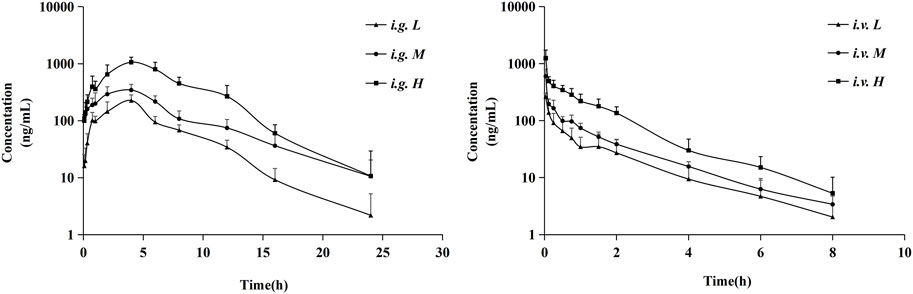
FIGURE 4. Mean plasma concentration profiles of NDSM after oral administration of 10 mg/kg (i.g. L), 20 mg/kg (i.g. M), and 40 mg/kg (i.g. H) and intravenous administration of 0.5 mg/kg (i.v. L), 1 mg/kg (i.v. M), and 2 mg/kg (i.v. H) (mean ± SD, n = 6). More details can be obtained in Table 4.
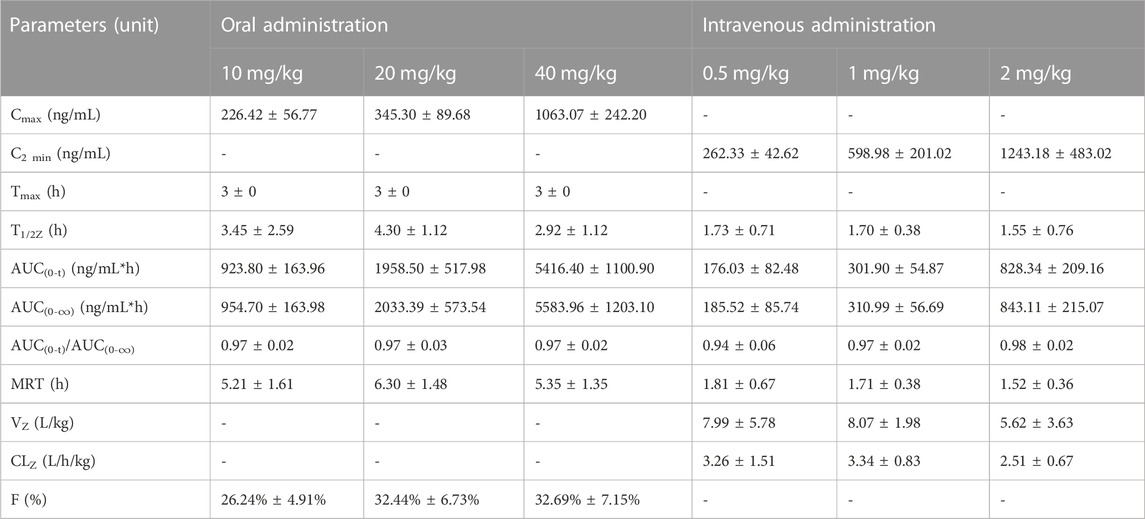
TABLE 4. The estimated mean pharmacokinetic parameters of NDSM after oral or intravenous administration (mean ± SD, n = 6).
The pharmacokinetic profiles after i. v. administration at dosage of 0.5, 1, and 2 mg/kg showed similar average elimination half-life (T1/2Z of 1.55–1.73 h), mean residence time (MRT of 1.52–1.81 h), volume of distribution (VZ of 5.62–8.07 L/kg), and systemic clearance (CLZ of 2.51–3.34 L/kg/h), which had no significant differences between different dosage levels (p > 0.05). Similarly, the average elimination half-life (T1/2Z of 2.92–4.23 h) and mean residence time (MRT of 5.21–6.30 h) of the pharmacokinetic curves after oral administration of 10, 20, and 40 mg/kg also had no significant differences between different dosage levels (p > 0.05). We also analyzed the relationship of AUC from zero time to infinite (AUC0-∞) versus dose after intravenous and oral administration by linear regression analysis using GraphPad Prism 8.4 Software. As shown in Figure 5, results showed that the regression equation of AUC versus dose for intravenous administration was Y = 451.8X - 80.54 (r2 = 0.9768, p = 0.0973), as well as Y = 157.6X - 820.6 (r2 = 0.9768, p = 0.0693) for oral administration. According to the correlation coefficients (r2) > 0.95 and the associated values of p > 0.05, it indicated a linear relationship between AUC and dose (Srinivas NR., 2015). These results indicated that the half-life of NDSM was independent of the dosage and did not extend with the increase of the dosage, while AUC0-∞ increased in proportion to the dose, suggesting that the elimination of NDSM was rapid and consistent with the linear kinetic characteristics.
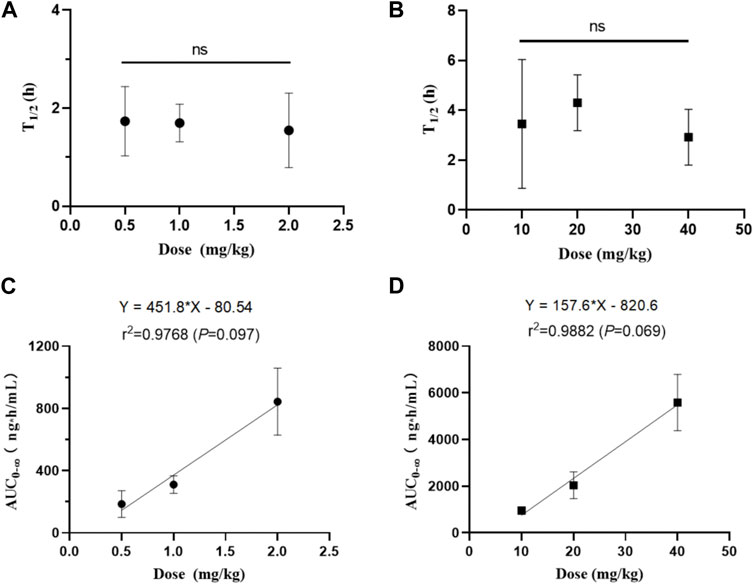
FIGURE 5. The relationship between half-life (T1/2z) and dose of NDSM after single intravenous (A) and oral administration (B), and the relationship between the area under the plasma concentration-time curve (AUC) and dose of NDSM after single intravenous (C) and oral administration (D) (mean ± SD, n = 6). The word “ns” indicated no differences for the half-life among the three dose levels (p > 0.05). The regression equation of AUC from zero to infinite (AUC0-∞) versus dose was Y = 451.8X - 80.54 (r2 = 0.9768, p = 0.0973) for intravenous administration, and Y = 157.6X - 820.6 (r2 = 0.9768, p = 0.0693) for oral administration. These results indicated that the half-life of NDSM was independent of the dosage and did not extend with the increase of the dosage, while AUC0-∞ increased in proportion to the dose.
The volume of distribution (VZ of 5.62–8.07 L/kg) far exceeding the total body fluid volume (0.6 L/kg) of rats (Zheng et al., 2022) demonstrated that the tissue distribution and extravascular uptake of NDSM was extensive. The total clearance (CLZ of 2.51–3.34 L/kg/h) of NDSM was close to the rat hepatic flow velocity (3.3 L/kg/h) (Zheng et al., 2022), suggesting a quick clearance rate in rats.
The oral absolute bioavailability of 10, 20, and 40 mg/kg NDSM was calculated as 26.24% ± 4.91%, 32.44% ± 6.73%, and 32.69% ± 7.15%, respectively. The mean oral absolute bioavailability of NDSM was 30.46%, suggesting its suboptimal oral absorption. Additionally, NDSM showed a consistent time for peak plasma concentration (Tmax) of 3 h after oral administration at the abovementioned three dosage levels. The oral half-life of NDSM (2.92–4.23 h) is longer than that of intravenous injection (1.55–1.73 h), which may be tentatively explained by the deconjugation of NDSM glucuronide through the enterohepatic circulation (Ohtani et al., 1994). In a previous study, the Tmax, T1/2 and oral bioavailability of rats after a single oral administration of 90 mg/kg sinomenine were 0.66h, 5.5h, and 79.6%, respectively, which demonstrated that sinomenine has fast oral absorption and high oral bioavailability (Liu et al., 2005a). Based on the longer half-life, a single oral administration of sinomenine (150 mg/kg) can maintain the effective drug concentration in rat plasma for a long time, but many adverse reactions were observed around 60 min after drug administration (Liu et al., 2005b). The studies on the metabolism and excretion of sinomenine found that sinomenine experienced phase I biotransformation and active hepatobiliary excretion, which was mainly regulated by P-glycoprotein (Tsai and Wu, 2003). NDSM, a phase I metabolite of sinomenine in urine, had a longer Tmax (3 h) and a shorter T1/2Z (2.92–4.23 h) than sinomenine after oral administration. Furthermore, the oral bioavailability of NDSM was less than half that of sinomenine. These changes may be due to the fact that the polarity and hydrophilicity was enhanced when sinomenine was metabolized to be NDSM. It was reported that sinomenine could not be transformed to demethylated metabolites by intestinal microbes in vitro due to its benzazepine structure (He et al., 2017). Whether the transmembrane absorption of NDSM in the stomach is less than that of sinomenine needs further investigation.
In addition, no gender differences were found in rats after intravenous or oral administration of NDSM (see Supplementary Tables S2–S7).
In this study, for the first time we have reported a rapid, simple, and sensitive UPLC-MS/MS method for the quantification of N-demethylsinomenine (NDSM) in rat plasma. Metronidazole was selected as IS to avoid confusion with potential metabolites and analogues of NDSM, improving the confidence of the assay. The method has a good linear relationship in the concentration range of 3–1000 ng/mL, while the LLOQ is 3 ng/mL. The method also meets the requirements in precision, accuracy, selectivity, and stability. The recovery rate and matrix effect can be satisfied by LLE with ethyl acetate twice. The method has been successfully applied to the preclinical pharmacokinetic study of NDSM in rats. By comparing AUC data from oral and intravenous administration, the mean oral absolute bioavailability of NDSM is determined as 30.46%. The current results provide useful data for further development of NDSM as a potential clinical candidate for the management of chronic pain.
The raw data supporting the conclusion of this article will be made available by the authors, without undue reservation.
The animal study was reviewed and approved by the Institutional Animal Care and Use Committee of Nantong University (protocol code S20200323-191 and date of approval is 10 March 2020).
Conceptualization, QZ; data curation, LY, XQ, and YF; formal analysis, LY, XQ, and QZ; funding acquisition, QZ, J-XL, and J-JL; investigation, LY, XQ, and YF; methodology, LY, XQ, YF, YY, X-DZ, QW, and LW; project administration, QZ; resources, J-JL; software, WR; supervision, J-XL; validation, J-JL, WR, and J-XL; writing—original draft, LY; writing—review and editing, QZ. All authors contributed to the article and approved the submitted version.
This research was funded by the National Natural Science Foundation of China (Grant Number: 82071238, 81971243), the Natural Science Foundation of Jiangsu Province (Grant Number: BK20181459), the Provincial and Ministerial High-level Science and Technology Project Cultivation Fund (Grant Number: YPYJJYB009), the Scientific Research Foundation of Nantong Municipal Health Commission (Grant Number: MS2022013), and the Postgraduate Research and Practice Innovation Program of Jiangsu Province (Grant Number: KYCX21_3131, KYCX21_3096).
We acknowledge the technical support provided by Mrs Fan Susu from Analytical Testing Center of Nantong university. Institutional Review Board Statement: The animal study protocol was approved by the Institutional Animal Care and Use Committee of Nantong University (protocol code S20200323-191 and date of approval is 10 March 2020).
The authors declare that the research was conducted in the absence of any commercial or financial relationships that could be construed as a potential conflict of interest.
All claims expressed in this article are solely those of the authors and do not necessarily represent those of their affiliated organizations, or those of the publisher, the editors and the reviewers. Any product that may be evaluated in this article, or claim that may be made by its manufacturer, is not guaranteed or endorsed by the publisher.
The Supplementary Material for this article can be found online at: https://www.frontiersin.org/articles/10.3389/fchem.2023.1222560/full#supplementary-material
Attal, N., Bouhassira, D., and Baron, R. (2018). Diagnosis and assessment of neuropathic pain through questionnaires. Lancet Neurol. 17 (5), 456–466. doi:10.1016/S1474-4422(18)30071-1
Bao, B. H., Kang, A., Zhao, Y., Shen, Q., Li, J. S., Di, L. Q., et al. (2017). A selective HPLC-MS/MS method for quantification of SND-117 in rat plasma and its application to a pharmacokinetic study. J. Chromatogr. B Anal. Technol. Biomed. Life Sci. 1052, 60–65. doi:10.1016/j.jchromb.2017.03.008
Cheng, W. M., Qiu, F., and Yao, X. S. (2007). Three major urinary metabolites of sinomenine in rats. J. Asian Nat. Prod. Res. 9 (1), 13–18. doi:10.1080/10286020500289444
Desfontaine, V., Capetti, F., Nicoli, R., Kuuranne, T., Veuthey, J. L., and Guillarme, D. (2018). Systematic evaluation of matrix effects in supercritical fluid chromatography versus liquid chromatography coupled to mass spectrometry for biological samples. J. Chromatogr. B Anal. Technol. Biomed. Life Sci. 1079, 51–61. doi:10.1016/j.jchromb.2018.01.037
Gao, T., Hao, J., Wiesenfeld-Hallin, Z., Wang, D. Q., and Xu, X. J. (2013). Analgesic effect of sinomenine in rodents after inflammation and nerve injury. Eur. J. Pharmacol. 721 (1-3), 5–11. doi:10.1016/j.ejphar.2013.09.062
Gao, T., Shi, T., Wang, D. Q., Wiesenfeld-Hallin, Z., and Xu, X. J. (2014). Repeated sinomenine administration alleviates chronic neuropathic pain-like behaviours in rodents without producing tolerance. Scand. J. Pain 5 (4), 249–255. doi:10.1016/j.sjpain.2014.05.006
Harirforoosh, S., Asghar, W., and Jamali, F. (2013). Adverse effects of nonsteroidal antiinflammatory drugs: An update of gastrointestinal, cardiovascular and renal complications. J. Pharm. Pharm. Sci. 16 (5), 821–847. doi:10.18433/j3vw2f
He, C. Y., Fu, J., Shou, J. W., Zhao, Z. X., Ren, L., Wang, Y., et al. (2017). In vitro study of the metabolic characteristics of eight isoquinoline alkaloids from natural plants in rat gut microbiota. Molecules 22 (6), 932. doi:10.3390/molecules22060932
Hylands-White, N., Duarte, R. V., and Raphael, J. H. (2017). An overview of treatment approaches for chronic pain management. Rheumatol. Int. 37 (1), 29–42. doi:10.1007/s00296-016-3481-8
Kadian, N., Raju, K. S., Rashid, M., Malik, M. Y., Taneja, I., and Wahajuddin, M. (2016). Comparative assessment of bioanalytical method validation guidelines for pharmaceutical industry. J. Pharm. Biomed. Anal. 126, 83–97. doi:10.1016/j.jpba.2016.03.052
Kanu, A. B. (2021). Recent developments in sample preparation techniques combined with high-performance liquid chromatography: A critical review. J. Chromatogr. A 1654, 462444. doi:10.1016/j.chroma.2021.462444
Li, M., Wang, H., Huan, X., Cao, N., Guan, H., Zhang, H., et al. (2021). Simultaneous LC-MS/MS bioanalysis of alkaloids, terpenoids, and flavonoids in rat plasma through salting-out-assisted liquid-liquid extraction after oral administration of extract from tetradium ruticarpum and Glycyrrhiza uralensis: A sample preparation strategy to broaden analyte coverage of herbal medicines. Anal. Bioanal. Chem. 413 (23), 5871–5884. doi:10.1007/s00216-021-03568-1
Lin, H., Chen, X., Ma, J., Zhang, X., Li, T., Zhang, Y., et al. (2021). Determination of propofol in human plasma with C18 pipette-tip based solid-phase extraction followed by liquid chromatography atmospheric-pressure chemical ionization tandem mass spectrometry analysis. J. Pharm. Biomed. Anal. 193, 113714. doi:10.1016/j.jpba.2020.113714
Liu, Z. Q., Chan, K., Zhou, H., Jiang, Z. H., Wong, Y. F., Xu, H. X., et al. (2005a). The pharmacokinetics and tissue distribution of sinomenine in rats and its protein binding ability in vitro. Life Sci. 77 (25), 3197–3209. doi:10.1016/j.lfs.2005.05.054
Liu, Z. Q., Zhou, H., Liu, L., Jiang, Z. H., Wong, Y. F., Xie, Y., et al. (2005b). Influence of co-administrated sinomenine on pharmacokinetic fate of paeoniflorin in unrestrained conscious rats. J. Ethnopharmacol. 99 (1), 61–67. doi:10.1016/j.jep.2005.01.052
Ohtani, M., Kotaki, H., Uchino, K., Sawada, Y., and Iga, T. (1994). Pharmacokinetic analysis of enterohepatic circulation of buprenorphine and its active metabolite, norbuprenorphine, in rats. Drug Metab. Dispos. 22 (1), 2–7.
Ou, Y., Su, M., Ling, Y., Wei, Q., Pan, F., Li, J., et al. (2018). Anti-allodynic effects of N-demethylsinomenine, an active metabolite of sinomenine, in a mouse model of postoperative pain. Eur. J. Pharmacol. 823, 105–109. doi:10.1016/j.ejphar.2018.01.044
Pertovaara, A. (2014). Sinomenine against neuropathic pain hypersensitivity. Scand. J. Pain 5 (4), 248. doi:10.1016/j.sjpain.2014.08.002
Singh, S. S. (2006). Preclinical pharmacokinetics: An approach towards safer and efficacious drugs. Curr. Drug Metab. 7 (2), 165–182. doi:10.2174/138920006775541552
Srinivas, N. R. (2015). Therapeutic drug monitoring of cyclosporine and area under the curve prediction using a single time point strategy: Appraisal using peak concentration data. Biopharm. Drug Dispos. 36 (9), 575–586. doi:10.1002/bdd.1967
Szigethy, E., Knisely, M., and Drossman, D. (2018). Opioid misuse in gastroenterology and non-opioid management of abdominal pain. Nat. Rev. Gastroenterol. Hepatol. 15 (3), 168–180. doi:10.1038/nrgastro.2017.141
Treede, R. D., Rief, W., Barke, A., Aziz, Q., Bennett, M. I., Benoliel, R., et al. (2019). Chronic pain as a symptom or a disease: The IASP classification of chronic pain for the international classification of diseases (ICD-11). Pain 160 (1), 19–27. doi:10.1097/j.pain.0000000000001384
Tsai, T. H., and Wu, J. W. (2003). Regulation of hepatobiliary excretion of sinomenine by P-glycoprotein in Sprague-Dawley rats. Life Sci. 72 (21), 2413–2426. doi:10.1016/s0024-3205(03)00118-8
Wawrzyniak, R., Kosnowska, A., Macioszek, S., Bartoszewski, R., and Jan, M. M. (2018). New plasma preparation approach to enrich metabolome coverage in untargeted metabolomics: Plasma protein bound hydrophobic metabolite release with proteinase K. Sci. Rep. 8 (1), 9541. doi:10.1038/s41598-018-27983-0
Xu, H., Li, Q., Yin, Y., Lv, C., Sun, W., He, B., et al. (2013). Simultaneous determination of three alkaloids, four ginsenosides and limonin in the plasma of normal and headache rats after oral administration of Wu-Zhu-Yu decoction by a novel ultra fast liquid chromatography-tandem mass spectrometry method: applicatio: Application of 4000Qtrap MS/MS system. J. Mass Spectrom. 48 (4), 519–532. doi:10.1002/jms.3183
Yi, L., Liang, Z. T., Peng, Y., Yao, X., Chen, H. B., and Zhao, Z. Z. (2012). Tissue-specific metabolite profiling of alkaloids in Sinomenii Caulis using laser microdissection and liquid chromatography-quadrupole/time of flight-mass spectrometry. J. Chromatogr. A 1248, 93–103. doi:10.1016/j.chroma.2012.05.058
Zhang, J., Wu, H., Kim, E., and El-Shourbagy, T. A. (2009). Salting-out assisted liquid/liquid extraction with acetonitrile: A new high throughput sample preparation technique for good laboratory practice bioanalysis using liquid chromatography-mass spectrometry. Biomed. Chromatogr. 23 (4), 419–425. doi:10.1002/bmc.1135
Zhang, Y., Huo, M., Zhou, J., and Xie, S. (2010). PKSolver: An add-in program for pharmacokinetic and pharmacodynamic data analysis in Microsoft Excel. Comput. Methods Programs Biomed. 99 (3), 306–314. doi:10.1016/j.cmpb.2010.01.007
Zhang, Y. S., Han, J. Y., Iqbal, O., and Liang, A. H. (2018). Research advances and prospects on mechanism of sinomenin on histamine release and the binding to histamine receptors. Int. J. Mol. Sci. 20 (1), 70. doi:10.3390/ijms20010070
Zhao, X. X., Peng, C., Zhang, H., and Qin, L. P. (2012). Sinomenium acutum: A review of chemistry, pharmacology, pharmacokinetics, and clinical use. Pharm. Biol. 50 (8), 1053–1061. doi:10.3109/13880209.2012.656847
Zheng, M. C., Tang, W. T., Yu, L. L., Qian, X. J., Ren, J., Li, J. J., et al. (2022). Preclinical pharmacokinetics and bioavailability of oxypeucedanin in rats after single intravenous and oral administration. Molecules 27 (11), 3570. doi:10.3390/molecules27113570
Zhou, Z., Qiu, N., Ou, Y., Wei, Q., Tang, W., Zheng, M., et al. (2021). N-Demethylsinomenine, an active metabolite of sinomenine, attenuates chronic neuropathic and inflammatory pain in mice. Sci. Rep. 11 (1), 9300. doi:10.1038/s41598-021-88521-z
Keywords: pharmacokinetics, bioavailability, N-demethylsinomenine, UPLC-MS/MS, rats
Citation: Yu L, Qian X, Feng Y, Yin Y, Zhang X-D, Wei Q, Wang L, Rong W, Li J-J, Li J-X and Zhu Q (2023) Investigation of preclinical pharmacokinetics of N-demethylsinomenine, a potential novel analgesic candidate, using an UPLC-MS/MS quantification method. Front. Chem. 11:1222560. doi: 10.3389/fchem.2023.1222560
Received: 14 May 2023; Accepted: 27 June 2023;
Published: 06 July 2023.
Edited by:
Peter Rose, University of Nottingham, United KingdomReviewed by:
Jing Cheng, Envista, United StatesCopyright © 2023 Yu, Qian, Feng, Yin, Zhang, Wei, Wang, Rong, Li, Li and Zhu. This is an open-access article distributed under the terms of the Creative Commons Attribution License (CC BY). The use, distribution or reproduction in other forums is permitted, provided the original author(s) and the copyright owner(s) are credited and that the original publication in this journal is cited, in accordance with accepted academic practice. No use, distribution or reproduction is permitted which does not comply with these terms.
*Correspondence: Jun-Xu Li, anVueHVsaUBnbWFpbC5jb20=; Qing Zhu, emh1cWluZ0BudHUuZWR1LmNu
†These authors have contributed equally to this work and share first authorship
Disclaimer: All claims expressed in this article are solely those of the authors and do not necessarily represent those of their affiliated organizations, or those of the publisher, the editors and the reviewers. Any product that may be evaluated in this article or claim that may be made by its manufacturer is not guaranteed or endorsed by the publisher.
Research integrity at Frontiers
Learn more about the work of our research integrity team to safeguard the quality of each article we publish.